- 1Urban and Rural Planning Research Center, Linyi Bureau of Natural Resources and Planning, Linyi, China
- 2School of Civil and Architectural Engineering, Linyi University, Linyi, China
- 3State Key Laboratory of Resources and Environmental Information System, Institute of Geographic Sciences and Natural Resources Research, Chinese Academy of Sciences, Beijing, China
- 4Institute of Agricultural Information and Economics, Shandong Academy of Agricultural Sciences, Jinan, China
- 5School of Environmental Science and Engineering, Tianjin University, Tianjin, China
- 6School of Management, Shandong University, Jinan, China
- 7School of Remote Sensing and Information Engineering, Wuhan University, Wuhan, China
Understanding the cooling effect (CE) of urban parks is vital to mitigate the urban heat islands. ECOsystem Spaceborne Thermal Radiometer Experiment on Space Station (ECOSTRESS) land surface temperature data (LST) data were used to construct diurnal thermal variations to explore the CE of urban parks in the fifth ring regions of Beijing. Local climate zone (LCZ) classification was used to distinguish different parks for examining the internal CE of parks. New subclasses of LCZ (e.g., LCZAG, LCZBG, LCZCG) were created based on the basic subclasses, such as LCZA (mainly consist of dense trees), LCZB (scattered tress with dense bush), LCZC (scattered bush), and LCZG (water). The external CE of parks was evaluated in different directions, and the impacts of buildings around parks on the external CE were also analyzed. The results showed that urban parks tended to heat up slower than the whole urban regions during the daytime, and water releasing energy dominated the mean LST of parks at night. Large parks meeting the minimum area (40,000 m2) of LCZ had better CE inside each park during the daytime. Three hundred thirty four large parks were divided into six types of LCZ. The strength of the CE decrease with the increases of distance, and seemed to exist at a distance of up to 150–200 m. Such impacts of parks were insignificant at night. In addition, parks containing certain dense trees and water had better CE inside and out. The height and density of buildings had a relatively obvious impact on the CE of parks. This study can provide insight into the impacts of urban parks on the urban thermal environment and promote the CE of urban parks in future urban planning.
Introduction
Rapid urbanization, landscapes changing, growth of urban residents, and anthropogenic activities increased, have a significant influence on the local climate, leading to urban heat islands (UHI) effects (Oke, 1982; Mackey et al., 2012; Buo et al., 2021). Inevitably, the effects seriously threaten the quality and health of residents, and the negative effects will be exacerbated in the future under the context of urbanization and global warming (Yang et al., 2021b; You et al., 2021). It is provided that there is localized interplay between heat waves and UHI (He et al., 2020). The urban heat wave has become an important issue in China for environmental, ecosystem, social, health consequences, and economic impacts (He et al., 2022). Therefore, how to mitigate the UHI effects and provide a comfortable living environment for residents has drawn the attention of urban planners (Qiao et al., 2019; Maharjan et al., 2021).
Urban parks, which consist of forests, grasslands, and water bodies, have been regarded as a promising method to mitigate the UHI effects with 1∼7°C lower temperature distributed in and around parks (Xu et al., 2017; Yan et al., 2018; Yao et al., 2022). Many previous studies have investigated the cooling effect (CE) of parks, and noted that the size and shape of the park can effectively affect the CE of parks (Chang and Li, 2014; Cheng et al., 2015, 2019; Dai et al., 2018). Importantly, the CE of parks is influenced by landscape compositions and configurations inside and around parks (Xu et al., 2018; Han et al., 2020; Gao et al., 2022). For interior conditions, it is widely accepted that landscapes of parks, such as forests and grasslands, can take away some heat because of their evaporation and evapotranspiration (Li et al., 2021; Lin et al., 2021; Yang et al., 2021a). A series of landscape composition and configuration metrics, such as percentage of landscape (PLAND), landscape shape index (LSI), and aggregation index (AI), were widely used to investigate the relationship between landscapes and land surface temperature (LST) (Peng et al., 2021; Qin et al., 2021; Yu et al., 2022). Furthermore, the characteristics of the area around the park, such as impervious surface and road, had a significant influence on the CE of parks (Feng and Myint, 2016; Lin et al., 2021; Luo et al., 2021).
However, there are only a few studies evaluating the CE among different urban parks. Previous studies considered the parks as a whole, or analyzed UHI based on urban green space containing urban parks as a whole (Chang et al., 2021). It’s important to note that the characteristics of different vegetation (e.g., tree and bush) and water have a huge difference (e.g., heat capacity and reflectivity) (Chen et al., 2015; Kong et al., 2021; Yang et al., 2020, 2021c). It is necessary to consider the types of parks in the research of the CE (Zhu et al., 2021). LCZ derived from logical division of the landscape (Stewart, 2011), can be used to overcome the limitations of the “urban-rural” dichotomy and to further investigate the impacts of park forms on the CE at local scales (Stewart and Oke, 2012; Yang et al., 2019; Wu et al., 2020). The urban landscapes can be divided into seven basic land cover types with considering their interior and external landscape composition and configuration metrics (Stewart and Oke, 2012). Furthermore, LCZ can divide landscapes into new types based on the surface cover, structure, material, and human activity, which provides a possibility for exploring the different spatial formation of urban landscapes at smaller scales (Stewart and Oke, 2012). To quickly and precisely determine types of parks, a machine learning algorithm based on the deep residual network, which has been widely used for classification, will be applied to this study (He et al., 2016). Additionally, the surrounding conditions of the parks are complicated, and the impacts of surrounding buildings (two- and three-dimensional perspectives) on the CE of parks are still less understood (Qiao et al., 2020; Amani-Beni et al., 2021; Chen et al., 2022). The precise building data, including building footprints and height, make it possible to explore the impacts of surrounding buildings on the CE of parks (Yang et al., 2018). LCZ is not used to classify the regions around urban parks in this study. Because the thermal climate is spatially continuous (Stewart and Oke, 2012), the buildings closer to the parks are possible to have stronger impacts on the CE of parks.
The study aims to investigate the CE of parks and the impacts of surrounding buildings on them. The objects of this study were (1) to determine park types using basic LCZ subclasses and new subcalsses created with considering the impacts of water (e.g., LCZ-A, AG, B, BG, C, and CG); (2) to investigate the CE of parks at different times among different types of parks; and (3) to explore the impacts of surrounding buildings on CE of different types of parks. This study provides scientific guidance to urban planners on how to optimize the design of parks and provides a basis for improving the CE of parks.
Materials and methods
Study area
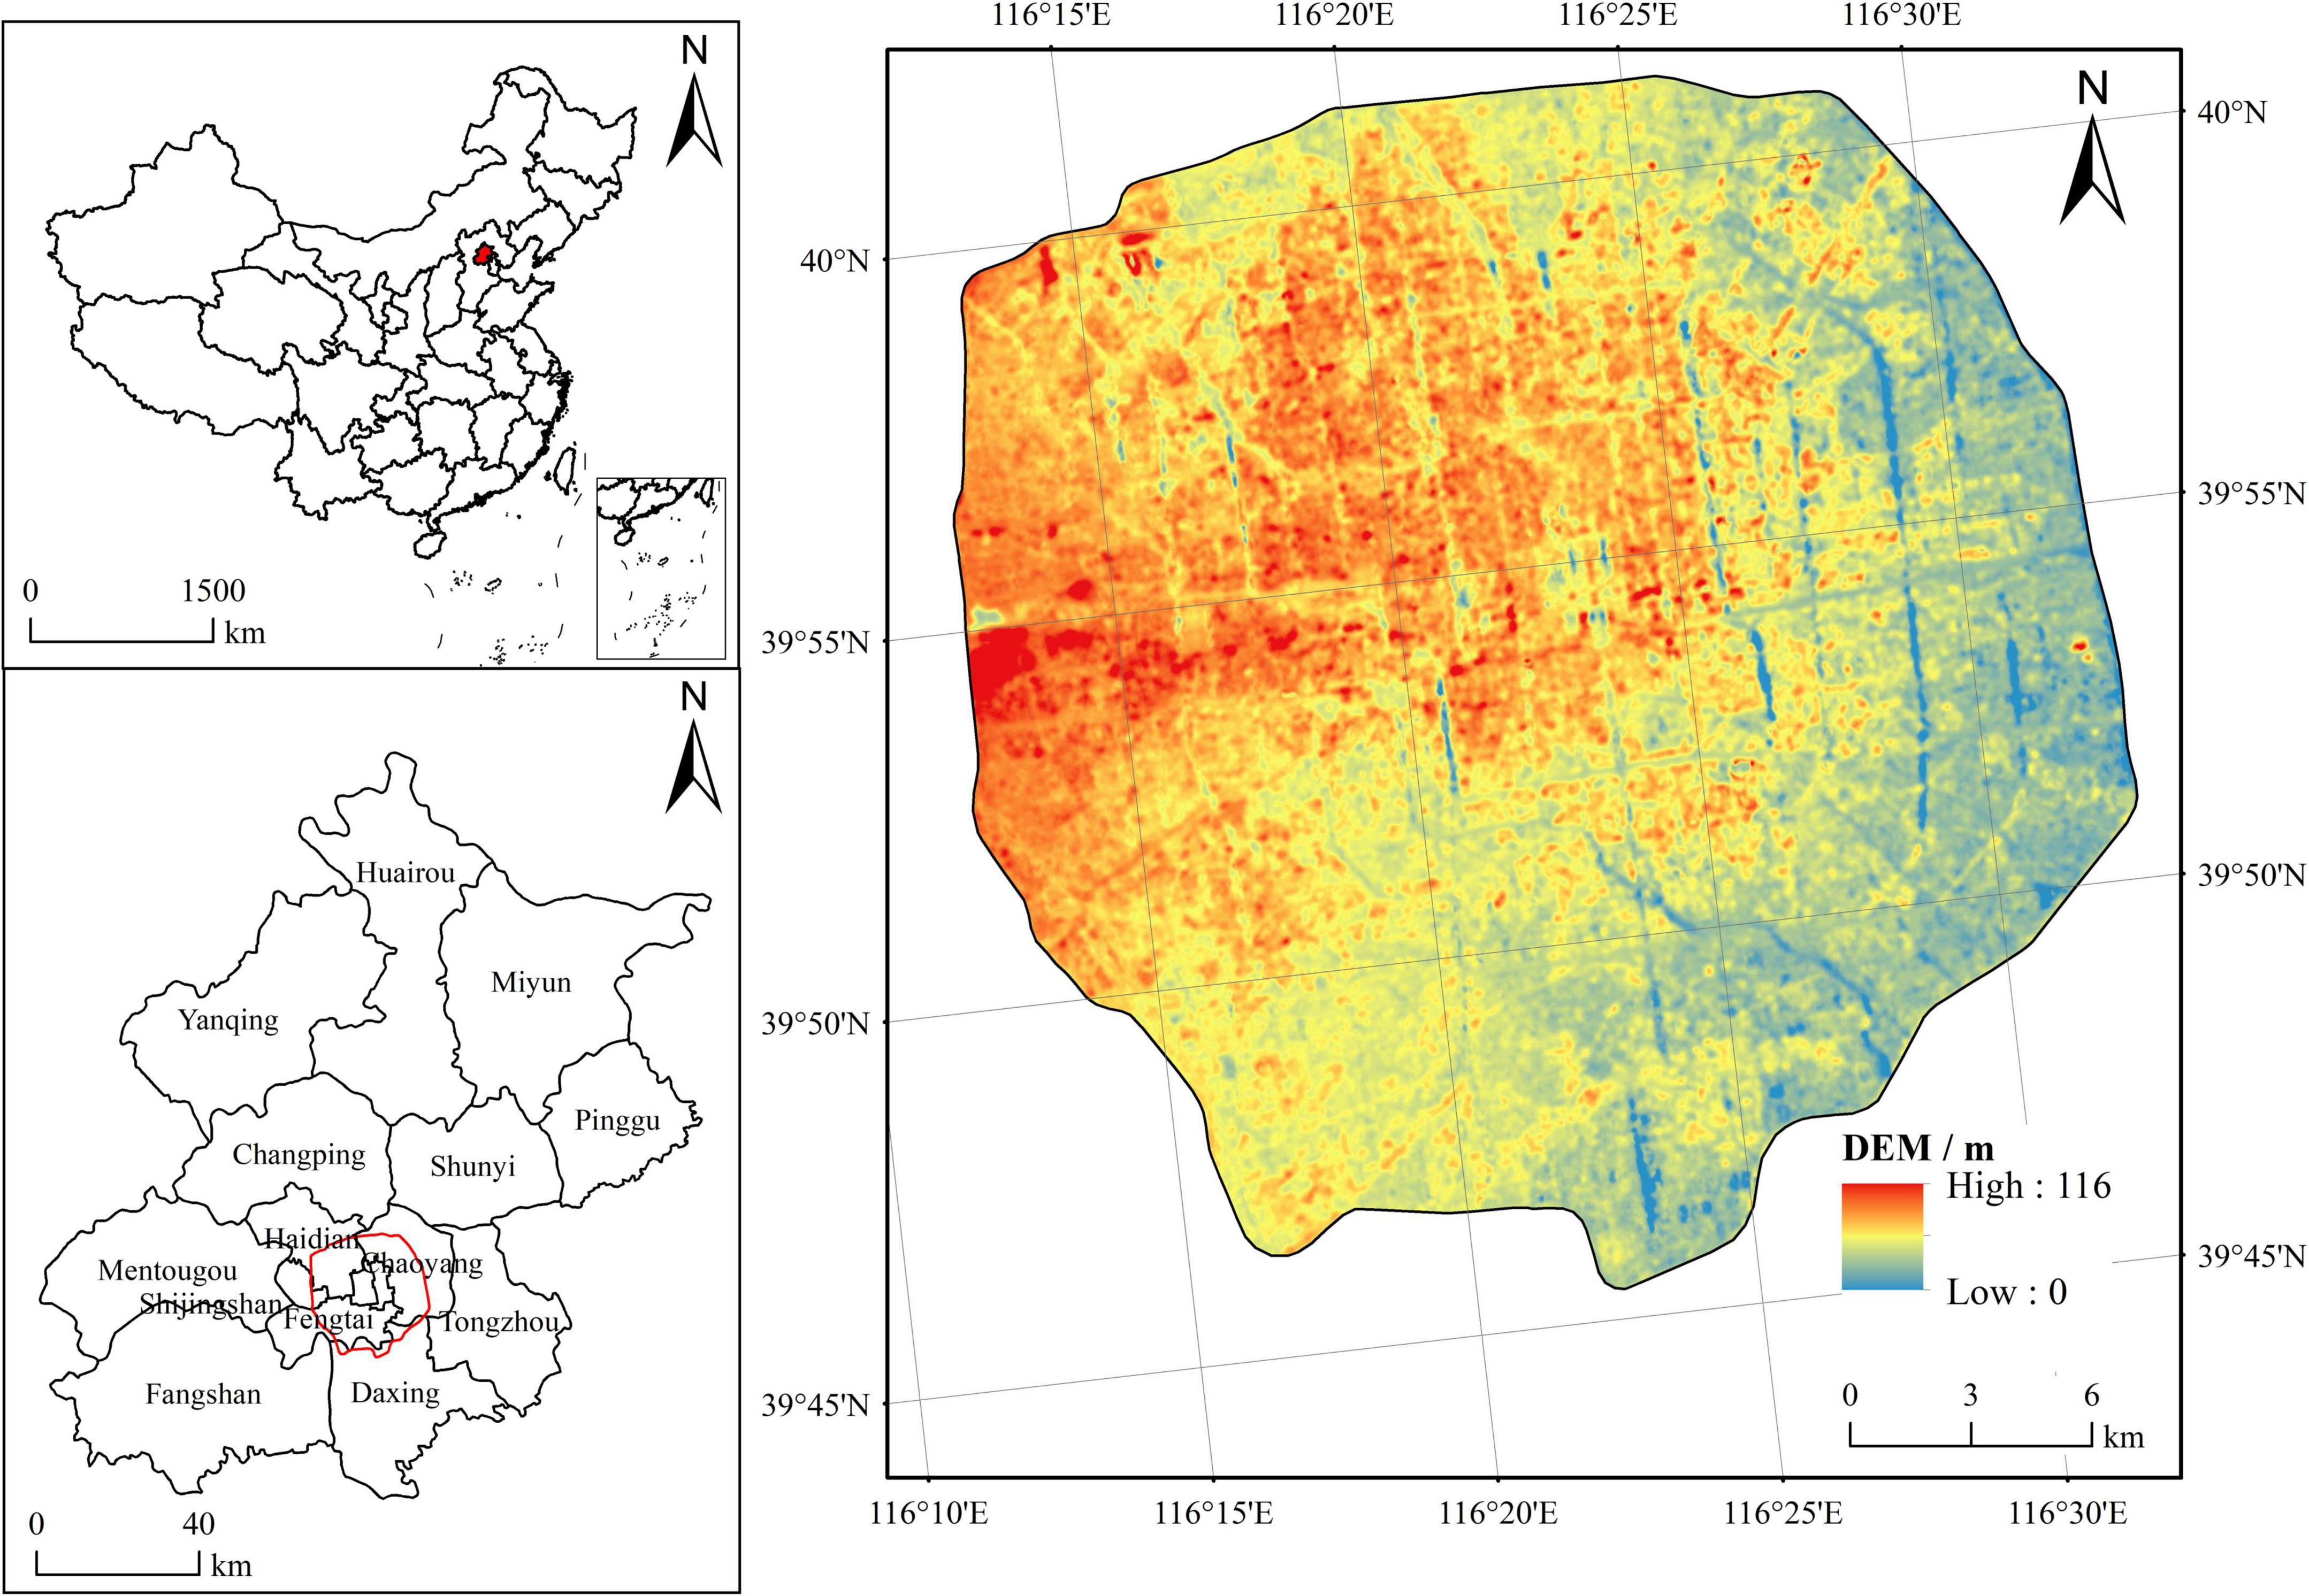
Beijing, the capital of China, is located in the north of China (39°26’-41°03’N, 115°25’-117°30’E) (Figure 1). It has a warm-temperate, semi-humid continental monsoon climate. It is the political, cultural, and international communication center, as well as the highest urbanization level city in China. The study area is located within the fifth ring road, which covers an area of approximately 668 km2. Residents are dense and buildings are diverse in this region, leading to a severe UHI effect. According to the China National Bureau of Statistics, the urban green coverage (48.5%) of Beijing is the highest in China.1 The urban parks are the vital part of urban greening system, and play a key role in mitigating UHI effects. Therefore, this region was chosen as the study area to investigate the CE of parks and the impacts of surrounding buildings on them.
Data source
ECOSTRESS LST data, park boundary data, Map World images, and building datasets were used in this study, and the details are as follows.
LST data are provided by the ECOsystem Spaceborne Thermal Radiometer Experiment on Space Station (ECOSTRESS), which is aimed at measuring the temperature of the earth and estimating the water requirement of plants. The ECOSTRESS mission is operated by the National Aeronautics and Space Administration Land Processes Distributed Active Archive Center2 started on June 29, 2018. The Prototype HyspIRI Thermal Infrared Radiometer placed on the satellite can measure middle and lower latitude regions (53°N-53°S) with a measuring resolution of ≤ 0.3 K and horizontal resolution of 70 m (Hook et al., 2020). The Level-2 LST data is retrieved by the physics-based Temperature Emissivity Separation algorithm based on the five thermal infrared bands (8–12.5 μm).
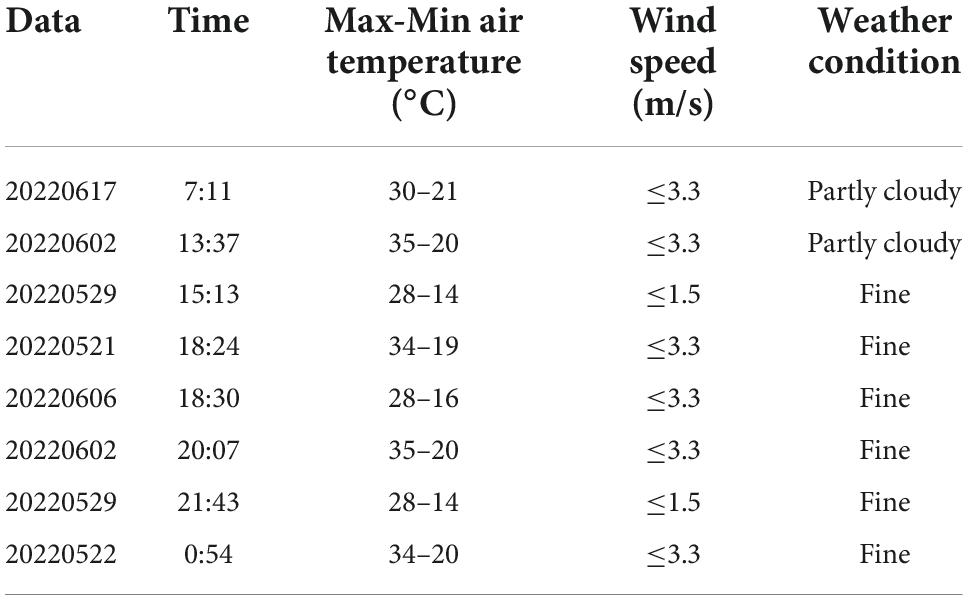
The satellite uses a processing orbit rather than a sun synchronous orbit, and can cross over the same region at different times of the day compared with Landsat and MODIS. Thus, it provides a feasible way to construct the diurnal variation LST in some regions (Chang et al., 2021). Although the influence of daily weather variations cannot be ignored (Hu et al., 2016), it is widely acknowledged that the CE of parks does indeed exist in different temperatures and regions. In addition, the urban form will maintain stable for a relatively short time. Therefore, the ECOSTRESS data from different days are used to analyze the CE of parks. Because the temperature in Beijing is more than 30°C lasting for 1 week since May 18, and rainy weather occurred after June 22, to better estimate the CE of the urban parks during the warmest months, eight ECOSTRESS 2B-LST data during a month are used in this study (Table 1).
The urban parks are the important part of urban green system, and provide relaxed and entertainment places for citizens. The parks which have these functions and clear names have been estimated in this study, and parks covering more than 400 m2 have been classified into different LCZs. The park boundary data are acquired using Baidu Map API.3 The park boundary data are revised by high-resolution images (<0.6 m) provided by Map World of the China State Bureau of Surveying and Mapping.4 Three hundred and fifty six urban parks have been investigated, and the larger parks are mainly distributed in the north of the fifth ring.
Building datasets are derived from the Resources and Environmental Scientific Data Center (RESDC), Chinese Academy of Sciences (CAS).5 Several parameters of buildings, such as building outline, the number of floors, and the height of buildings, are included in this dataset. It provides fundamental data for analysis of impacts of neighboring buildings on the CE of parks.
Methodology
Local climate zone classifications of parks
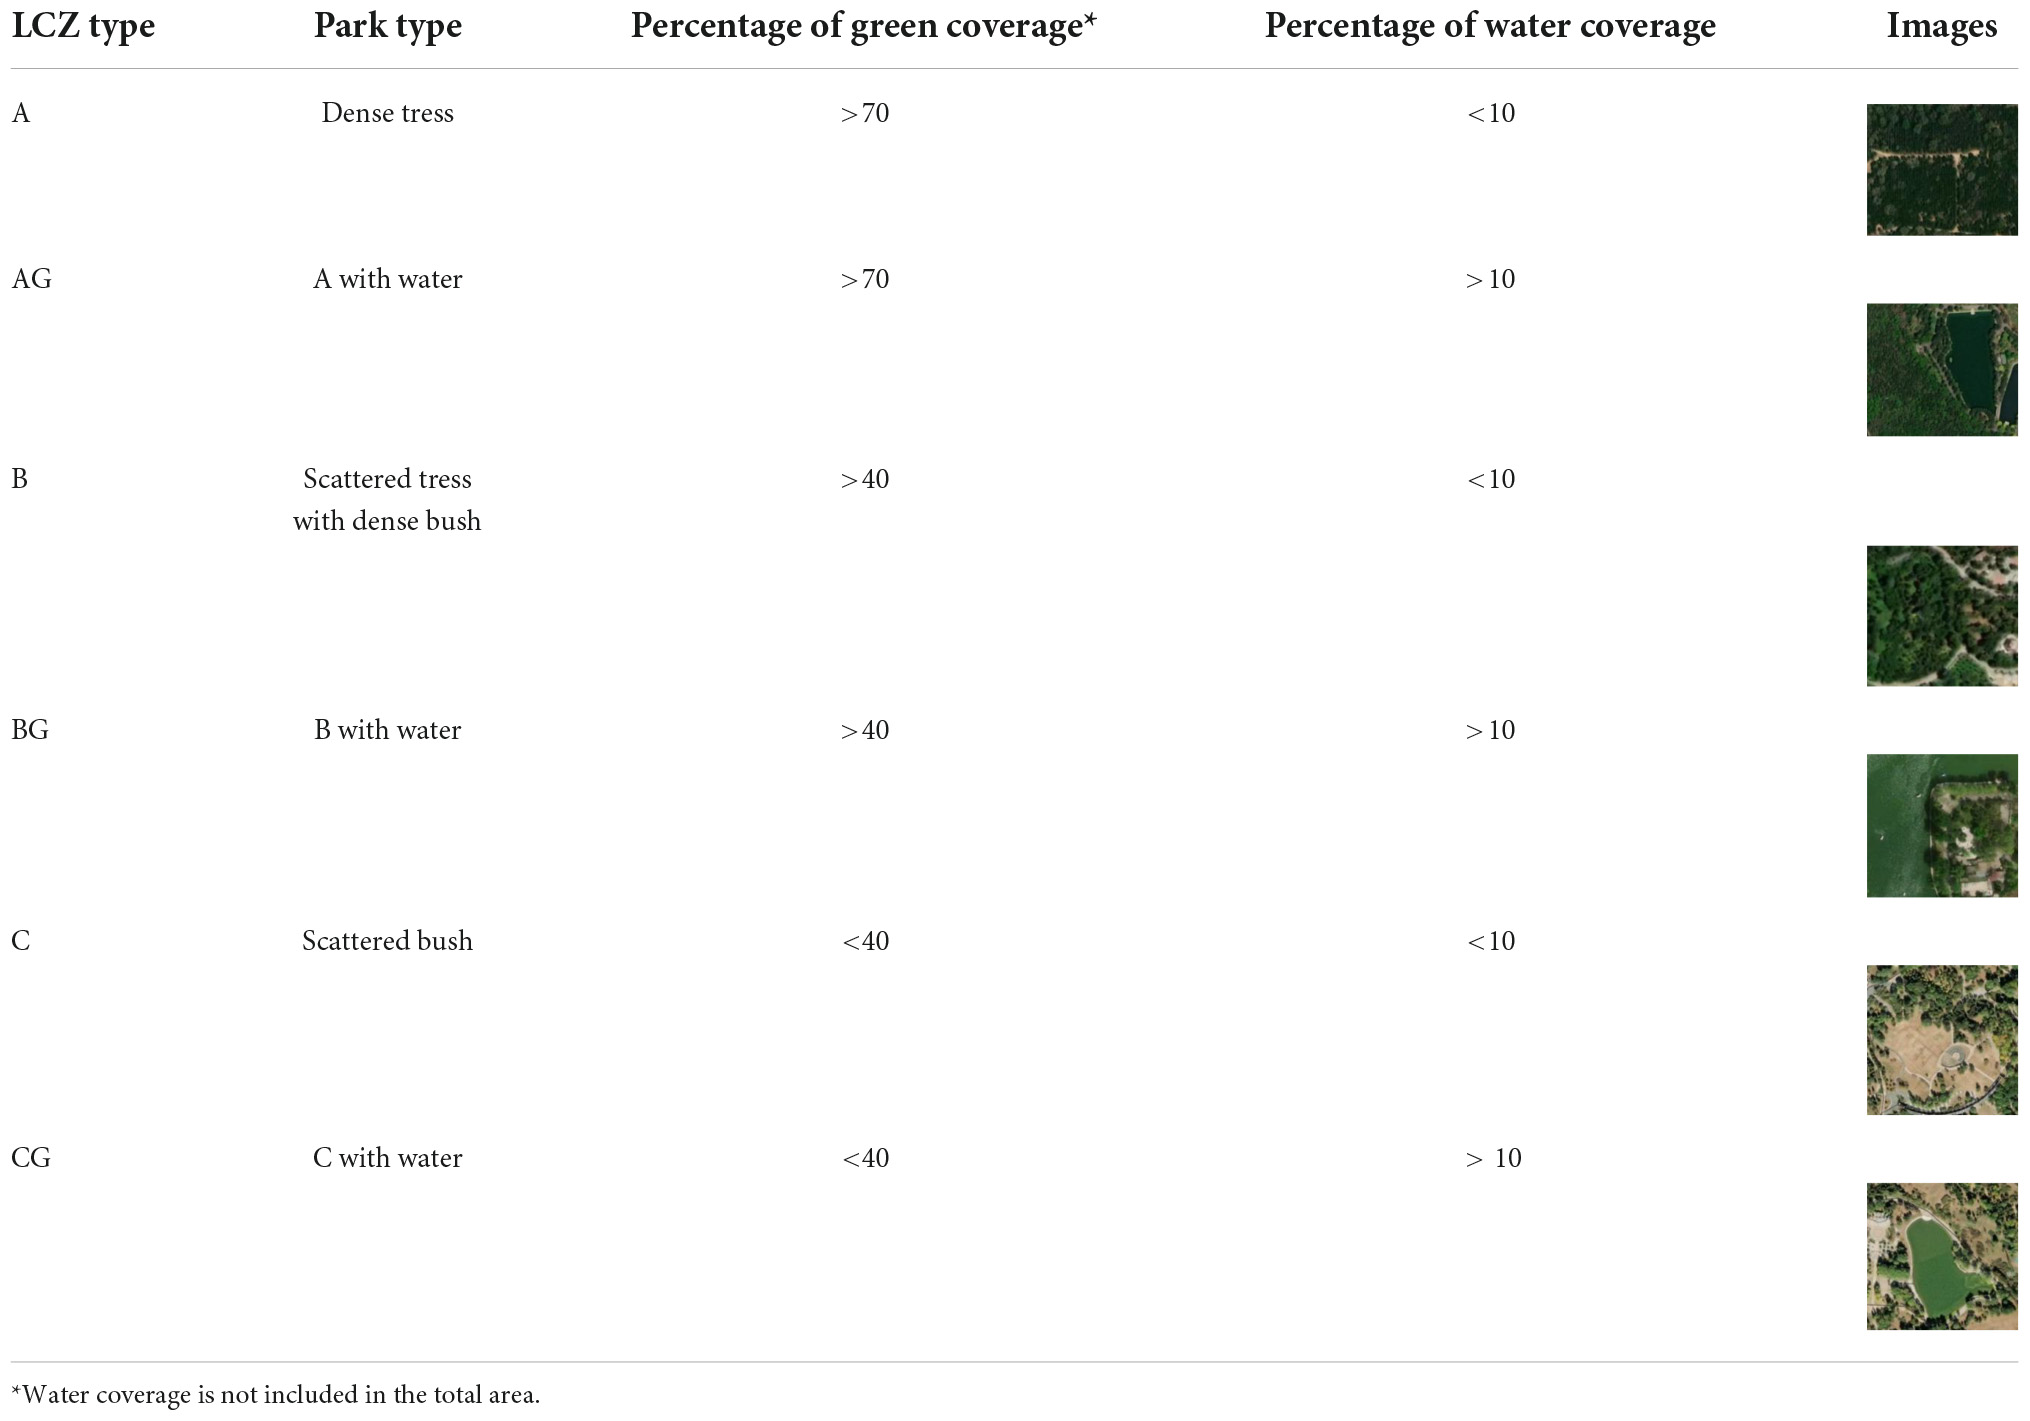
The park forms are not exactly the same. Parks are possibly formed by dense tress, scattered tress, bush, or water. To better understand the CE of different parks, the method of LCZ classification is used in this study. The LCZ classification has been widely used to investigate the impacts of urban form on LST, and has seven land cover types including dense trees, scattered trees, bush, low plants, bare rock, bare soil, and water (from A to G) (Stewart and Oke, 2012). Since none of these parks are only formed with grass, we use three types of LCZ (LCZA, LCZB, and LCZC) and create new subclasses for those parks containing water (LCZAG, LCZBG, and LCZCG) (Table 2). In addition, previous studies point out that LCZ region should have a minimum radius of 200 m (Stewart and Oke, 2012). Thus, only the parks covering more than 400 m2 have been used.
Then, a deep residual network (ResNet) is used for artificial intelligence automatic classification of parks on the basis of high-resolution images provided by Map World. This method uses a residual learning framework to ease the training of networks and solve the degradation problem (He et al., 2016). At last, the artificial visual interpretation method is used to correct the classification results.
Cooling effect of parks
Inside and outside CE of parks were investigated in this study. For inside CE of park, the average temperature of each type of park at different times were compared. For outside CE of park, buffer analysis was adopted to analyze LST differences of different types of parks within a certain buffer distance (e.g., 30, 60, and 90 m). Furthermore, the CE of parks is different in different directions. Therefore, the CE of parks is averagely distributed at eight orientations, including north (N), northeast (NE), east (E), southeast (SE), south (S), southwest (SW), west (W), and northwest (NW).
Impacts of buildings on cooling effect of parks
To better understand the impacts of surrounding buildings on the CE of parks, a building dataset with outline and height was used in this study. In this study, three perspectives, including average height, density, and shape of buildings, will be adopted to investigate the impacts of buildings on the CE of parks. Particularly, the density and shape of a building can be calculated by building height (BH), building density (BD), and landscape shape index (LSI), respectively. Then, these indicators in eight directions can be calculated within a certain buffer distance. Finally, the impacts of buildings will be analyzed from the above perspectives.
Results
The diurnal variations of land surface temperature
The diurnal variations of mean LST in the fifth ring are showed in Figure 2 with the time coverage from 24:54 to 21:43. It was obvious that LST during the daytime was higher than it during the night. LST in the morning (7:11) was about 3.34°C higher than at night (21:43), and LST at noon (13:37) was almost 2 times higher than at night. It indicated that urban landscapes would be quickly heated by solar radiation. LST in the large parks was about 3.49°C lower than in the whole urban regions, but in the small parks was similar to other urban regions. As expected, the CE was better inside the large parks. The weak influence of small parks was possible due to the limited area and vegetation coverage, and LST in small parks was influenced easily by the surrounding environment. The difference (2.63°C) in the mean temperature of LST at 18:24 (21 May) and 18:30 (6 June) was mainly caused by the day-to-day variations. The release of the remained energy from buildings and waters, and human activities led to the increase of LST at midnight (Chan and Chau, 2021).
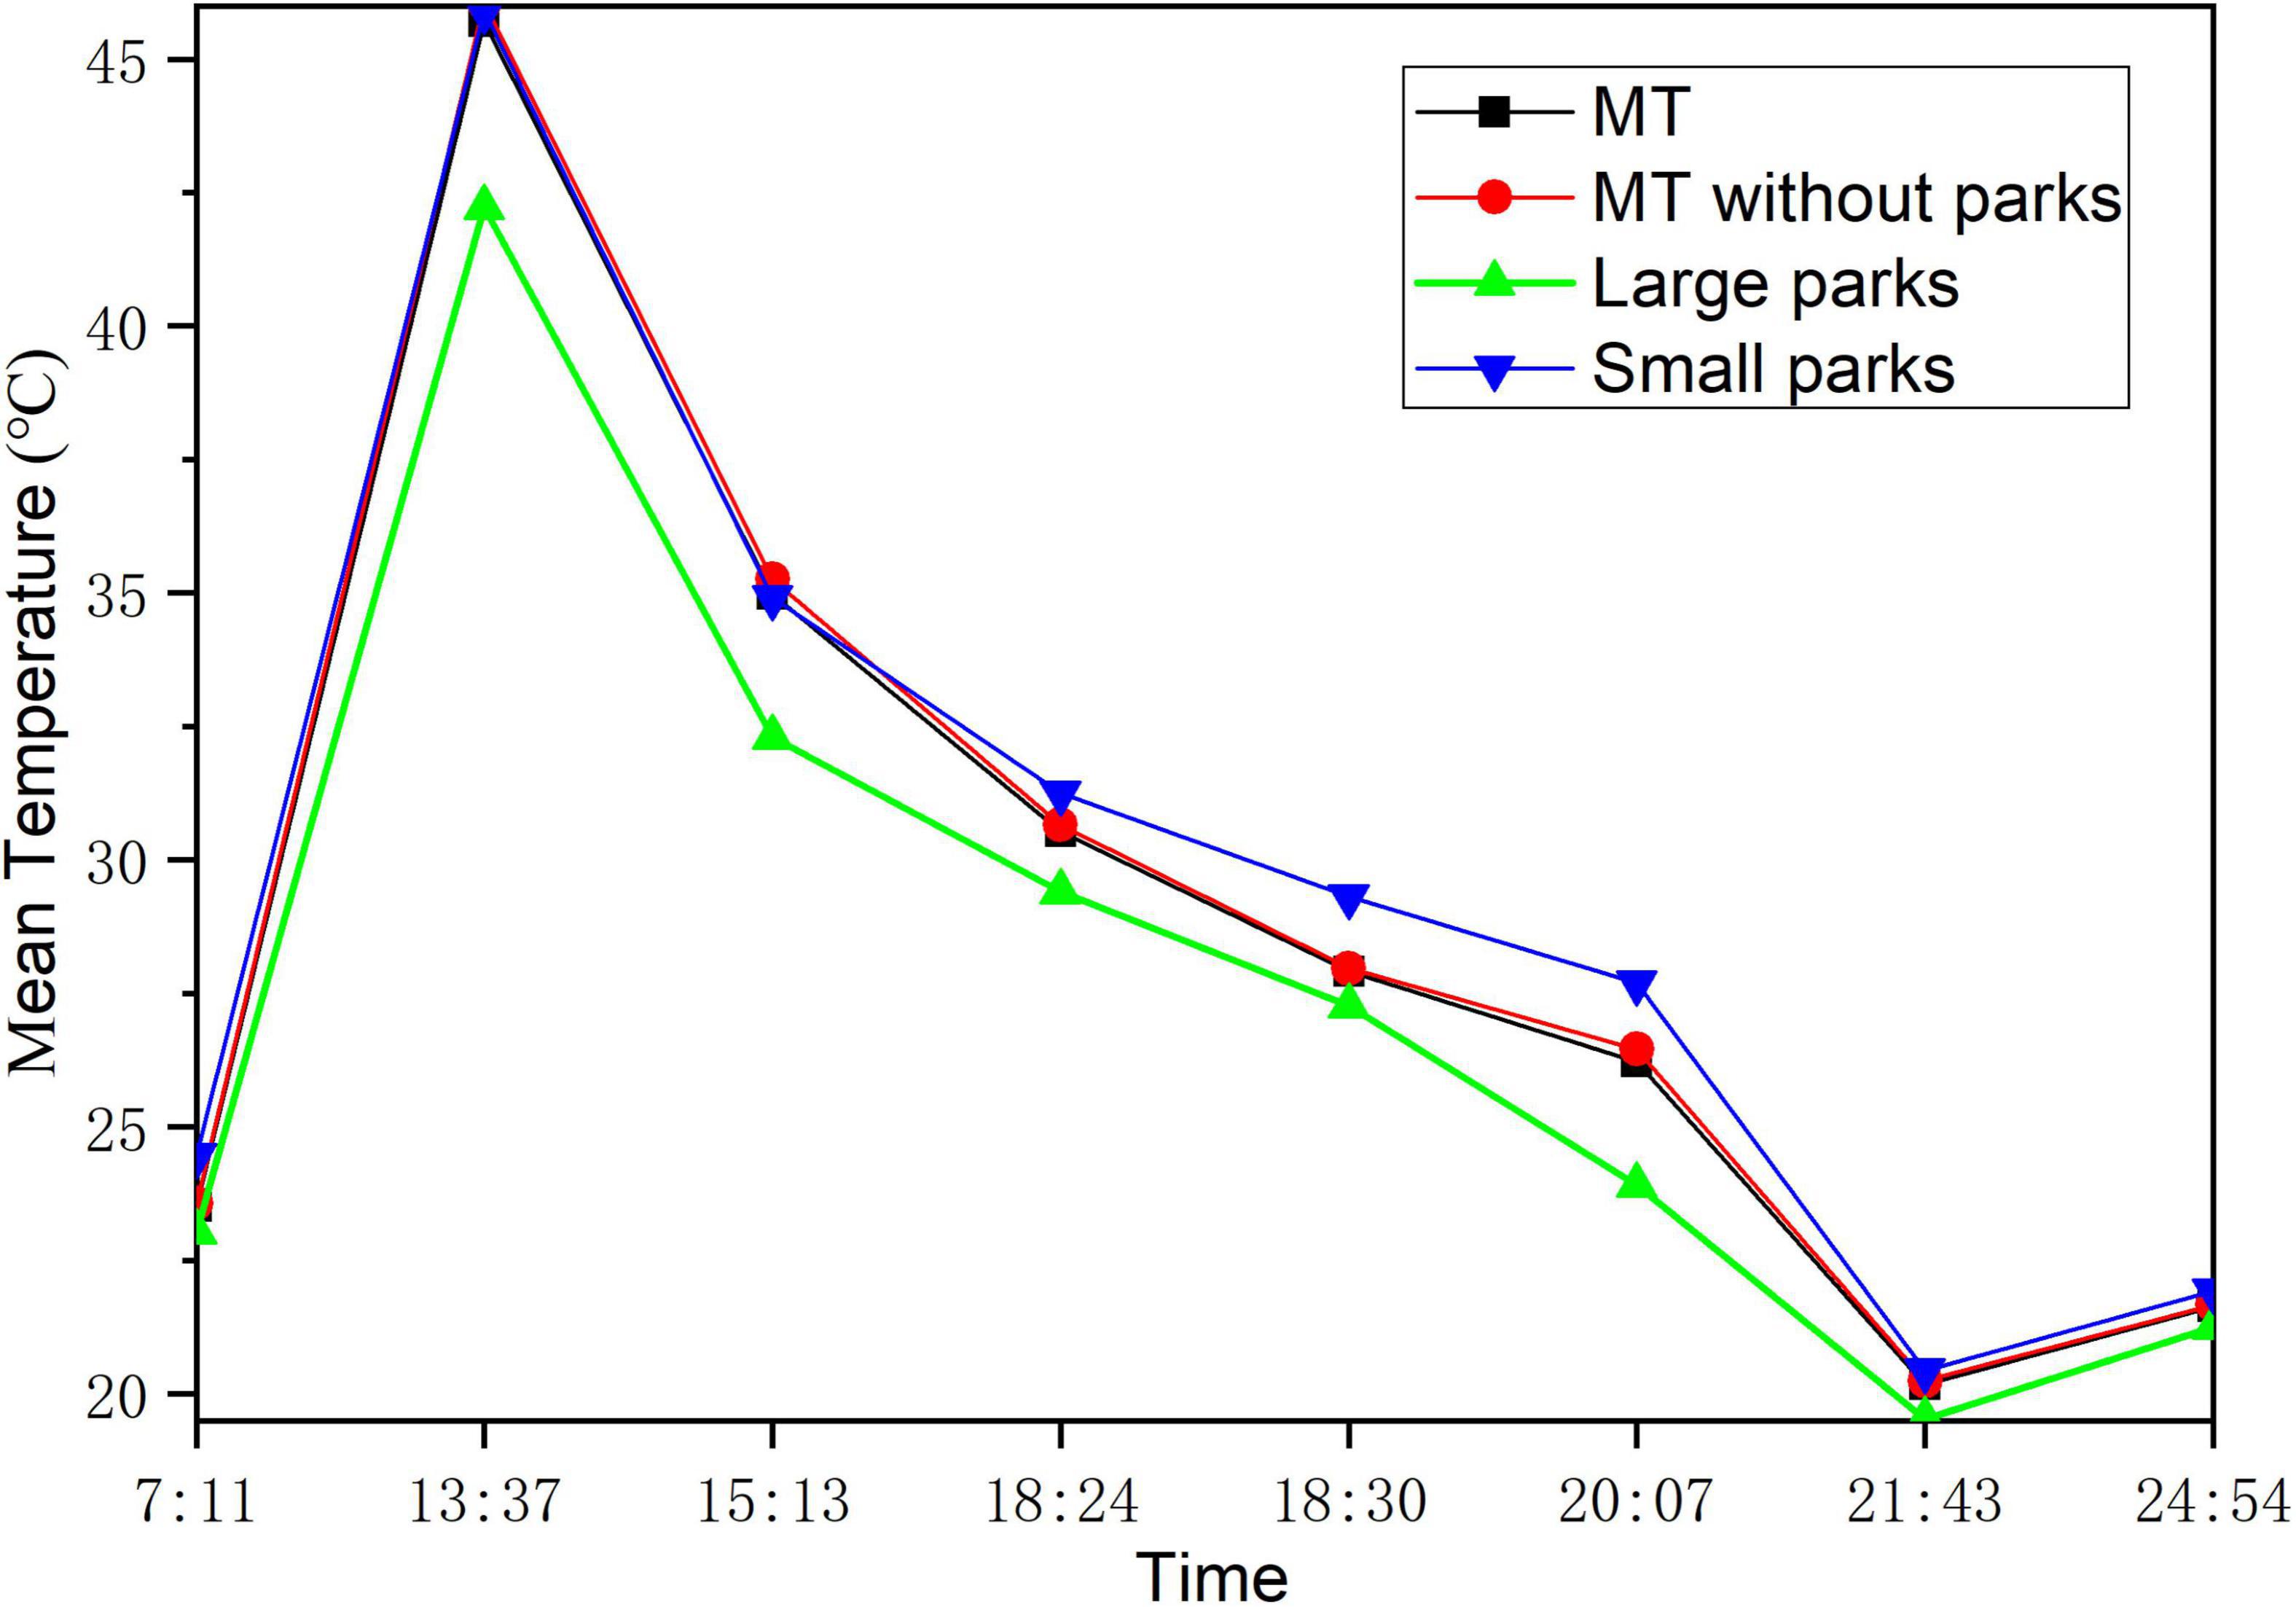
Figure 2. Mean LST at different time in fifth ring. Mean temperature (MT) in fifth ring is shown in black line, in fifth ring without parks is in red line, in large parks (>40,000 m2) is in green line and in small parks is in blue line.
LST in the different regions of the fifth ring showed similar trends between day and night (Figure 3). The regions close to the fifth ring showed lower LST all day owing to the low-rise buildings (e.g., factories) were generally located in the suburbs. LST in the urban parks, especially in the large parks (e.g., Beihai park, Tiantan park, Chaoyang park, and so on) was obviously low during daytime. However, the CE of parks had limited impacts on the surrounding environment with extremely high temperatures, e.g., at 13:37. At night, the parks containing a mass of water (e.g., the Summer Palace located in the northwest) released energy rising local temperature, but the rise of LST was mainly distributed in the urban built-up area, e.g., in the northeast region. In addition, there was a low temperature corridor running through the south and north of the fifth ring at 24:54, which was consistent with ventilation corridors found in a previous study (Qiao et al., 2017).
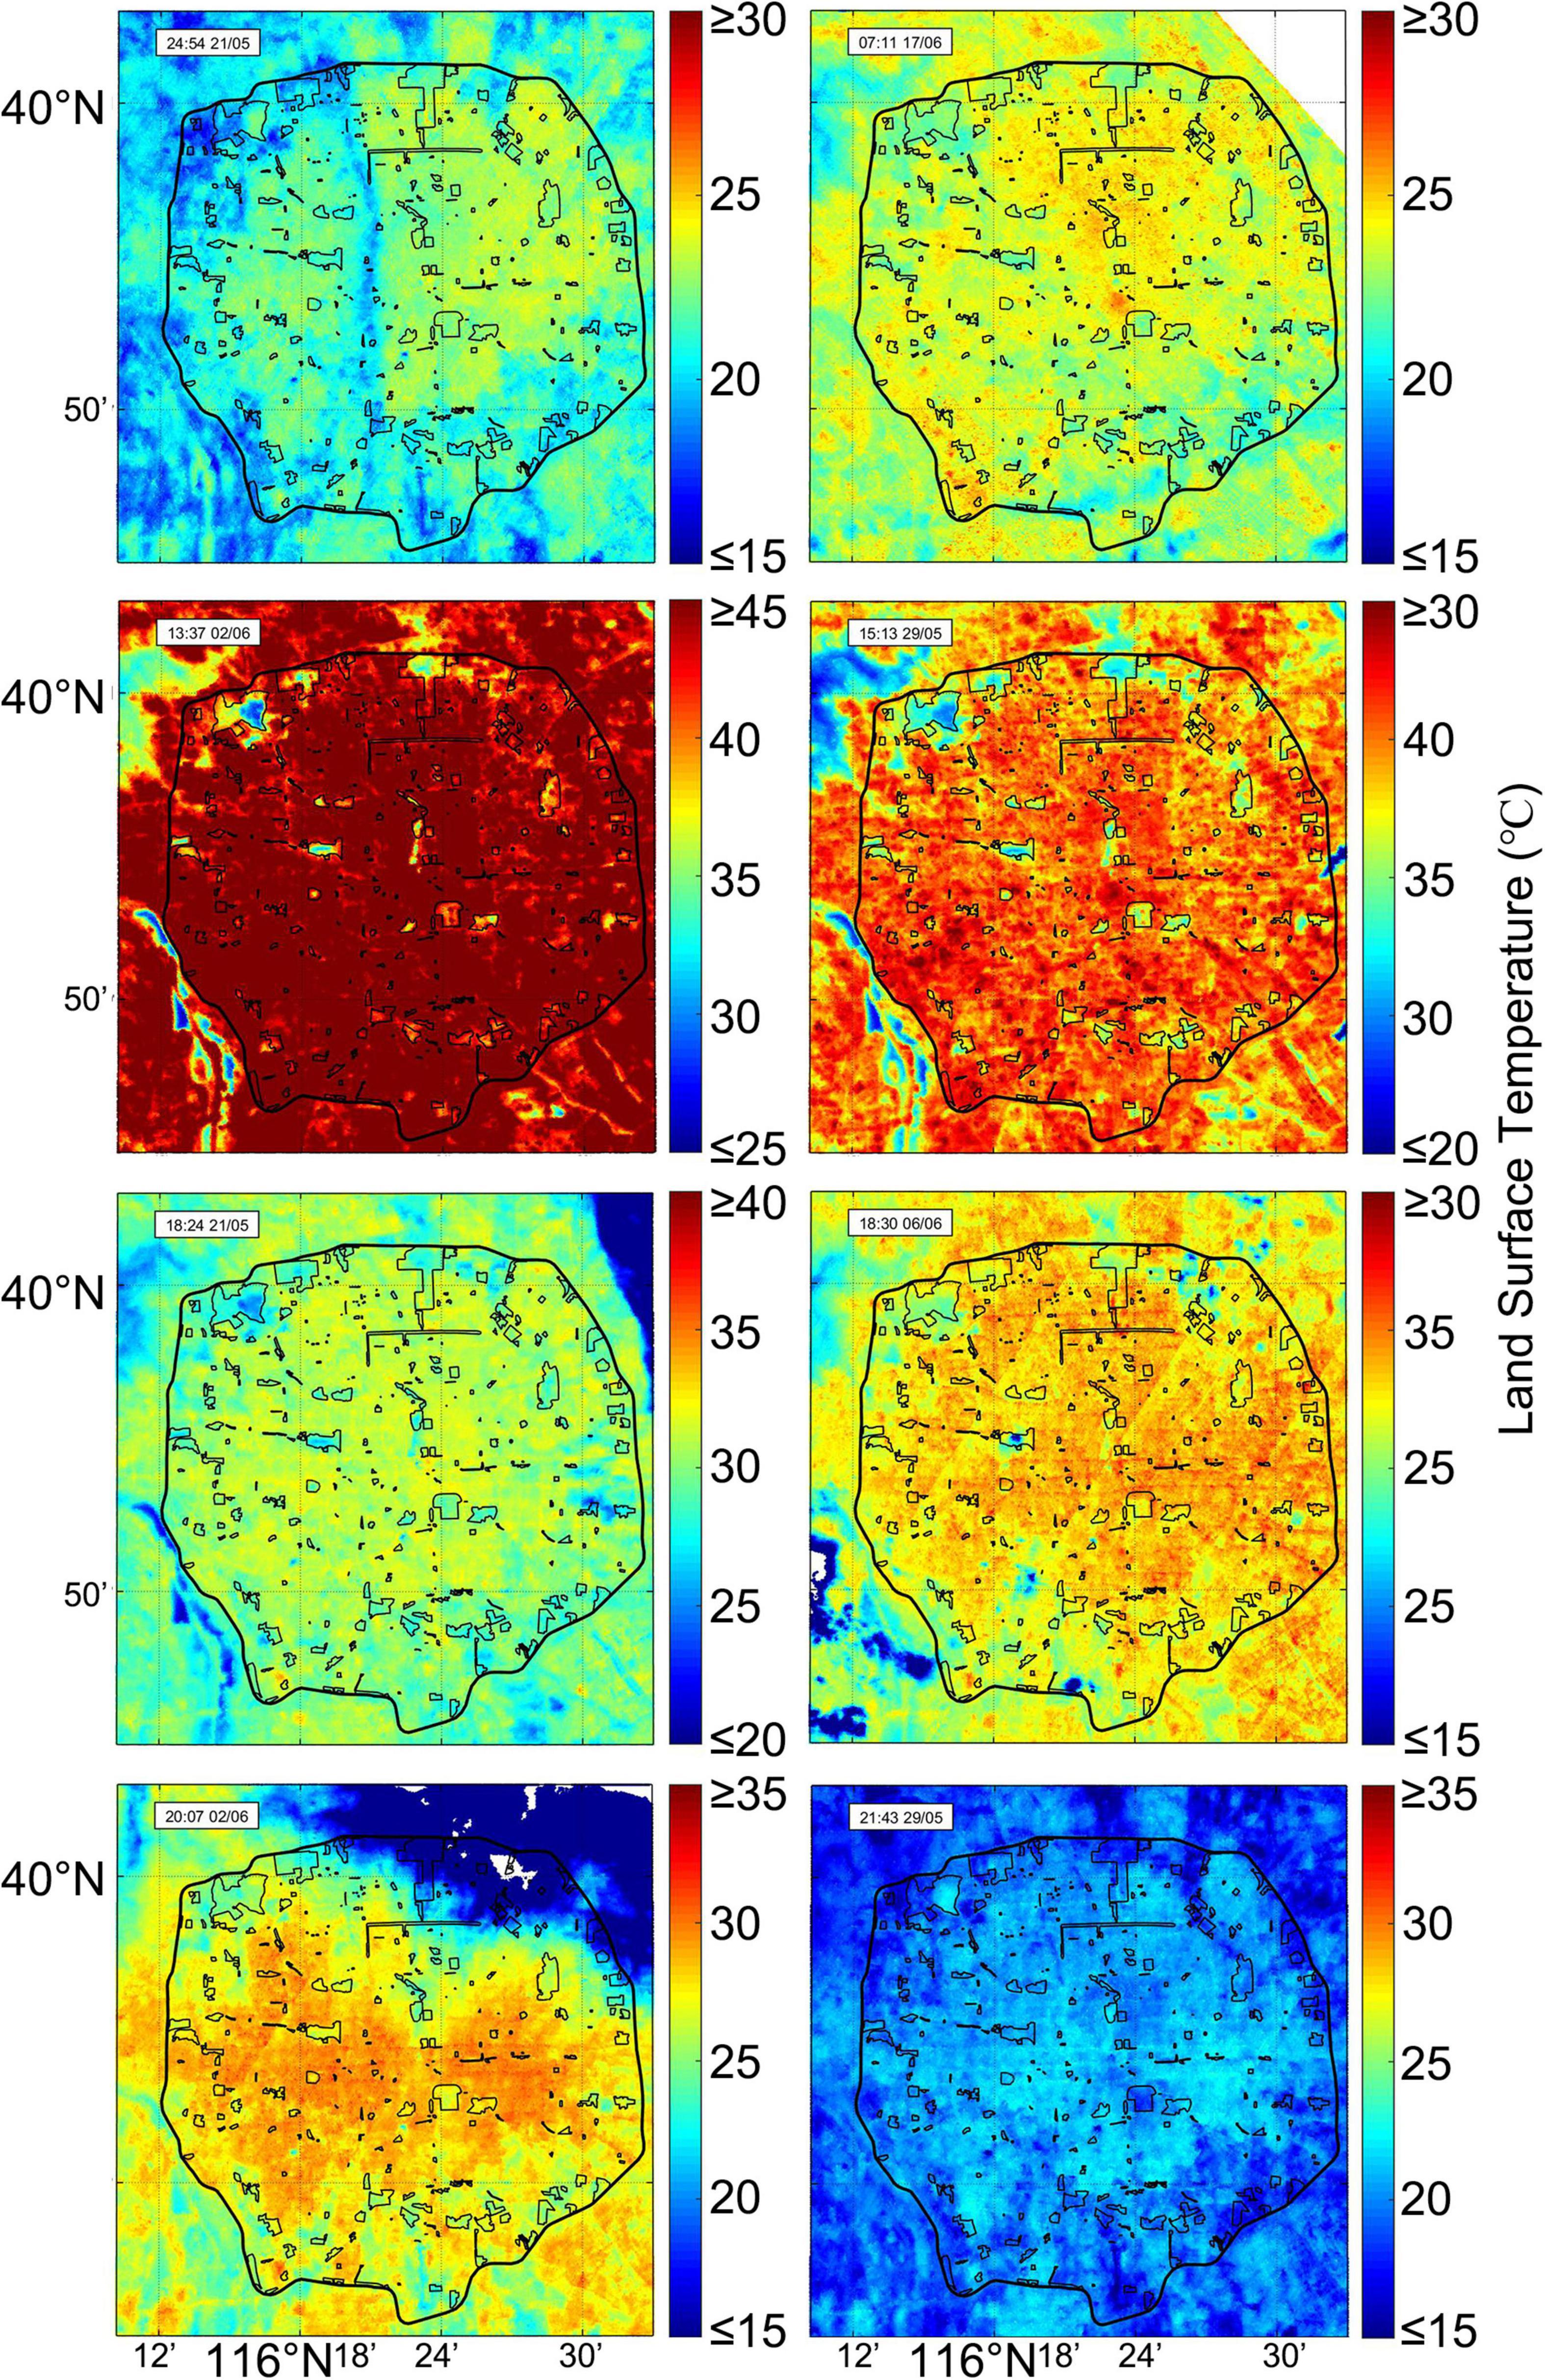
Figure 3. The distribution of LST at different time in fifth ring, and the measuring time is shown on the left top of each figures. The time is Beijing time (UTC + 8).
The local climate zone classification of urban parks
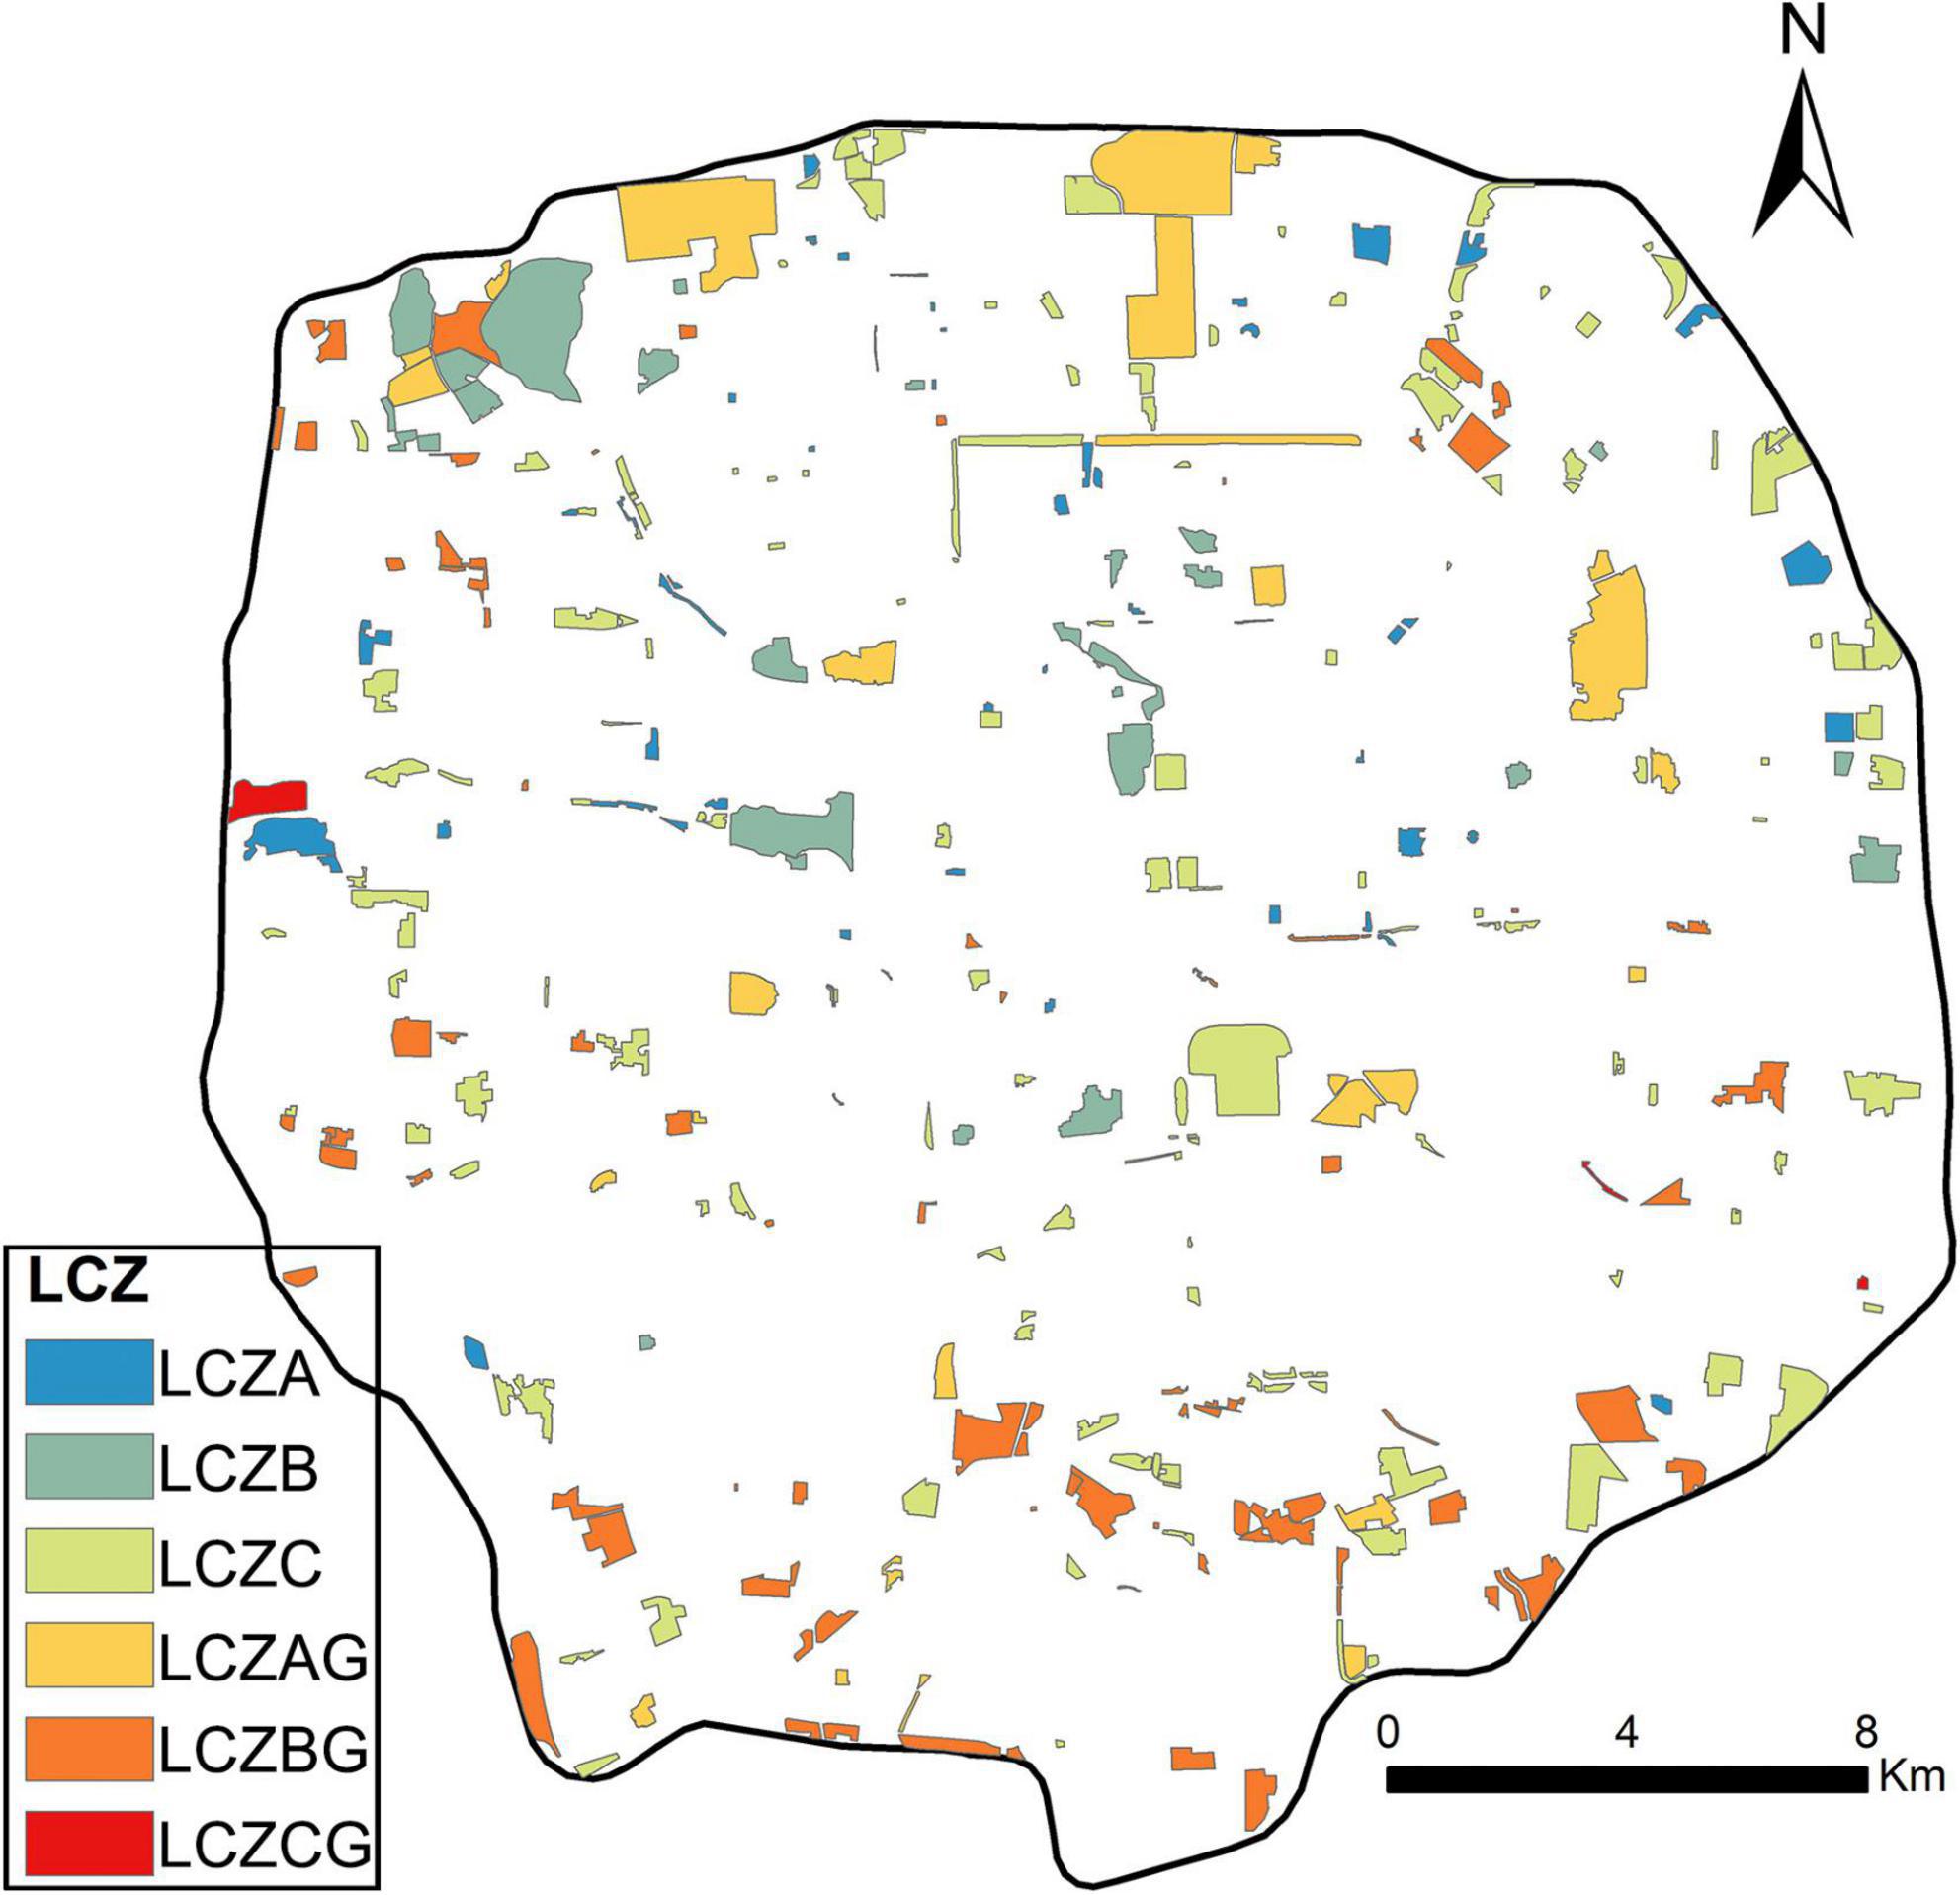
The urban parks in the fifth ring have been classified into six zones based on the main vegetation types: dense trees with water or not (LCZAG or LCZA), scattered stress and dense bush with water or not (LCZBG or LCZB), scattered bush with water or not (LCZCG and LCZC). The spatial distributions of parks was imbalanced as showed in Figure 4. LCZAG was mainly distributed in the middle and northwest, and LCZA and LCZBG were concentrated in the north of the fifth ring. LCZB was the major form of urban parks widely distributed in urban regions. LCZC with less vegetation coverage and a large bare area was located in the south.
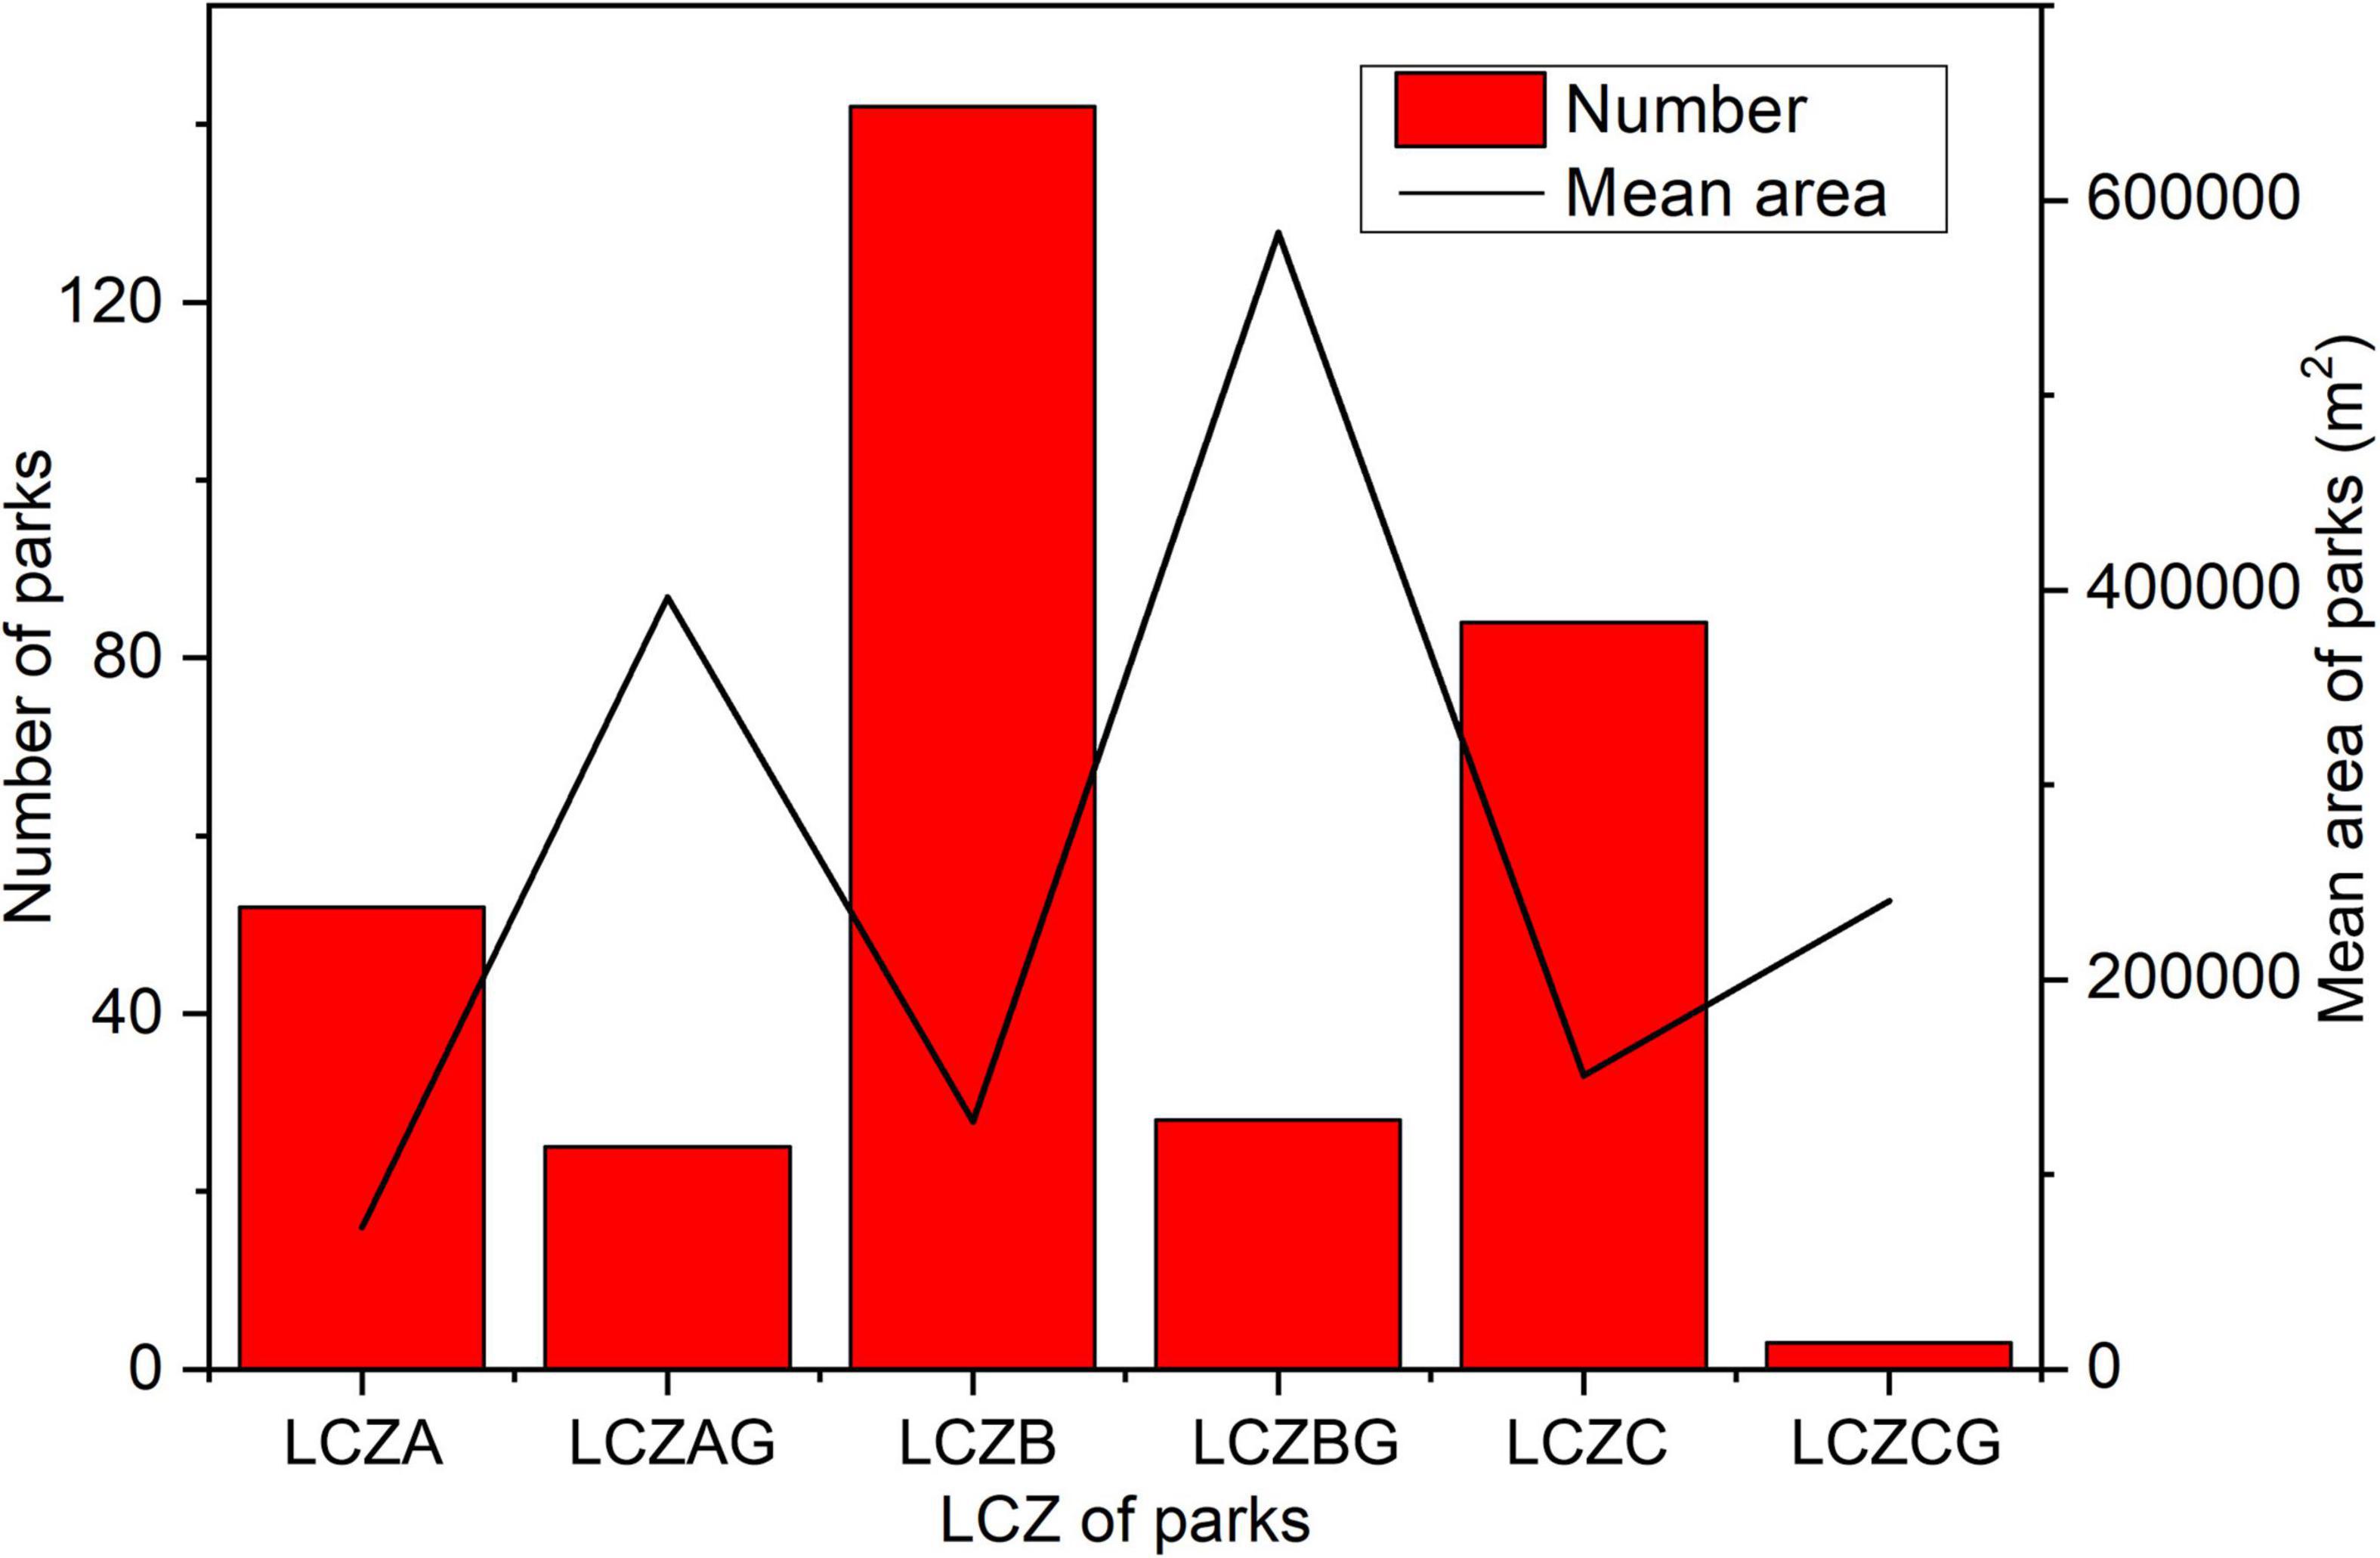
Figure 5 shows the number and mean area of different parks. LCZB had 143 urban parks with a mean area of 0.127 km2 accounting for 42.5% of all large parks. The mean area of LCZC was similar to LCZB, but LCZC had obvious open spaces. The number of LCZA was less than LCZB and LCZC, because dense trees within a large area would weaken the service function of urban parks for cultural activities and entertainments. The source of water had restricted the presence of LCZAG, LCZBG, and LCZCG, and water also resulted in the larger area of these parks.
The cooling effect of urban parks
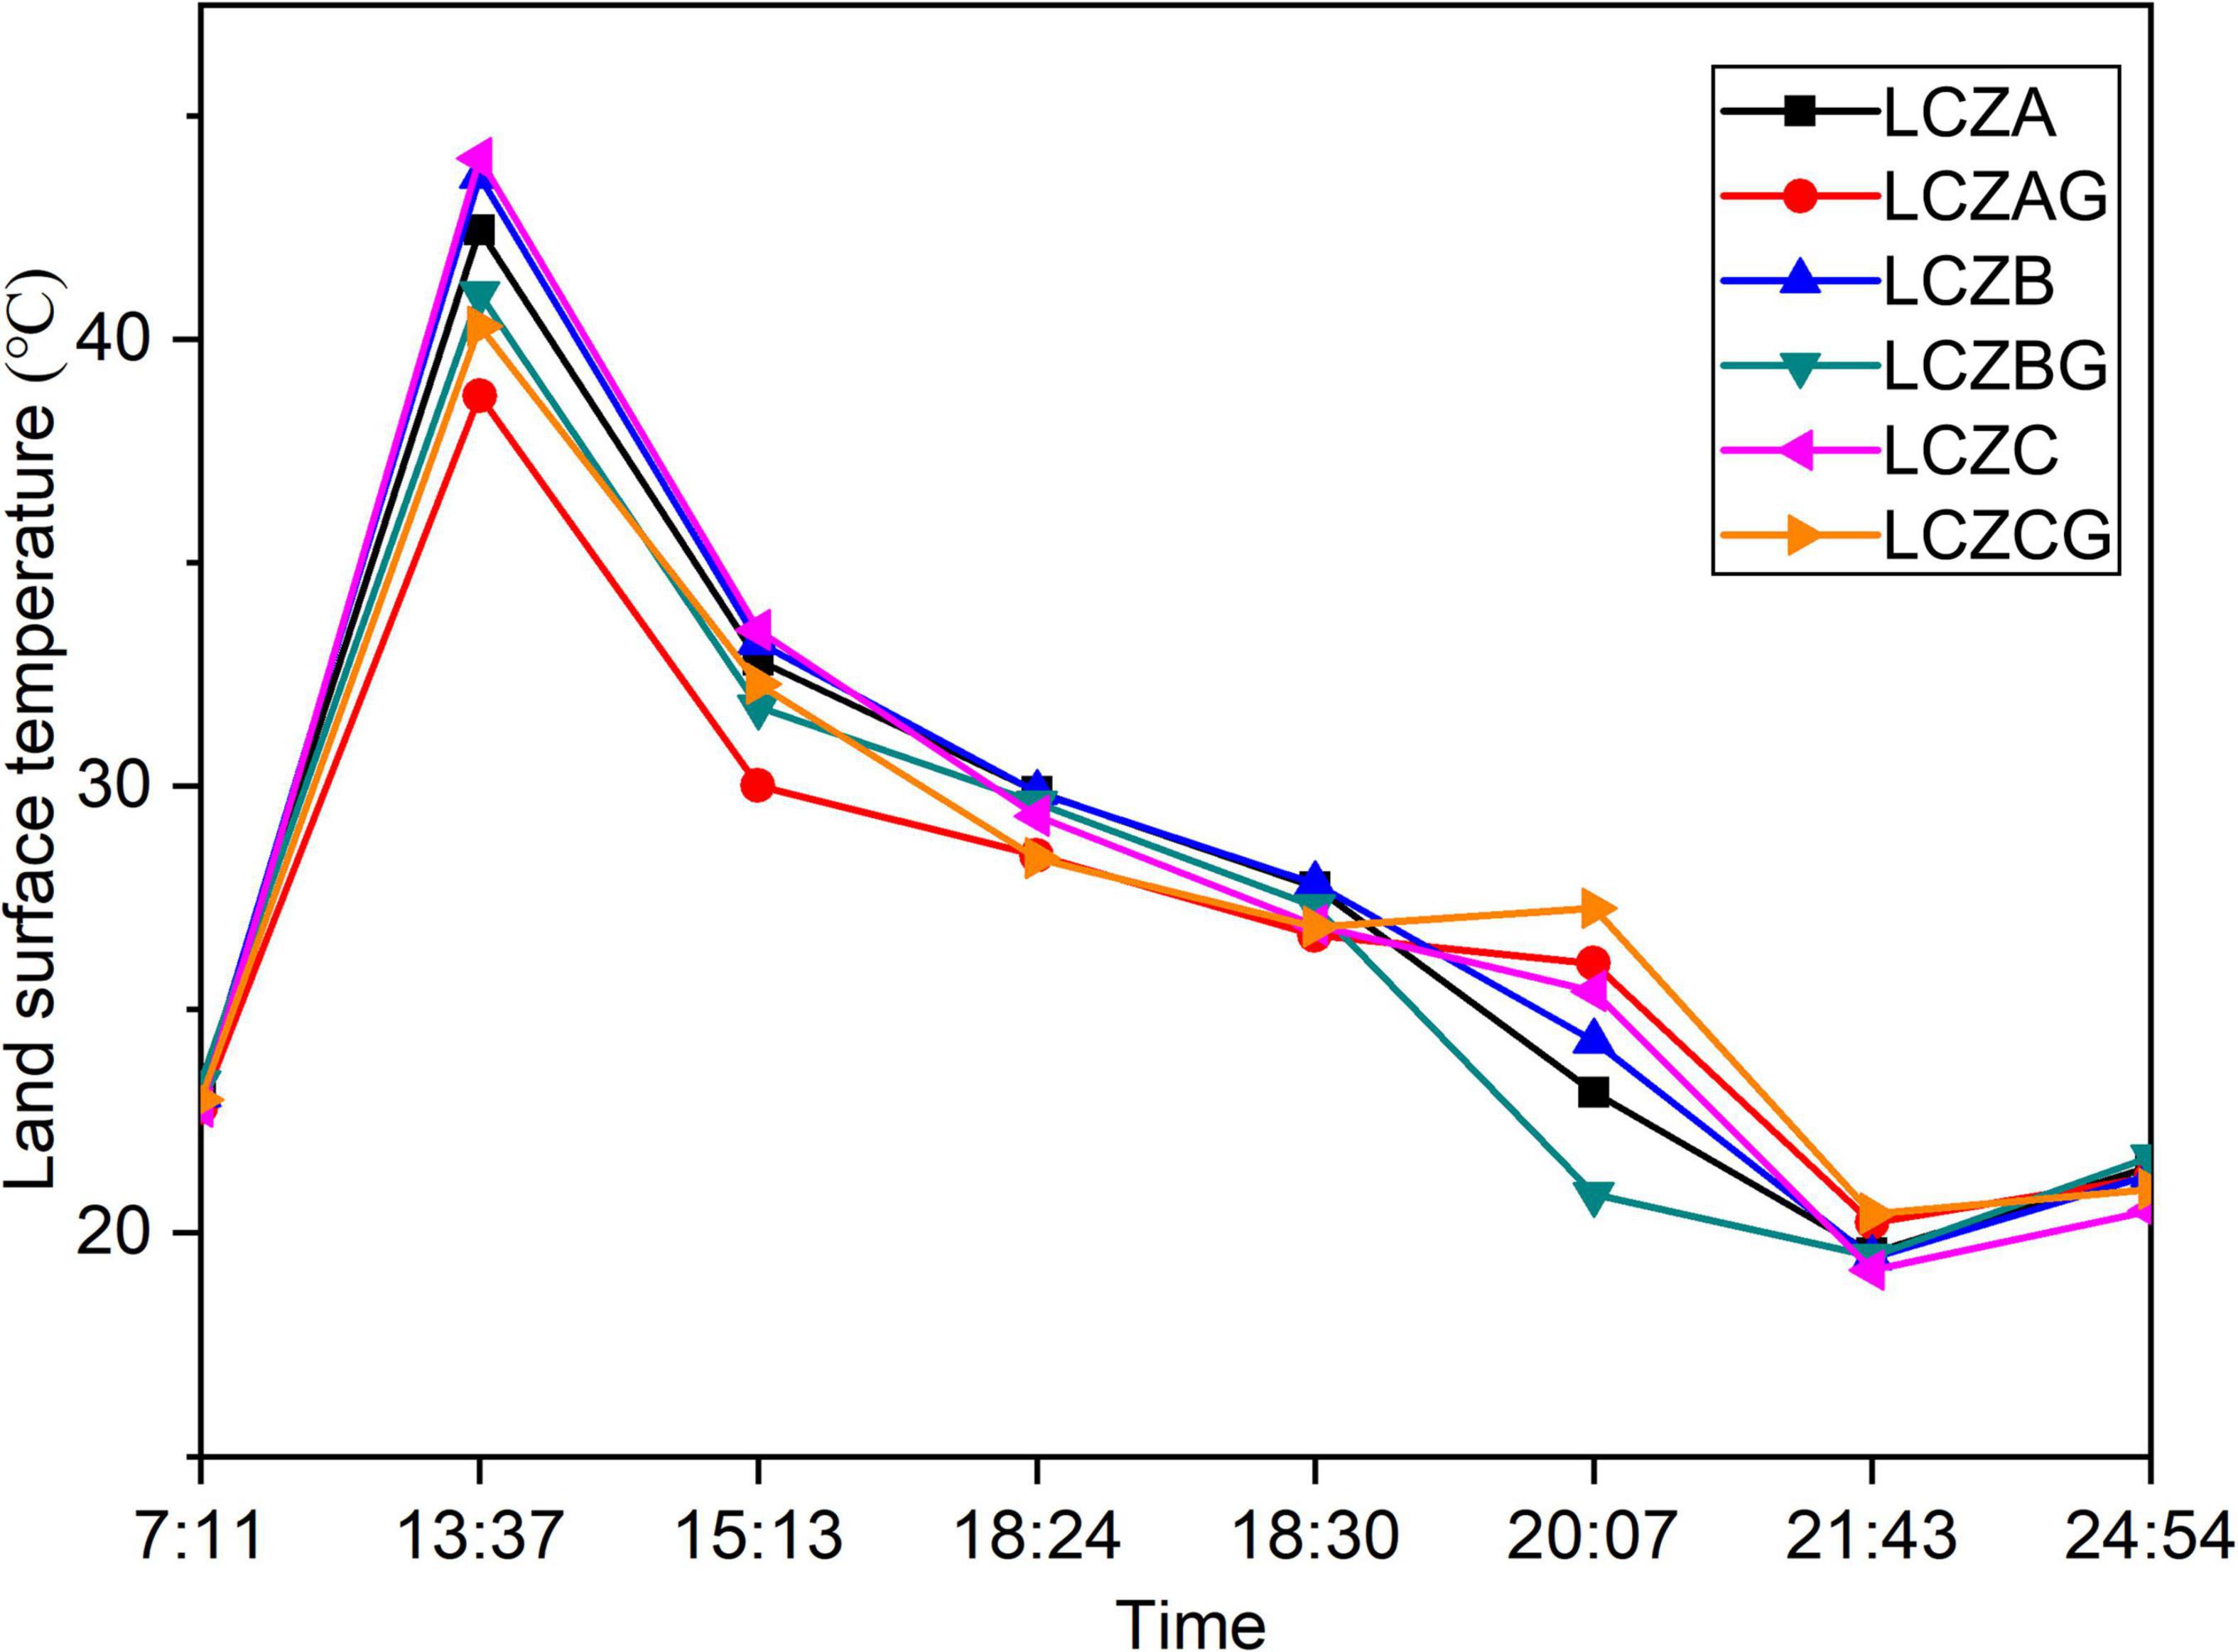
The CE existed in and out of the urban parks. Figure 6 shows the mean temperature inside different parks, which had a similar trend to the whole urban area (Figure 2). All parks had the highest LST at noon and the lowest LST at midnight. It is suggested that strong solar radiation was the dominant reason for the rise in urban temperature. The vegetation coverage and density of trees led to the different CE of parks with few water during daytime. Mean LST in LCZAG was the lowest during the daytime, and LCZC was the opposite. The parks with water were cooler than LCZA, LCZB, and LCZC. The difference in CE between the parks with water or not was larger with higher air temperature possibly caused by the specific heat capacity of water. LCZBG and LCZCG showed similar LST at daytime, e.g., about 41.02°–40.29°C at 13:37, and 31.77°–32.29°C. It should be noted that LCZCG was mainly located in the south with lower LST. After nightfall, LCZBG and LCZA could provide a more comfortable environment for rest and entertainment with lower LST (20.86° and 23.14°C, respectively).
Mean LST around parks at different distances and times was showed in Figure 7. The closer to parks, the stronger CE existed during daytime (e.g., 13:37 and 15:13) especially at a distance of 50 m. LST had an obvious increase at a distance of 100 m, and increases gradually with the increase of distance. LCZAG showed the best CE in the daytime compared with other types of parks. Different from CE inside parks, LST around LCZA was lower than LCZBG and LCZCG (e.g., at 15:13). However, CE of LCZBG was similar to LCZA within the range of 100 m under hotter conditions (e.g., at 13:37). It is suggested that water can play a bigger role in such conditions. At night, a relatively low LST was around LCZC probably due to its open space. LCZAG, LCZBG, LCZA, and LCZB had less open space likely resulting in the reduction of airflow and higher LST around them.
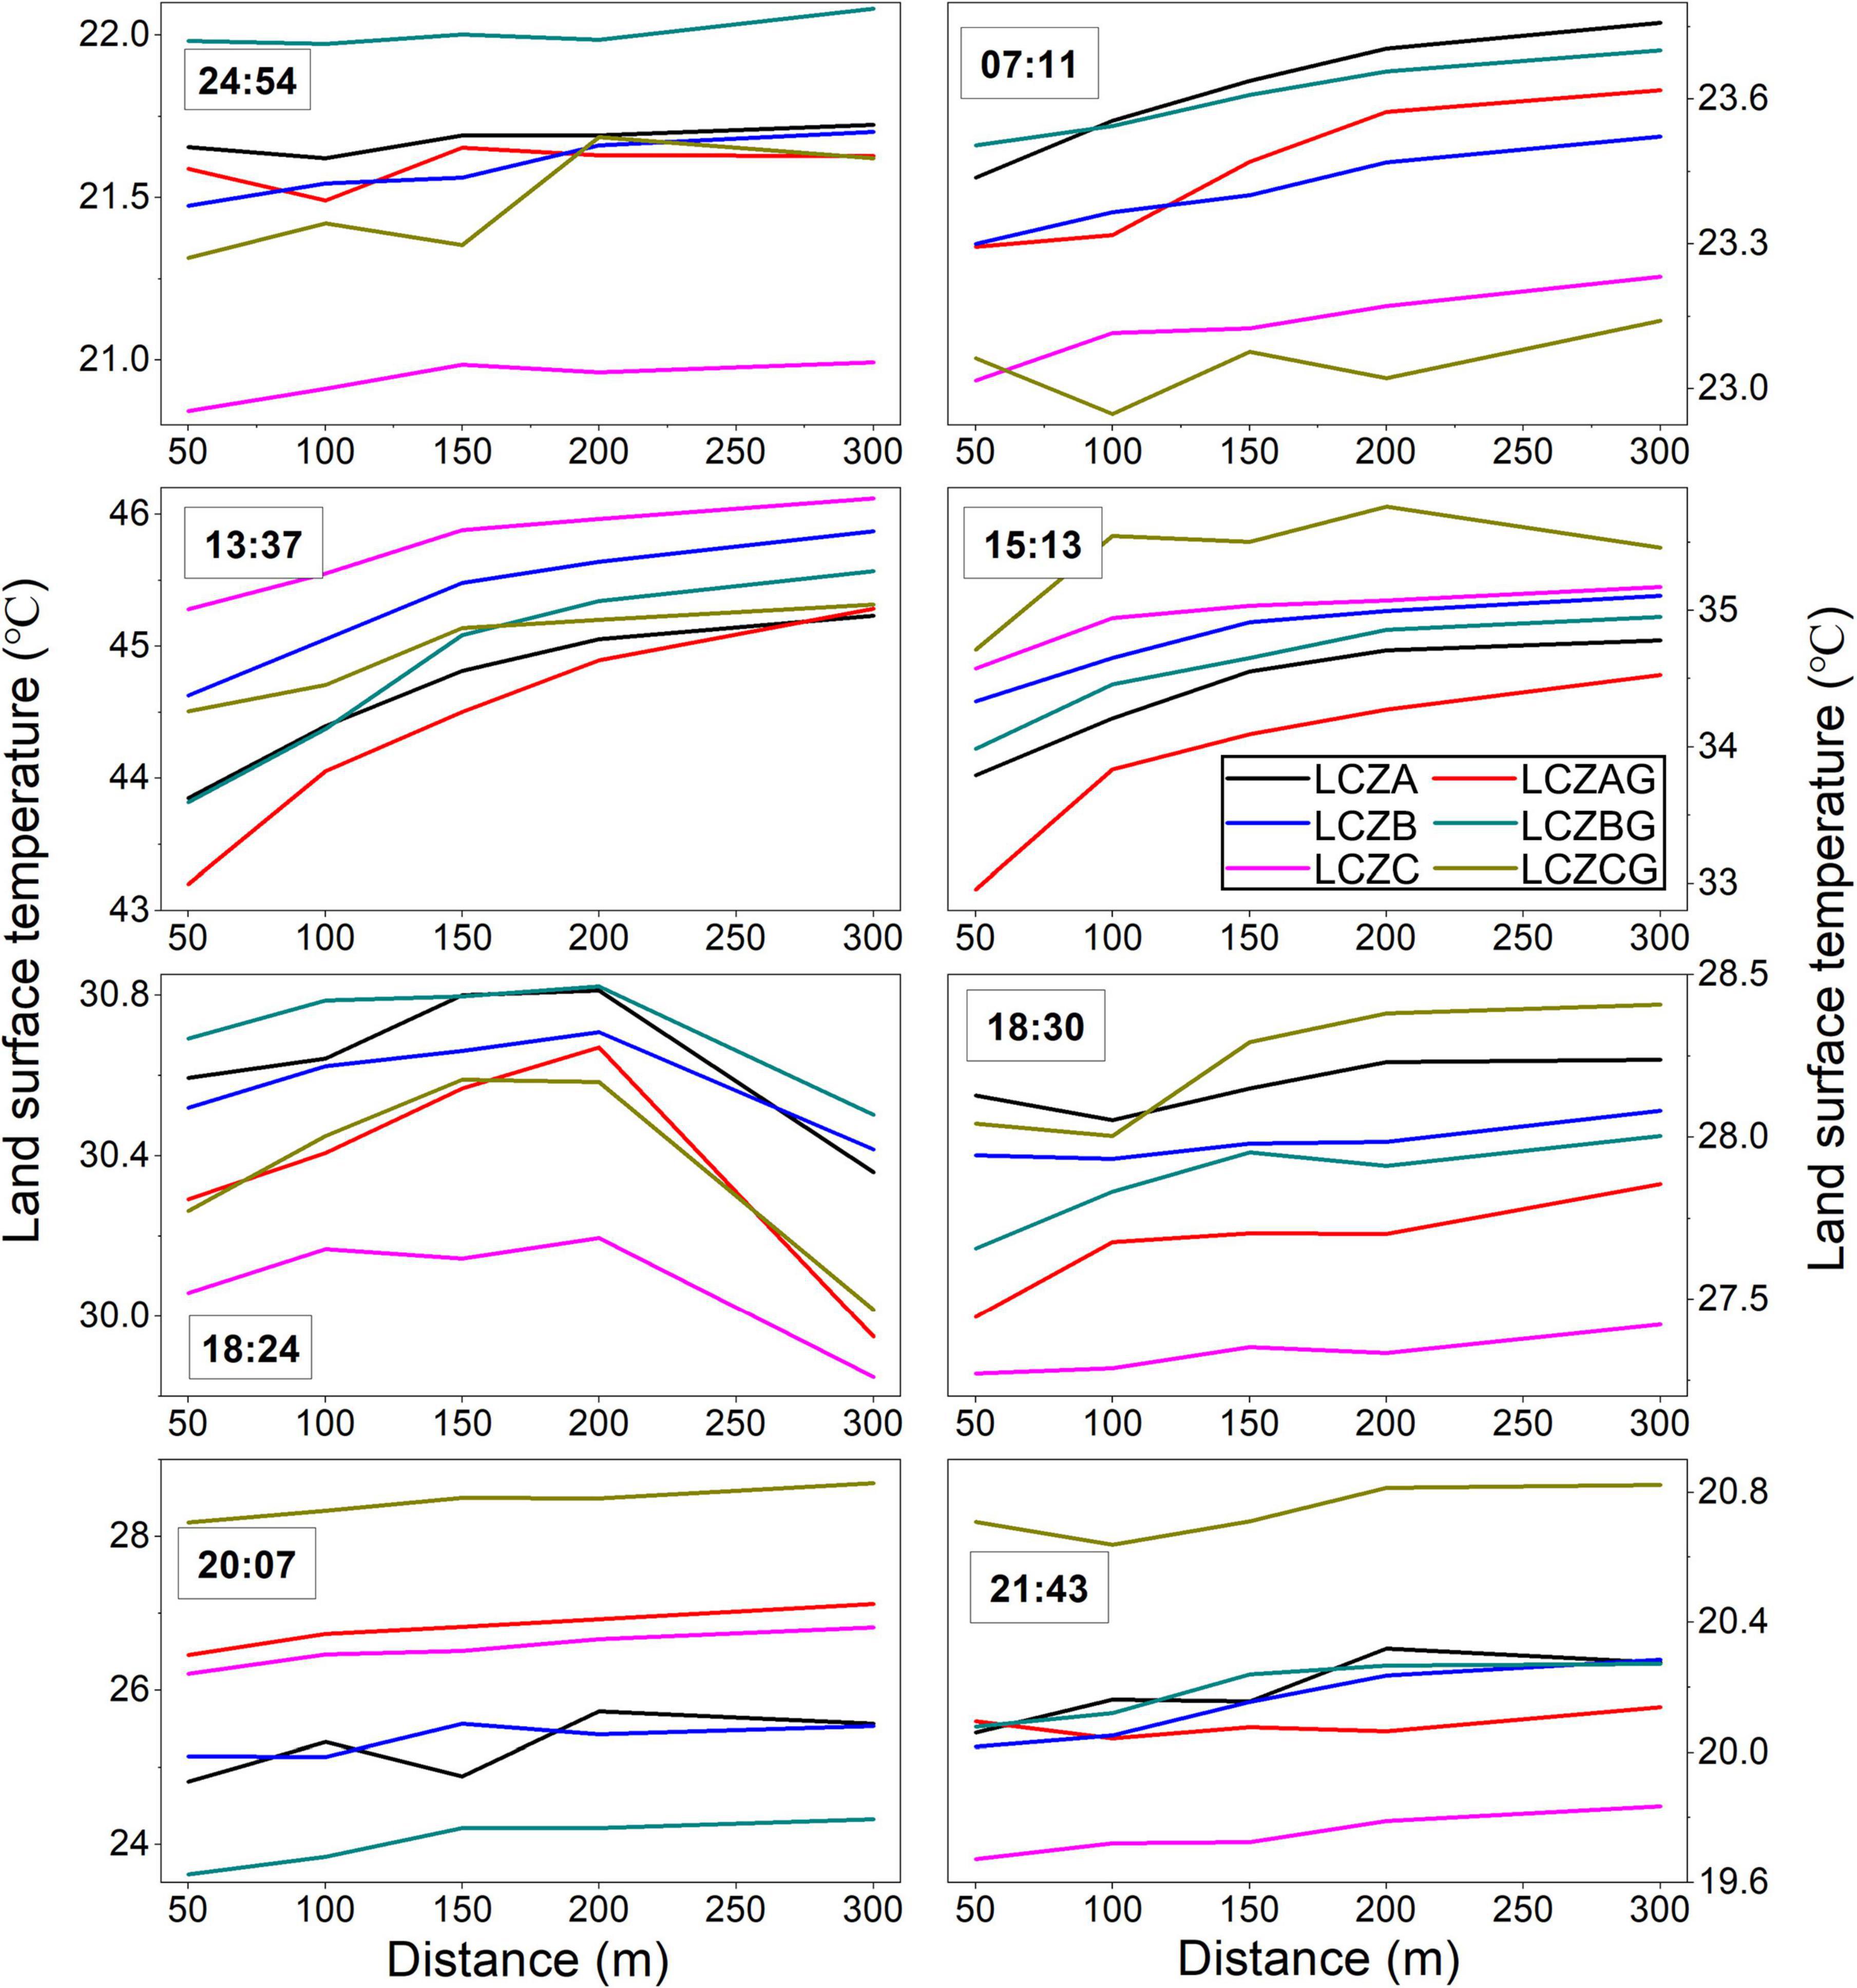
Figure 7. The mean land surface temperature round each park at different distances. The x axes present the distance from the regions to parks, e.g., 50 presents 0–50 m, 100 presents 50–100 m.
The spatial distribution of LST around different parks have been examined at the hottest time (13:37). The LST around LCZC and LCZCG had not been showed in Figure 8 due to the weaker CE in the daytime and the number of parks, respectively. The areas of all parks in the radar map were increasing with the increase of distance to parks, and have few increases for a distance of after 200 m. It indicated the same result as Figure 7 that the potential CE of parks could influence the outer regions of parks within a radius of 200 m. LST around LCZA was high in the south which was similar to LCZB, on the contrary, LST around LCZAG was relatively low, especially in the north and northwest. The CE of LCZBG was obviously weak in the west and southwest.
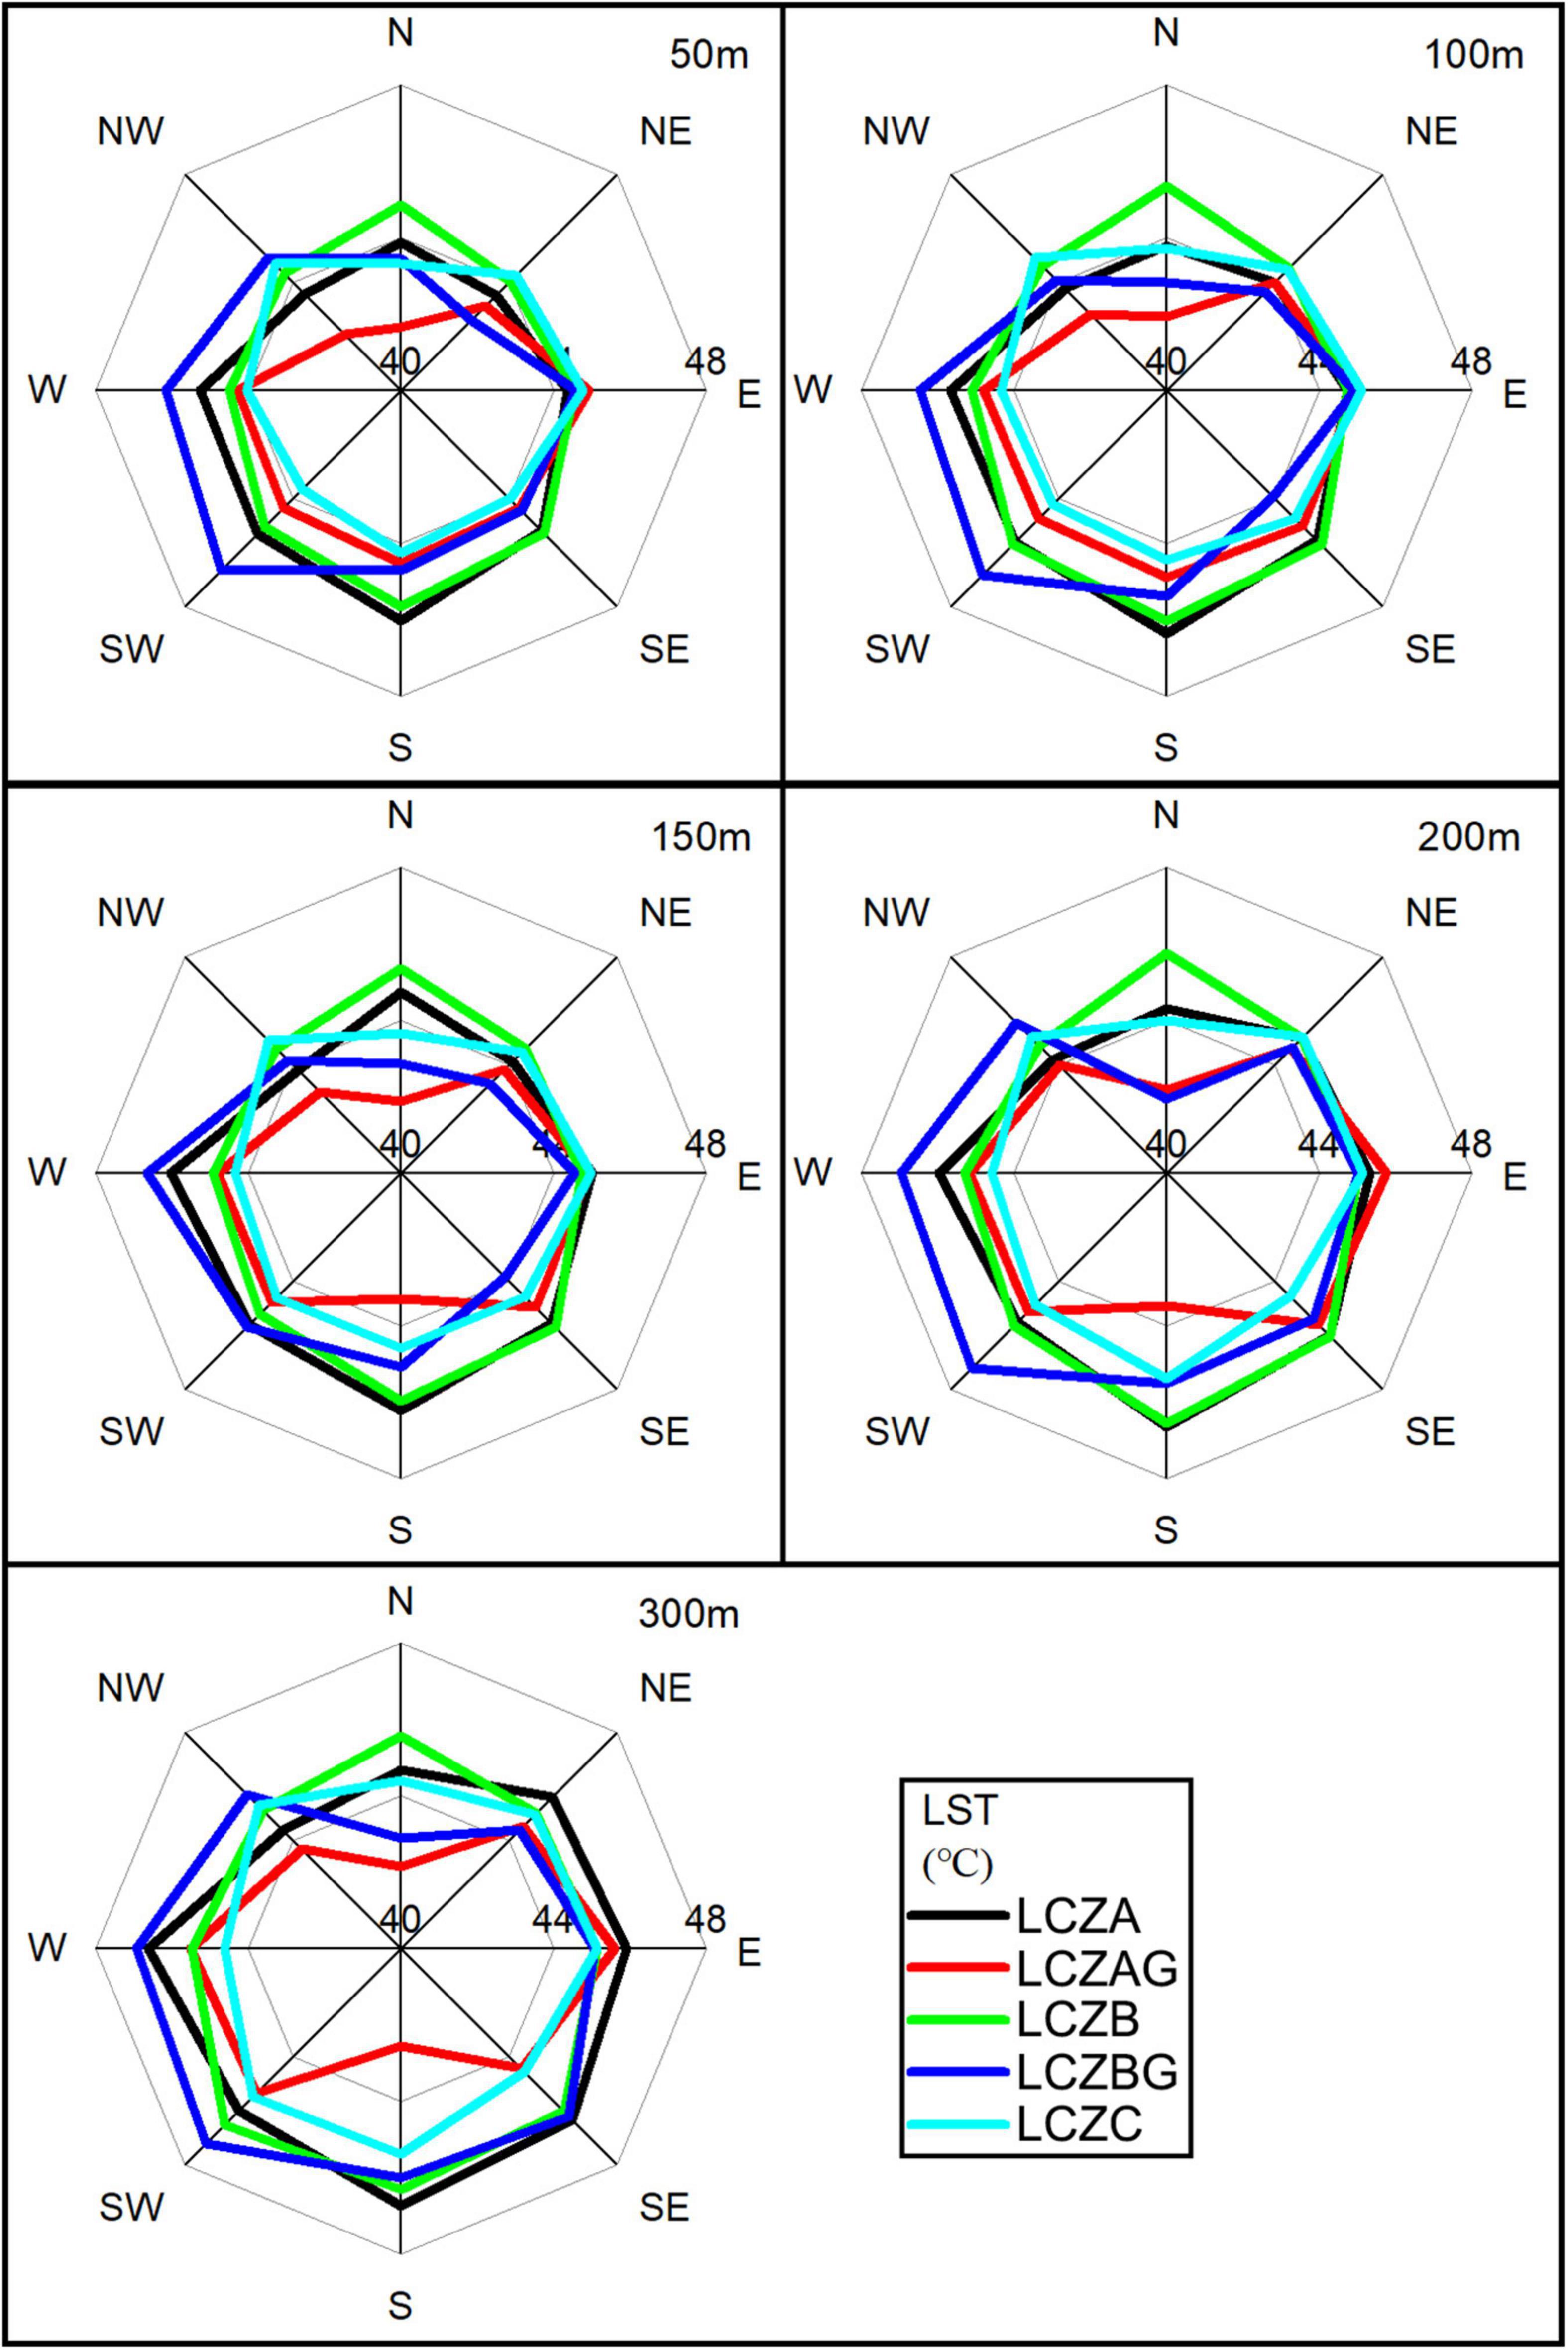
Figure 8. The distribution of LST around parks. Eight axes present the LST located around parks in eight direction.
The impacts of building form on urban parks
To make a further insight into the CE of urban parks, the building form around parks has been investigated as showed in Figure 9. The mean BH was lower at a distance of 50 m to parks mainly caused by the neighboring parks instead of buildings. It was seemed that higher buildings located in the north show few impacts on the LST, probably due to the direction of the summer monsoon breezing from the southeast. LCZAG showed better CE (Figure 7), but the effect was probably reduced by higher buildings in the east and west. Such an impact of buildings also occurred for LCZBG in the southwest. Higher buildings located around LCZA may be the reason that made the CE of LCZA similar to LCZB (Figure 8). The distribution of BH around LCZBG and LCZB showed few changes. In response to this, the distribution of LST around LCZBG and LCZB had insignificant changes at 50 m or 100 m. In addition, the distribution changes of BH at a further distance (e.g., 200 or 300 m) made less impact on the LST around parks. It is also suggested that the range of the CE of parks was limited.
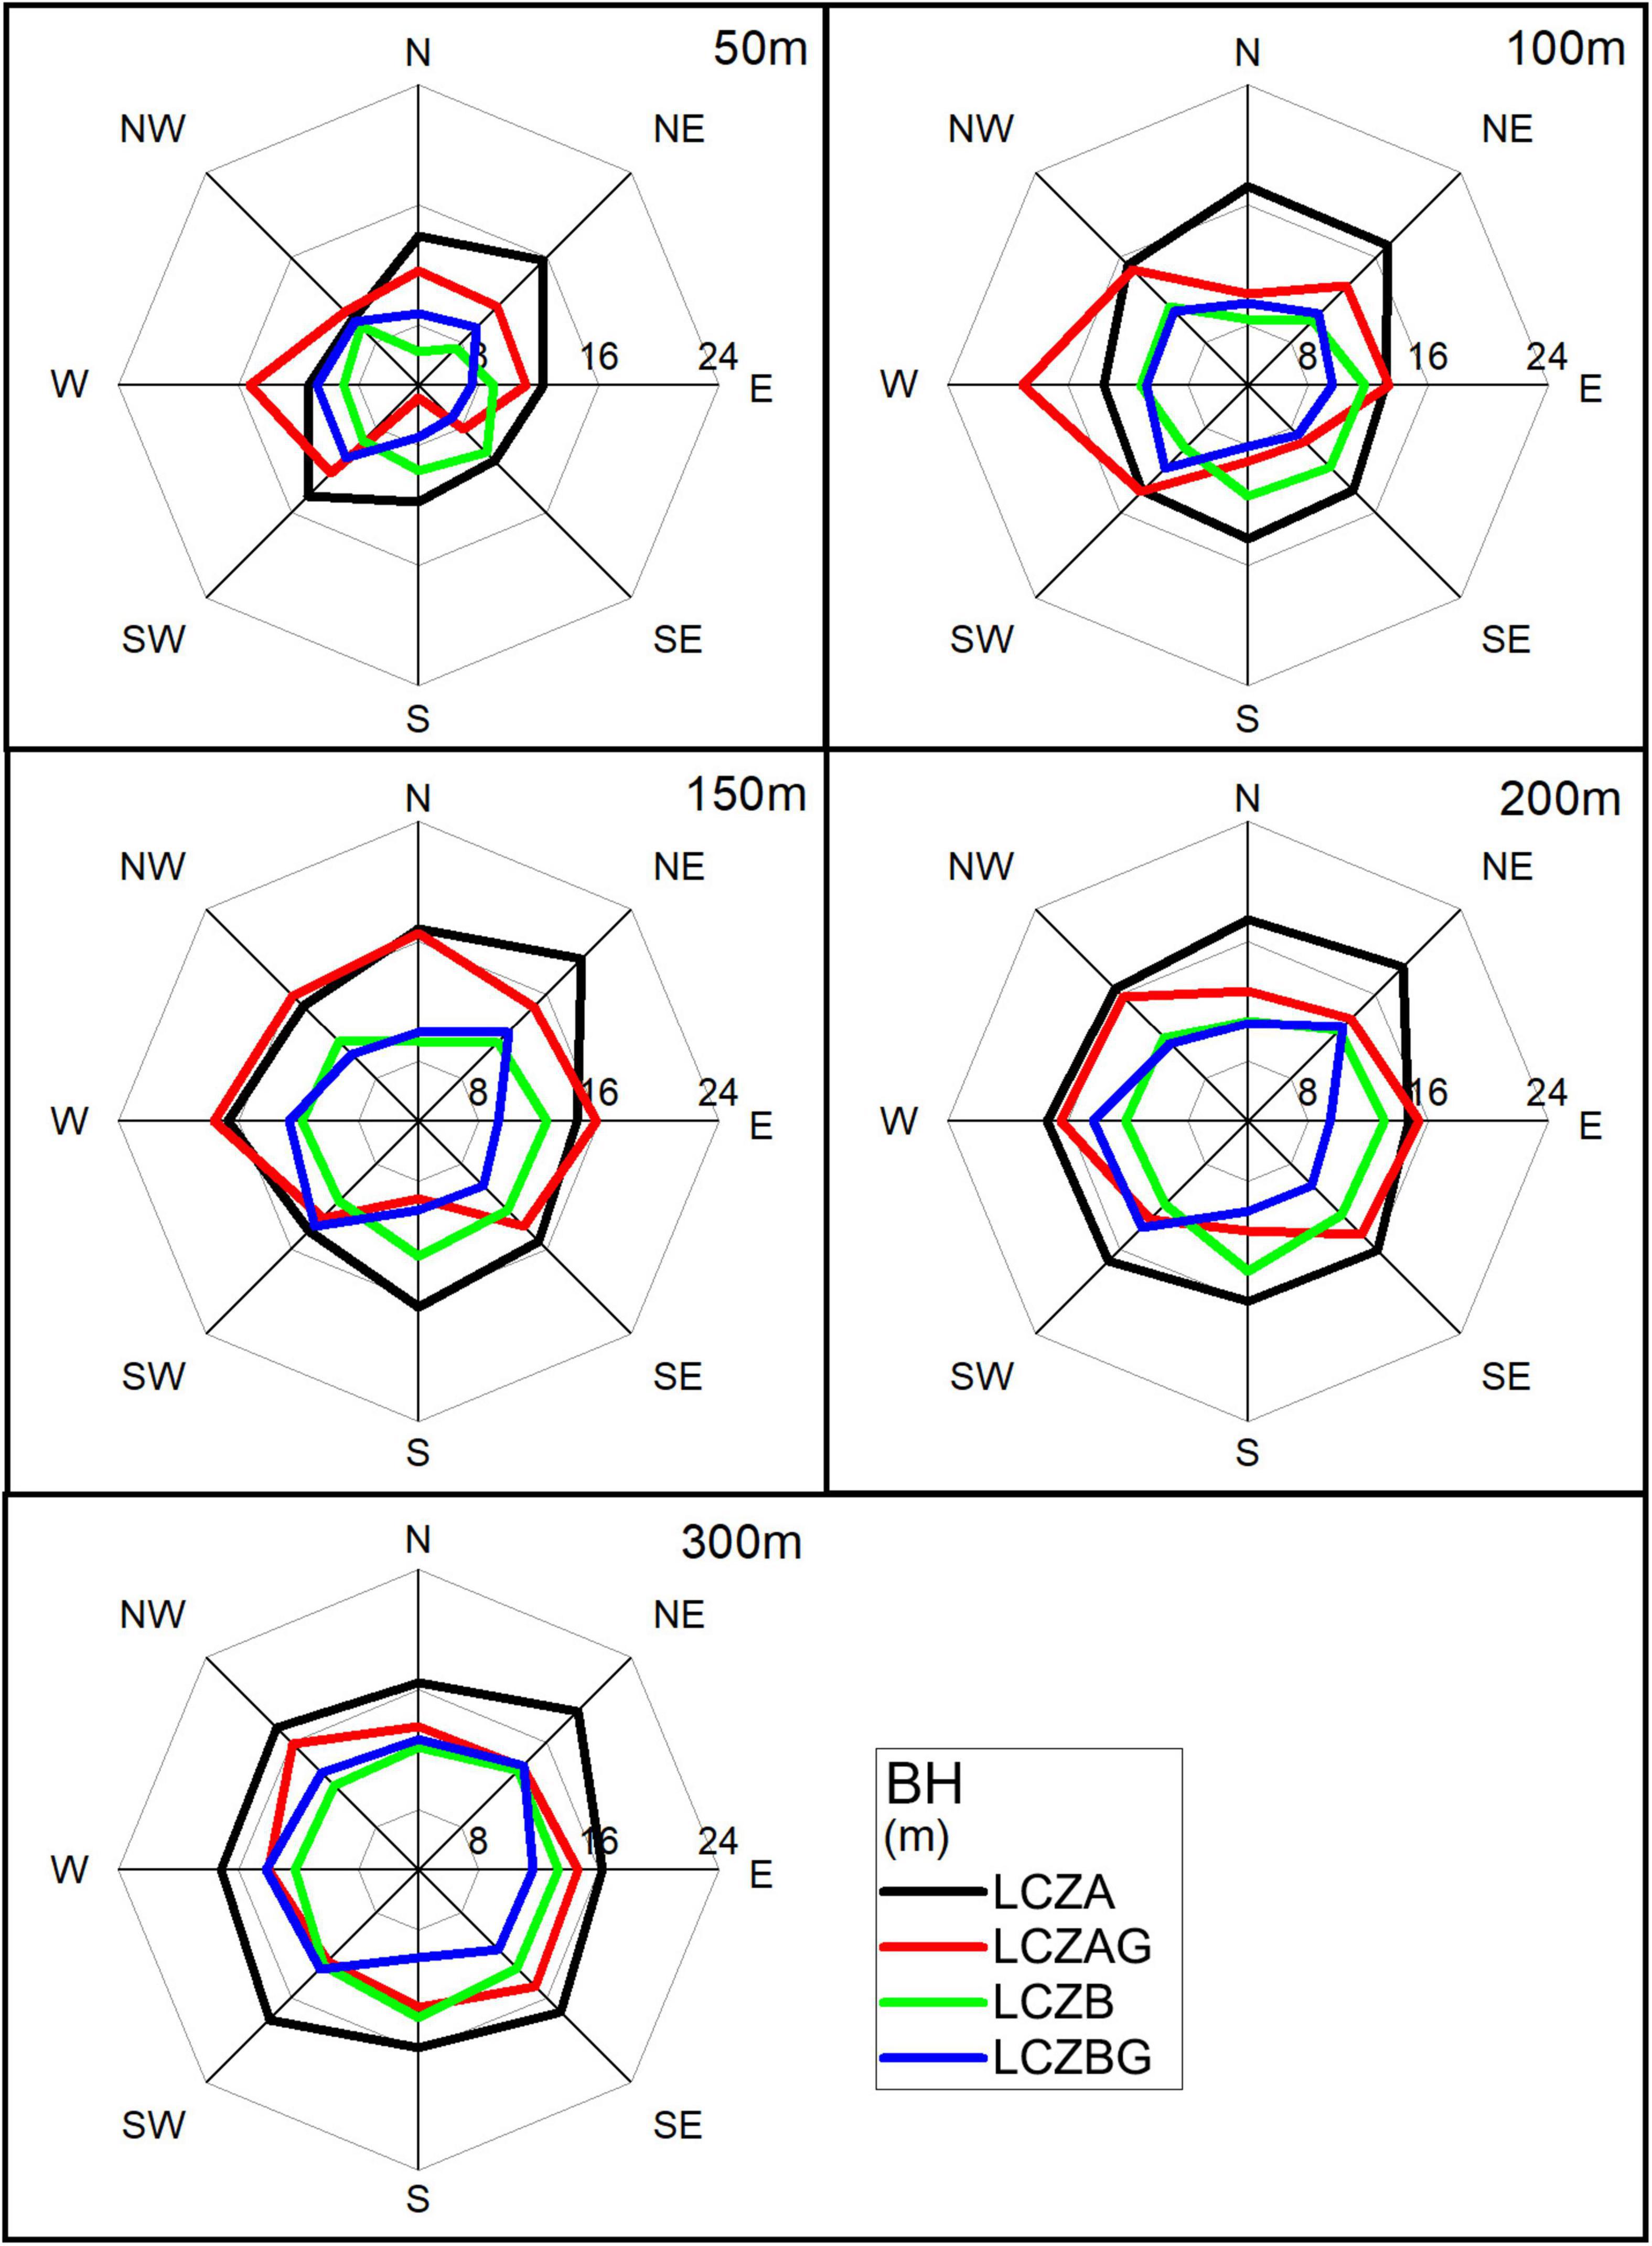
Figure 9. The distribution of BH around parks, and eight axes present the height of buildings located around parks in eight direction.
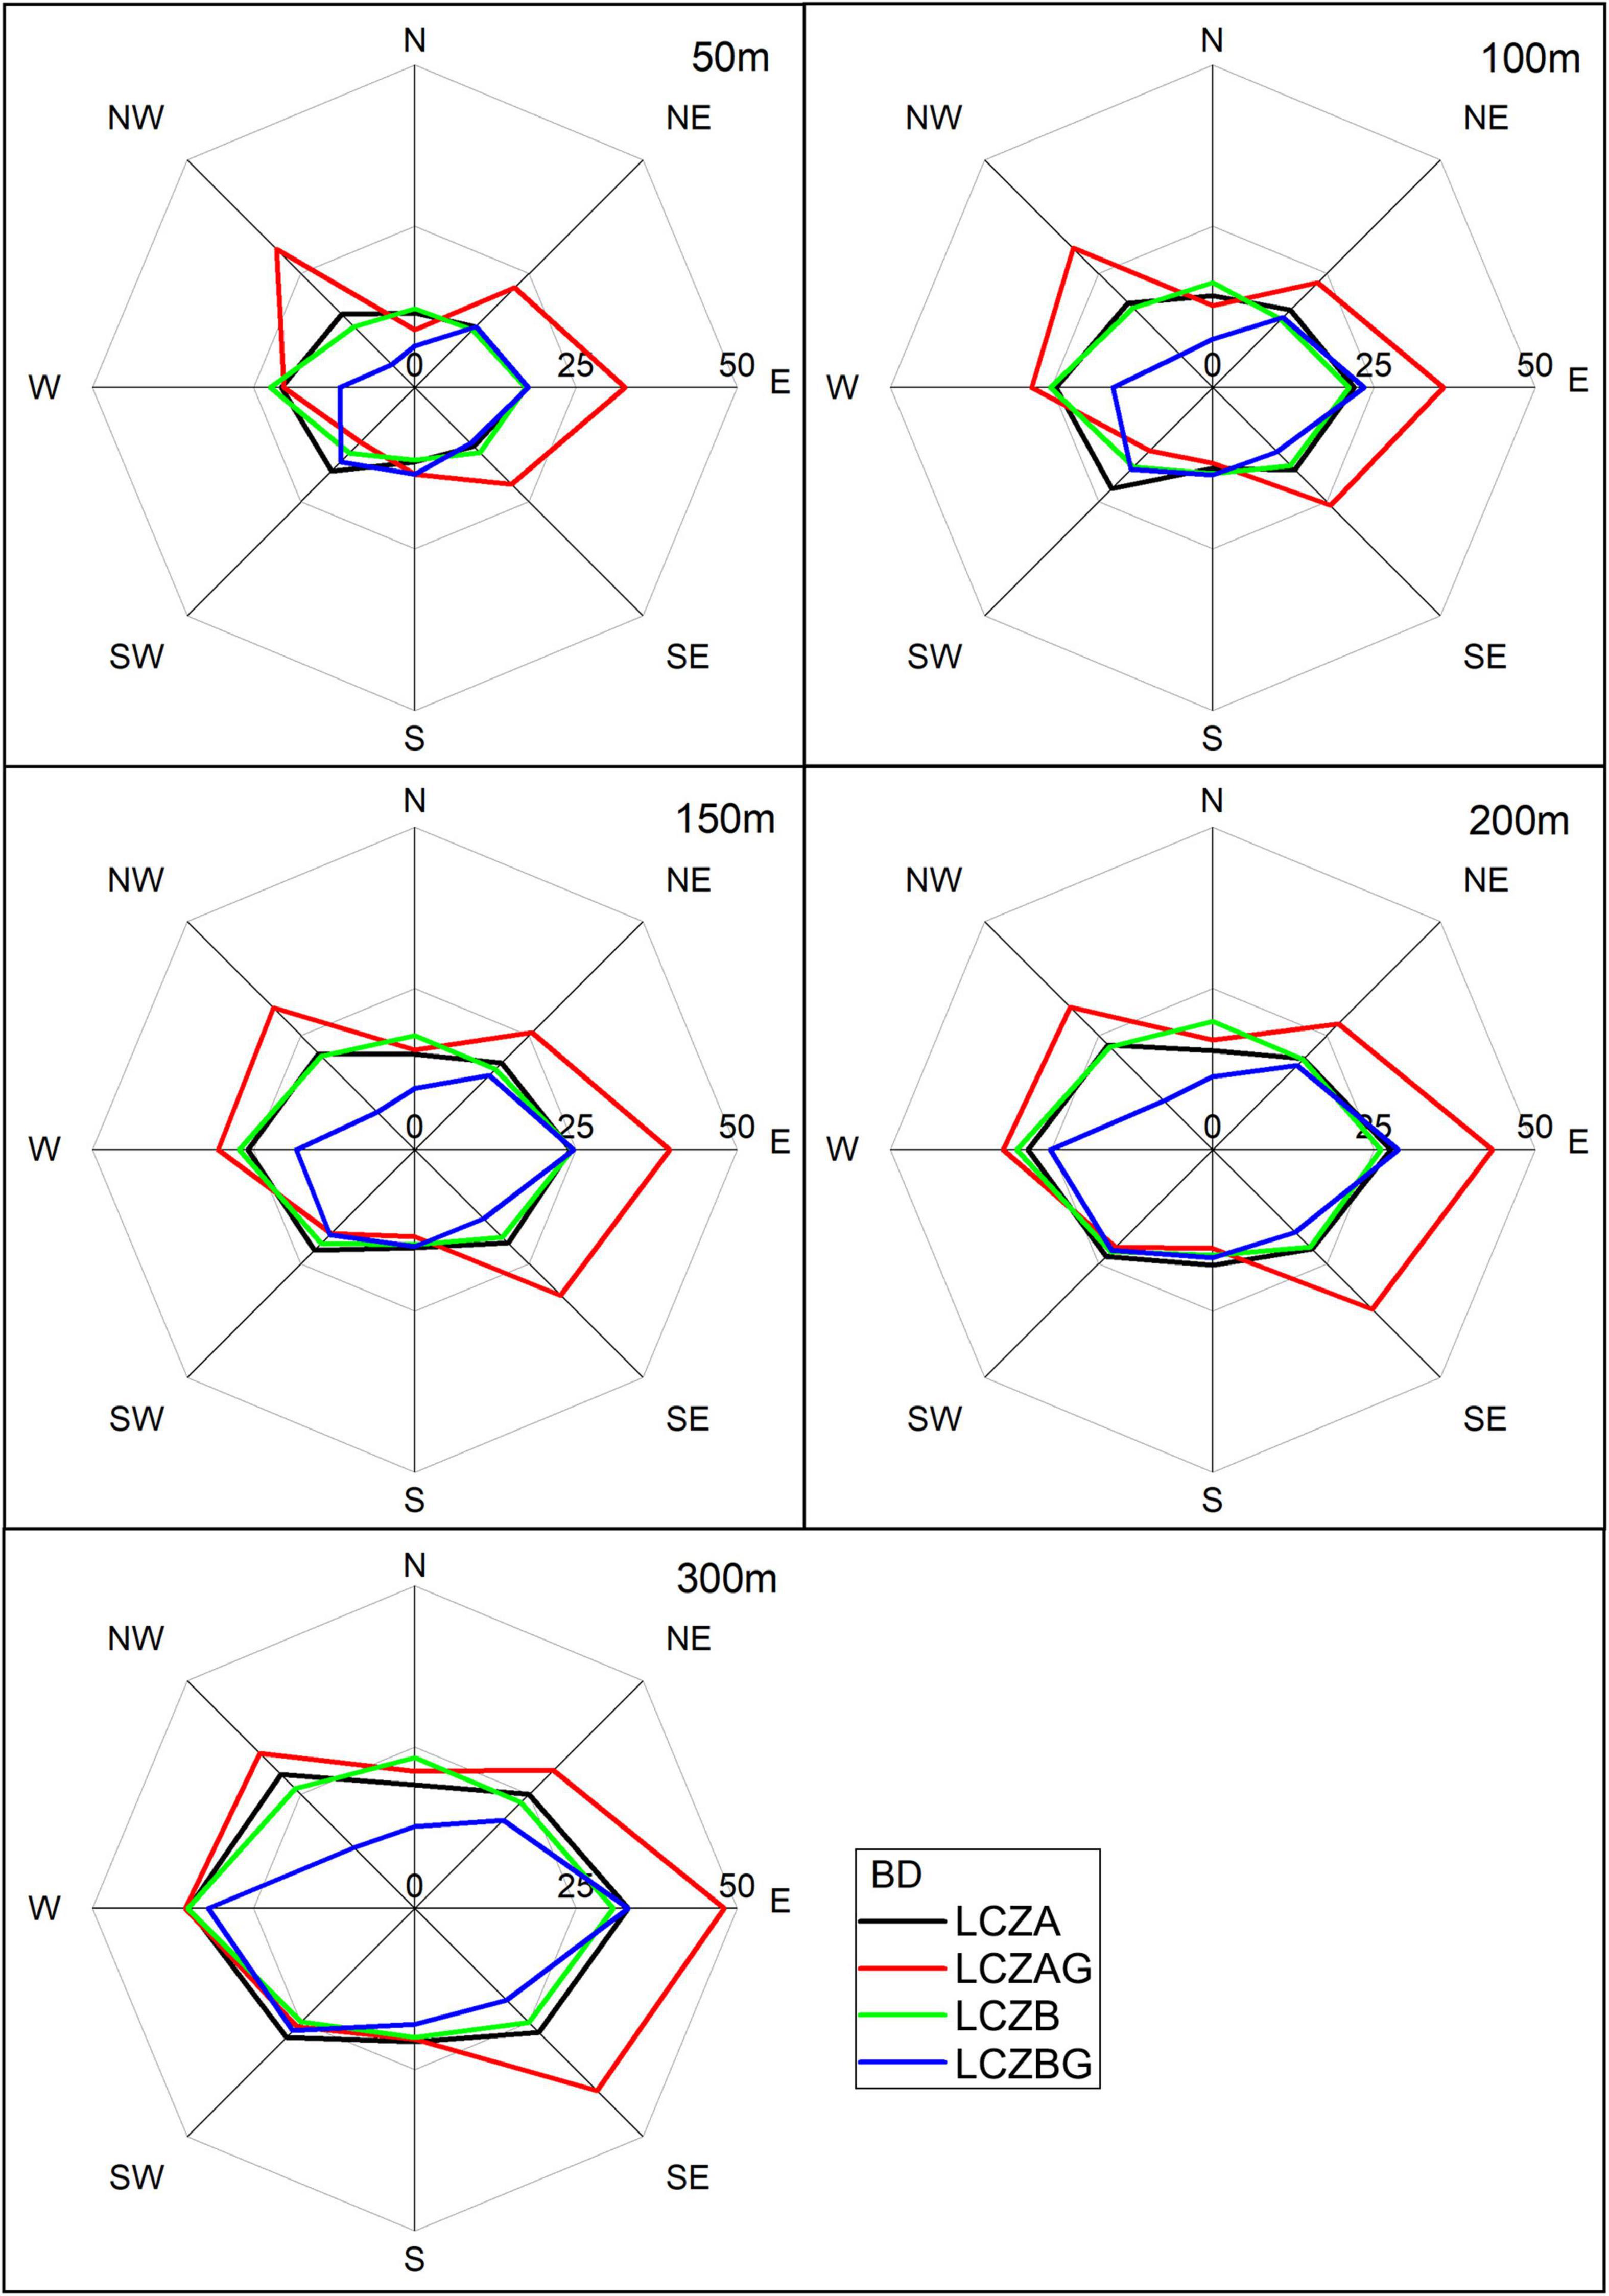
Figure 10 shows LCZBD indexes in eight directions around four types of urban parks. The closer to parks, the indexes were lower, and the indexes distributed on the north-south of parks were relatively low. The regions around LCZAG showed the highest indexes at different distances, especially on the east and southeast of parks, which probably led to weak CE of LCZAG in this direction as showed in Figure 8. LCZA and LCZB showed similar indexes, and this similarity occurred in the distribution of LST. Higher indexes were located in the southwest of LCZBG which was not consistent with the distribution of LST.
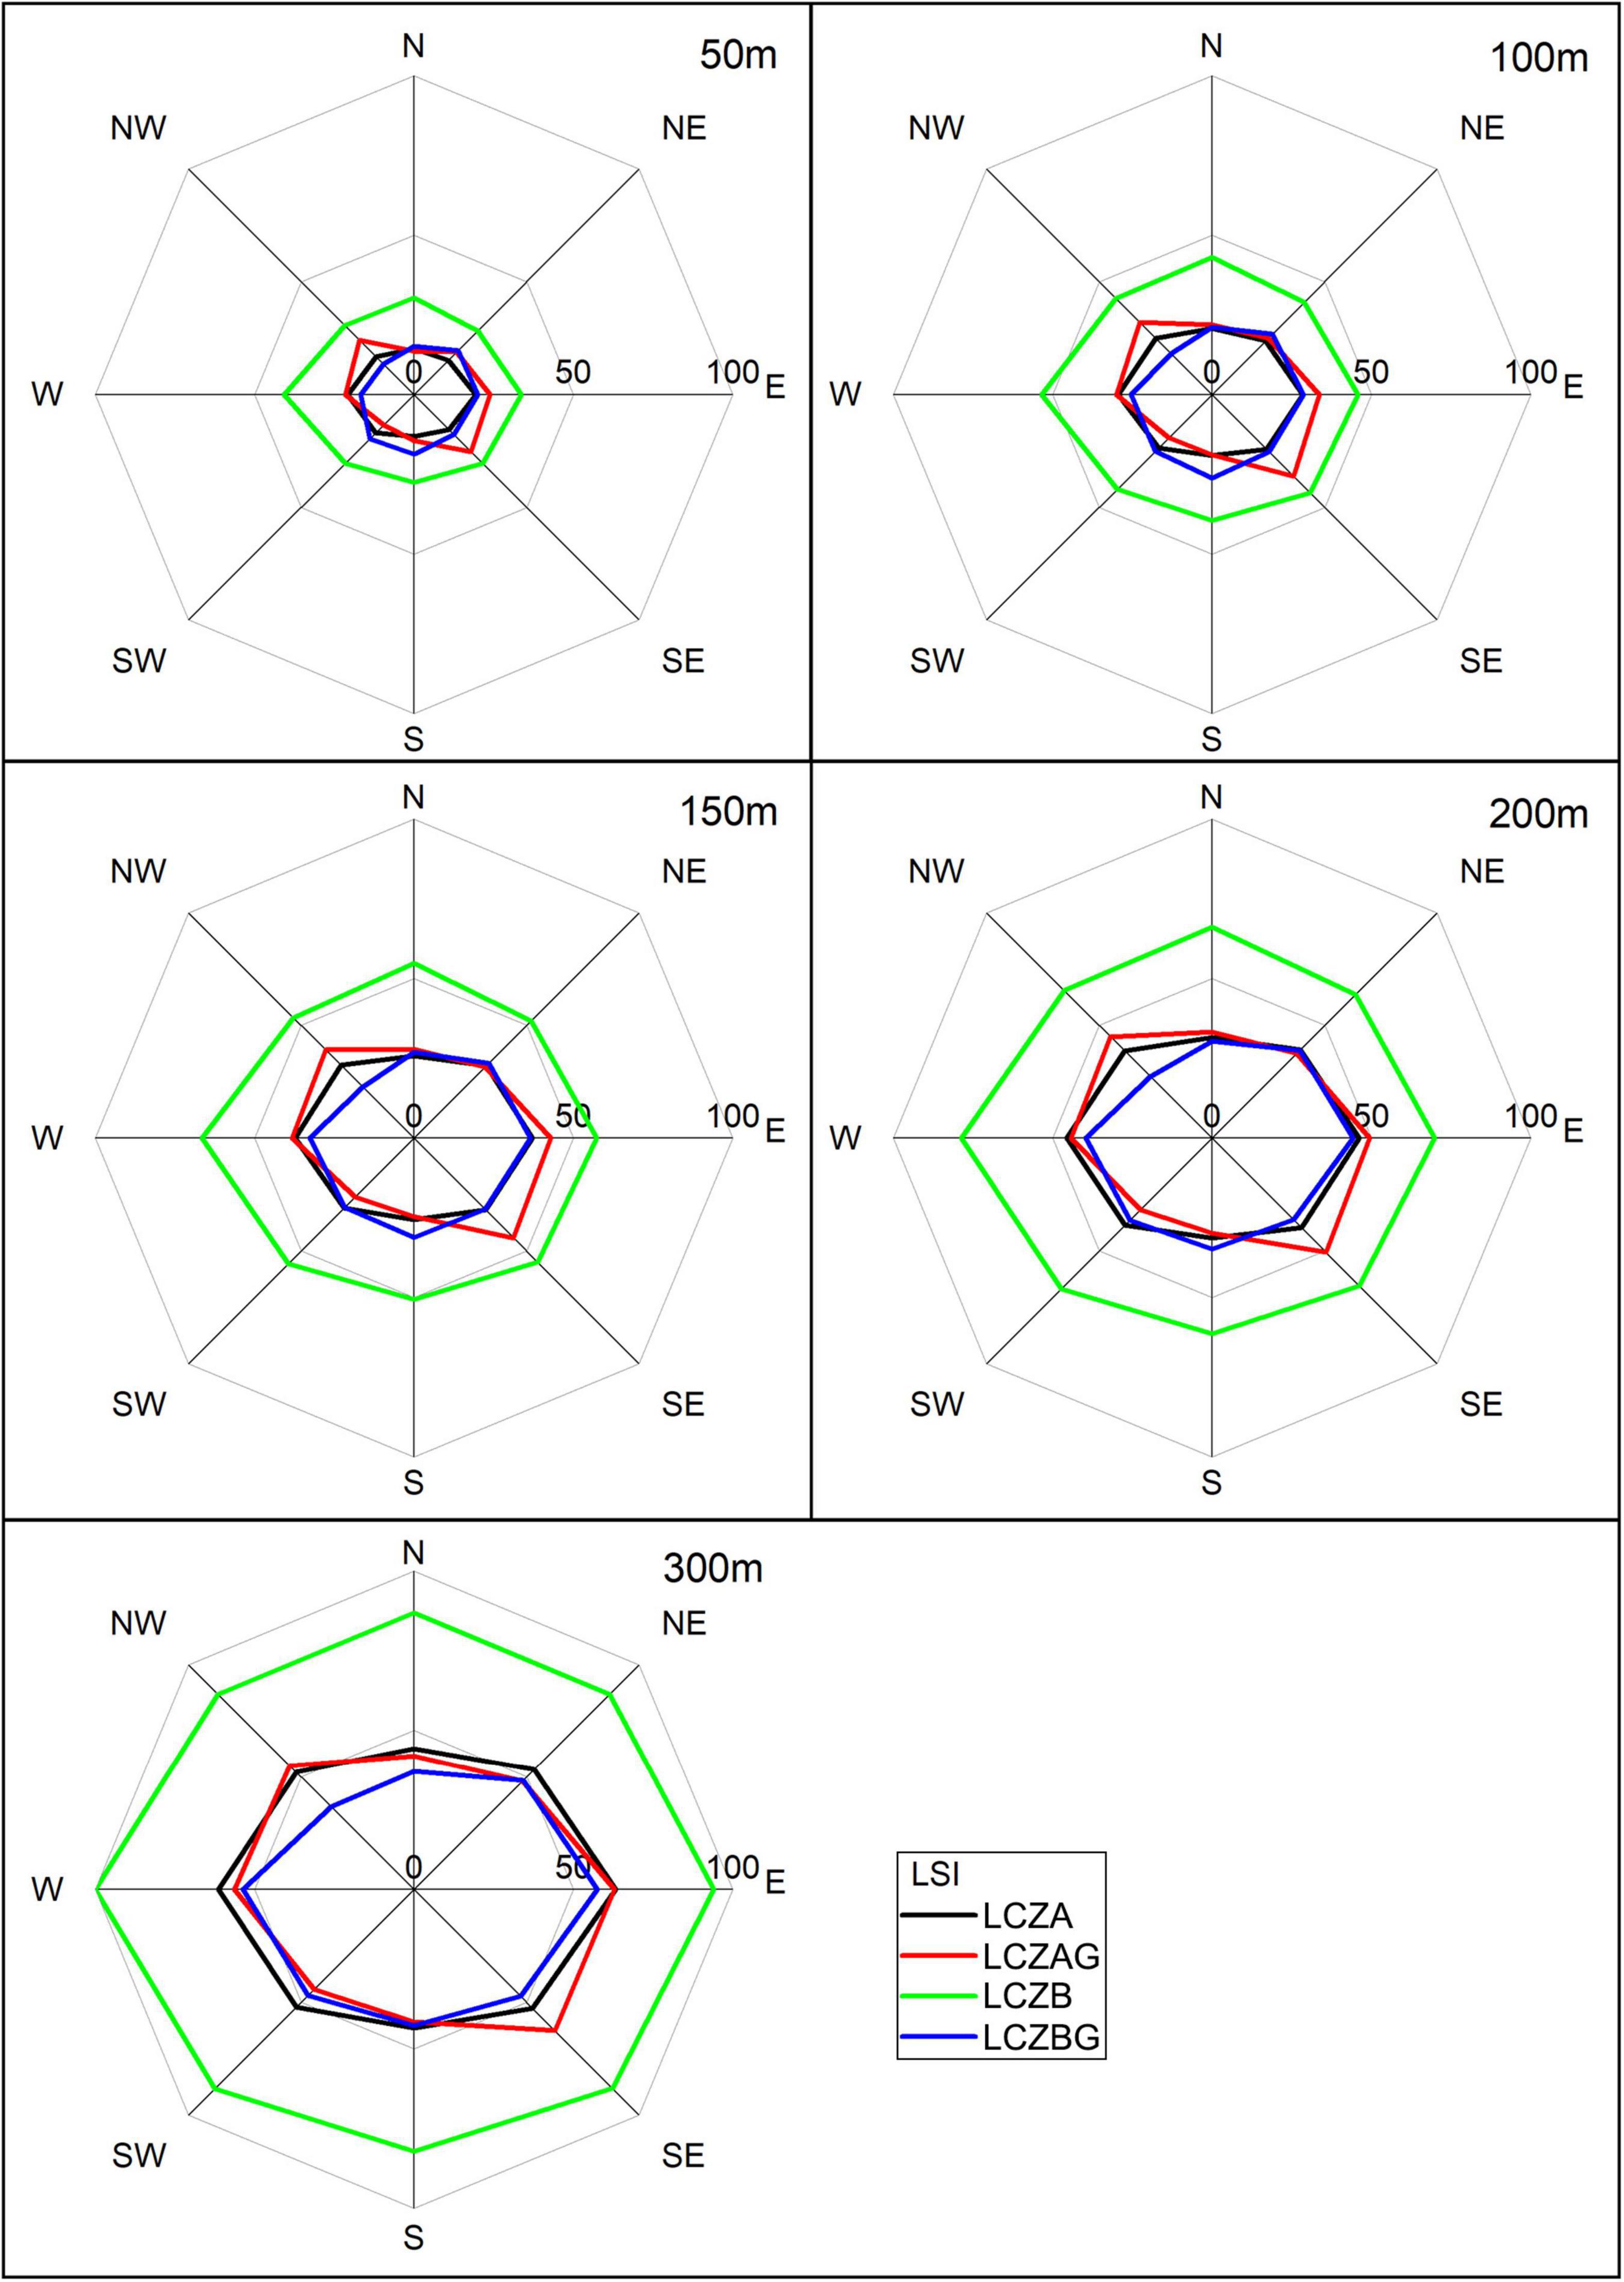
LSI of buildings around urban parks was showed in Figure 11. The indexes increased rapidly with distance to parks. The shape of buildings around LCZB was the most complicate in all directions. Higher indexes were located in the southeast of LCZA, and in other directions LCZAG, LCZA, and LCZBG showed similar indexes. However, the rapidly growing trend and the distribution of LSI showed insignificant relationships with LST around parks. It probably indicated the shape of buildings had weak impact on the CE of parks to a certain extent.
Discussion
Construction of land surface temperature diurnal variations data
Diurnal variations data of LST are constructed based on the data measured at different times when the satellite passed over the study area during a summer month with fine weather conditions. Although day-to-day variations exist in LST on different days, such variations show limited influence on the daily changing rule of LST (Hu et al., 2016; Chang et al., 2021). We also examine LST data during other summer months which are not used in this study due to data quality or similar measuring time, and the available parts of those data show the same daily changing rule of LST. Therefore, ECOSTRESS LST data can be used to analyze diurnal thermal impacts of other urban landscapes in different regions of the world. It is worth noting that rainfall has an obvious impact on the ECOSTRESS data, especially during summer rains, and the time interval of revisit could last up to 10 days in different regions, e.g., pass over Chengdu (30.67°N, 104.06°E) in the southwest of China at June 6 and 17, 2022. In addition, LST is influenced by meteorological factors, such as wind speed, air temperature, and relative humidity. However, hourly and daily meteorological data are not easily obtained due to data availability. The impacts of these factors on LST should be taken into account in future research.
Differences in cooling effect of parks
Large parks heat up slowly compared with the whole urban regions during the daytime and show a relatively lower mean LST at the hottest time. But LST in small parks shows an insignificant difference with peripheral regions suggesting that the CE of these parks is weakened by the surrounding environment. The result agrees with previous studies that the region should have a minimum radius of 200 m to avoid the influence of the surrounding environment (Oke and Cleugh, 1987; Stewart and Oke, 2012). The impacts between different area and shape of different LCZ should be studied in the future. To further evaluate the CE of urban parks, they have been divided into six LCZs. In the large parks, the higher vegetation coverage is corresponding the better CE (e.g., LCZAG and LCZA), and a certain amount of water can obviously strengthen the CE of parks with lower vegetation coverage (e.g., LCZBG and LCZCG). It is mainly due to the high specific heat capacity of water. It is also suggested that there should be more parks containing water to help mitigate UHI during daytime, and open spaces inside parks should belong to the water. The CE around parks is stronger within the distance of 150 m during daytime, and dominated by the vegetation coverage and types. The parks mainly composed of dense trees have better external CE (e.g., LCZAG and LCZA), and the water inside parks can magnify external CE to a certain extent. It should be noted that the external CE of different types of parks is not same in different directions. Furthermore, LCZBG shows better CE in the southeast compared with LCZAG, and all types of parks show similar CE in the east. It indicates that the external CE produced by the vegetation inside parks is significantly influenced by the external environment. Besides, water will make a warmer and damp environment inside parks at night, which will reduce the comfort of citizens. Therefore, further research is needed to explore heat exchange between parks and external environment, and to enhance the CE of different parks.
Spatial distribution optimization of parks
Urban landscapes would influence the thermal transitions between parks and their neighboring zones (Oke, 2006). Buildings are the dominant urban landscapes around the parks, and their heights impact the distribution of LST around Parks. The CE of parks seemed to be limited to a distance of 150–200 m on the basis of types of parks. Thus, in order to bring the parks’ CE into full play, it should build more parks containing certainly vegetation cover, water, and open space with a lower building located in the south. The height and density of buildings around parks in different directions were consistent with the distribution of LST in a specific direction for different parks. For example, higher buildings and more intensive buildings were corresponding to the higher LST on the west and southeast of LCZA, respectively, at a distance of 50 m. Furthermore, the influence factors on the CE of parks are comprehensive including the distance between buildings, dense, volumetric fraction, vegetation structure, and other open spaces. Therefore, it is necessary to evaluate the CE of each urban parks considering as many factors as possible in regions with different scales, and to quantify the impacts of building characteristics on the CE of different parks in further study. These studies are important to mitigate the urban heat island effects.
Conclusion
ECOSTRESS LST data can provide vital data to improve our understanding of the diurnal variations of LST in urban regions. This study aimed to construct synoptic LST data in the fifth ring of Beijing to investigate the CE of different urban parks, which is important for the research on urban heat mitigation strategies. An artificial intelligence method was used to help classify parks into six LCZs based on the park form. The CE of urban parks was obvious in the daytime, especially during the hottest time, and the heating effect occurred inside parks with certain water. The CE of all parks was stronger within 150 m and sharply reduced with the distance increased. The combination of vegetation and water was advantageous to enhance the CE. The impacts of the height, density, and shape of building distributed in different parks and different directions have been examined. The CE of urban parks were obviously influenced by higher and denser buildings.
Data availability statement
The original contributions presented in this study are included in the article/supplementary material, further inquiries can be directed to the corresponding author/s.
Author contributions
YL: conceptualization, methodology, and writing the original draft. XX: data curation and analysis. FW: investigation and formal analysis. ZQ: software and formal analysis. HA: analysis, supervision, and revising the manuscript. DH: conceptualization, supervision, and revising the manuscript. JL: software. All authors contributed to the article and approved the submitted version.
Funding
This research was funded by the National Natural Science Foundation of China (No. 41971389), Strategic Priority Research Program of the Chinese Academy of Sciences (No. XDA20010302), and Agricultural Science and Technology Innovation Project of Shandong Academy of Agricultural Sciences (No. CXGC2022E07).
Acknowledgments
We are grateful to the editor and reviewers for their valuable comments and suggestions.
Conflict of interest
The authors declare that the research was conducted in the absence of any commercial or financial relationships that could be construed as a potential conflict of interest.
Publisher’s note
All claims expressed in this article are solely those of the authors and do not necessarily represent those of their affiliated organizations, or those of the publisher, the editors and the reviewers. Any product that may be evaluated in this article, or claim that may be made by its manufacturer, is not guaranteed or endorsed by the publisher.
Footnotes
- ^ http://www.stats.gov.cn/
- ^ https://lpdaac.usgs.gov/
- ^ https://lbsyun.baidu.com/
- ^ http://lbs.tianditu.gov.cn/
- ^ www.resdc.cn
References
Amani-Beni, M., Zhang, B., Xie, G.-D., and Odgaard, A. J. (2021). Impacts of the microclimate of a large urban park on its surrounding built environment in the summertime. Remote Sens. 13:4703. doi: 10.3390/rs13224703
Buo, I., Sagris, V., Burdun, I., and Uuemaa, E. (2021). Estimating the expansion of urban areas and urban heat islands (UHI) in Ghana: A case study. Nat. Hazards 105, 1299–1321. doi: 10.1007/s11069-020-04355-4
Chan, S. Y., and Chau, C. K. (2021). On the study of the effects of microclimate and park and surrounding building configuration on thermal comfort in urban parks. Sustain. Cities Soc. 64:102512. doi: 10.1016/j.scs.2020.102512
Chang, C.-R., and Li, M.-H. (2014). Effects of urban parks on the local urban thermal environment. Urban For. Urban Greening 13, 672–681. doi: 10.1016/j.ufug.2014.08.001
Chang, Y., Xiao, J., Li, X., Middel, A., and He, S. (2021). Exploring diurnal thermal variations in urban local climate zones with ECOSTRESS land surface temperature data. Remote Sens. Environ. 263:112544.
Chen, L., Wen, Y., Zhang, L., and Xiang, W.-N. (2015). Studies of thermal comfort and space use in an urban park square in cool and cold seasons in Shanghai. Build. Environ. 94, 644–653. doi: 10.1016/j.buildenv.2015.10.020
Chen, Y., Yang, J., Yang, R., Xiao, X., and Xia, J. (2022). Contribution of urban functional zones to the spatial distribution of urban thermal environment. Build. Environ. 216:109000. doi: 10.1016/j.buildenv.2022.109000
Cheng, B., Gou, Z., Zhang, F., Feng, Q., and Huang, Z. (2019). Thermal comfort in urban mountain parks in the hot summer and cold winter climate. Sustain. Cities Soc. 51:101756. doi: 10.1016/j.scs.2019.101756
Cheng, X., Wei, B., Chen, G., Li, J., and Song, C. (2015). Influence of Park Size and Its Surrounding Urban Landscape Patterns on the Park Cooling Effect. J. Urban Planning Dev. 141:A4014002. doi: 10.1061/(asce)up.1943-5444.0000256
Dai, Z. X., Guldmann, J. M., and Hu, Y. F. (2018). Spatial regression models of park and land-use impacts on the urban heat island in central Beijing. Sci. Total Environ. 626, 1136–1147. doi: 10.1016/j.scitotenv.2018.01.165
Feng, X., and Myint, S. W. (2016). Exploring the effect of neighboring land cover pattern on land surface temperature of central building objects. Build. Environ. 95, 346–354. doi: 10.1016/j.buildenv.2015.09.019
Gao, Z., Zaitchik, B. F., Hou, Y., and Chen, W. (2022). Toward park design optimization to mitigate the urban heat Island: Assessment of the cooling effect in five US cities. Sustain. Cities Soc. 81:103870. doi: 10.1016/j.scs.2022.103870
Han, D., Yang, X., Cai, H., and Xu, X. (2020). Impacts of neighboring buildings on the cold island effect of central parks: A case study of beijing. China. Sustain. 12:9499.
He, B. J., Wang, J., Liu, H., and Ulpiani, G. (2020). Localized synergies between heat waves and urban heat islands: Implications on human thermal comfort and urban heat management. Environ. Res. 193:110584. doi: 10.1016/j.envres.2020.110584
He, B.-J., Wang, J., Zhu, J., and Qi, J. (2022). Beating the urban heat: Situation, background, impacts and the way forward in China. Renew. Sustain. Energy Rev. 161:112350. doi: 10.1016/j.rser.2022.112350
He, K., Zhang, X., Ren, S., and Sun, J. (2016). Deep Residual Learning for Image Recognition. arXiv [Preprint]. doi: 10.48550/arXiv.1512.03385
Hook, S. J., Cawse-Nicholson, K., Barsi, J., Radocinski, R., Hulley, G. C., Johnson, W. R., et al. (2020). In-Flight validation of the ecostress, landsats 7 and 8 thermal infrared spectral channels using the lake tahoe ca/nv and salton sea ca automated validation sites. IEEE Trans. Geosci. Remote Sens. 58, 1294–1302.
Hu, L., Monaghan, A., Voogt, J., and Barlage, M. (2016). A first satellite-based observational assessment of urban thermal anisotropy. Remote Sens. Environ. 181, 111–121. doi: 10.1016/j.rse.2016.03.043
Kong, H., Choi, N., and Park, S. (2021). Thermal environment analysis of landscape parameters of an urban park in summer-A case study in Suwon, Republic of Korea. Urban For. Urban Greening 65:127377. doi: 10.1016/j.ufug.2021.127377
Li, Y. L., Fan, S. X., Li, K., Zhang, Y., Kong, L. X., Xie, Y. F., et al. (2021). Large urban parks summertime cool and wet island intensity and its influencing factors in Beijing, China. Urban For. Urban Greening 65:127375.
Lin, P., Song, D., and Qin, H. (2021). Impact of parking and greening design strategies on summertime outdoor thermal condition in old mid-rise residential estates. Urban For. Urban Greening 63:127200. doi: 10.1016/j.ufug.2021.127200
Luo, X., Yang, J., Sun, W., and He, B. (2021). Suitability of human settlements in mountainous areas from the perspective of ventilation: A case study of the main urban area of Chongqing. J. Clean. Produc. 310:127467. doi: 10.1016/j.jclepro.2021.127467
Mackey, C., Lee, X., and Smith, R. (2012). Remotely sensing the cooling effects of city scale efforts to reduce urban heat island. Fuel Energy Abstr. 49, 348–358. doi: 10.1016/j.buildenv.2011.08.004
Maharjan, M., Aryal, A., Shakya, B., Talchabhadel, R., and Thapa, B. (2021). Evaluation of urban heat island (uhi) using satellite images in densely populated cities of south asia. Earth 2021, 86–110. doi: 10.3390/earth2010006
Oke, T. R. (1982). The energetic basis of the urban heat island. Quart. J. R. Meteorol. Soc. 108, 1–24. doi: 10.1002/qj.49710845502
Oke, T., and Cleugh, H. (1987). Urban heat storage derived as energy residuals. Bound. Lay. Meteorol. 39, 233–245. doi: 10.1007/BF00116120
Oke, T. R. (2006). Towards better scientific communication in urban climate. Theor. Appl. Climatol. 84, 179–190.
Peng, J., Dan, Y., Qiao, R., Liu, Y., Dong, J., and Wu, J. (2021). How to quantify the cooling effect of urban parks? Linking maximum and accumulation perspectives. Remote Sens. Environ. 252:112135. doi: 10.1016/j.rse.2020.112135
Qiao, Z., Han, X., Wu, C., Luo, L., Xu, X., Sun, Z., et al. (2020). Scale effects of the relationships between 3d building morphology and urban heat island: A case study of provincial capital cities of mainland china. Complexity 2020, 1–12. doi: 10.1155/2020/9326793
Qiao, Z., Wu, C., Zhao, D., Xu, X., Yang, J., Feng, L., et al. (2019). Determining the boundary and probability of surface urban heat island footprint based on a logistic model. Remote Sens. 11:1368. doi: 10.3390/rs11111368
Qiao, Z., Xu, X., Luo, W., Wang, F., Luo, L., and Sun, Z. (2017). Urban ventilation network model: A case study of the core zone of capital function in Beijing metropolitan area. J. Clean. Produc. 168, 526–535. doi: 10.1016/j.jclepro.2017.09.006
Qin, H., Cheng, X., Han, G., Wang, Y., Deng, J., and Yang, Y. (2021). How thermal conditions affect the spatial-temporal distribution of visitors in urban parks: A case study in Chongqing, China. Urban For. Urban Greening 66:127393. doi: 10.1016/j.ufug.2021.127393
Stewart, I. D. (2011). Redefining the Urban Heat Island, Ph D. thesis. Vancouver, BC: University of British Columbia
Stewart, I. D., and Oke, T. (2012). Local climate zones for urban temperature studies. Bull. Am. Meteorol. Soc. 93, 1879–1900.
Wu, Z., Yao, L., and Ren, Y. (2020). Characterizing the spatial heterogeneity and controlling factors of land surface temperature clusters: A case study in Beijing. Build. Environ. 169:106598.
Xu, M., Hong, B., Mi, J., and Yan, S. (2018). Outdoor thermal comfort in an urban park during winter in cold regions of China. Sustain. Cities Soc. 43, 208–220. doi: 10.1016/j.scs.2018.08.034
Xu, X. L., Cai, H. Y., Qiao, Z., Wang, L., Jin, C., Ge, Y. N., et al. (2017). Impacts of park landscape structure on thermal environment using QuickBird and Landsat images. Chin. Geographical. Sci. 27, 818–826. doi: 10.1007/s11769-017-0910-x
Yan, H., Wu, F., and Dong, L. (2018). Influence of a large urban park on the local urban thermal environment. Sci. Total Environ. 622, 882–891. doi: 10.1016/j.scitotenv.2017.11.327
Yang, J., Wang, Y., Xue, B., Li, Y., Xiao, X., Xia, J., et al. (2021b). Contribution of urban ventilation to the thermal environment and urban energy demand: Different climate background perspectives. Sci. Total Environ. 795:148791. doi: 10.1016/j.scitotenv.2021.148791
Yang, J., Hu, X., Feng, H., and Marvin, S. (2021a). Verifying an ENVI-met simulation of the thermal environment of Yanzhong Square Park in Shanghai. Urban For. Urban Greening 66:127384. doi: 10.1016/j.ufug.2021.127384
Yang, J., Yang, Y., Sun, D., Jin, C., and Xiao, X. (2021c). Influence of urban morphological characteristics on thermal environment. Sustain. Cities Soc. 72:103045. doi: 10.1016/j.scs.2021.103045
Yang, J., Su, J., Xia, J., Jin, C., Li, X., and Ge, Q. (2018). The impact of spatial form of urban architecture on the urban thermal environment: A case study of the zhongshan district, dalian, china. IEEE J. Sel. Topics Appl. Earth Obs. Remote Sens. 11, 2709–2716. doi: 10.1109/JSTARS.2018.2808469
Yang, J., Wang, Y., Xiao, X., Jin, C., Xia, J., and Li, X. (2019). Spatial differentiation of urban wind and thermal environment in different grid sizes. Urban Climate 28:100458. doi: 10.1016/j.uclim.2019.100458
Yang, J., Wang, Y., Xiu, C., Xiao, X., Xia, J., and Jin, C. (2020). Optimizing local climate zones to mitigate urban heat island effect in human settlements. J. Clean. Produc. 275:123767. doi: 10.1016/j.jclepro.2020.123767
Yao, X., Yu, K., Zeng, X., Lin, Y., Ye, B., Shen, X., et al. (2022). How can urban parks be planned to mitigate urban heat island effect in “Furnace cities” ? An accumulation perspective. J. Clean. Produc. 330:129852. doi: 10.1016/j.jclepro.2021.129852
You, H., Yang, J., Xue, B., Xiao, X., Xia, J., Jin, C., et al. (2021). Spatial evolution of population change in Northeast China during 1992–2018. Sci. Total Environ. 776:146023. doi: 10.1016/j.scitotenv.2021.146023
Yu, H., Yang, J., Li, T., Jin, Y., and Sun, D. (2022). Morphological and functional polycentric structure assessment of megacity: An integrated approach with spatial distribution and interaction. Sustain. Cities Soc. 80:103800. doi: 10.1016/j.scs.2022.103800
Keywords: cooling effect, urban park, local climate zone, thermal variation, diurnal cycling
Citation: Liu Y, Xu X, Wang F, Qiao Z, An H, Han D and Luo J (2022) Exploring the cooling effect of urban parks based on the ECOSTRESS land surface temperature. Front. Ecol. Evol. 10:1031517. doi: 10.3389/fevo.2022.1031517
Received: 30 August 2022; Accepted: 20 September 2022;
Published: 10 October 2022.
Edited by:
Bing Xue, Institute for Advanced Sustainability Studies (IASS), GermanyReviewed by:
Lei Wang, Shandong Normal University, ChinaKun Jia, Shandong Jianzhu University, China
Wenhao Li, Nanjing Tech University, China
Bao-Jie He, Chongqing University, China
Copyright © 2022 Liu, Xu, Wang, Qiao, An, Han and Luo. This is an open-access article distributed under the terms of the Creative Commons Attribution License (CC BY). The use, distribution or reproduction in other forums is permitted, provided the original author(s) and the copyright owner(s) are credited and that the original publication in this journal is cited, in accordance with accepted academic practice. No use, distribution or reproduction is permitted which does not comply with these terms.
*Correspondence: Hongmin An, YW5obUBzZHUuZWR1LmNu; Dongrui Han, aGFuZHJAbHJlaXMuYWMuY24=
 Yihui Liu
 Xinliang Xu3
 Zhi Qiao
 Dongrui Han