 Tong Liu
 Haoyu Liu
 Younan Wang
 Yuxia Yang
- The Key Laboratory of Zoological Systematics and Application, School of Life Sciences, Institute of Life Science and Green Development, Hebei University, Baoding, China
Species richness patterns and endemism on the large-scale play a significant role in biogeography and biodiversity conservation. This study aimed to explore the diversity centers and endemic areas of a large cantharid genus Lycocerus, so as to test whether the hypothesis of montane and island systems biodiversity in previous studies was supported. In this study, a comprehensive species’ geographical database on the global scale consisting of 4,227 records for 324 Lycocerus species was compiled and analyzed. Species richness pattern was mapped into a grid-based map with a spatial resolution of 1° × 1° fishnet. An unbalanced pattern was identified, and it showed that the centers of species richness of Lycocerus were situated in Eastern Himalayas, Hengduan Mountains, Eastern Sichuan Mountains, Taiwan, and Japan. Further analyses based on two approaches, including parsimony analysis of endemicity (PAE) and endemicity analysis (EA), were applied to detect areas of endemism (AOEs) at three different grid sizes (1°, 1.5°, and 2°). Finally, a total of nine AOEs were detected, including five montane areas (Himalayan areas, Hengduan Mountains, South edge of China, Eastern China Mountains, and Eastern Sichuan Mountains), three islands (Taiwan Island, Japan, and Korean Peninsula), and one plateau (Shan Plateau), which were generally consistent with the species richness pattern. The results verify that montane and island systems have an essential role in promoting the formation of diversity centers and AOEs because of their complex topography, varied habitat and geological events.
Introduction
Recognizing the patterns of biodiversity is the basis of biogeography and conservation, especially the studies on species richness and endemism are of remarkable significance in biogeographic regionalization and defining biodiversity hotspots (Linder and Mann, 1998; Escalante et al., 2013; Morrone, 2014a).
Species richness is perhaps the simplest and most frequently used measure of biological diversity, and defined as the number of species per unit area (Huang et al., 2008; Gao et al., 2018). A vast amount of ecological research has been undertaken using species richness as a measure to understand what affects, and what is affected by, biodiversity (Huang et al., 2006; Gao et al., 2018; Zhao et al., 2020; Li et al., 2021). It provides a useful means through which to examine how fundamental ecological processes affect local communities (Li et al., 2019, 2021). Understanding of the factors that influence species richness is particularly important for applying the concept to biodiversity conservation. However, the richest sites do not necessarily contain the highest levels of endemism (Brown et al., 2007), which is also used as indices in defining biodiversity hotspots (Myers et al., 2000; Mittermeier et al., 2005; Orme et al., 2005).
In recent years, a number of biogeographic and evolutionary studies have implemented and applied the areas of endemism (AOEs) to resolve practical issues (Nelson and Platnick, 1981; Anderson, 1994; Huang et al., 2006, 2008, 2010; López-Pujol et al., 2011; Yuan et al., 2014; Gao et al., 2018; Noroozi et al., 2018; Zhao et al., 2021). The definition of AOEs is generally agreed as a distribution congruence of at least two restricted species (Cracraft, 1985; Harold and Mooi, 1994; Morrone, 1994; Linder, 2001). AOEs are entities compared in terms of ascertaining earth history based on biological patterns (Henderson, 1991; Linder, 2001). In an AOE, faunal and floral distributions are supposed to have been generally influenced by historical processes, such as tectonic activities or climate change. These areas are supposed to be characterized by a stable climate, and they therefore offered considerable opportunities for past speciation and persistence (Jetz et al., 2004). This long-term evolution may explain why AOEs often contain high species richness, which is less predictable by contemporary environment alone (Jetz et al., 2004; López-Pujol et al., 2011; Fjeldså et al., 2012), so dozens of biogeographers and evolutionary biologists have shown their interests in evaluating the causes for the presence of AOEs (Nelson and Platnick, 1981; Anderson, 1994; Huang et al., 2006, 2008, 2010; López-Pujol et al., 2011; Yuan et al., 2014; Gao et al., 2018; Noroozi et al., 2018; Zhao et al., 2021). The montane system, which accounts for a large portion of biodiversity hotspots and harbors many narrow-ranged species (Orme et al., 2005; Fjeldså et al., 2012; Wu et al., 2017), has been anticipated as refugia with stable climates and heterogeneous topography, and hence facilitates the persistence and speciation (Favre et al., 2015; Zhao et al., 2021). Besides, the high rate of endemism is also observed in the island systems (Myers et al., 2000), because island systems are relatively isolated areas, which are vulnerable to sea-level fluctuations, and the discontinuous connection with the source continent and adaptive radiation may promote species accumulation and speciation (Cronk, 1997; Fjeldså et al., 2012).
Currently, the methods of identifying AOEs can be classified on basis of the studied aims, either to determine (i) species patterns (i.e., groups of species with overlapping distributions), or (ii) geographical patterns (i.e., groups of area units with similar species composition) (Casagranda et al., 2012). Although different algorithms involve different optimality criteria for AOEs, in some cases, more complete results can be obtained via combing two or multiple methods (Linder, 2001; Carine et al., 2009). Among the various methods, two of them are most popular in identifying AOEs (do Prado et al., 2015; Gao et al., 2018; Zhuang et al., 2018; Zhao et al., 2021). One is the parsimony analysis of endemicity (PAE), which was originally proposed by Rosen (1988) in the content of paleontology, involving the distributions of taxa from sampling localities in different geological units. Based on the cladistic principle, PAE hierarchically groups area units as AOEs according to their shared taxa (Rosen, 1988; Morrone and Crisci, 1995; Nihei, 2006). The other is the endemicity analysis (EA) method, which was explored by Szumik and Goloboff (2004), and directly integrates spatial information into the division of AOEs by evaluating the congruence between a given area and species distribution (Gao et al., 2018). The two methods are both conducted in a geographical pattern approach (Casagranda et al., 2012). Searches for AOEs are usually conducted in endemic taxa delimited to islands or specific regions of the continent (Huang et al., 2008; do Prado et al., 2015; Lago-Barcia et al., 2020; Zhao et al., 2021), whereas only a few studies have been done to elucidate the geographical patterns of organisms on a global scale (Gao et al., 2018; Zhuang et al., 2018).
The cantharid genus Lycocerus Gorham, 1889 sensu Okushima (2005) belongs to the tribe Cantharini and the subfamily Cantharinae Imhoff, 1856, a total of 331 species have been recognized in this genus and are restricted to the Oriental and southern and eastern Palearctic regions (Delkeskamp, 1977; Kazantsev and Brancucci, 2007; Okushima and Brancucci, 2008; Okushima and Yang, 2013; Yang et al., 2014; Hsiao and Okushima, 2016; Hsiao et al., 2016; Okushima and Hsiao, 2017; Xi et al., 2021a,b). Although the geographic range of the genus Lycocerus is rather wide, most species are narrow-ranged, such as the Japanese members being mostly endemic (Okushima, 2005), and those from Taiwan restricted to the island (Wittmer, 1983; Okushima, 2007; Okushima and Hsiao, 2017), as well as the species from mainland China and adjacent areas always limited within a mountain range (Wittmer, 1995; Švihla, 2004, 2005, 2011; Švihla and Mifsud, 2006; Yang et al., 2014; Xi et al., 2021a,b). Lacking long distance dispersal capabilities, the distribution pattern and radiation of Lycocerus species are directly related to the geological events or climatic changes. This makes this group an excellent model for investigation of the evolutionary history of species diversity and distribution patterns. Up to now, the studies on Lycocerus are mainly about traditional taxonomy, no efforts have been directed toward identifying and explaining distribution patterns of this genus on such a global scale with geographic methods.
The taxonomy of Lycocerus has been well studied and revised in recent years (e.g., Wittmer, 1995; Švihla, 2004, 2005, 2011; Okushima, 2005; Yang et al., 2014; Hsiao and Okushima, 2016; Okushima and Hsiao, 2017; Xi et al., 2021a,b), which resulted in it becoming one of the largest genera of Cantharidae. However, the correlations between species richness and biogeographical patterns and hypotheses of species evolution based on endemic analysis are completely absent. In the present study, 331 species of Lycocerus all over the world were selected to study its distribution pattern, in an aim to: (1) identify the center of species richness and AOEs; (2) detect whether species richness is consistent with its geographical distribution; (3) test whether the hypothesis of montane and island systems biodiversity in the previous studies was supported based on the results of present study.
Materials and Methods
Occurrence Data
Data on the geographical distribution of 331 Lycocerus species were obtained from the published literatures (Wittmer, 1982, 1983, 1984, 1995, 1997; Kasantsev, 1999; Kang and Okushima, 2003; Švihla, 2004, 2005, 2011; Okushima, 2005; Yang and Yang, 2013; Yang et al., 2014; Hsiao and Okushima, 2015, 2016; Hsiao et al., 2016; Okushima and Hsiao, 2017; Kazantsev and Kopetz, 2019; Xi et al., 2021a,b), and iNaturalist1, and a total of 4,234 species’ geographical distribution information were collected for diversity analysis. The distribution records containing specific longitude and latitude information were used directly, and those without robust coordinates information were standardized using Google Earth software. Imprecise distribution records were excluded, and finally the distribution information of 324 species with 4,227 species’ geographical distribution information were used in the following analysis.
Mapping Species Richness
The standardized distribution data was imported into ArcGIS 10.6 (ESRI, Inc., Redlands, CA, United States) to draw its overall distribution pattern. To map the richness patterns of Lycocerus, a fishnet with longitude – latitude grid size of 1° was created to subdivide its distribution range. The number of species in each grid was calculated and ranked, shown with different colors on the map. The inventory completeness of Lycocerus under the studied region was assessed using the species accumulation curve from the incidence-based bootstrap estimators (Zhao et al., 2020). Based on the statistical summary of the species in each 1° grid cell, a presence (1) or absence (0) matrix for each species in each 1° grid cell was constructed and was generated using EstimateS 9.1 with default values (Colwell, 2013).
Identifying Areas of Endemism
To identify the objective and accurate AOEs, both PAE and EA approaches were performed in the present study using three grids: 1°, 1.5°, and 2° (Escalante, 2015). The span of cell grids in longitude and latitude were set approximately as 68°E to 154°E, −8°N to 54°N respectively to encompass the global distribution area of Lycocerus, and a total of 4,144, 1,976, and 1,247 cell grids were obtained according to the three grid sizes.
For the PAE analyses, the general distribution map was divided into cell grids, which were regarded as terminals (Morrone, 1994). A total of 206, 150, and 120 U were recognized with parsimony information (containing two or more species) under the 1°, 1.5°, and 2° grid size, respectively. Then, three matrices including 206 cell grids × 324 taxa, 150 cell grids × 324 taxa, and 120 cell grids × 324 taxa were constructed accordingly. The matrices based on the presence (1) or absence (0) of each species in each grid was constructed to explore the geographical patterns of Lycocerus. A hypothetical outgroup “Root” with all zeros was added to the matrix to root the resulting tree (Morrone, 1994, 2014b). All matrices were performed in TNT v1.1 using New Technology algorithms with default parameter (Goloboff et al., 2008). Branches with relatively high bootstrap value (≥50%) were selected as candidates for AOEs. Finally, AOEs (clades of grids), defined by two species or more species restricted by these areas, were delimited and mapped (Huang et al., 2008).
The EA analysis based on the optimality criterion was performed in NDM/VNDM v3.1 (Goloboff, 2016), using geographical coordinates of 324 species converted by GeX (Szumik et al., 2002; Szumik and Goloboff, 2004; Santos and Fuhlendorf, 2019). Three different cell grids were set to examine the effect of the cell size in inferring the distribution patterns. The analyses were conducted by saving temporary sets within 0.99 of current score, in sets with two or more species and scores above 2.0 score. Subsets were considered overlapping if 50% of the Lycocerus species were unique, and the repeat search was set as 100 times. From the subsets obtained, species with a minimum score of 0.4 were selected (Escalante et al., 2013; do Prado et al., 2015). Moreover, the consensus areas were calculated based on the strict rule, at a cut-off 100% similarity in species. The default settings were applied to other parameters. To obtain the final AOEs, the consensus areas among the different grid sizes were overlapped (Gao et al., 2018; Du et al., 2020; Zhao et al., 2021).
Results
Species Richness Pattern
Although the taxonomy of the genus Lycocerus is well studied and documented with rich geographical data, under-collecting remains a potential problem in biogeographical research. In the present study, the species accumulation curve for 1° grid size did not indicate under-collection (bootstrap mean approximately 385), with the data integrity for analysis as 84.2% (Figure 1). This suggests that the geographic data we collected was sufficient, and the variation in numbers of species was explained well by the variation in numbers of collections.
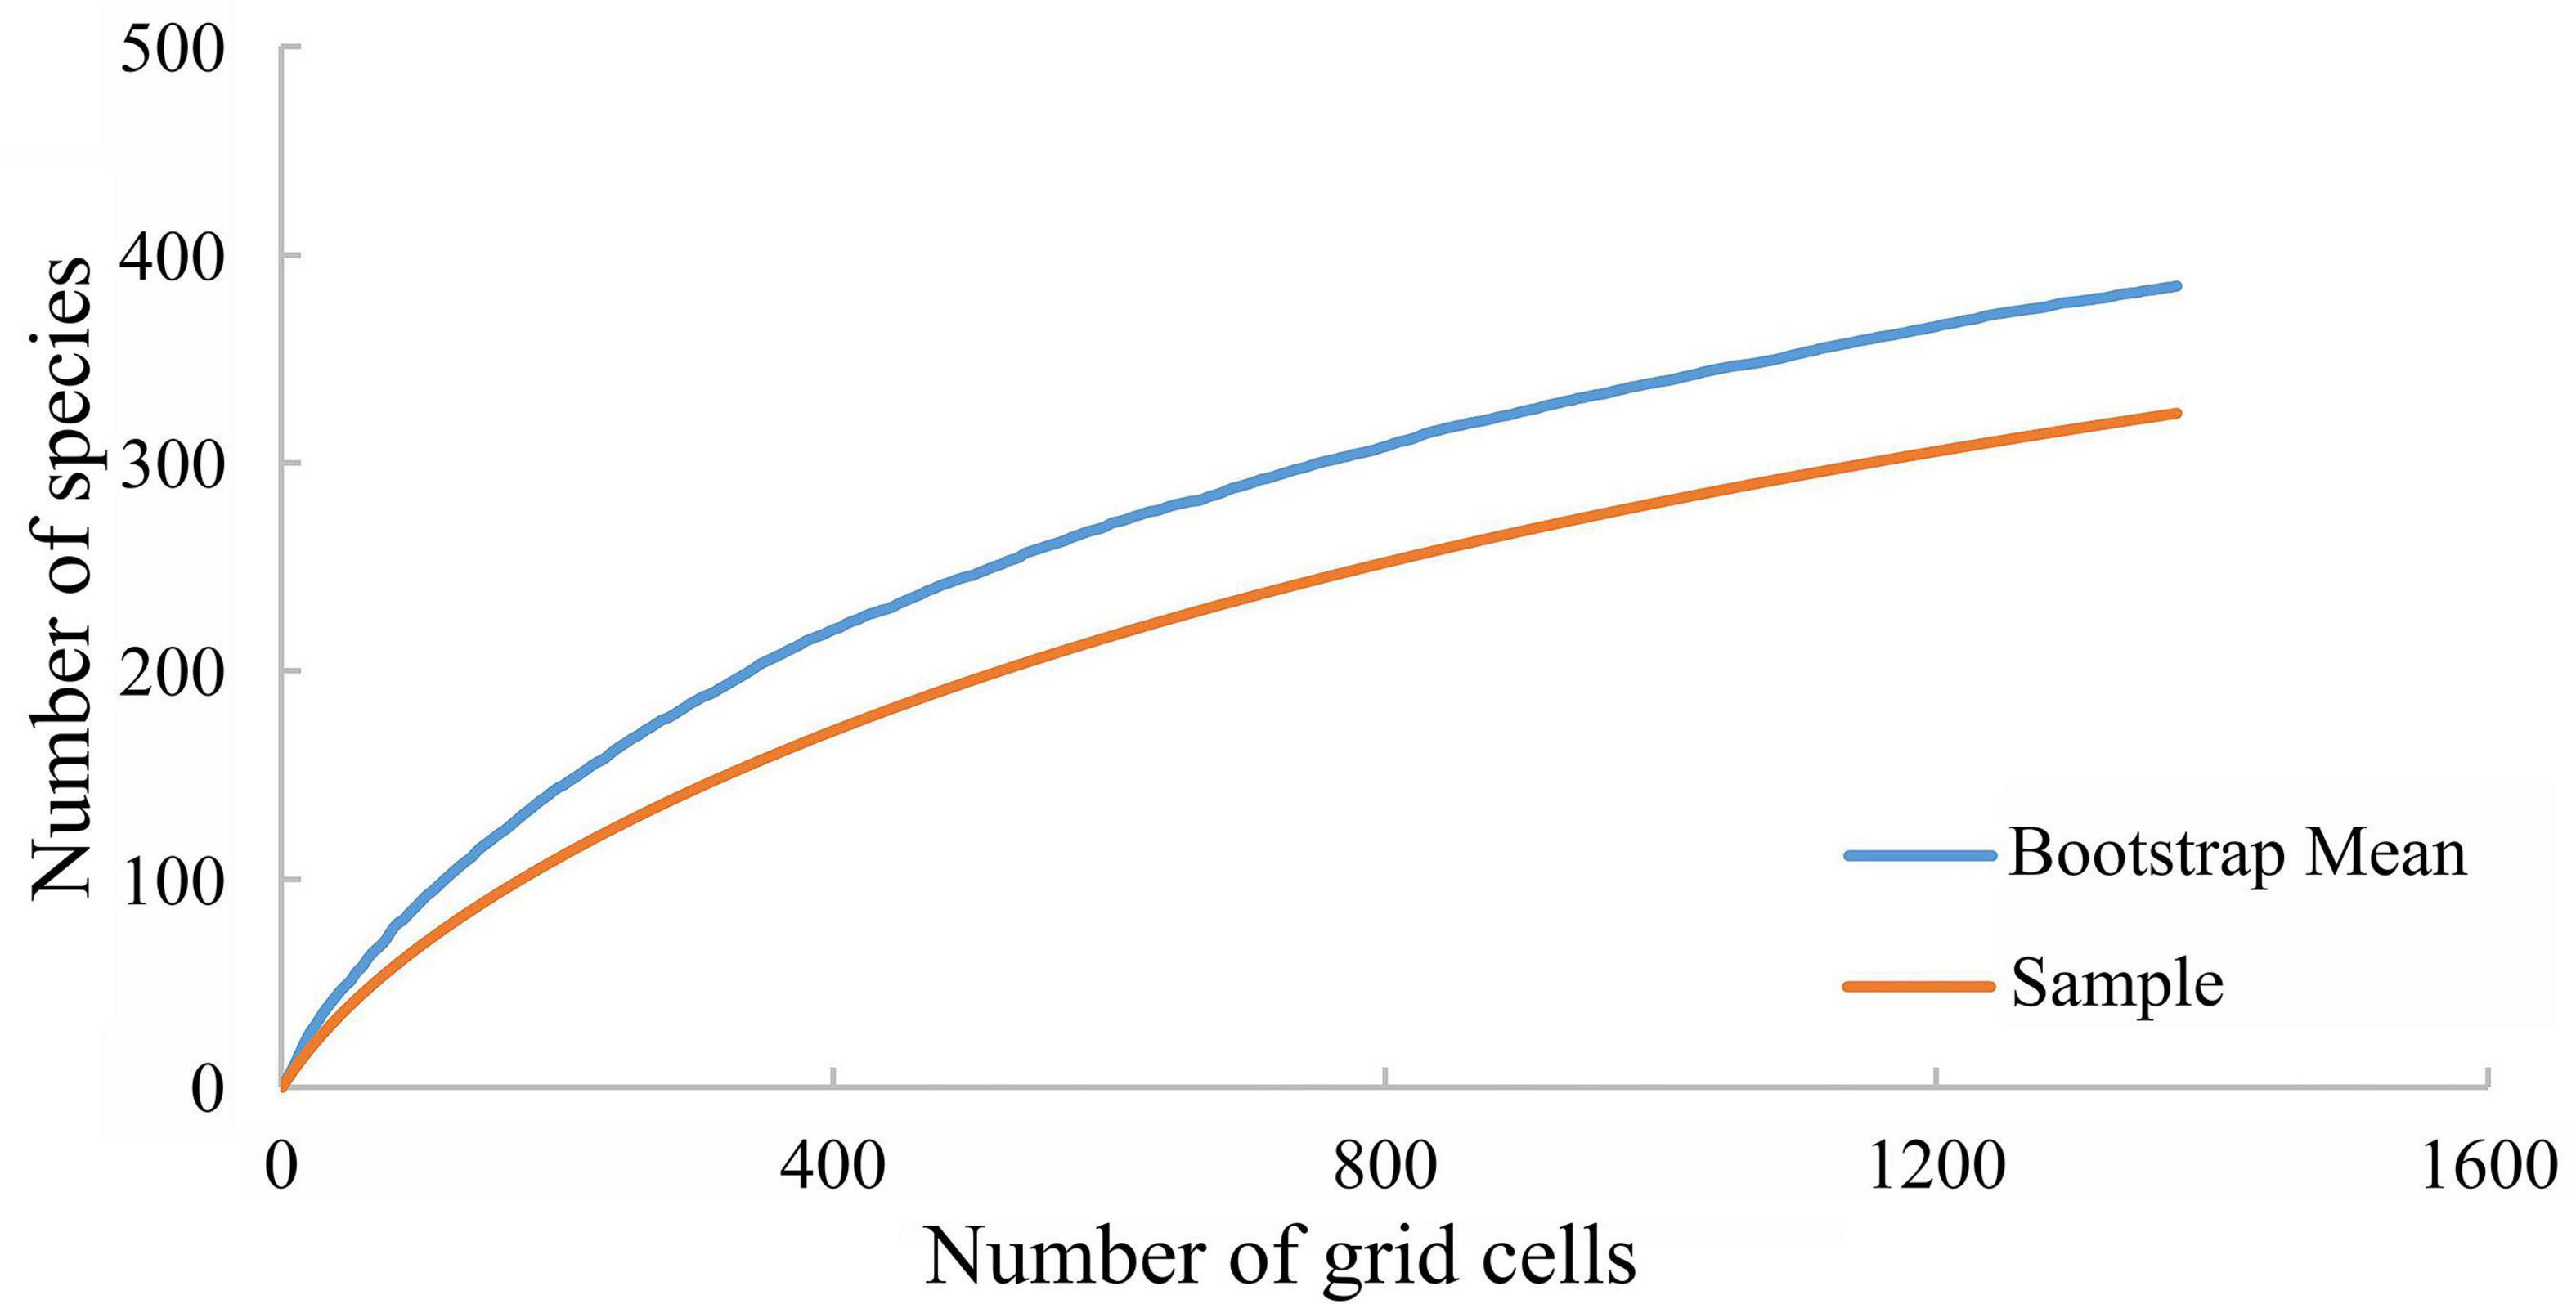
Figure 1. Species accumulation curves for Lycocerus by the global scale.
From a global perspective, the Lycocerus species are located in the Oriental and southeastern Palaearctic regions (Figure 2A). Most species are distributed in the Himalayas, southeastern China, Indo-Chinese region, and Japan, a few species spread to the Indo-Malaysian region and South India, and the northernmost reaches Russian Far East, easternmost in Kuril Island, southernmost to Java (Figure 2B).
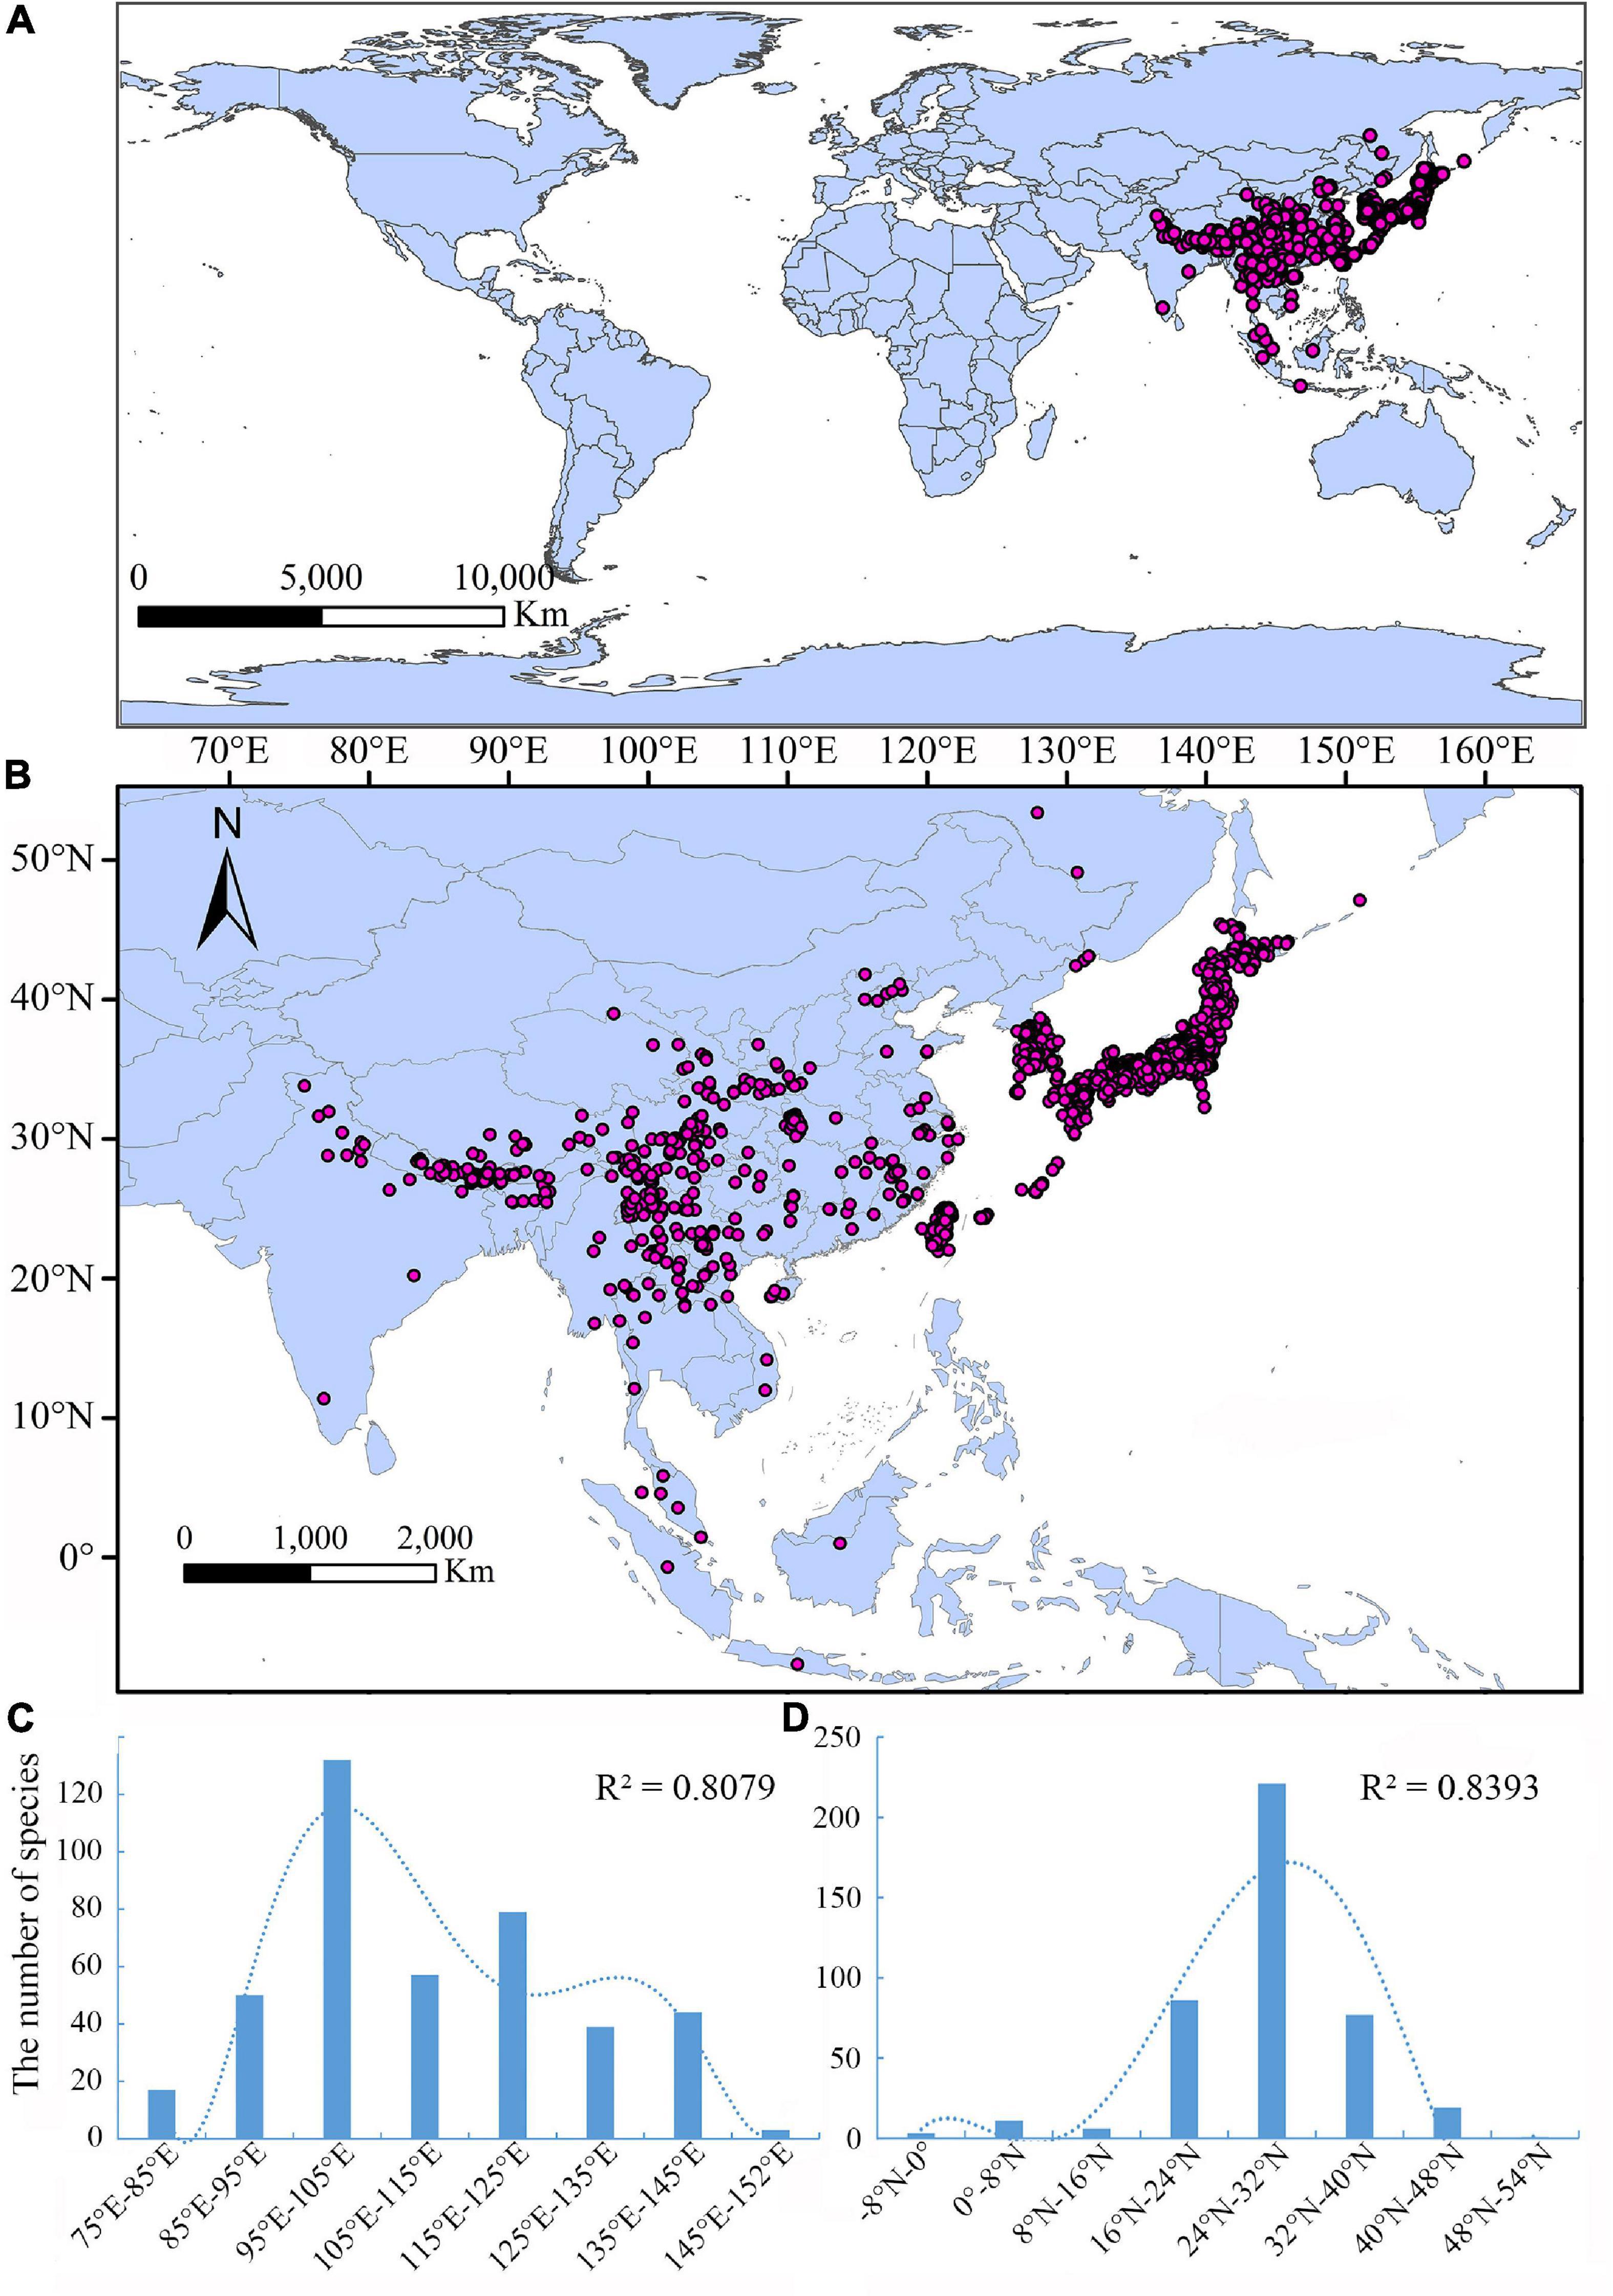
Figure 2. (A) General distribution pattern of Lycocerus in the world. (B) Distribution pattern of Lycocerus in a close view. (C) The number of Lycocerus species at different longitudes. (D) The number of Lycocerus species at different latitudes.
The relation curves (Figures 2C,D) between species richness and longitude and latitude indicated that the distribution range of Lycocerus are 75°E to 152°E and −8°N to 54°N, respectively. Both curves show a normal distribution, and the optimal regions characterized by high species numbers are 94°E to 110°E and 24°N to 28°N, corresponding to the areas of the southern edge of Qinghai-Tibet Plateau and Hengduan Mountains. Results show a strong coefficient of determination (R2 > 0.8), which supports the credibility of the correlation curves (Figures 2C,D).
Richness patterns among localities were unbalanced, with most species marginally distributed in East Asia and Japan (Figure 3A). Based on the criterion of high species richness, five centers of species richness of Lycocerus in the world range were identified, including Eastern Himalayas, Hengduan Mountains, Eastern Sichuan Mountains, Taiwan, and Japan (Figure 3B), which represent centers with high species diversity for the genus Lycocerus. The former three species richness centers are montane systems, while the latter two are islands.
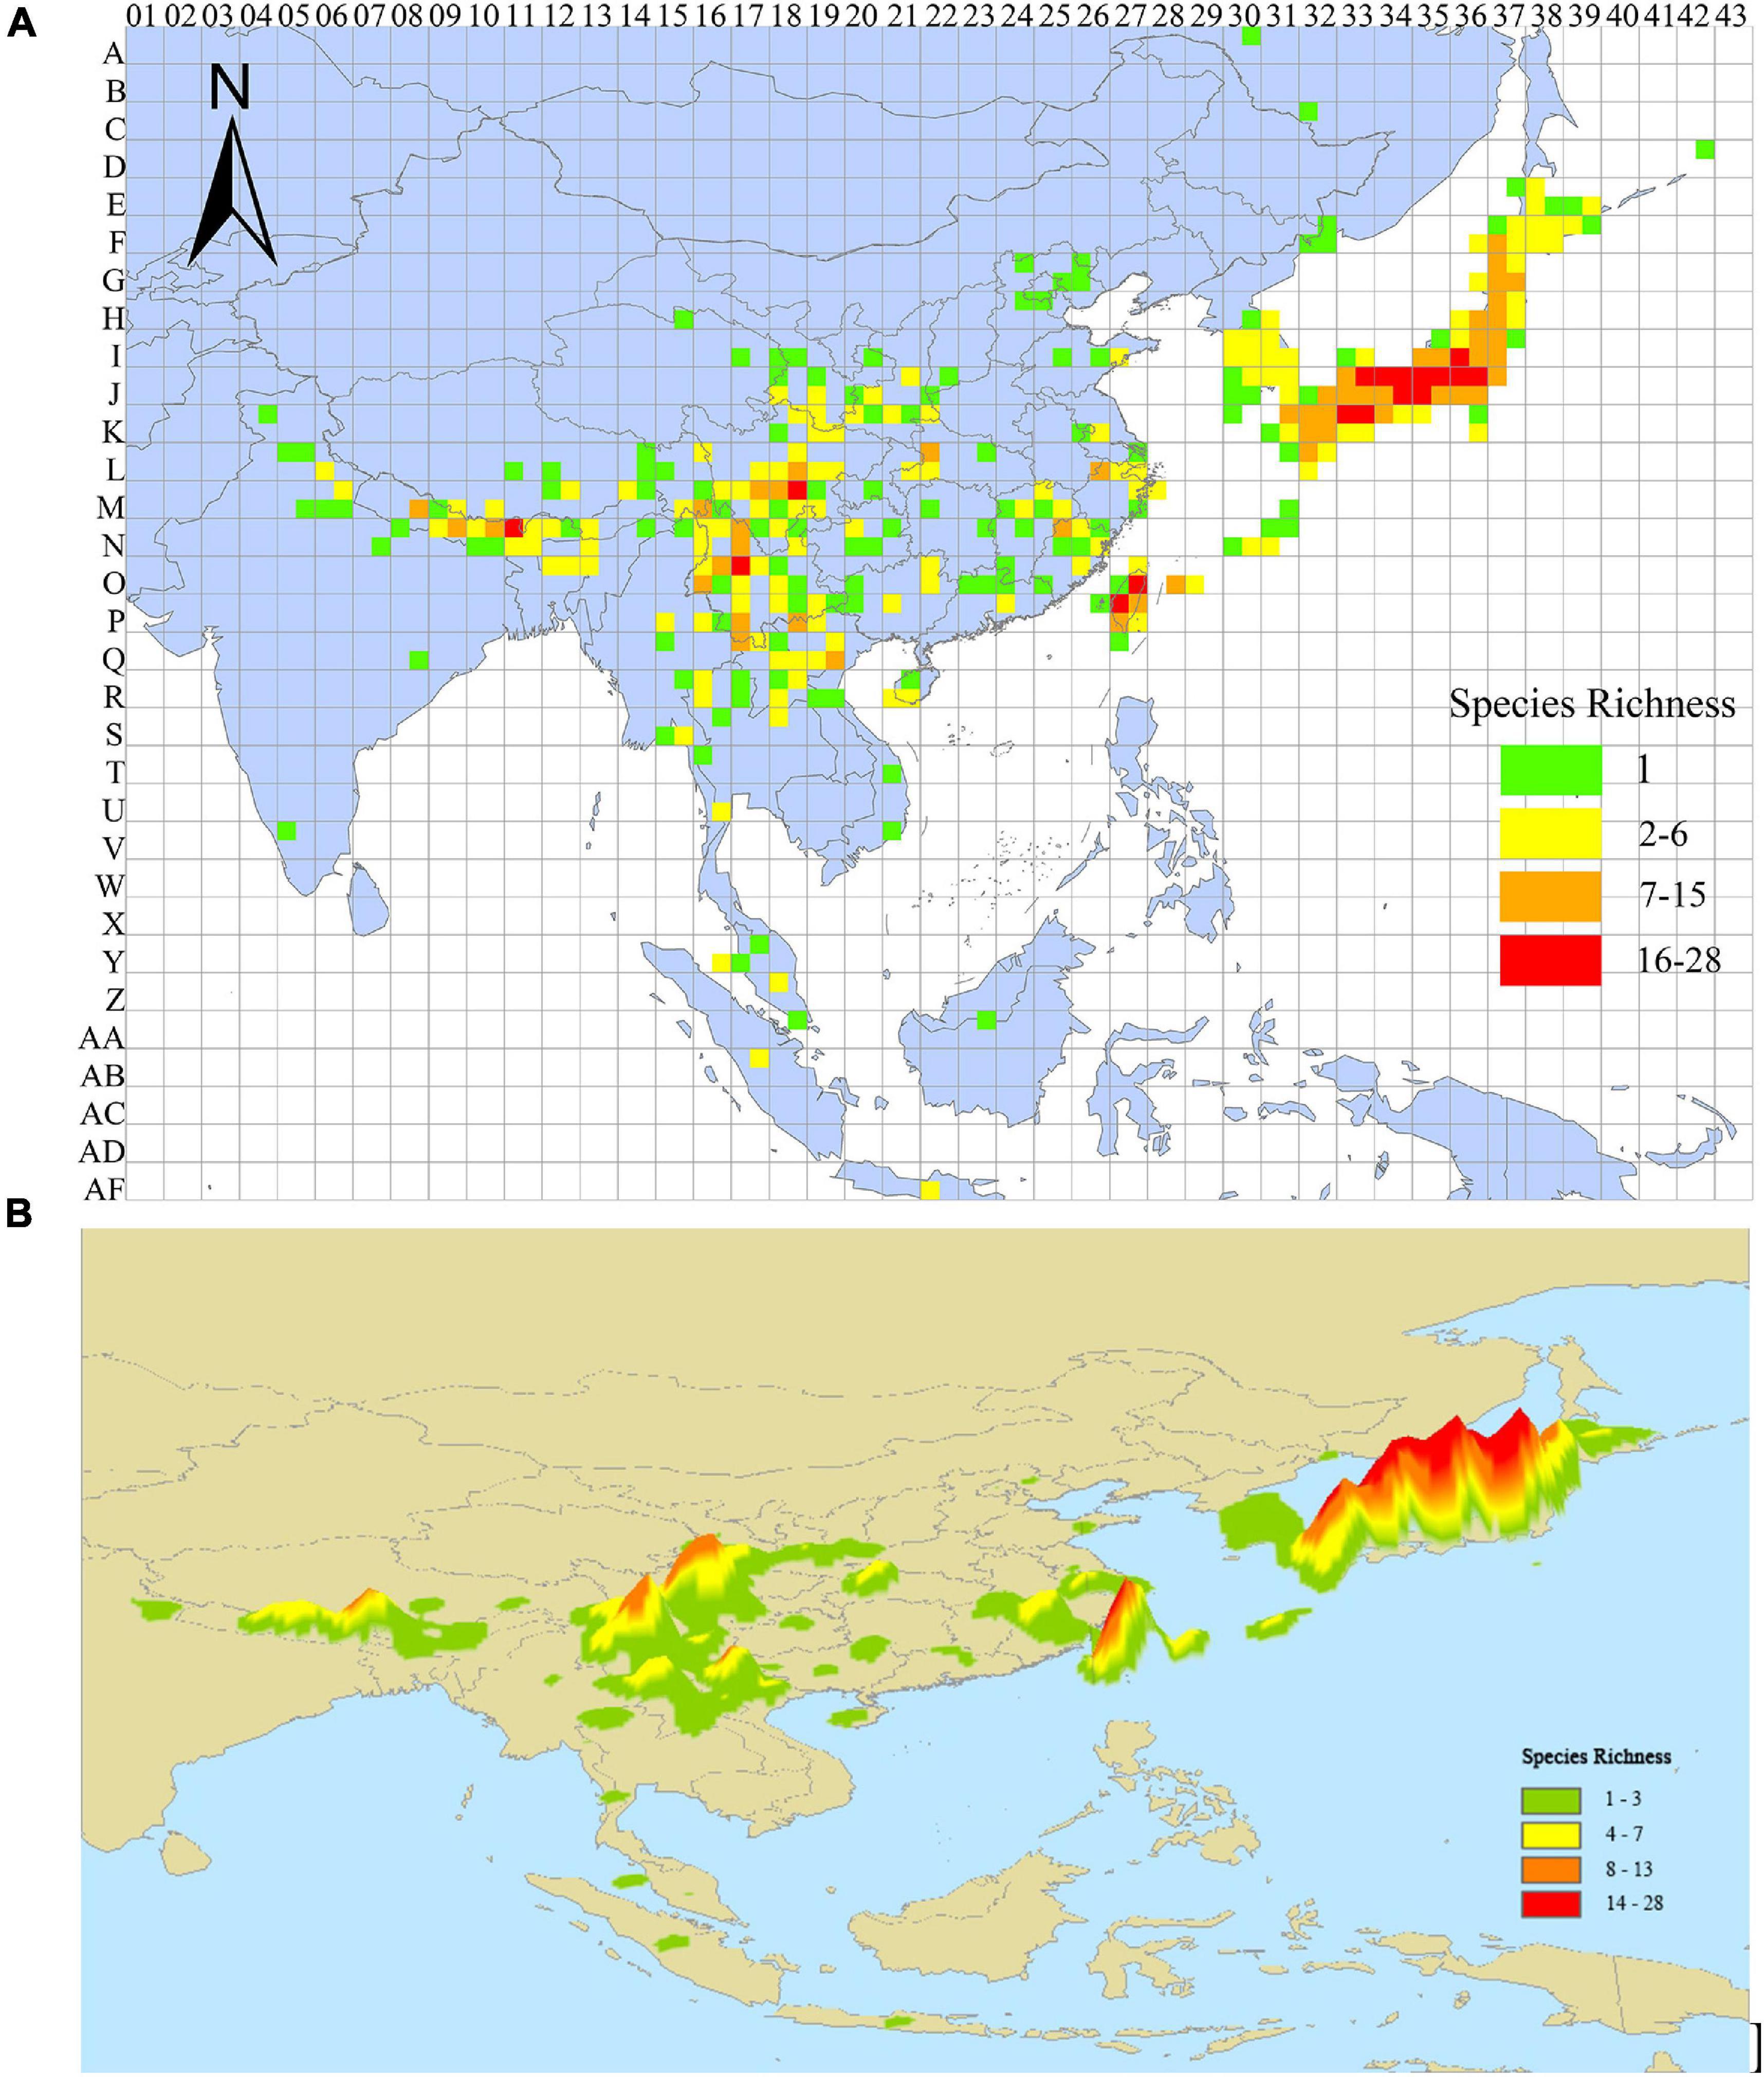
Figure 3. (A) OGUs (quadrats) and labels used in PAE analysis, and the species richness pattern identified by 1° grid size. (B) Species richness patterns of Lycocerus under kernel density analysis.
Parsimony Analysis of Endemicity
In total, three most parsimonious trees were obtained under the three different grid cells, and the optimal one was selected under 2° grid size as the candidate for identifying AOEs (Figure 4). The clades with two and more than two terminals [operative geographical units (OGUs)] are selected as the AOEs. Finally, a total of 18 clades are detected in the topology, of which 6 clades belong to Japan, 3 of the Himalayas, 2 of the eastern Sichuan Mountains and eastern China Mountains, respectively, and only one in the rest AOEs respectively, including Korea Peninsula, South edge of China, Taiwan Island, Hengduan Mountains, and Shan Plateau.
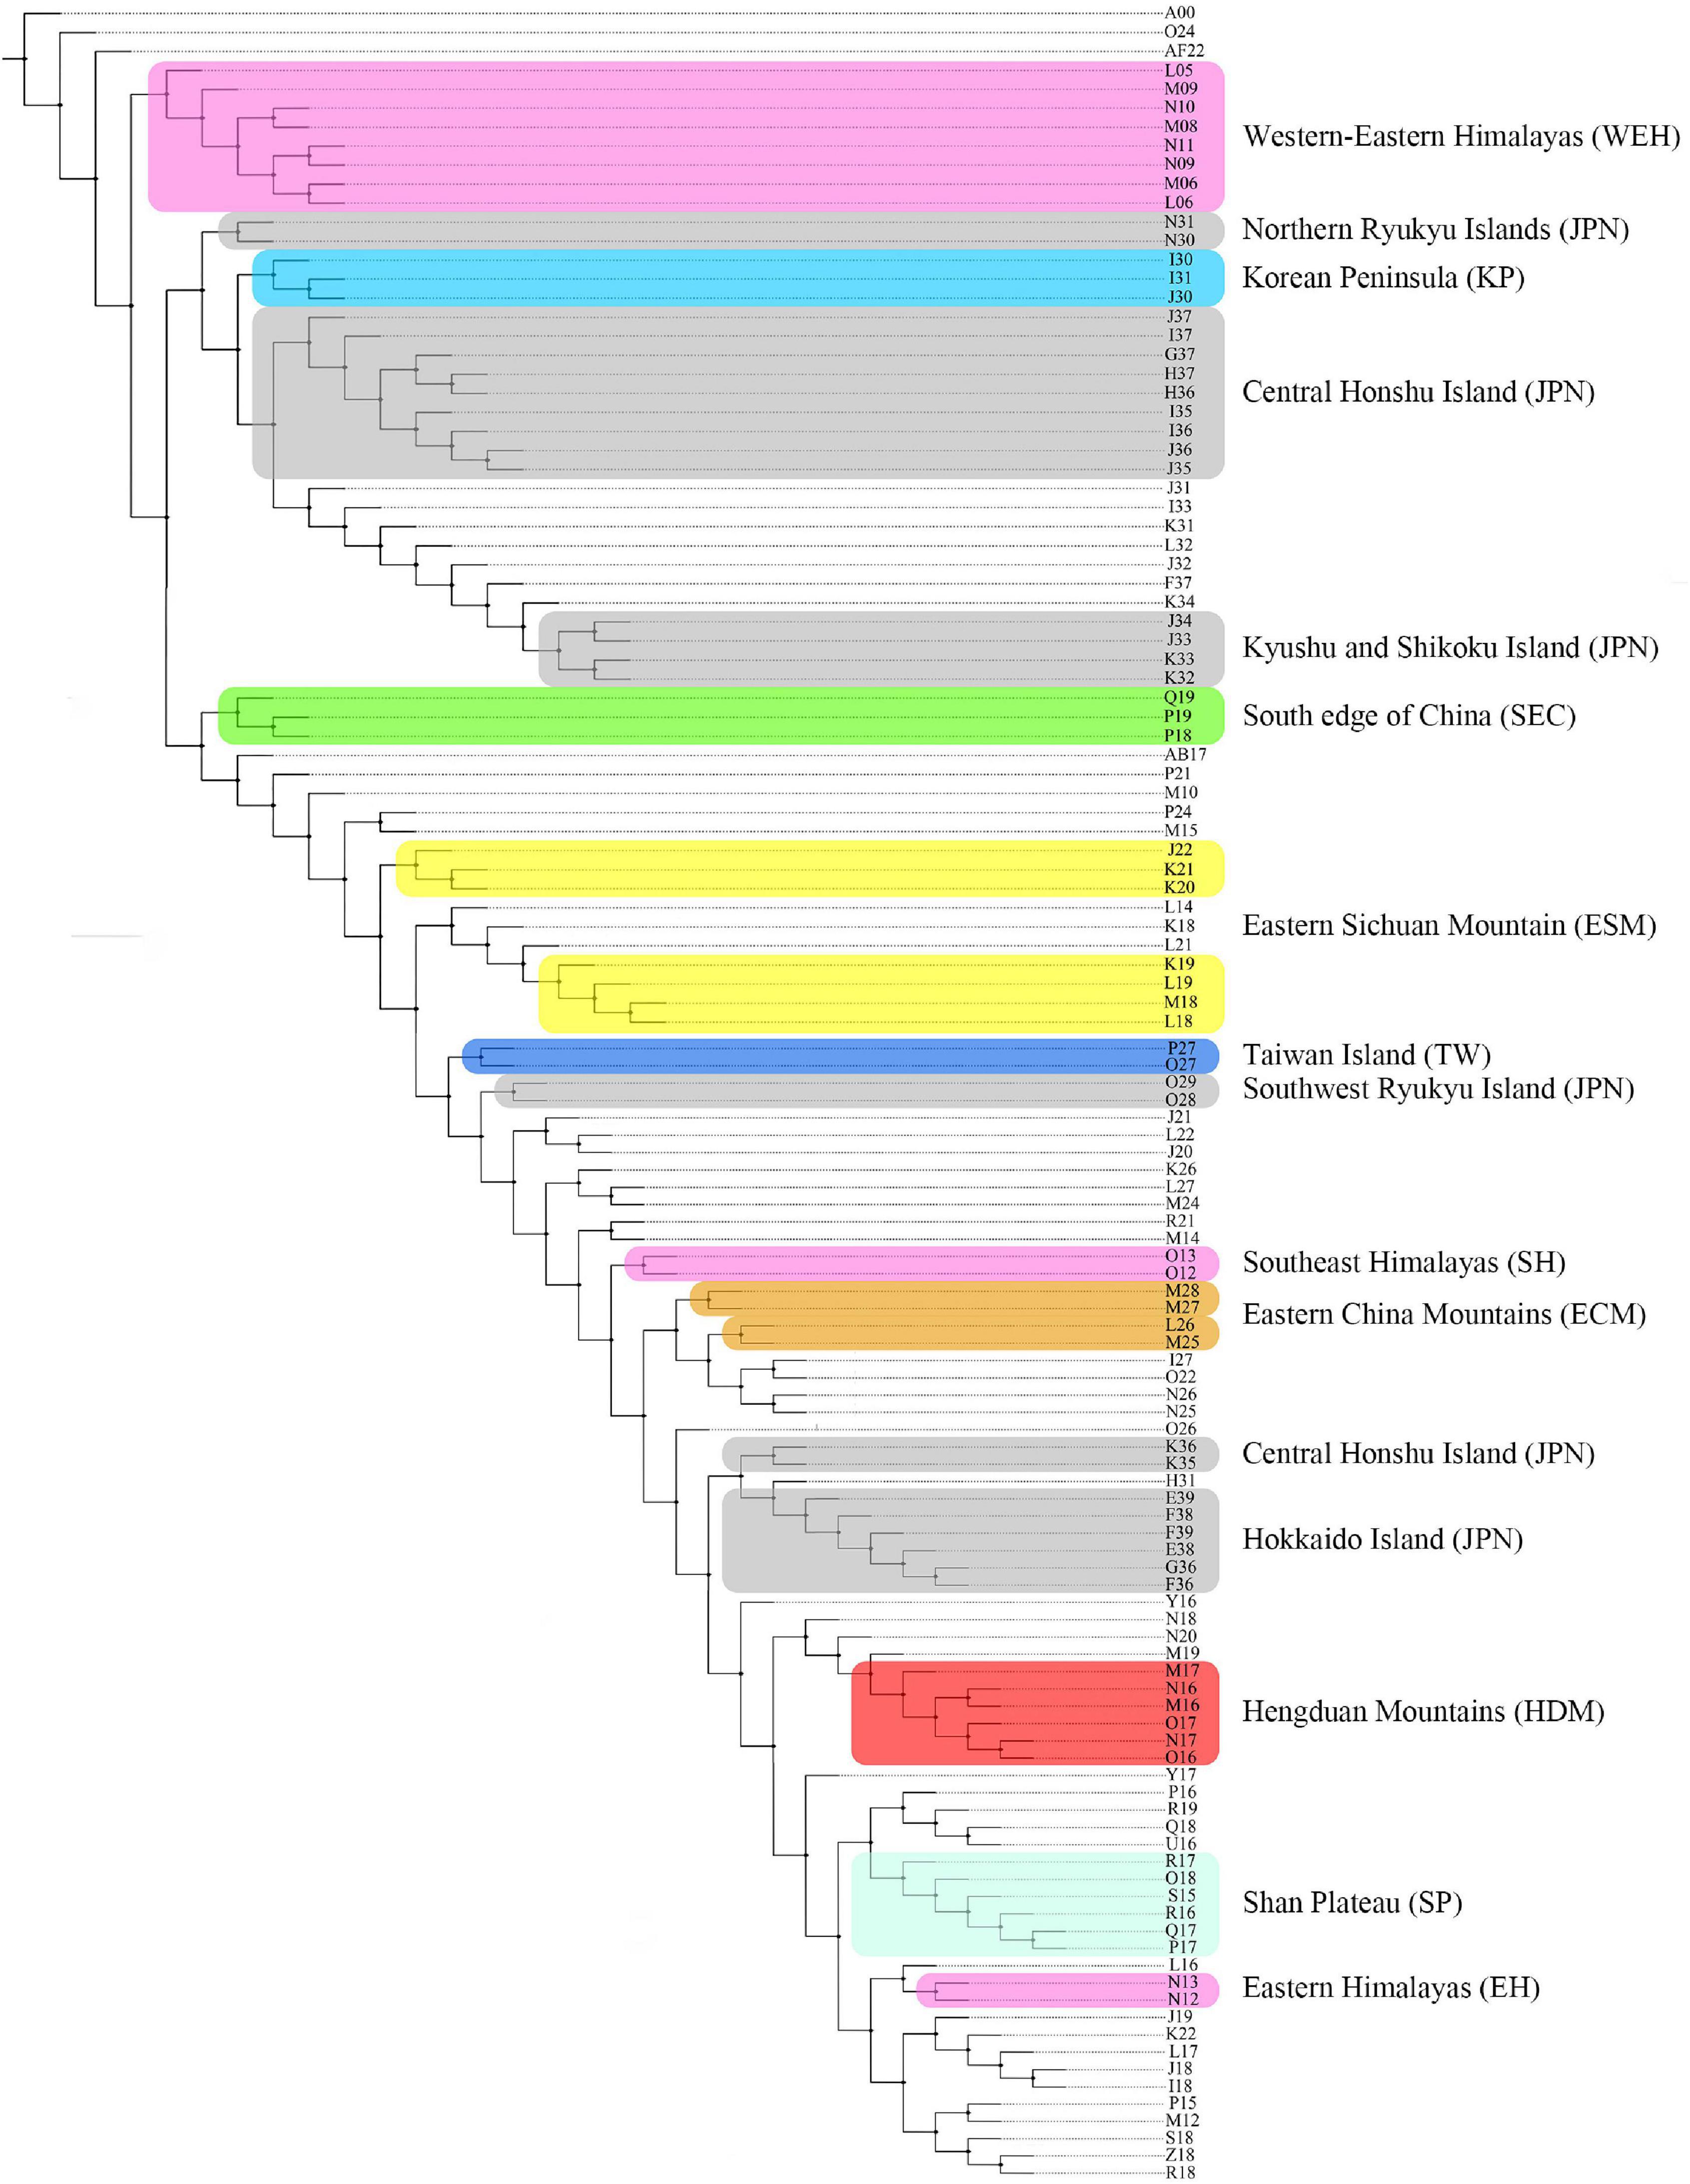
Figure 4. The optimal tree obtained by PAE using TNT v1.1 under 2° grid size. Different colored shadows represent different AOEs.
Following the criterion for identifying AOEs, which at least two species of Lycocerus were delimited in the same OGUs, nine AOEs were finally identified under 2° grid size (Supplementary Table 1 and Figure 5): (i) Western–Eastern Himalayas (WEH) that shared 47 species; (ii) Hengduan Mountains (HDM), which shared 41 species; (iii) Eastern Sichuan Mountains (ESM) that shared 38 species; (iv) Shan Plateau (SP), which shared 21 species; (v) South edge of China (SEC) that shared 28 species; (vi) Eastern China Mountains (ECM) that shared 10 species; (vii) Taiwan Island (TW) which shared 39 species; (viii) Korean Peninsula (KP) which shared 3 species; and (ix) Japan (JPN) which shared 51 species.
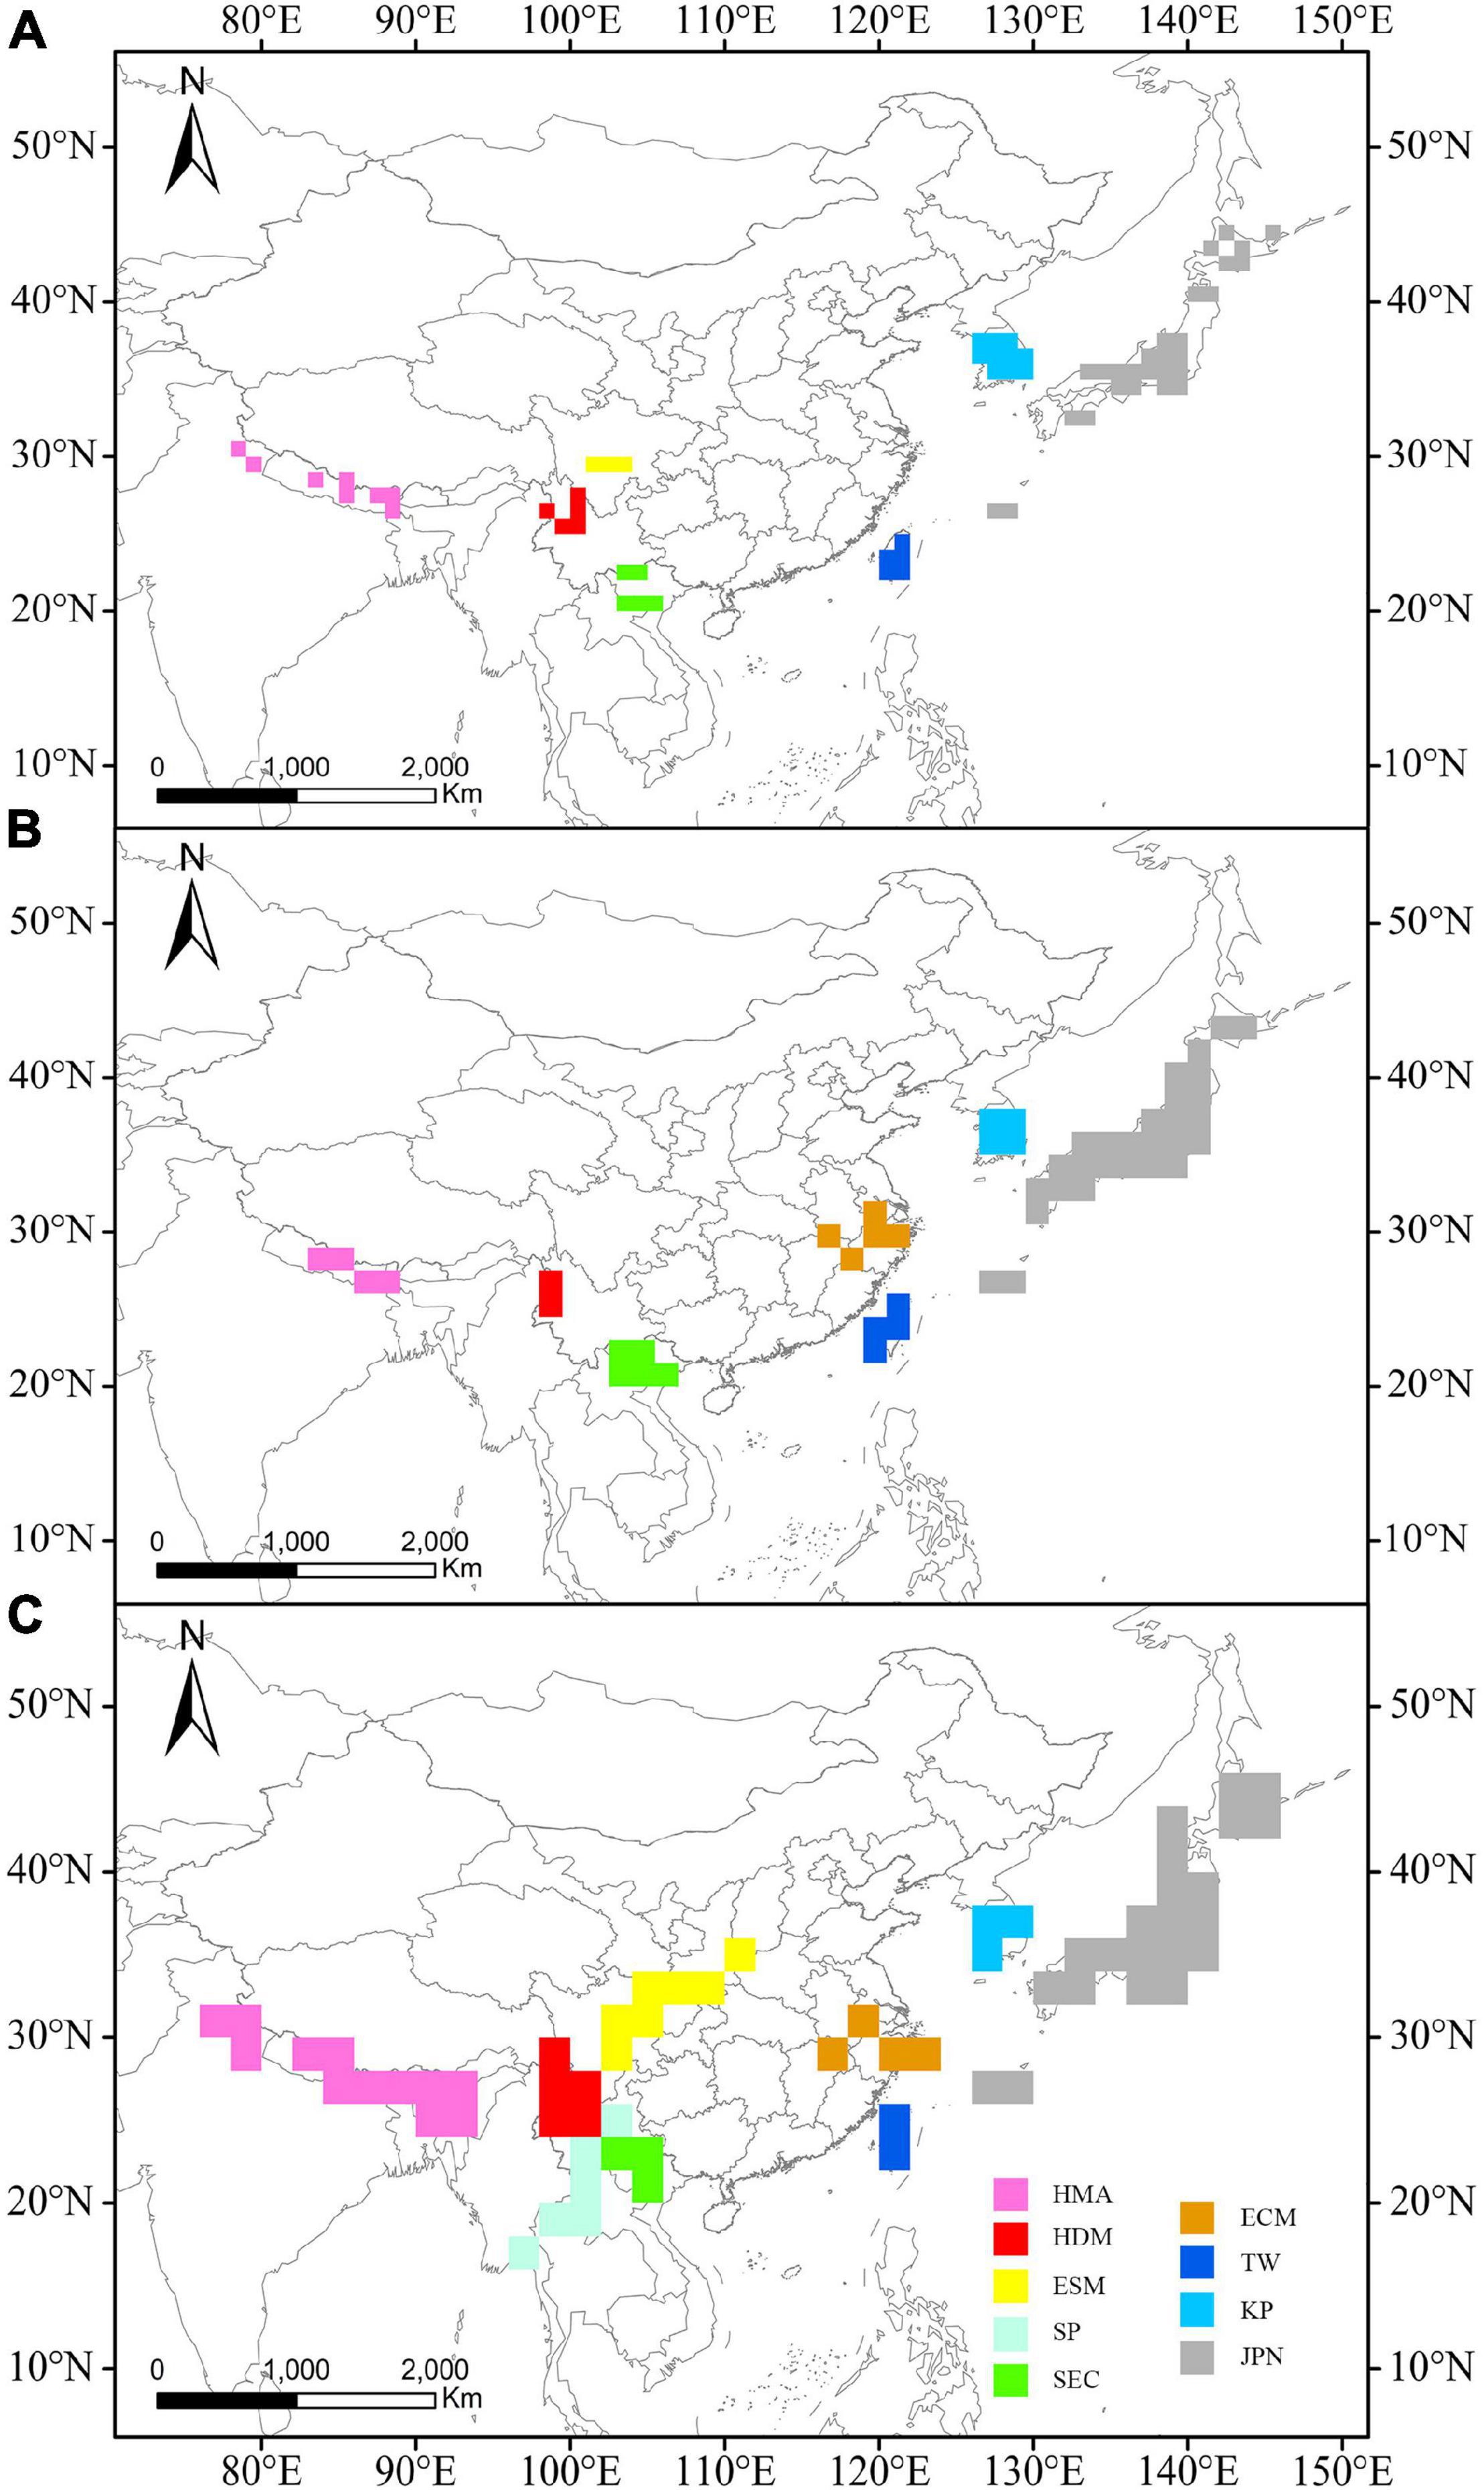
Figure 5. AOEs obtained for Lycocerus by PAE using three different grids by the global scale: (A) 1° grid size, (B) 1.5° grid size, and (C) 2° grid size. Different colored shadows denote different AOEs: purple (HMA), red (HDM), light blue (SP), yellow (ESM), green (SEC), brown (ECM), dark blue (TW), sky blue (KP), and gray (JPN).
Endemicity Analysis
Analyses in NDM/VNDM 3.1 using heuristic algorithm at three different grid sizes (OGUs 1°, 1.5°, and 2°) yielded 3, 12, and 22 consensus areas, respectively (Supplementary Table 2). The consensus areas under the 1° grid size were associated with the ESM and TW (Supplementary Figure 1), and those under the 1.5° grid size are similar to that of 2°, both were primarily associated with ESM, JPN, ECM, TW, HDM, and Central Himalayas (CH) (Supplementary Figures 2–6).
High degrees of overlap and proximity of consensus areas among different grid sizes provided consistent evidence of a high degree of endemicity (do Prado et al., 2015). The overlapping patterns of the aforementioned consensus areas under the 1.5° and 2° grid sizes (Supplementary Figures 2–6) uncovered four main AOEs with great congruence as the following: CH, HDM, ECM, and JPN, and another two AOEs were identified among all of the three different grid sizes, including TW and ESM (Supplementary Table 2 and Figure 6).
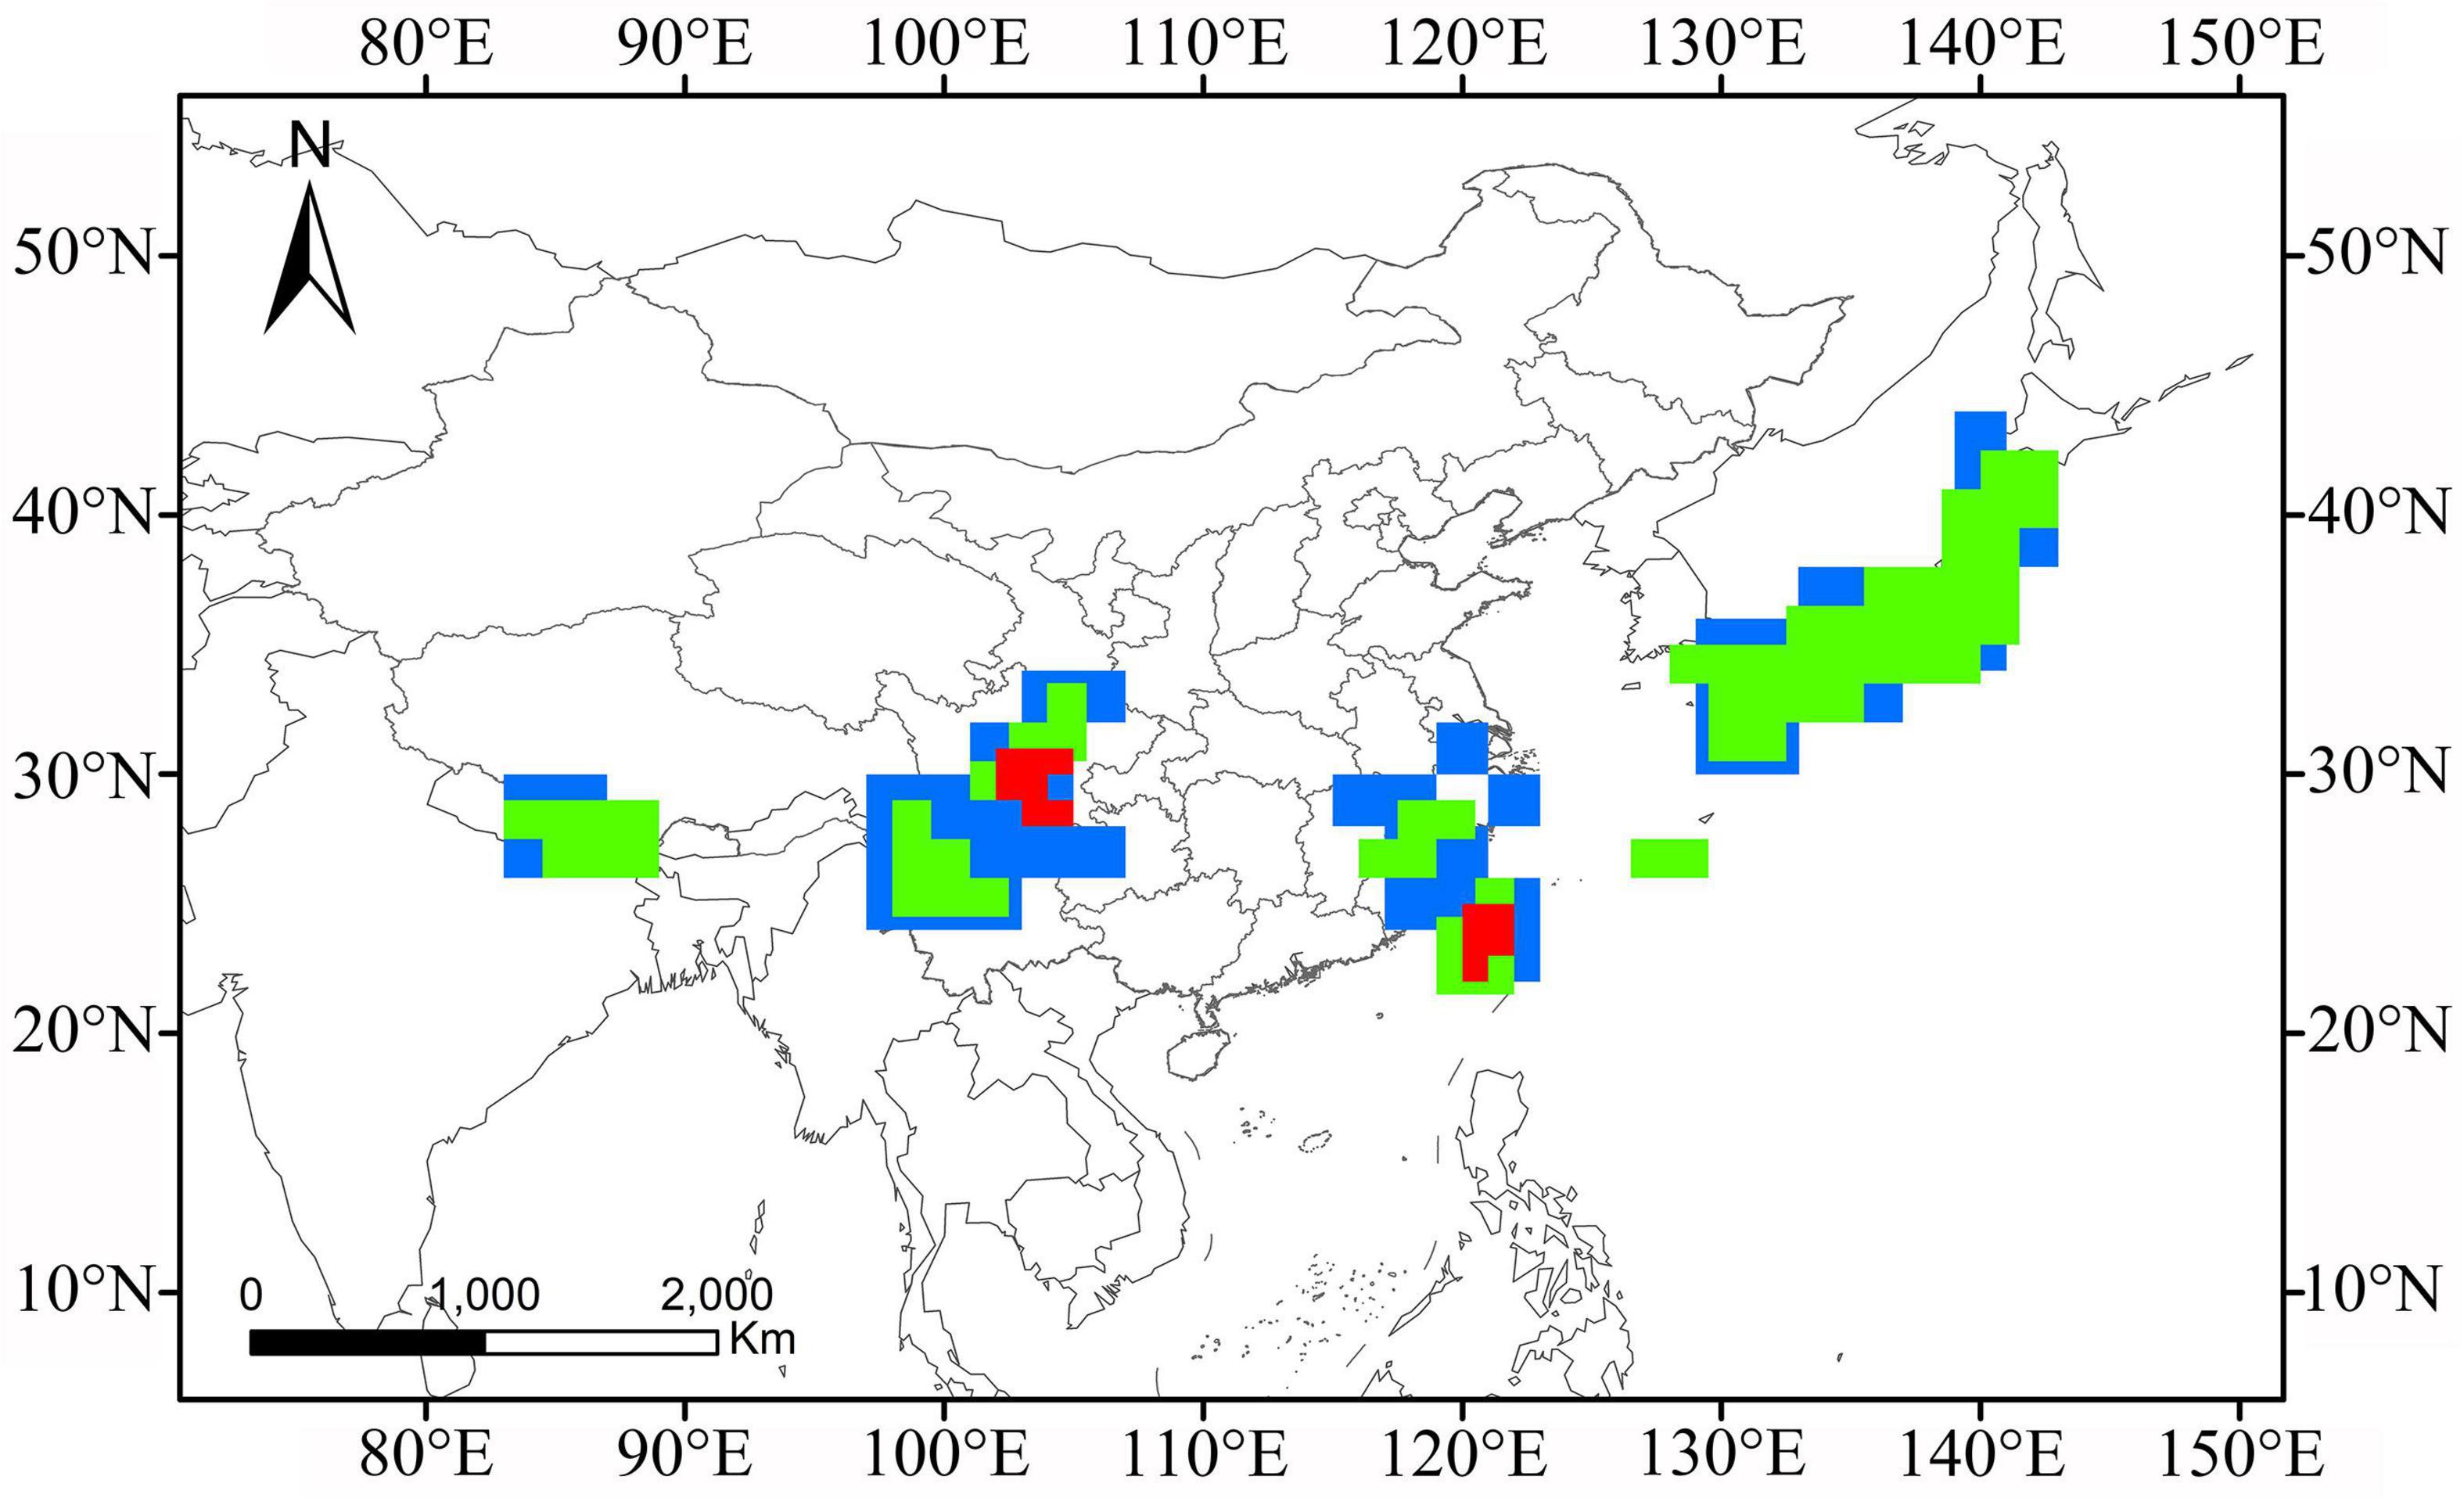
Figure 6. Overlap of the consensus AOEs detected for Lycocerus by EA employing 1° (red shadows), 1.5° (green shadows), and 2° (blue shadows) grid size.
(i) Central Himalayas: The CH includes the consensus areas 9 and 35 (Supplementary Table 2 and Supplementary Figures 2, 6) and seven species were found in both areas, including Lycocerus harmandianus, L. nepalensis, L. incisus, L. striatipennis, L. varipubens, L. indentatus, and L. lineatithorax.
(ii) Hengduan Mountains: Eight consensus areas were included in HDM as the following, 14, 15, 19, 20, 22, 25, 26, and 31 (Supplementary Table 2 and Supplementary Figures 3–5), and a total of 19 species support these consensus areas. Among them, some consensus areas are supported by two species as follows, the areas 15, 19, 20, 25, 26, and 31 by L. viridinitidus and L. nigrobilineatus; 14, 15, 19, 25, and 31 by L. nigrithorax and L. rufipennis; 19, 20, 26, and 31 by L. longipilis and L. metallicipennis; and 20, 22, and 26 by L. semimetallicus and L. elongatissimus, respectively. For the remaining consensus areas, each is supported by only one species as follows, the areas 15, 20, 25, 26, and 31 by L. pictipennis; 15, 19, 25, and 31 by L. pallidulus; 14, 25, and 31 by L. irrawaddicus; and 19 and 20 by L. oberthueri. The consensus areas with the greatest endemicity values were primarily located in southwest China, including the areas 19, 20, 22, 25, 26, and 31, accordingly with the scores of 4.96250, 5.51667, 4.48810, 4.48841, 5.51667, and 5.46250, respectively (Supplementary Table 2).
(iii) Eastern Sichuan Mountains: In total, 19 species contributed to the identification of consensus areas in this region. Among them, two species, L. sabdeensis and L. moxiensis provide support for the consensus areas 2, 6, 7, 16, 18, 22, 29, and 30; L. pulchellus and L. hickeriminus for 2, 4, 6, 7, 18, 29, and 30; and L. similis and L. jindrai for 7, 29, and 30, respectively. Only one species supports the rest consensus areas, L. oudai for 2, 4, 6, 16, 18, and 22; L. balangensis for 6, 7, 29, and 30; L. zdeneki for 2, 16, and 29; L. mugangensis for 16 and 22; and L. minutonitidus for 29 and 30, respectively. The consensus areas with the greatest endemicity values were determined, containing the areas 7, 29, and 30, with the scores of 5.25000, 6.25000, and 7.33333, respectively (Supplementary Table 2).
(iv) Eastern China Mountains: The region, covered by several mountains, such as Wuyi Mountains, Tianmu Mountains, Daiyun Mountain, and Yandang Mountain, contains consensus areas 8, 28, and 34 (Supplementary Table 2 and Supplementary Figures 2, 5, 6). Three species, L. nigrigenus, L. tienmushanus, and L. genaemaculatus support consensus areas 8 and 28, whereas L. tienmushanus provide support for all of the three consensus areas.
(v) Taiwan Island: Although as a small island, it is quite rich in the Lycocerus species, with a total of 20 endemic species there. Eight consensus areas were detected under all three grid sizes, including 1, 3, 10, 12, 17, 23, 27, and 33. Two species, L. chujoi and L. niisatoi, support all of the consensus areas (Supplementary Table 2 and Supplementary Figures 1, 3–6), and eight species, L. atroopacus, L. pictus, L. nigricollis, L. arisanensis, L. yangi, L. gressitti, L. elongatipes, and L. rhagonychiformis, support 1, 3, 10, 12, 23, and 33. Besides, only one species provides support for the remaining consensus areas, L. wenchuani for 10, 12, 17, 23, 27, and 33; L. pubescens for 1, 3, 10, 23, and 33; L. shimomurai for 1, 3, 10, 12, 27, and 33; L. costulatus for 1, 3, 17, 23, 27, and 33; L. tsuifengensis for 1, 3, 27, and 33; L. yitingi for 3, 10, 12, 17, and 33; L. evangelium for 3, 10, 12, and 33; L. pilipes for 10, 12, 23, and 33; and L. satoi for 3, 10, and 12, respectively. The first six consensus areas with the greatest endemicity values appeared in TW, including 1, 3, 10, 12, 23, and 33, with the scores of 11.68333, 13.27143, 13.35000, 12.54167, 13.25000, and 16.50000, respectively.
(vi) Japan: This AOE includes consensus areas 5, 11, 13, 21, 24, 32, 36, and 37 (Supplementary Table 2 and Supplementary Figures 2–6). Consensus areas were scattered almost over the whole territory of Japan Island (except Hokkaido Island). Four species, L. vitellinus, L. japonicus, L. okuyugawaranus, and L. maculielytris support consensus areas 5, 11, 21, 32, and 36; three species, L. shikokensis, L. xanthopus, and L. hokiensis support 24 and 37; two species, L. oedemeroides and L. matsunagai support 32 and 36; whereas only one species, L. babai and L. suturellus luteipennis support 5, 21, 32 and 21, 32, 36, respectively. The first five areas with the greatest endemicity values contain consensus areas 5, 21, 24, 32, and 36, with the scores of 4.37317, 5.36818, 4.45629, 6.48056, and 5.60346, respectively (Supplementary Table 2).
Discussion
Congruence of Species Richness and Endemism
In this study, the species richness patterns for Lycocerus species and the patterns of AOEs are generally consistent. Congruence between species richness and endemism patterns have been discovered in other groups, not only in plants (López-Pujol et al., 2011), but also in animals, from birds (Jetz et al., 2004; Lei et al., 2007), mammals (Tang et al., 2006) to insects (Huang et al., 2006, 2008; Yuan et al., 2014). This congruence confirmed the hypotheses that AOEs have acted as centers of speciation in the history (Terborgh, 1992), because AOEs characterized by diverse habitats and stable climates could maintain long-term speciation and persistence (Jetz et al., 2004). Both centers of species richness and endemism uncovered in the present study are mostly located in the south edge of Qinghai-Tibet Plateau, south margin of Chinese mainland, and on the mountainous islands of East Asia. Each area has experienced a unique geological history, either tectonic activities or climate changes, which contributed to its rich and always endemic biotas, as suggested by Gao et al. (2018). They are either montane or island systems, which supports the hypothesis of high biodiversity in these areas, with cantharid beetles as the subject for the first time.
Comparison and Evaluation of the Areas of Endemism Defined by Two Approaches
The definition of AOEs in PAE approach are the most-parsimonious tree (or strict consensus areas) as group of area units supported by two or more “synapomorphic species” (Morrone, 1994; Casagranda et al., 2012), its penalization is particularly strict for the absence of species within an area. In comparison, the consensus areas using EA approach are measured by the endemicity value of an area (EIA), which is calculated as the sum of the EIAs of the endemic species included in the area. However, there is no consensus on which approach is most suitable and their exploration should be continued (Escalante, 2015).
In general, the results of PAE and EA are similar in detecting the AOEs of Lycocerus in the global scale under three grid sizes. The consensus tree obtained in PAE resulted in more AOEs (KP and SP) and endemic species than that of EA, and some AOEs (e.g., Himalayas areas, Hengduan Mountains, and Eastern Sichuan Mountains) were detected with similar locations by the two methods but showed different distribution ranges. Both of these issues might be explained by the disparate algorithms under these two methods. EA tends to encompass more species into one AOE, whereas PAE arbitrarily clusters clades depending on shared taxa, which might lead to the results of different AOEs coverage.
In addition, the results of PAE and EA were inevitably influenced by grid sizes, both in constitution and coverage of AOEs (Szumik et al., 2002, 2012). The smaller grid sizes can produce narrow and accurate consensus areas (Moline and Linder, 2006; Gao et al., 2018; Zhao et al., 2021), but if they are too small, it will make all distributions entirely discontinuous, resulting in only very small AOEs. Besides, the grid size is correlated with the number and dispersion of the localities. Grid division of the same distribution site with different grid sizes can lead to different results. The results of our analyses are in concordance with the above expectations. Using the 1° grid size, EA generated the lowest number of consensus areas, while more consensus areas are identified in 1.5° and 2° grid sizes, including HDM, JPN, ECM, and CH, etc. Similar results were obtained under three different grid sizes in PAE. Compared with those detected under 1° and 1.5° grid sizes, more AOEs were identified at 2°, including HMA, HDM, ESM, SP, SEC, ECM, TW, KP, and JPN. Both two methods indicated that the grid size 2° is the best division in detecting the AOEs for the Lycocerus, because the AOEs determined by the smaller grid cells (1° and 1.5°) are too small or discontinuous, which might be the result of the fragmentation of species distribution caused by the latter.
Moreover, the performance of PAE and EA has been widely discussed using real or hypothetical distributions (e.g., Moline and Linder, 2006; Huang et al., 2008; Carine et al., 2009; Casagranda et al., 2012; do Prado et al., 2015; Escalante, 2015; Hoffmeister and Ferrari, 2016; Gao et al., 2018; Noroozi et al., 2019; Zhao et al., 2021). Although different optimality criteria have been developed to compare the performance of the two methods, no consensus has emerged on the appropriate method for identifying AOEs (Linder, 2001; Carine et al., 2009). Moreover, previous studies have proved a single method cannot identify the complete AOEs, and so do as a single grid size (do Prado et al., 2015; Gao et al., 2018; Zhuang et al., 2018; Zhao et al., 2021). Under this consideration, combining the two methods may provide a more comprehensive knowledge of AOEs for Lycocerus on the global scale.
Areas of Endemism of Lycocerus
A total of nine AOEs were detected using two different approaches under different grid sizes, including five montane areas (WEH/SH/EH/CH, HDM, SEC, ECM, and ESM), three islands (TW, JPN, and KP) and one plateau (SP), which is consistent with the previous studies on different organisms (Lei et al., 2003; Tang et al., 2006; Huang et al., 2010, 2012; Noroozi et al., 2019), also including several insect groups (Yuan et al., 2014; Wang et al., 2017; Gao et al., 2018, Zhao et al., 2020, 2021). Here soldier beetles were taken as the subject to identify the AOEs for the first time. Topographic complexity, habitat stability, human disturbance, geological events, and other factors are mainly considered to be the driving forces for the region to be identified as endemic areas.
Areas of Endemism in Montane Areas
Mountainous areas are generally considered to be the hot spots of providing varied habitats for insect speciation due to their complex topography and heterogeneous environments (Tojo et al., 2017; Gao et al., 2018). With the increase of terrain complexity, the amount of habitat diversity is expected to increase and promote the available niche space, in order to increase ecological speciation and species coexistence via adapting to different niches (Rundle and Nosil, 2005; Hendry et al., 2007). Additionally, mountains with steep altitude gradients are more likely to serve as shelters for organisms to adapt to the up and down movement in response to paleoclimate oscillations (Wu et al., 2017).
(i) Himalayan areas (HMA): More consensus areas are identified by PAE in this area, and they are distributed from the western to eastern part (WEH), eastern part (EH), and southeast part (SH), while those detected by EA are concentrated in the central part (CH). The number of species examined from HMA is the second largest following Japan, which may be due to the uplift of the Qinghai-Tibet Plateau. The latter was formed by the collision and compression of the Eurasian and the Indian plates, resulting in different altitude gradient climate (Huang et al., 2008; Gao et al., 2018), which provides intense selection pressures for differentiation of the species (Zhang, 1988; Li, 1995). Besides, several gorges in the HMA may have been important corridors for dispersal of organisms between different biogeographical regions, which, combined with the diversity of habitats, may facilitate accumulation and differentiation of endemic and non-endemic taxa (Huang et al., 2006). Moreover, the stable climate during glacial periods might have been the refugia for the organisms in favor of maintaining high regional endemism (Lei et al., 2015). These factors ultimately resulted in the adaptation and differentiation of Lycocerus within HMA.
(ii) Hengduan Mountains: This area consists of northern Yunnan, and central and southern Sichuan, and the number of species is second only to that of HMA. The HDM are parallel, north-south oriented mountain ranges characterized by the steep elevational gradient (Wu et al., 2017). Combined with the subtropical monsoon influence, HDM has generated highly varied climates and habitats (Gao et al., 2018). The diverse habitats within this area created favorable conditions for maintaining and promoting endemic diversity (Wu et al., 2017). Furthermore, this area is a biodiversity corridor, which is located at the transitional zone of Palaearctic and Oriental regions and facilitates the faunal exchange between these biogeographical regions (Lei et al., 2003, 2007). Moreover, the stable climate and environment maintained during the period of Pleistocene glaciations in this region offered refugia for the biotas (Zhang, 1999; Huang et al., 2006).
(iii) South edge of China: The SEC borders Vietnam and contains the southern Yunnan, and extends from Wuliang Mountains and Ailao Mountain to the south of Yungui Plateau. A total of 28 species are delimited to this area. The endemism of this region has also been reported by some others (López-Pujol et al., 2011; Gao et al., 2018). The relatively high fringe may isolate the fauna of this area from surrounding areas, suggested by Gao et al. (2018). It is influenced by a subtropical monsoon climate, and the warm temperatures and abundant precipitation result in high biodiversity there (Wen et al., 2014).
(iv) Eastern China Mountains: The ECM mainly corresponds to Fujian and Zhejiang, encompassing the Wuyi Mountains, Tianmu Mountains, Daiyun Mountains, and Yandang Mountains. The long geological history and complicated topography of this region resulted in the high biodiversity there, especially the pantropic element (Jiang and Zhang, 2000). However, only 10 Lycocerus species was hitherto reported in ECM, where the number is far from the expected. Probably, it is the result of serious interference of human activities in this region (Luniak, 2004). Human interference has caused major environmental damage, which however cannot satisfy the ecological requirement of insects there any longer.
(v Eastern Sichuan Mountains: ESM is adjacent to Hengduan Mountains in the west and Yungui Plateau in the south, and it is located between the first and the second step terrains in China, which is a significant channel for species diffusion and exchange from west to east (Hu et al., 2017).
High level of endemism in this area is also related to the geological events that they have experienced (Zhao et al., 2021). Under the effect of the Himalayan orogenies, a series of mountains were formed in Quaternary. Except for Hengduan Mountains, the formation of Minshan Mountain, Qionglai Mountain, and Daxue Mountain in this range co-occurred (Favre et al., 2015). The existence of multiple habitats in the montane system provided a refugia for biota during the Pleistocene glaciations (Huang et al., 2006; Qu et al., 2014). In addition, mountainous areas have long-term climate stability, which contributed to the persistence of biota, specialization, speciation of small-ranged species, and the reduction of extinction probability (Dynesius and Jansson, 2000; Jansson, 2003; López-Pujol et al., 2011), and hence leads to the further diversification of species.
Areas of Endemism on Islands
Taiwan Island and JPN are isolated islands from the Asia continent, and they once interrelated with the mainland when sea level retraced (Tada, 1994; Kitamura et al., 2001; Kitamura and Kimoto, 2004; He et al., 2018). Islands are relatively isolated regions that are vulnerable to fluctuating sea level, and punctuational connections with the source continent and adaptive radiation may promote species accumulation and separation. For the species occurring there, geographical isolation might have limited their dispersal back to the mainland and consequently promoted the present distribution pattern. The endemic levels of islands are affected by the area, distance and period of isolation from the mainland, historical events, multiple source pools, as well as island ecology and structure (He et al., 2018). Oceanic islands have been postulated as refugia for endemics because of thermal stability and slow biotic turnover (Cronk, 1997; Fjeldså et al., 2012).
(vi) Taiwan Island: Geographically, TW is located at the junction of Palaearctic and Oriental boundaries, and lies in the intersection of Philippine Sea and Eurasian continental plates (Päckert et al., 2009). By the superiority of geographic location, it facilitates the interfaunal exchange which promotes the differentiation of the species there. Besides, it is influenced by the subtropical climate and extensive altitudinal gradients, which result in high heterogeneity of ecological environment in the island, thus providing a diverse habitat for the biotas (Chou et al., 2011; Ito et al., 2017). Additionally, TW is a continental island with unique fauna, which is the result of the specific geological history and paleoclimate scenario of the East Asian continental margin (Lei et al., 2003; Feng et al., 2016). In terms of time, several dispersals and vicariance caused by the formation of land bridges between the continent and TW, enriched the species and quantity of endemic species in TW (Chou et al., 2011; He et al., 2018). In this study, a total of 184 distribution records belonging to 31 species of Lycocerus are obtained in TW, and most of them are endemic species, which confirmed TW is a biodiversity and endemism center.
(vii) Japan: JPN is identified as AOE almost over the whole territory. Within JPN, dozens of consensus areas are existed, and most of them are located in the Honshu Island. As the largest island of JPN, Honshu Island has the mountain ranges running north-south through the island chain, which plays an important role in geographical climate variation and providing diverse habitats for the biotas there (Gao et al., 2018). During the Pleistocene, the Lycocerus species likely immigrated into JPN through Kyushu Island and its affiliated islands (Okinawa Island, Toyama Island, Goto Islands, etc.), by a land bridge connected to the Indo-Malayan region in South China, due to the fact that some species occurring on these islands. Some of the species have since undergone vicariant speciation after the isolation caused by marine straits, and a high degree of endemism is the result (Liu et al., 2008; Gao et al., 2018).
The reason why many Lycocerus species and individuals have been found in Japan may be due to high human population density close to pristine Lycocerus habitat. For example, it is beyond doubt that the highest species diversity shown in Japan because of how much work has been done on this group there, particularly, owing to a comprehensive taxonomic work contributed by Okushima (2005). In the recent past, no new faunistic records have been added to Japan, but the new species and distribution records have been and are going to be discovered and reported in China and adjacent areas (Švihla, 2004, 2005, 2011; Yang and Yang, 2013; Yang et al., 2014; Hsiao and Okushima, 2015, 2016; Hsiao et al., 2016; Okushima and Hsiao, 2017; Kazantsev and Kopetz, 2019; Xi et al., 2021a,b).
(viii) Korean Peninsula: KP is identified as AOE with only one consensus area by PAE alone. It is located in the eastern Asia, and the marine climate formed by the sea from three sides has led to the similar environment as JPN. Three Lycocerus species are found KP, which are also widely distributed in JPN. Previous studies have shown that there was a narrow land bridge between KP and JPN (at the Tsushima Strait), during the Pleistocene glacial periods (Tada, 1994; Kitamura et al., 2001; Kitamura and Kimoto, 2004), which provides the possibility for the diffusion of Lycocerus from JPN to KP.
Area of Endemism in Continental Plateau
(ix) Shan Plateau: Only one consensus area was identified in this region by PAE. It is located at the southeast Myanmar and borders on the Yungui Plateau of China. The SP hosts the most extensive karst of the country and isolated from the surrounding area, with abundant carbonate beds leading to a series of north-south oriented limestone ridges along the dominant structural trend, which are separated by basins flowing southward while steep cliffs are dominant at the edge of the plateau toward the lowlands (Dreybrodt and Steiner, 2015). The complicated topography, combined with the tropical monsoon climates, provide diverse habitats, which may contribute to the high biodiversity in this region (Bird Life, 2014).
Conclusion
The geographical patterns of species richness and endemic areas of Lycocerus on a global scale were analyzed based on different approaches. Our results showed that the species richness centers mainly located in montane areas and islands, including Himalayas, Hengduan Mountains, Eastern Sichuan Mountains, Taiwan Island, and Japan Island, which are exactly consistent with the AOEs that identified using the PAE and EA. Our results highlight the importance of montane areas and mountainous islands in conservation and historical biology. The high biodiversity in montane and island systems mainly due to the complex topography and heterogeneous environments or thermal stability and slow biotic turnover, which promotes long-term persistence, speciation, and species accumulation. Future studies should be carried out based on the phylogenetic perspective to reveal the relation between AOEs and evolutionary histories.
Data Availability Statement
The original contributions presented in the study are included in the article/Supplementary Material, further inquiries can be directed to the corresponding authors.
Author Contributions
TL, HL, and YY conceived and designed the study. TL, YY, YW, and HX collected the distribution data. TL analyzed the data and wrote the manuscript. YY revised the manuscript. All authors had significant contributions to the article and gave final approval for publication.
Funding
This study was supported by the National Natural Science Foundation of China (No. 31772507), the Natural Science Foundation of Hebei Province (Nos. C201720112 and C2019201192), the Biodiversity Survey and Assessment Project of the Ministry of Ecology and Environment, China (No. 2019HJ2096001006), and the Science and Technology Project of Hebei Education Department (No. BJ2017030).
Conflict of Interest
The authors declare that the research was conducted in the absence of any commercial or financial relationships that could be construed as a potential conflict of interest.
Publisher’s Note
All claims expressed in this article are solely those of the authors and do not necessarily represent those of their affiliated organizations, or those of the publisher, the editors and the reviewers. Any product that may be evaluated in this article, or claim that may be made by its manufacturer, is not guaranteed or endorsed by the publisher.
Acknowledgments
We are grateful to Zhengxue Zhao (Guizhou University, Guiyang) and Xiaolei Huang (Fujian Agriculture and Forestry University, Fuzhou) for their valuable help in PAE and EA analysis. Thanks are also given to the reviewers for their wonderful suggestions in improving our original manuscript.
Supplementary Material
The Supplementary Material for this article can be found online at: https://www.frontiersin.org/articles/10.3389/fevo.2022.794750/full#supplementary-material
Footnotes
References
Bird Life (2014). Extraction and Biodiversity in Limestone Areas. Cambridge: Bird Life. Joint Briefing Paper
Brown, R. L., Jacobs, L. A., and Peet, R. K. (2007). Species Richness: Small Scale. Hoboken, NJ: John Wiley & Sons, Ltd.
Carine, M. A., Humphries, C. J., Guma, I. R., Reyes-Betancort, J. A., and Santos, G. A. (2009). Areas and algorithms: evaluating numerical approaches for the delimitation of areas of endemism in the Canary Islands archipelago. J. Biogeogr. 36, 593–611. doi: 10.1111/j.1365-2699.2008.02016.x
Casagranda, M. D., Taher, L., and Szumik, C. A. (2012). Endemicity analysis, parsimony and biotic elements: a formal comparison using hypothetical distributions. Cladistics 28, 645–654. doi: 10.1111/j.1096-0031.2012.00410.x
Chou, Y. W., Thomas, P. I., Ge, X. J., LePage, B. A., and Wang, C. N. (2011). Refugia and phylogeography of Taiwania in East Asia. J. Biogeogr. 38, 1992–2005. doi: 10.1111/j.1365-2699.2011.02537.x
Colwell, R. K. (2013). EstimateS: statistical Estimation of Species Richness and Shared Species from Samples. Available online at: http://purl.oclc.org/estimates (accessed on August 16, 2020)
Cracraft, J. (1985). Historical biogeography and patterns of differentiation within the South American avifauna: areas of endemism. Ornith. Monogr. 36, 49–84. doi: 10.2307/40168278
Cronk, Q. (1997). Islands: stability, diversity, conservation. Biodivers. Conserv. 6, 477–493. doi: 10.1023/A:1018372910025
Delkeskamp, K. (1977). “Cantharidae,” in Coleopterorum Catalogus Supplementa, eds J. A. Wilcox and W. Junk (The Hague: Junk Publishers), 1–485.
do Prado, J. R., Brennand, P. G. G., Godoy, L. P., Libardi, G. S., de Abreu-Júnior, E. F., Roth, P. R. O., et al. (2015). Species richness and areas of endemism of oryzomyine rodents (Cricetidae. J. Biogeogr. 42, 540–551. doi: 10.1111/jbi.12424
Dreybrodt, J., and Steiner, H. (2015). “Karst and caves of the shan plateau in mayanmar,” in Proceedings of the Asian Transkarst Conference (Lichuan)
Du, C. C., Chen, J., Jiang, L. Y., and Qiao, G. X. (2020). High correlation of species diversity patterns between specialist herbivorous insects and their specific hosts. J. Biogeogr. 47, 1232–1245. doi: 10.1111/jbi.13816
Dynesius, M., and Jansson, R. (2000). Evolutionary consequences of changes in species’ geographical distributions driven by Milankovitch climate oscillations. Proc. Natl. Acad. Sci. U.S.A. 97, 9115–9120. doi: 10.1073/pnas.97.16.9115
Escalante, T., Morrone, J. J., and Rodríguez-Tapia, G. (2013). Biogeographic regions of North American mammals based on endemism. Biol. J. Linn. Soc. 110, 485–499. doi: 10.1111/bij.12142
Escalante, T. (2015). Parsimony analysis of endemicity and analysis of endemicity: a fair comparison. Syst. Biodivers. 13, 413–418. doi: 10.1080/14772000.2015.1046966
Favre, A., Päckert, M., Pauls, S. U., Jähnig, S. C., Uhl, D., Michalak, I., et al. (2015). The role of the uplift of the Qinghai–Tibetan Plateau for the evolution of Tibetan biotas. Biol. Rev. 90, 236–253. doi: 10.1111/brv.12107
Feng, G., Mao, L. F., Sandel, B., Swenson, N. G., and Svenning, J. C. (2016). High plant endemism in China is partially linked to reduced glacial-interglacial climate change. J. Biogeogr. 43, 145–154. doi: 10.1111/jbi.12613
Fjeldså, J., Bowie, R. C., and Rahbek, C. (2012). The role of mountain ranges in the diversification of birds. Annu. Rev. Ecol. Evol. 43, 249–265. doi: 10.1146/annurev-ecolsys-102710-145113
Gao, C., Chen, J., Li, Y., Jiang, L. Y., and Qiao, G. X. (2018). Congruent patterns between species richness and areas of endemism of the Greenideinae aphids (Hemiptera: aphididae) revealed by global-scale data. Zool. J. Linn. Soc-Lond. 183, 791–807. doi: 10.1093/zoolinnean/zlx092
Goloboff, P. A., Farris, J. S., and Nixon, K. C. (2008). TNT, a free program for phylogenetic analysis. Cladistics 24, 774–786. doi: 10.1111/j.1096-0031.2008.00217.x
Goloboff, P. (2016). NDM and VNDM: Programs for the identification of areas of endemism, version. 3.1. Program Documentation. Available online at: http://www.lillo.org.ar/phylogeny (accessed on June 8, 2019)
Harold, A. S., and Mooi, R. D. (1994). Areas of endemism: definition and recognition criteria. Soc. Syst. Biol. 43, 261–266. doi: 10.1093/sysbio/43.2.261
He, J. K., Gao, Z. F., Su, Y. Y., Lin, S. L., and Jiang, H. S. (2018). Geographical and temporal origins of terrestrial vertebrates endemic to Taiwan. J. Biogeogr. 11, 2458–2470. doi: 10.1111/jbi.13438
Henderson, I. M. (1991). Biogeography without area? Aust. Syst. Bot. 4, 59–71. doi: 10.1071/SB9910059
Hendry, A. P., Nosil, P., and Rieseberg, L. H. (2007). The speed of ecological speciation. Funct. Ecol. 21, 455–464. doi: 10.1111/j.1365-2435.2007.01240.x
Hoffmeister, C. H., and Ferrari, A. (2016). Areas of endemism of arthropods in the Atlantic Forest (Brazil): an approach based on a meta consensus criterion using endemicity analysis. Biol. J. Linn. Soc. 119, 126–144. doi: 10.1111/bij.12802
Hsiao, Y., and Okushima, Y. (2015). A new species of the genus Lycocerus (Coleoptera, Cantharidae) from Taiwan. Elytra 5, 109–113.
Hsiao, Y., and Okushima, Y. (2016). A new species of the genus Lycocerus from Taiwan (Coleoptera: Cantharidae). Acta. Entomol. Mus. Natl. Pragae 56, 255–264.
Hsiao, Y., Okushima, Y., Yang, P. S., and Ko, C. C. (2016). Taxonomic revision of the Lycocerus hanatanii species group (Coleoptera, Cantharidae), with the description of new species from Taiwan. Eur. J. Taxon. 170, 1–33. doi: 10.5852/ejt.2016.170
Hu, Y. G., Suettinger, R. L., and Hu, C. Y. (2017). Sichuan. Encyclopedia Britannica. Available online at: https://www.britannica.com/place/Sichuan (accessed October 4, 2021).
Huang, X. L., Qiao, G. X., and Lei, F. M. (2010). Use of parsimony analysis to identify areas of endemism of Chinese Birds: implications for conservation and biogeography. Int. J. Mol. Sci. 11, 2097–2108. doi: 10.3390/ijms11052097
Huang, X. L., Qiao, G. X., and Lei, F. M. (2006). Diversity and distribution of aphids in the Qinghai–Tibetan Plateau–Himalayas. Ecol. Entomol. 31, 608–615. doi: 10.1111/j.1365-2311.2006.00819.x
Huang, X. L., Lei, F. M., and Qiao, G. X. (2008). Areas of endemism and patterns of diversity for aphids of the Qinghai–Tibetan Plateau and the Himalayas. J. Biogeogr. 35, 230–240. doi: 10.1111/j.1365-2699.2007.01776.x
Huang, J. H., Chen, B., Liu, C. R., Lai, J. S., Zhang, J. L., and Ma, K. P. (2012). Identifying hotspots of endemic woody seed plant diversity in China. Divers. Distrib. 18, 673–688. doi: 10.1111/j.1472-4642.2011.00845.x
Ito, T., Yu, C. C., Nakamura, K., Chung, K. F., Yang, Q. E., Fu, C. X., et al. (2017). Unique parallel radiations of high-mountainous species of the genus Sedum (Crassulaceae) on the continental island of Taiwan. Mol. Phylogenet. Evol. 113, 9–22. doi: 10.1016/j.ympev.2017.03.028
Jansson, R. (2003). Global patterns in endemism explained by past climatic change. P. Roy. Soc. B Biol. Sci. 270, 583–590. doi: 10.1098/rspb.2002.2283
Jetz, W., Rahbek, C., and Colwell, R. K. (2004). The coincidence of rarity and richness and the potential signature of history in centres of endemism. Ecol. Lett. 7, 1180–1191. doi: 10.1111/j.1461-0248.2004.00678.x
Jiang, B. L., and Zhang, H. D. (2000). Floristic study of spermatophyte of Fujian province. Guihaia 20, 117–125.
Kang, T. H., and Okushima, Y. (2003). Taxonomic study of Korean Cantharidae (Coleoptera). Elytra 31, 341–351.
Kasantsev, S. V. (1999). Revision of Lycocerus gorham of indochina and adjacent regions, with the description of Walteria, a new genus (Coleoptera, Cantharidae). Ent. Basil. 21, 115–134.
Kazantsev, S., and Brancucci, M. (2007). “Cantharidae,” in Catalogue of Palaearctic Coleoptera; I. Löbl & A. Smetana. (eds) (Stenstrup: Apollo Books).
Kazantsev, S. V., and Kopetz, A. (2019). New apterous cantharids from China (Insecta: Coleoptera: Cantharidae). Vernate 38, 197–279.
Kitamura, A., Takano, O., Takata, H., and Omote, H. (2001). Late Pliocene–early Pleistocene paleoceanographic evolution of the Sea of Japan. Palaeogeogr. Palaeocl. 172, 81–98. doi: 10.1016/S0031-0182(01)00272-3
Kitamura, A., and Kimoto, K. (2004). Reconstruction of the southern channel of the Japan Sea at 3.9–1.0 Ma. Quaternary Res. 43, 417–434. doi: 10.4116/jaqua.43.417
Lago-Barcia, D., DaSilva, M. B., Conti, L. A., and Carbayo, F. (2020). Areas of endemism of land planarians (Platyhelminthes: Tricladida) in the Southern Atlantic Forest. PLoS One 15:e0235949. doi: 10.1371/journal.pone.0235949
Lei, F. M., Qu, Y. H., Lu, J. L., Liu, Y., and Yin, Z. H. (2003). Conservation on diversity and distribution patterns of endemic birds in China. Biodivers. Conserv. 12, 239–254. doi: 10.1023/A:1021928801558s
Lei, F. M., Wei, G. A., Zhao, H. F., Yin, Z. H., and Lu, J. L. (2007). China subregional avian endemism and biodiversity conservation. Biodivers. Conserv. 16, 1119–1130. doi: 10.1007/978-1-4020-6320-6_19
Lei, F. M., Qu, Y. H., Song, G., Alström, P., and Fjeldså, J. (2015). The potential drivers in forming avian biodiversity hotspots in the East Himalaya Mountains of Southwest China. Integr. Zool. 10, 171–181. doi: 10.1111/1749-4877.12121
Li, B. S. (1995). “Ecological environment of the Mt. Namjagbarwa region,” in Flora and Fauna of the Mt. Namjagbarwa Region, eds B. S. Li, X. L. Mao, and Z. W. Wang (Beijing: Science Press), 1–17.
Li, J. J., Liu, H. H., Wu, Y. X., Zeng, L. D., and Huang, X. L. (2019). Spatial patterns and determinants of the diversity of Hemipteran insects in the Qinghai–Tibetan Plateau. Front. Ecol. Evol. 7:165. doi: 10.3389/fevo.2019.00165
Li, J. J., Li, Q., Wu, Y. X., Y, L. Q., Liu, H. H., Wei, J. F., et al. (2021). Mountains act as museums and cradles for hemipteran insects in China: evidence from patterns of richness and phylogenetic structure. Global. Ecol. Biogeogr. 30, 1070–1085. doi: 10.1111/geb.13276
Liu, X. Y., Hayashi, F., and Yang, D. (2008). Systematics and biogeography of the fishfly genus Parachauliodes (Megaloptera: Corydalidae) endemic to the East Asian Islands. Syst. Entomol. 33, 560–578. doi: 10.1111/j.1365-3113.2008.00429.x
Linder, H., and Mann, D. (1998). The phylogeny and biogeography of Thamnochortus (Restionaceae). Bot. J. Linn. Soc. 128, 319–357. doi: 10.1111/j.1095-8339.1998.tb02125.x
Linder, H. P. (2001). On areas of endemism, with an example from the African Restionaceae. Syst. Biol. 50, 892–912. doi: 10.1080/106351501753462867
López-Pujol, J., Zhang, F. M., Sun, H. Q., Ying, T. S., and Ge, S. (2011). Centres of plant endemism in China: places for survival or for speciation? J. Biogeogr. 38, 1267–1280. doi: 10.1111/j.1365-2699.2011.02504.x
Luniak, M. (2004). “Synurbization-adaptation of animal wildlife to urban development,” in Proceedings of the 4th International Symposium on Urban Wildlife Conservation, eds Shaw W., Harris L. K., Van Druff L. (Tucson, AZ: University of Arizona)
Mittermeier, R., Gil P, H. M., Pilgrim, J., Brooks, T., Mittermeier, C., Lamoreux, J., et al. (2005). Hotspots Revisited: Earth’s Biologically Richest and Most Endangered Terrestrial Ecoregions. Washington, DC: Conservation International.
Moline, P. M., and Linder, H. P. (2006). Input data, analytical methods and biogeography of Elegia (Restionaceae). J. Biogeogr. 33, 47–62. doi: 10.1111/j.1365-2699.2005.01369.x
Morrone, J. J. (1994). On the identification of areas of endemism. Syst. Biol. 43, 438–441. doi: 10.1093/sysbio/43.3.438
Morrone, J. J., and Crisci, J. V. (1995). Historical biogeography: introduction to methods. Annu. Rev. Ecol. Syst. 26, 373–401. doi: 10.1146/annurev.es.26.110195.002105
Morrone, J. J. (2014a). Biogeographical regionalisation of the neotropical region. Zootaxa 3782, 1–110. doi: 10.11646/zootaxa.3782.1.1
Morrone, J. J. (2014b). Parsimony analysis of endemicity (PAE) revisited. J. Biogeogr. 41, 842–854. doi: 10.1111/jbi.12251
Myers, N., Mittermeier, R. A., Mittermeier, C. G., Da Fonseca, G. A. B., and Kent, J. (2000). Biodiversity hotspots for conservation priorities. Nature 403, 853–858. doi: 10.1038/35002501
Nelson, G., and Platnick, N. (1981). Systematics and Biogeography. New York, NY: Columbia University Press.
Nihei, S. S. (2006). Misconceptions about parsimony analysis of endemicity. J. Biogeogr. 33, 2099–2106. doi: 10.1111/j.1365-2699.2006.01619.x
Noroozi, J., Talebi, A., Doostmohammadi, M., Rumpf, S. B., Linder, H. P., and Schneeweiss, G. M. (2018). Hotspots within a global biodiversity hotspot-areas of endemism are associated with high mountain ranges. Sci. Rep. 8:10345.
Noroozi, J., Zare, G., Sherafati, M., Mahmoodi, M., Moser, D., Asgarpour, Z., et al. (2019). Patterns of endemism in Turkey, the meeting point of three global biodiversity hotspots, based on three diverse families of vascular plants. Front. Ecol. Evol. 7:159. doi: 10.3389/fevo.2019.00159
Okushima, Y. A. (2005). Taxonomic study on the genus Lycocerus (Coleoptera. J. Syst. Entomol. Monogr. Ser. 2, 1–383.
Okushima, Y. (2007). Three new metallic species of the genus Lycocerus (Coleoptera: Cantharidae) Elytra 35, 129–141.
Okushima, Y., and Brancucci, M. (2008). A remarkable new species of the genus Lycocerus Gorham, 1889 from Laos and Vietnam (Coleoptera: Cantharidae) Entomol. Basiliensia Collect. Frey 30, 41–47.
Okushima, Y., and Yang, Y. X. (2013). Two new species of the subfamily cantharinae (Coleoptera. Elytra 3, 89–96.
Okushima, Y., and Hsiao, Y. (2017). Revision of the Lycocerus fainanus Group (Coleoptera. Spec. Bull. Coleopterol. Soc. Jpn. 1, 121–130.
Orme, C. D., Davies, R. G., Burgess, M., Eigenbrod, F., Pickup, N., Olson, V. A., et al. (2005). Global hotspots of species richness are not congruent with endemism or threat. Nature 436, 1016–1019. doi: 10.1038/nature03850
Päckert, M., Martens, J., and Severinghaus, L. L. (2009). The Taiwan Firecrest (Regulus goodfellowi) belongs to the Goldcrest assemblage (Regulus regulus s. l.): evidence from mitochondrial DNA and the territorial song of the Regulidae. J. Ornithol. 150, 205–220. doi: 10.1007/s10336-008-0335-5
Qu, Y. H., Ericson, P. G. P., Quan, Q., Song, G., Zhang, R. Y., Gao, B., et al. (2014). Long-term isolation and stability explain high genetic diversity in the Eastern Himalaya. Mol. Ecol. 23, 705–720. doi: 10.1111/mec.12619
Rosen, B. R. (1988). “From fossils to earth history: applied historical biogeography,” in Analytical Biogeography: an Integrated Approach to the Study of Animal and Plant Distribution, eds A. A. Myers and P.S. Giller (London: Chapman and Hall), 437–481.
Rundle, H. D., and Nosil, P. (2005). Ecological speciation. Ecol. Lett. 8, 336–352. doi: 10.1111/j.1461-0248.2004.00715.x
Santos, C. M. D., and Fuhlendorf, M. (2019). GeX: an automated tool for generating XYD files for analysis of endemicity using VNDM. Cladistics 35, 125–129. doi: 10.1111/cla.12236
Švihla, V. (2004). New taxa of the subfamily Cantharinae (Coleoptera, Cantharidae) from southeastern Asia with notes on other species. Ent. Basil. 26, 155–238.
Švihla, V. (2005). New taxa of the subfamily Cantharinae (Coleoptera: Cantharidae) from southeastern Asia with notes on other species II. Acta. ENT. Mus. Nat. Pra. 45, 71–110.
Švihla, V., and Mifsud, D. (2006). Annotated review of the Cantharidae and Malachiidae (Coleoptera) of the Maltese Islands. Acta. ENT. Mus. Nat. Pra. 46, 89–105.
Švihla, V. (2011). New taxa of the subfamily Cantharinae (Coleoptera: Cantharidae) from southeastern Asia, with notes on other species III. Zootaxa 2895, 1–34. doi: 10.11646/zootaxa.2895.1.1
Szumik, C. A., Cuezzo, F., Goloboff, P. A., and Chalup, A. E. (2002). An optimality criterion to determine areas of endemism. Syst. Biol. 51, 806–816. doi: 10.1080/10635150290102483
Szumik, C., and Goloboff, P. (2004). Areas of endemism:an improved optimality criterion. Syst. Biol. 53, 968–977. doi: 10.1080/10635150490888859
Szumik, C., Aagesen, L., Casagranda, D., Arzamendia, V., Baldo, D., Claps, L. E., et al. (2012). Detecting areas of endemism with a taxonomically diverse data set: plants, mammals, reptiles, amphibians, birds, and insects from Argentina. Cladistics 28, 317–329. doi: 10.1111/j.1096-0031.2011.00385.x
Tada, R. (1994). Paleoceanographic evolution of the Japan Sea. Palaeogeogr. Palaeocl. 108, 487–508. doi: 10.1016/0031-0182(94)90248-8
Tang, Z., Wang, Z., Zheng, C., and Fang, J. (2006). Biodiversity in China’s mountains. Front. Ecol. Environ. 4, 347–352. doi: 10.1890/1540-92952006004 [0347:BICM]2.0.CO;2.
Terborgh, J. (1992). Diversity and the Tropical Rain Forest. New York, NY: Scientific American Library.
Tojo, K., Sekiné, K., Takenaka, M., Isaka, Y., Komaki, S., Suzuki, T., et al. (2017). Species diversity of insects in Japan: their origins and diversification processes. Entomol. Sci. 20, 357–381. doi: 10.1111/ens.12261
Wang, F., Jiang, C. Z., Liu, J. Z., and Wei, J. F. (2017). Areas of endemism for scale insects in China. J. Asia-Pac. Entomol. 20, 1170–1174. doi: 10.1016/j.aspen.2017.08.024
Wen, Y. G., Li, Z. J., Li, X. X., Liang, H. W., He, T. P., Zhuang, J., et al. (2014). Types of vegetation and its classified system in Guangxi. Guangxi Sci. 21, 484–513.
Wittmer, W. (1982). Die familie Cantharidae (Col.) auf Taiwan (1. Teil). Entomol. Rev. Jpn. 37, 119–140.
Wittmer, W. (1983). Die Familie Cantharidae (Col.) auf Taiwan (2. Teil). Entomol. Rev. Jpn. 38, 147–172.
Wittmer, W. (1984). Die familie Cantharidae (Col.) auf Taiwan (3. Teil). Entomol. Rev. Jpn. 41, 141–166.
Wittmer, W. (1995). Zur Kenntnis der Gattung Athemus Lewis (Col. Cantharidae). Ent. Basil. 18, 171–286.
Wittmer, W. (1997). Neue Cantharidae (Col.) aus China and Vietnam der Ausbeuten von Prof. Dr. Masataka SATO in den Jahren 1995 und 1996. Jpn. J. syst. Ent. 3, 33–42.
Wu, Y. J., DuBay, S. G., Colwell, R. K., Ran, J. H., and Lei, F. M. (2017). Mobile hotspots and refugia of avian diversity in the mountains of south-west China under past and contemporary global climate change. J. Biogeogr. 44, 615–626. doi: 10.1111/jbi.12862
Xi, H. C., Wang, Y. N., Liu, T., Yang, X. K., Liu, H. Y., and Yang, Y. X. (2021a). Spatial Origin and Diversification of the Lycocerus fainanus Species Group. Insects 12:445. doi: 10.3390/insects12050445
Xi, H. C., Wang, Y. N., Yang, X. K., Liu, H. Y., and Yang, Y. X. (2021b). New species and taxonomic notes on Lycocerus hickeri species-group (Coleoptera. Cantharidae). Zootaxa 4980, 541–557. doi: 10.11646/zootaxa.4980.3.5
Yang, Y. X., and Yang, X. K. (2013). Four new species of Lycocerus Gorham, 1889 from China (Coleoptera: Cantharidae). J. Nat. Hist. 47, 75–86. doi: 10.1080/00222933.2012.742169
Yang, Y. X., Su, J. Y., and Yang, X. K. (2014). Description of six new species of Lycocerus Gorham. Zookeys 456, 85–107. doi: 10.3897/zookeys.456.8465
Yuan, S., Huang, M., Wang, X. S., Ji, L. Q., and Zhang, Y. L. (2014). Centers of endemism and diversity patterns for Typhlocybine leafhoppers (Hemiptera: Cicadellidae: Typhlocybinae) in China. Insect Sci. 21, 523–526. doi: 10.1111/1744-7917.12040
Zhao, Z. X., Yang, L., Long, J. K., Chang, Z. M., Zhou, Z. X., Zhi, Y., et al. (2020). Testing Seven Hypotheses to Determine What Explains the Current Planthopper (Fulgoridae) Geographical and Species Richness Patterns in China. Insects 11:892. doi: 10.3390/INSECTS11120892
Zhao, Z. X., Yang, L., Long, J. K., Chang, Z. M., Zhou, Z. X., Zhi, Y., et al. (2021). Endemism patterns of Planthoppers (Fulgoroidea) in China. Front. Ecol. Evol. 9:683722. doi: 10.3389/fevo.2021.683722
Zhang, J. W. (1988). “Ecological-Geographic distribution of the vegetation,” in Vegetation of Tibet, eds Institute of Botany of the Chinese Academy of Sciences and Changchun Institute of Geography of the Chinese Academy of Sciences (Beijing: Science Press).
Keywords: soldier beetles, species richness, parsimony analysis of endemicity, endemicity analysis, area of endemism
Citation: Liu T, Liu H, Wang Y, Xi H and Yang Y (2022) Assessing the Diversity and Distribution Pattern of the Speciose Genus Lycocerus (Coleoptera: Cantharidae) by the Global-Scale Data. Front. Ecol. Evol. 10:794750. doi: 10.3389/fevo.2022.794750
Received: 14 October 2021; Accepted: 17 January 2022;
Published: 10 February 2022.
Edited by:
Rubén G. Mateo, Autonomous University of Madrid, SpainReviewed by:
Rosa Amelia Scherson, University of Chile, ChileYun Hsiao, Commonwealth Scientific and Industrial Research Organisation (CSIRO), Australia
Copyright © 2022 Liu, Liu, Wang, Xi and Yang. This is an open-access article distributed under the terms of the Creative Commons Attribution License (CC BY). The use, distribution or reproduction in other forums is permitted, provided the original author(s) and the copyright owner(s) are credited and that the original publication in this journal is cited, in accordance with accepted academic practice. No use, distribution or reproduction is permitted which does not comply with these terms.
*Correspondence: Haoyu Liu, bGl1aHlAaGJ1LmVkdS5jbg==; Yuxia Yang, eXh5YW5nQGhidS5lZHUuY24=