- 1State Key Laboratory of Ecological Pest Control for Fujian and Taiwan Crops, Institute of Applied Ecology, Fujian Agriculture and Forestry University, Fuzhou, China
- 2International Joint Research Laboratory of Ecological Pest Control, Ministry of Education, Fujian Agriculture and Forestry University, Fuzhou, China
- 3Ministerial and Provincial Joint Innovation Centre for Safety Production of Cross-Strait Crops, Fujian Agriculture and Forestry University, Fuzhou, China
- 4Tea Research Institute, Fujian Academy of Agricultural Sciences, Fuzhou, China
- 5Key Laboratory of Integrated Pest Management for Fujian-Taiwan Crops, Ministry of Agriculture and Rural Affairs, Fuzhou, China
- 6BGI-Sanya, BGI Genomics Shenzhen Technology Co., Ltd., Sanya, China
- 7Comprehensive Technology Service Center of Quanzhou Customs, Quanzhou, China
The effect of landscape patterns and environmental factors on the population structure and genetic diversity of organisms is well-documented. However, this effect is still unclear in the case of Mymaridae parasitoids. Despite recent advances in machine learning methods for landscape genetics, ensemble learning still needs further investigation. Here, we evaluated the performance of different boosting algorithms and analyzed the effects of landscape and environmental factors on the genetic variations in the tea green leafhopper parasitoid Stethynium empoasca (Hymenoptera: Mymaridae). The S. empoasca populations showed a distinct pattern of isolation by distance. The minimum temperature of the coldest month, annual precipitation, the coverage of evergreen/deciduous needleleaf trees per 1 km2, and the minimum precipitation of the warmest quarter were identified as the dominant factors affecting the genetic divergence of S. empoasca populations. Notably, compared to previous machine learning studies, our model showed an unprecedented accuracy (r = 0.87) for the prediction of genetic differentiation. These findings not only demonstrated how the landscape shaped S. empoasca genetics but also provided an essential basis for developing conservation strategies for this biocontrol agent. In a broader sense, this study demonstrated the importance and efficiency of ensemble learning in landscape genetics.
Introduction
The field of landscape genetics quantifies how heterogeneous landscape features and environmental factors shape genetic variations in living organisms. It has been applied in many research areas, such as conservation biology, alien species invasion, and pest management (Bowman et al., 2016; Jonsson et al., 2017). Traditional landscape genetics studies are often restricted by the subjectivity of producing resistance surfaces and the difficulty of addressing inter-variable interactions (Pless et al., 2021). Compared to these traditional methods, machine learning algorithms can develop strong non-linear regression models (Elavarasan et al., 2018). Further, with increasing access to remote sensing and climate data, machine learning methods can be used to explore the effects of multiple environmental factors on genetic variations at any sampling scale. Some machine learning approaches include deep learning (Kittlein et al., 2022) and random forest (Murphy et al., 2010; Sylvester et al., 2018; Shanley et al., 2021) been recently developed for their application in landscape genetics.
Despite increasing applications, current machine learning methods still show some limitations for landscape genetics. For example, a convolutional neural network (CNN), a deep learning method first introduced in landscape genetics by Kittlein et al. (2022), usually performs poorly on small datasets (Elavarasan et al., 2018). This is a major limitation as the number of sample sites in most population-based landscape genetic studies is often <50. Additionally, CNN approaches are limited in their ability to identify features at different sampling scales, such as sampling over oceans. They show substantial distance disparities, resulting in high variance across samples. Consequently, extracting useful features from remote sensing images using CNN becomes challenging. Comparatively, ensemble learning methods are gaining attention in landscape genetics. Ensemble learning aims to improve predictive performance by aggregating predictions from many weak models (Opitz and Maclin, 1999; Polikar, 2006) and has some algorithms, such as bagging, boosting, and stacking. Ensemble methods have currently shown excellent performance in various fields, including production forecasting and gas emission forecasting (Bossavy et al., 2013; Liu et al., 2020; Chen K. et al., 2021). Random forest is the most frequently used ensemble learning algorithm in landscape ecology and genetics. It is compatible with multiple variables and can effectively extract the relative importance of features. However, the recently developed algorithm, iterative random forest, have low prediction accuracy (Pless et al., 2021); therefore, evaluating the performance of different ensemble algorithms and identifying the appropriate methods that can be used in fine-scale landscape genetics studies is necessary.
Biological control is a sustainable pest management strategy to reduce the application and adverse effects of chemical pesticides (Cranham, 1966; Nakai, 2009; Zhuang et al., 2009; Yue et al., 2010; Carvalho, 2017) and genetically modified crops (Rodriguez-Saona, 2018). To develop effective biological control strategies, investigating the effects of landscape features and environmental factors on the genetic variations in wild natural enemies is necessary using landscape genetics methods. Stethynium empoasca Subba Rao (fairy wasp; Hymenoptera: Mymaridae) is an egg parasitic natural enemy (Huber, 1986; Mills, 1994) of Empoasca onukii Matsuda, the most destructive insect pest of tea plantations in East Asia. Some members of the Mymaridae family, such as Gonatocerus ashmeadi Girault in Tahiti (Grandgirard et al., 2007) and Paranagrus optabilis Perkins in Hawaii (Funasaki et al., 1988), have been used in biological control since a long time. However, only a few studies have analyzed their genetics (de León and Jones, 2005; De Leon et al., 2009; Nadel et al., 2012; Li et al., 2021). S. empoasca, having a high rate of parasitism (up to 30%; Li et al., 2021) in the field, is the most promising candidate for conservative biological control of E. onukii. Examining its population genetic variation and its relationship with the landscape features and environmental factors will provide a better understanding of its survival requirements and the influence of environmental factors; moreover, this may further assist in developing conservative strategies for better biological control of E. onukii.
In this study, we determined which ensemble model performed best on the collected data and then identified the environmental and landscape factors that could affect the genetic differentiation and diversity of S. empoasca. Our findings could provide practical suggestions for conserving S. empoasca parasitoids that serve as biocontrol agents. To the best of our knowledge, our research is the first to demonstrate a practical empirical method for exploring the landscape genetics of the Mymaridae family.
Materials and methods
Sample collection and microsatellite genotyping
The study was conducted in Fujian Province, China. Twenty tea plantations with different ambient landscape patterns and latitudes were selected for the study. To minimize the influence of recent tea seedling transportation and differences in pesticide use, only conventional tea plantations planted many years ago were selected for this study. In total, 506 S. empoasca individuals were collected from 20 sample sites (17 sites in Wuyishan city and 1 site each in Anxi, Fuzhou, and Fuding cities) in 2019 (Table 1). After sample collection, all individuals were confirmed by morphological identification according to previous studies (Triapitsyn et al., 2019).
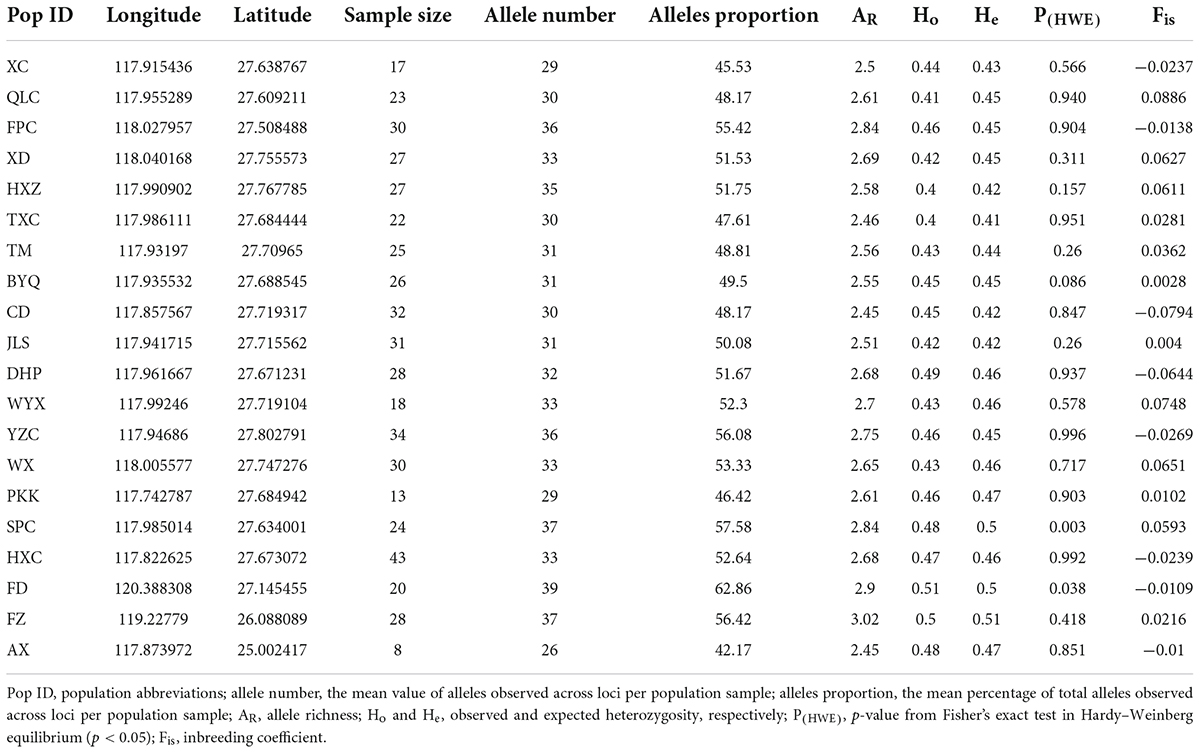
Table 1. Genetic diversity and geographic information of 20 S empoasca populations based on 10 microsatellite loci.
The habitus image of S. empoasca is shown in Supplementary Figures 1, 2. Ten microsatellite loci developed by Li et al. (2021) were tested and selected to genotype S. empoasca. To improve the amplification efficiency of these loci and to reduce their cost, a primer tail C was added to the 5′ end of the candidate forward primer, and a fluorescent marker was added to identify the genotypes of the various loci (Blacket et al., 2012). A polymerase chain reaction (PCR) reaction was conducted in a 10 μL. After amplifying the microsatellite marker listed in Supplementary Table 1 and the PCR procedures shown in Supplementary Table 2, the PCR products were analyzed using an ABI 3730 xl DNA Analyzer (Thermo Fisher Scientific, Waltham, MA, USA) and a GeneScan™ 500 LIZ® Size Standard (Thermo Fisher Scientific). The microsatellite loci were manually determined using GeneMapper v. 3.2 (Lemonick., 2000) and checked for stuttering and large allele dropout by MICROCHECKER v. 2.2.3 (Van Oosterhout et al., 2004). Finally, microsatellite genotype data were obtained from 506 individuals and used in the subsequent landscape genetics analysis.
Climate and landscape data
Two datasets were used to evaluate the effect of the environment and landscape on genetic differentiation in S. empoasca. We selected 19 bioclimatic variables with 1 km2 resolution in Woldclim (Fick and Hijmans, 2017) and 12 landscape variables with the same resolution in EarthEnv (Tuanmu and Jetz, 2014). In the EarthEnv datasets, some variables, such as open water, snow/ice, barren, deciduous broadleaf trees, and regularly flooded vegetation, which rarely exist in our study region, were finally not included in the model (Supplementary Table 3). Each pixel on the map in this EarthEnv dataset represents the percentage of one land-cover class in a 1 km2 area. The ensemble learning method is based on decision trees, which have been proven highly efficient in dealing with redundant variables. Therefore, we did not remove multicollinearity variables. All datasets were cropped according to the extent of our study region. The straight-line (STR) method was applied to construct the resistance surface to calculate the resistance distance among the selected sample sites. All resistance distances in this study were calculated using the mean value of each pixel on the path between pairwise sampling sites, aiming to avoid some distance-based bias that potentially resulted from sampling site selection/distribution.
The land use raster map for each of the three regions was downloaded from the 2018 National Standard Land Use Type Classification on the Geospatial Data Cloud platform.1 The downloaded raster maps were classified into four land cover types: forest, tea plantation, crop, and non-vegetation area (e.g., water body, built-up, and empty area). Further, 1,000 and 2,000-m radius buffers were drawn for each site using the “rgeos” package (Bivand et al., 2017) in R. To measure the fragmentation levels in each study region, four class-level and two landscape-level indexes were computed at the allocated buffers. At the class level, the number of patches (NP), edge density (ED), patch density (PD), and patch cohesion index (COHESION) were used to describe fragmentation and connectivity. Shannon’s diversity index (SHDI) and Shannon’s evenness index (SIEI) were used to illustrate the landscape-level fragmentation. The R package “landscape metrics” computed these indexes (Hesselbarth et al., 2019).
Data analysis
Population genetic differentiation and genetic structure analysis
Seven parameters, including allele number, allele proportion, allele richness (AR), expected heterozygosity (He), observed heterozygosity (Ho), inbreeding coefficient within the population (Fis), and Hardy–Weinberg equilibrium (HWE), were selected to illustrate S. empoasca genetic diversity within a population. All variables were calculated using the R package “diveRsity” (Keenan et al., 2013). Population pairwise genetic differentiation (FST) was calculated between a population pair using the R package “adegenet” (Jombart, 2008).
Discriminant analysis of principal components (DAPC) was then performed using the R package “adegenet” to deduce the spatial pattern of population structure. DAPC is a low computational-cost method that performs a k-mean algorithm after the transformation of principal component analysis (PCA) (Jombart et al., 2010). We used the “find cluster” function with 107 iterations to determine the best genetic cluster. A linear regression model and Pearson’s correlation analysis were performed to detect the pattern of isolation by distance (IBD).
Model comparison and construction
All models were run in Python 3.8. In the preliminary analysis, we evaluated the performance of eight commonly used ensemble learning algorithms: the Adaboost algorithm with decision tree and random forest classifier, the eXtreme Gradient Boosting (XGBoost) algorithm C decision tree and random forest classifier, GradientBoosting algorithm with decision tree classifier, the light gradient boosting (lightGBM) algorithm with decision tree classifier, the goss algorithm, and the cat boosting algorithm. In all eight models, environmental resistance distance was used as an explanatory variable, and the fixation index (FST) was used as a response variable. A Scikit-learn test train split function was used with a 0.3 test set split, and MinMaxScaler was used for data normalization. Four metrics, namely, Pearson’s correlation coefficient (r), R-squared (R2) value, root mean square error (RMSE), and mean absolute percentage error (MAPE), were used to evaluate and compare the performance of these models. Subsequently, a model with the best performance was selected for further analysis.
The best model was tuned by GridSearchCV in Scikit-learn. Specifically, all 28 environmental variables were used to predict the STR-based resistance surface by the fitted model. Resistance distance was then calculated using the STR-based resistance surface by the least cost path (LCP) method. A new model was tuned again using the new LCP datasets. We also use the permutation importance to visualize our machine learning model. Compared to other feature importance ranking methods, permutation importance reconstructs the relationship between the target and the feature through multiple permutation calculations to explore the model’s dependence on the feature. Subsequently, the predicted resistance surface was transformed into a connectivity surface by taking the inverse of each pixel value.
Effect of landscape pattern on genetic diversity
Considering the small number of datasets of 20 sample sites, we performed Pearson’s correlation analysis in the R package “Hmisc” (Harrell and Dupont, 2006) to evaluate the relationship between the S. empoasca population’s genetic diversity and landscape features around sampled tea plantations. Three parameters, allele richness (AR), expected heterozygosity (He), and observed heterozygosity (Ho), were selected to test the relative relationship with landscape metrics by calculating the relative coefficient and p-value in R.
Results
Population’s genetic diversity and differentiation
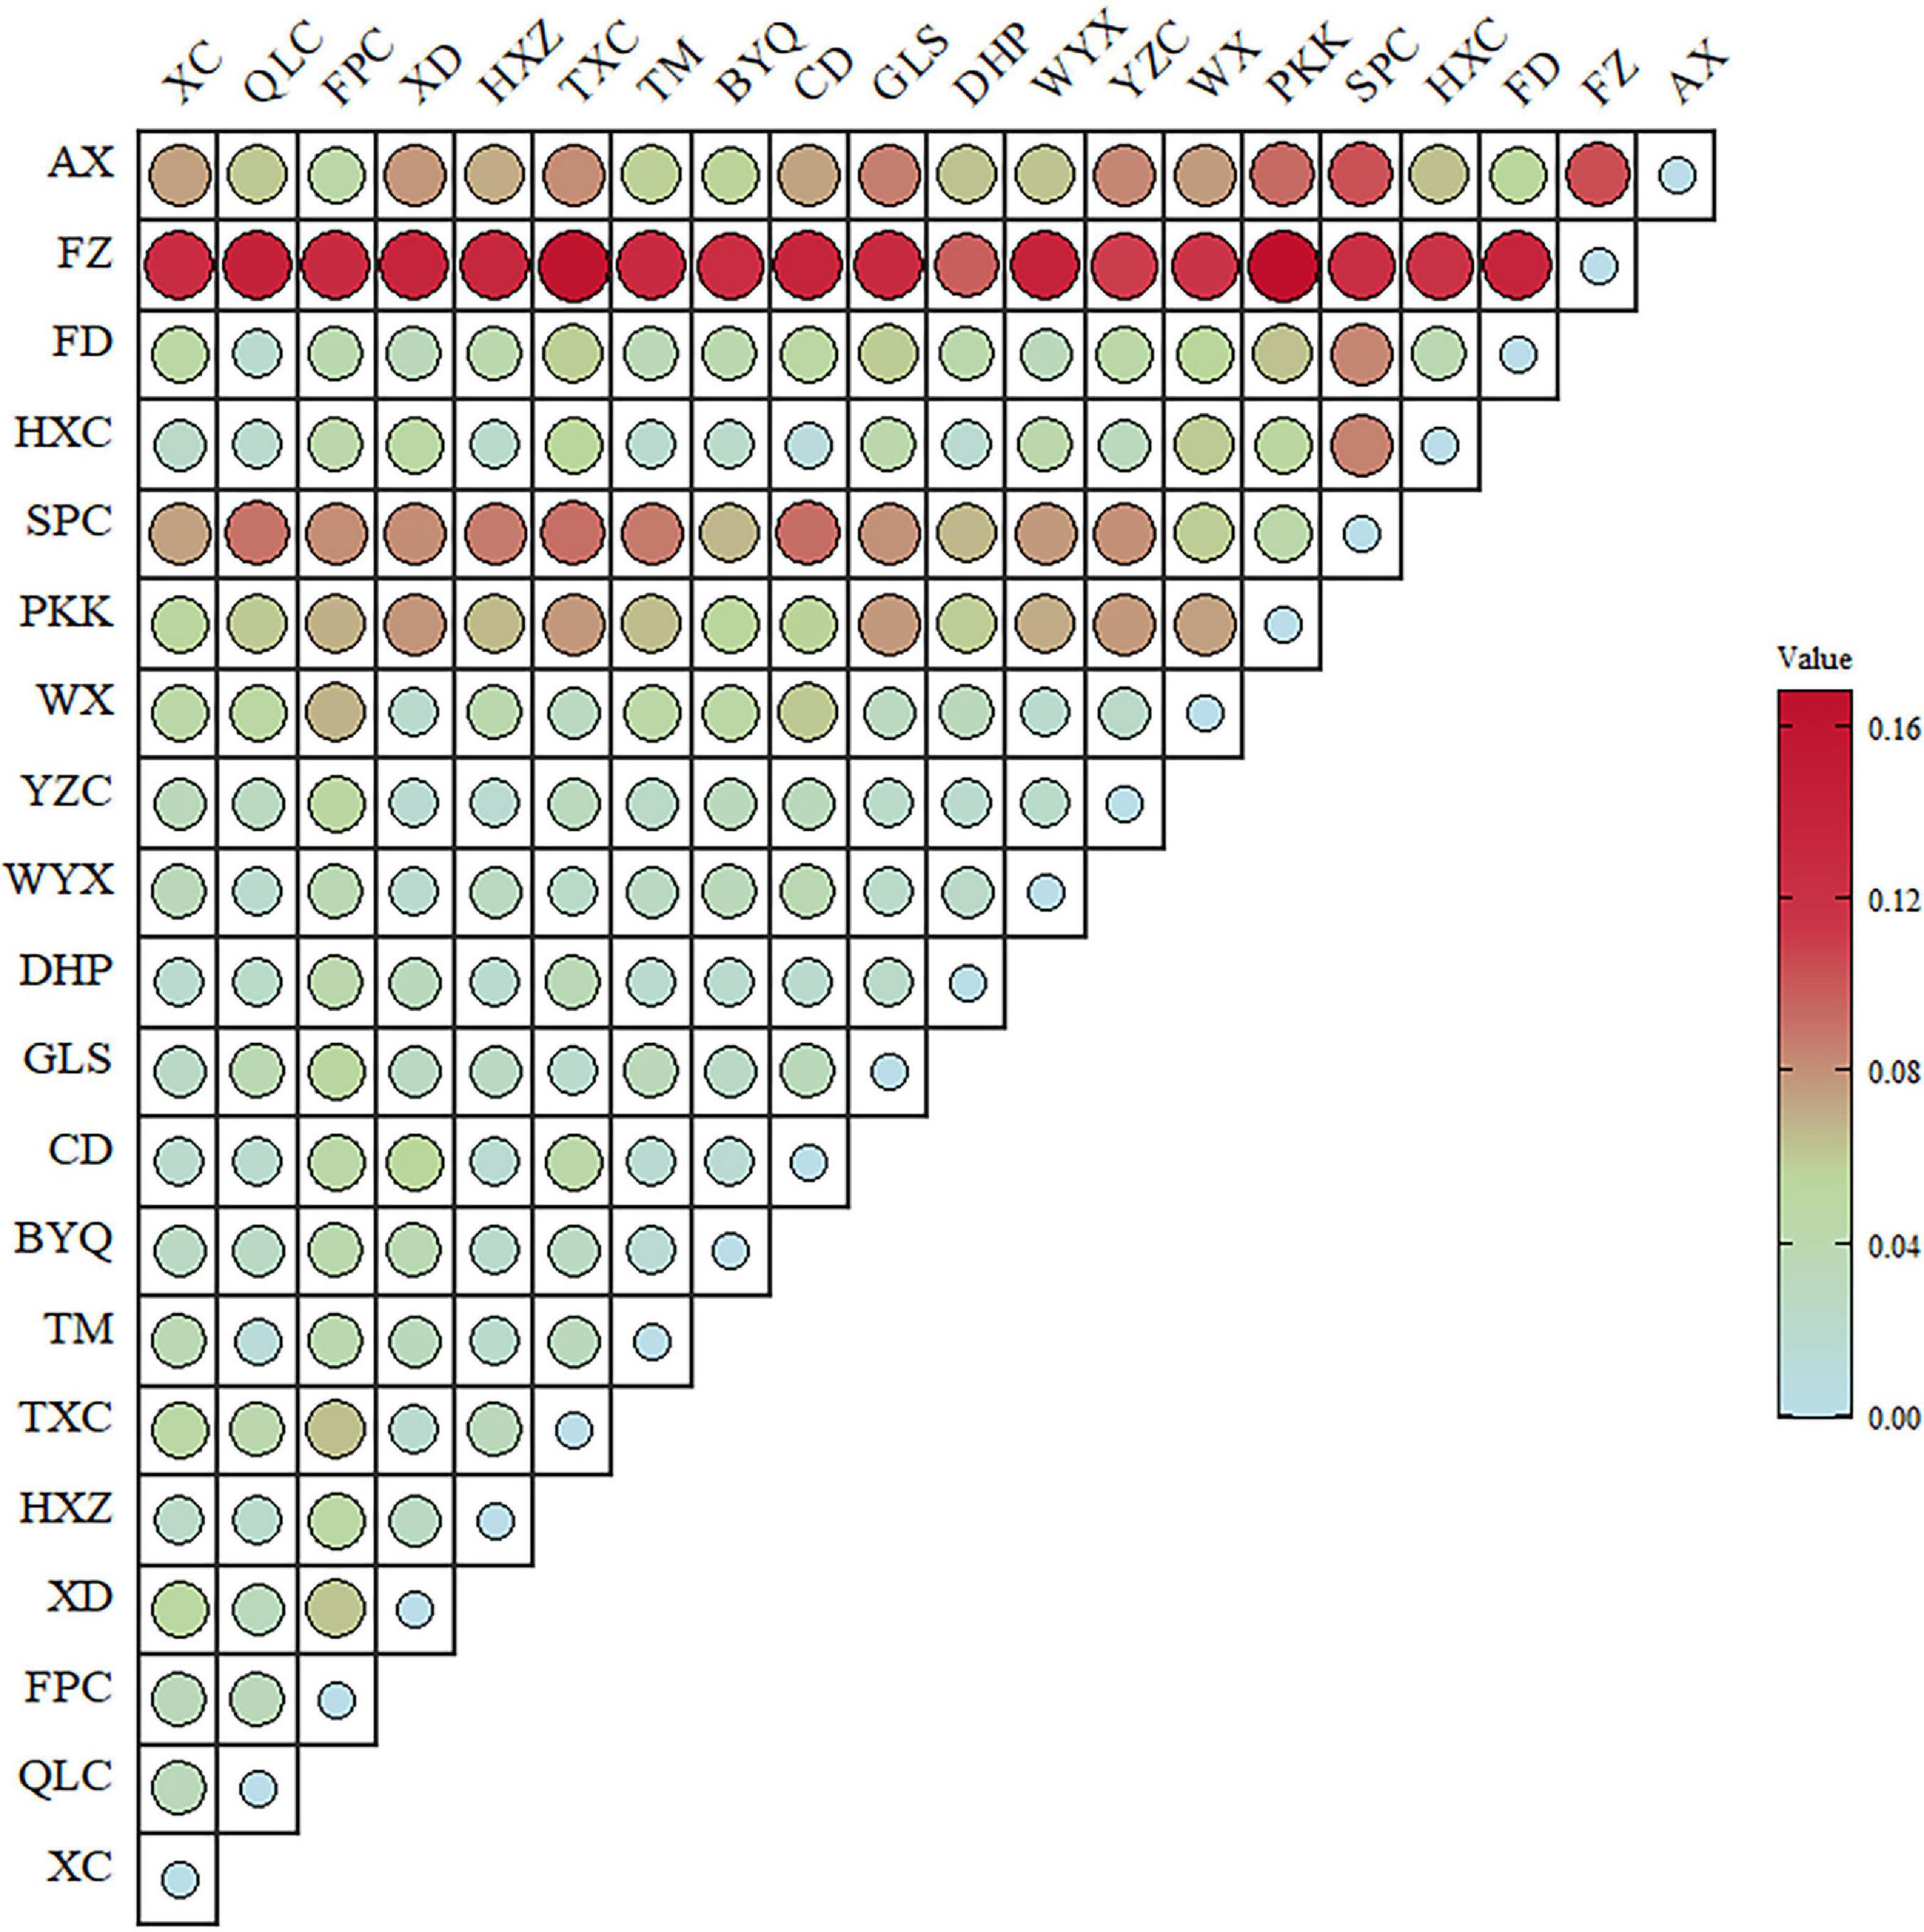
The estimates of genetic diversity determined by analyzing the ten microsatellites in 506 individuals are shown in Table 1. All genetic diversity indices showed extremely strong and narrow ranges of changes (AR: 2.45–3.02; Ho: 0.4–0.51; and He: 0.41–0.51). Except for Xingcun (XC), Fengpo (FPC), Chengdun (CD), Dahongpao (DHP), Yangzhuang (YZC), Hongxing (HXC), Fuding (FD), and Anxi (AX) populations, the inbreeding coefficients (Fis) were more than zero for all populations. The p-value of Fisher’s exact test showed deviation from Hardy–Weinberg equilibrium (HWE) in Shangpu (SPC) and FD populations. Higher genetic differentiation (FST > 0.07) was found in Pikengkou (PKK), SPC, Fuzhou (FZ), and AX populations (Figure 1) than in other pair populations (FST < 0.04).
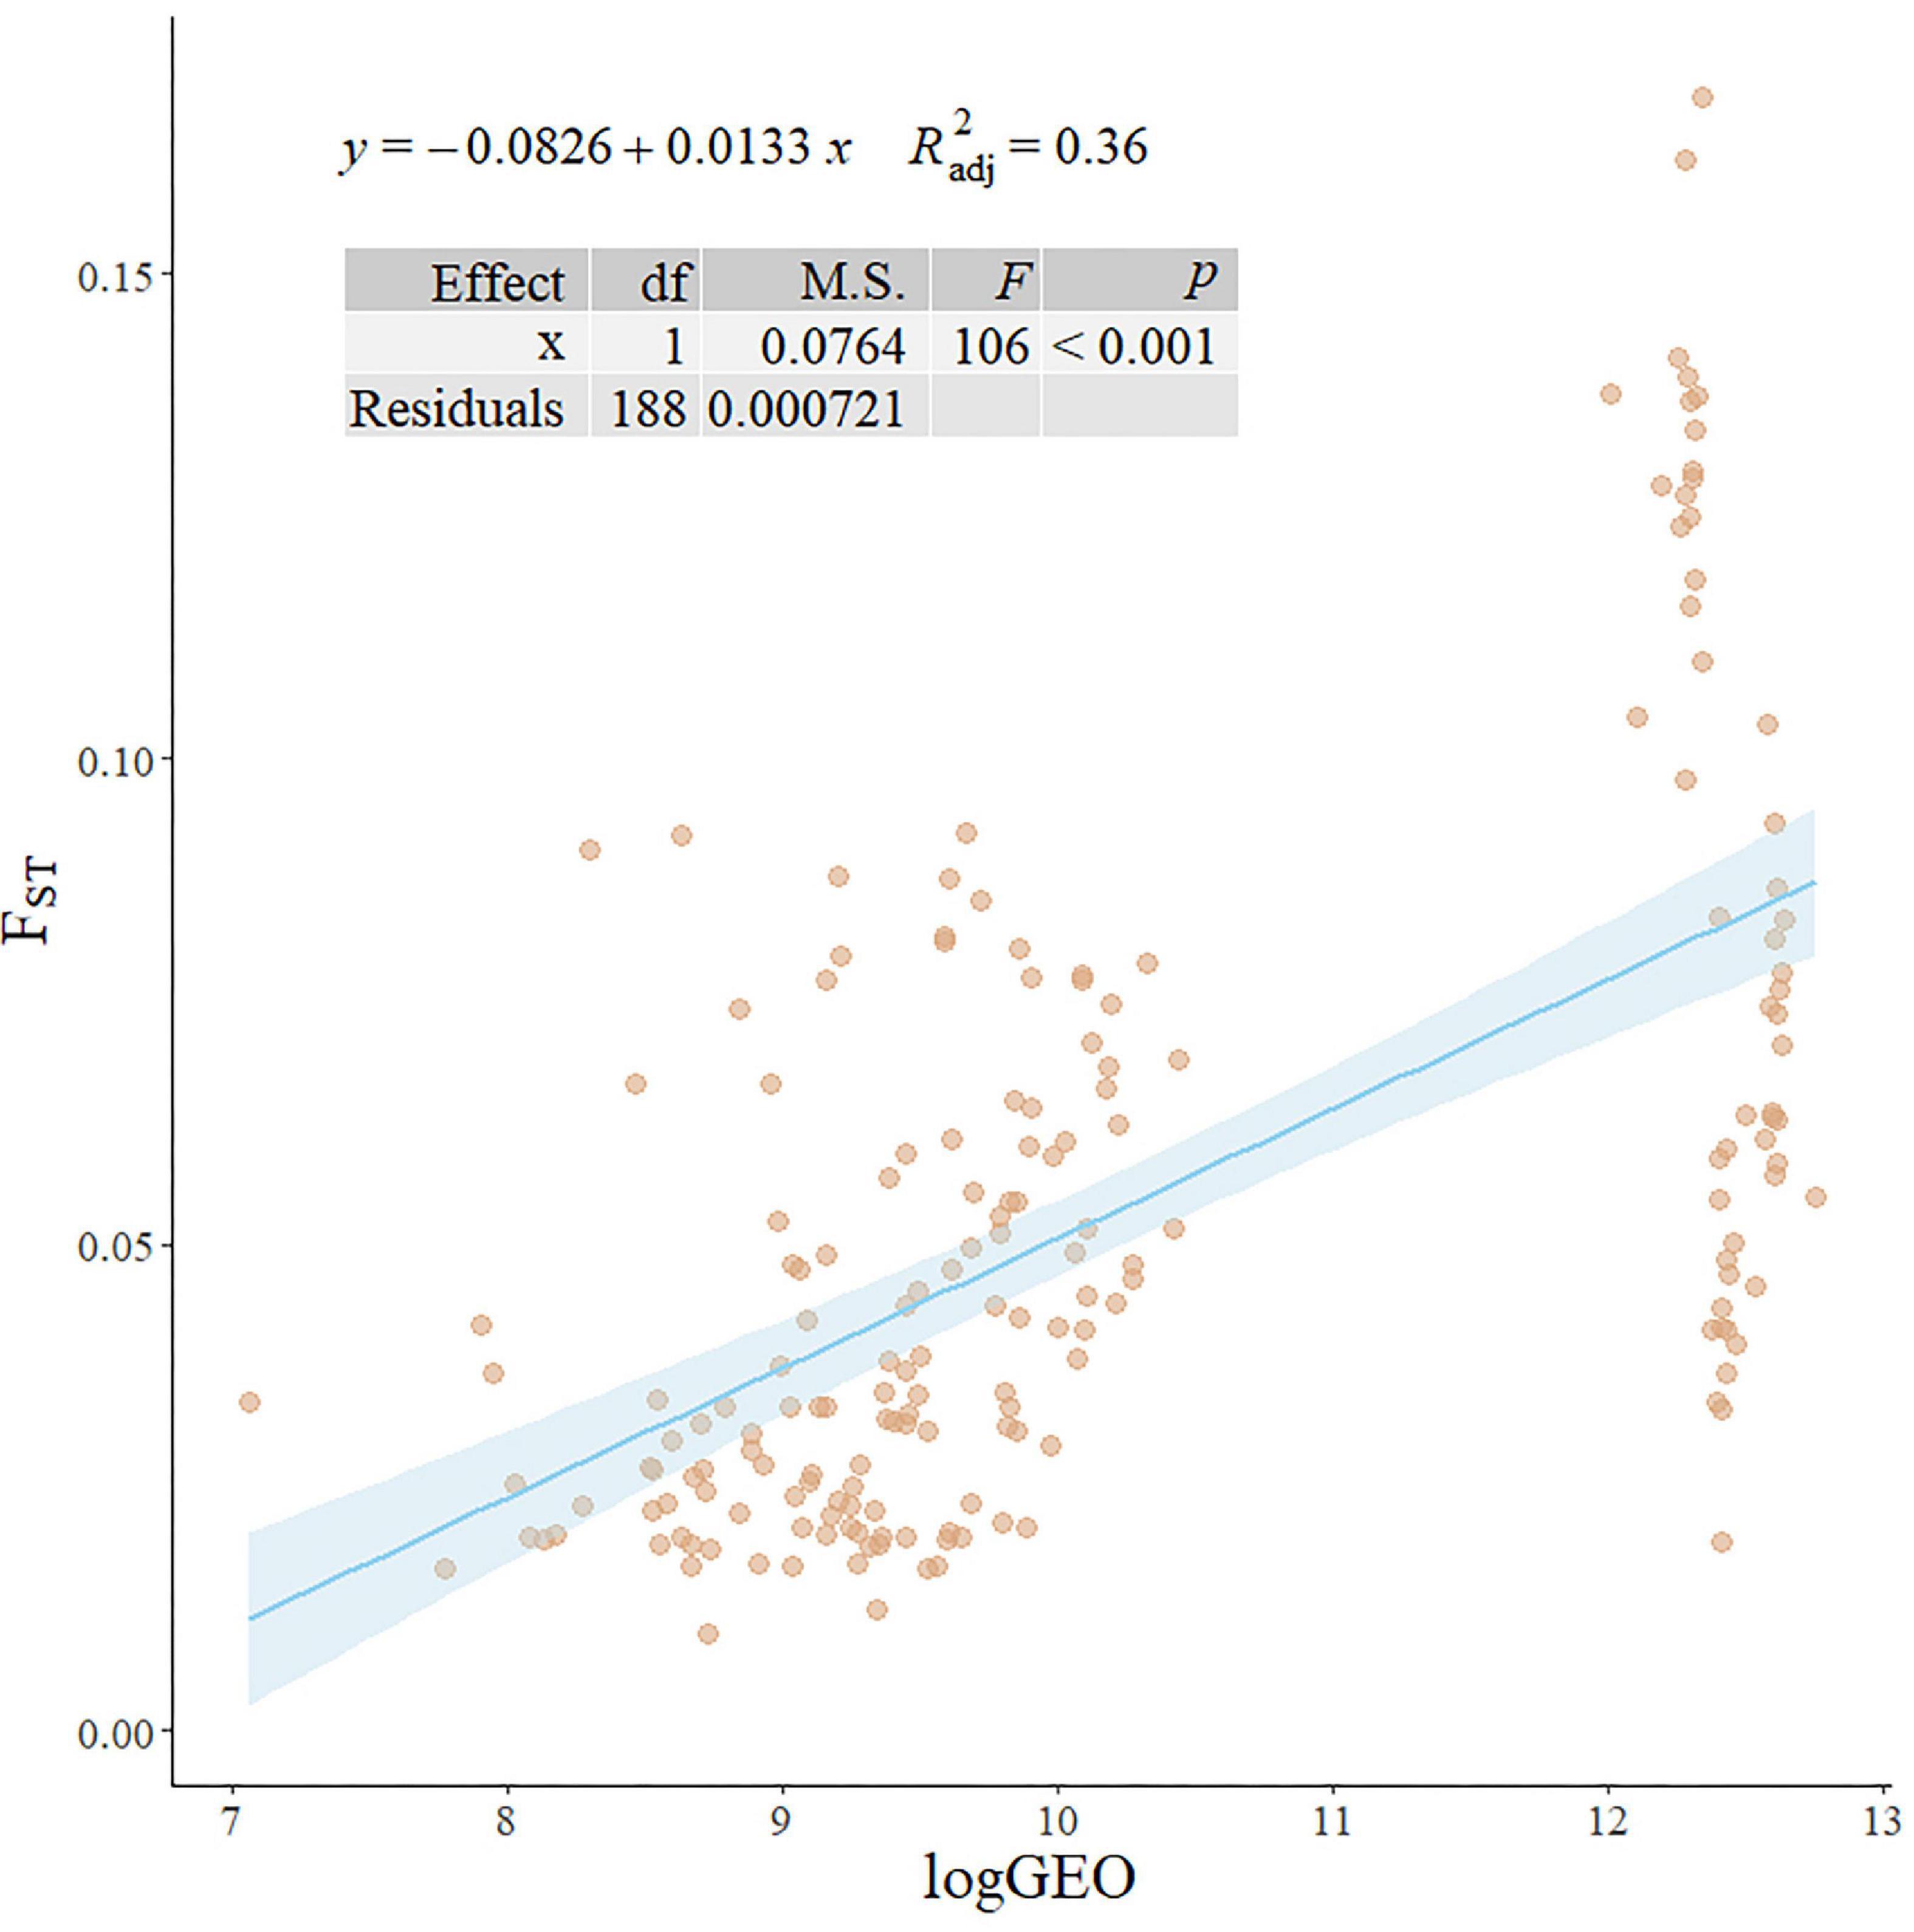
The DAPC cluster results showed that the best cluster number of all 506 individuals was three (Figures 2A,B), with no clear boundary identified between clusters. When the cluster number was five and seven, all clusters are closed to each other (Figures 2C,D). However, when the cluster number was greater than seven, one cluster was distinctly differentiated (Figures 2E,F). Both the linear regression model (y = −0.0826 + 0.0133x; R 2 = 0.36; p < 0.001; Figure 3) and Pearson’s correlation analysis (r = 0.60; p < 2.2e–16) showed a significantly positive relationship between log-transformed geographic distance and FST.
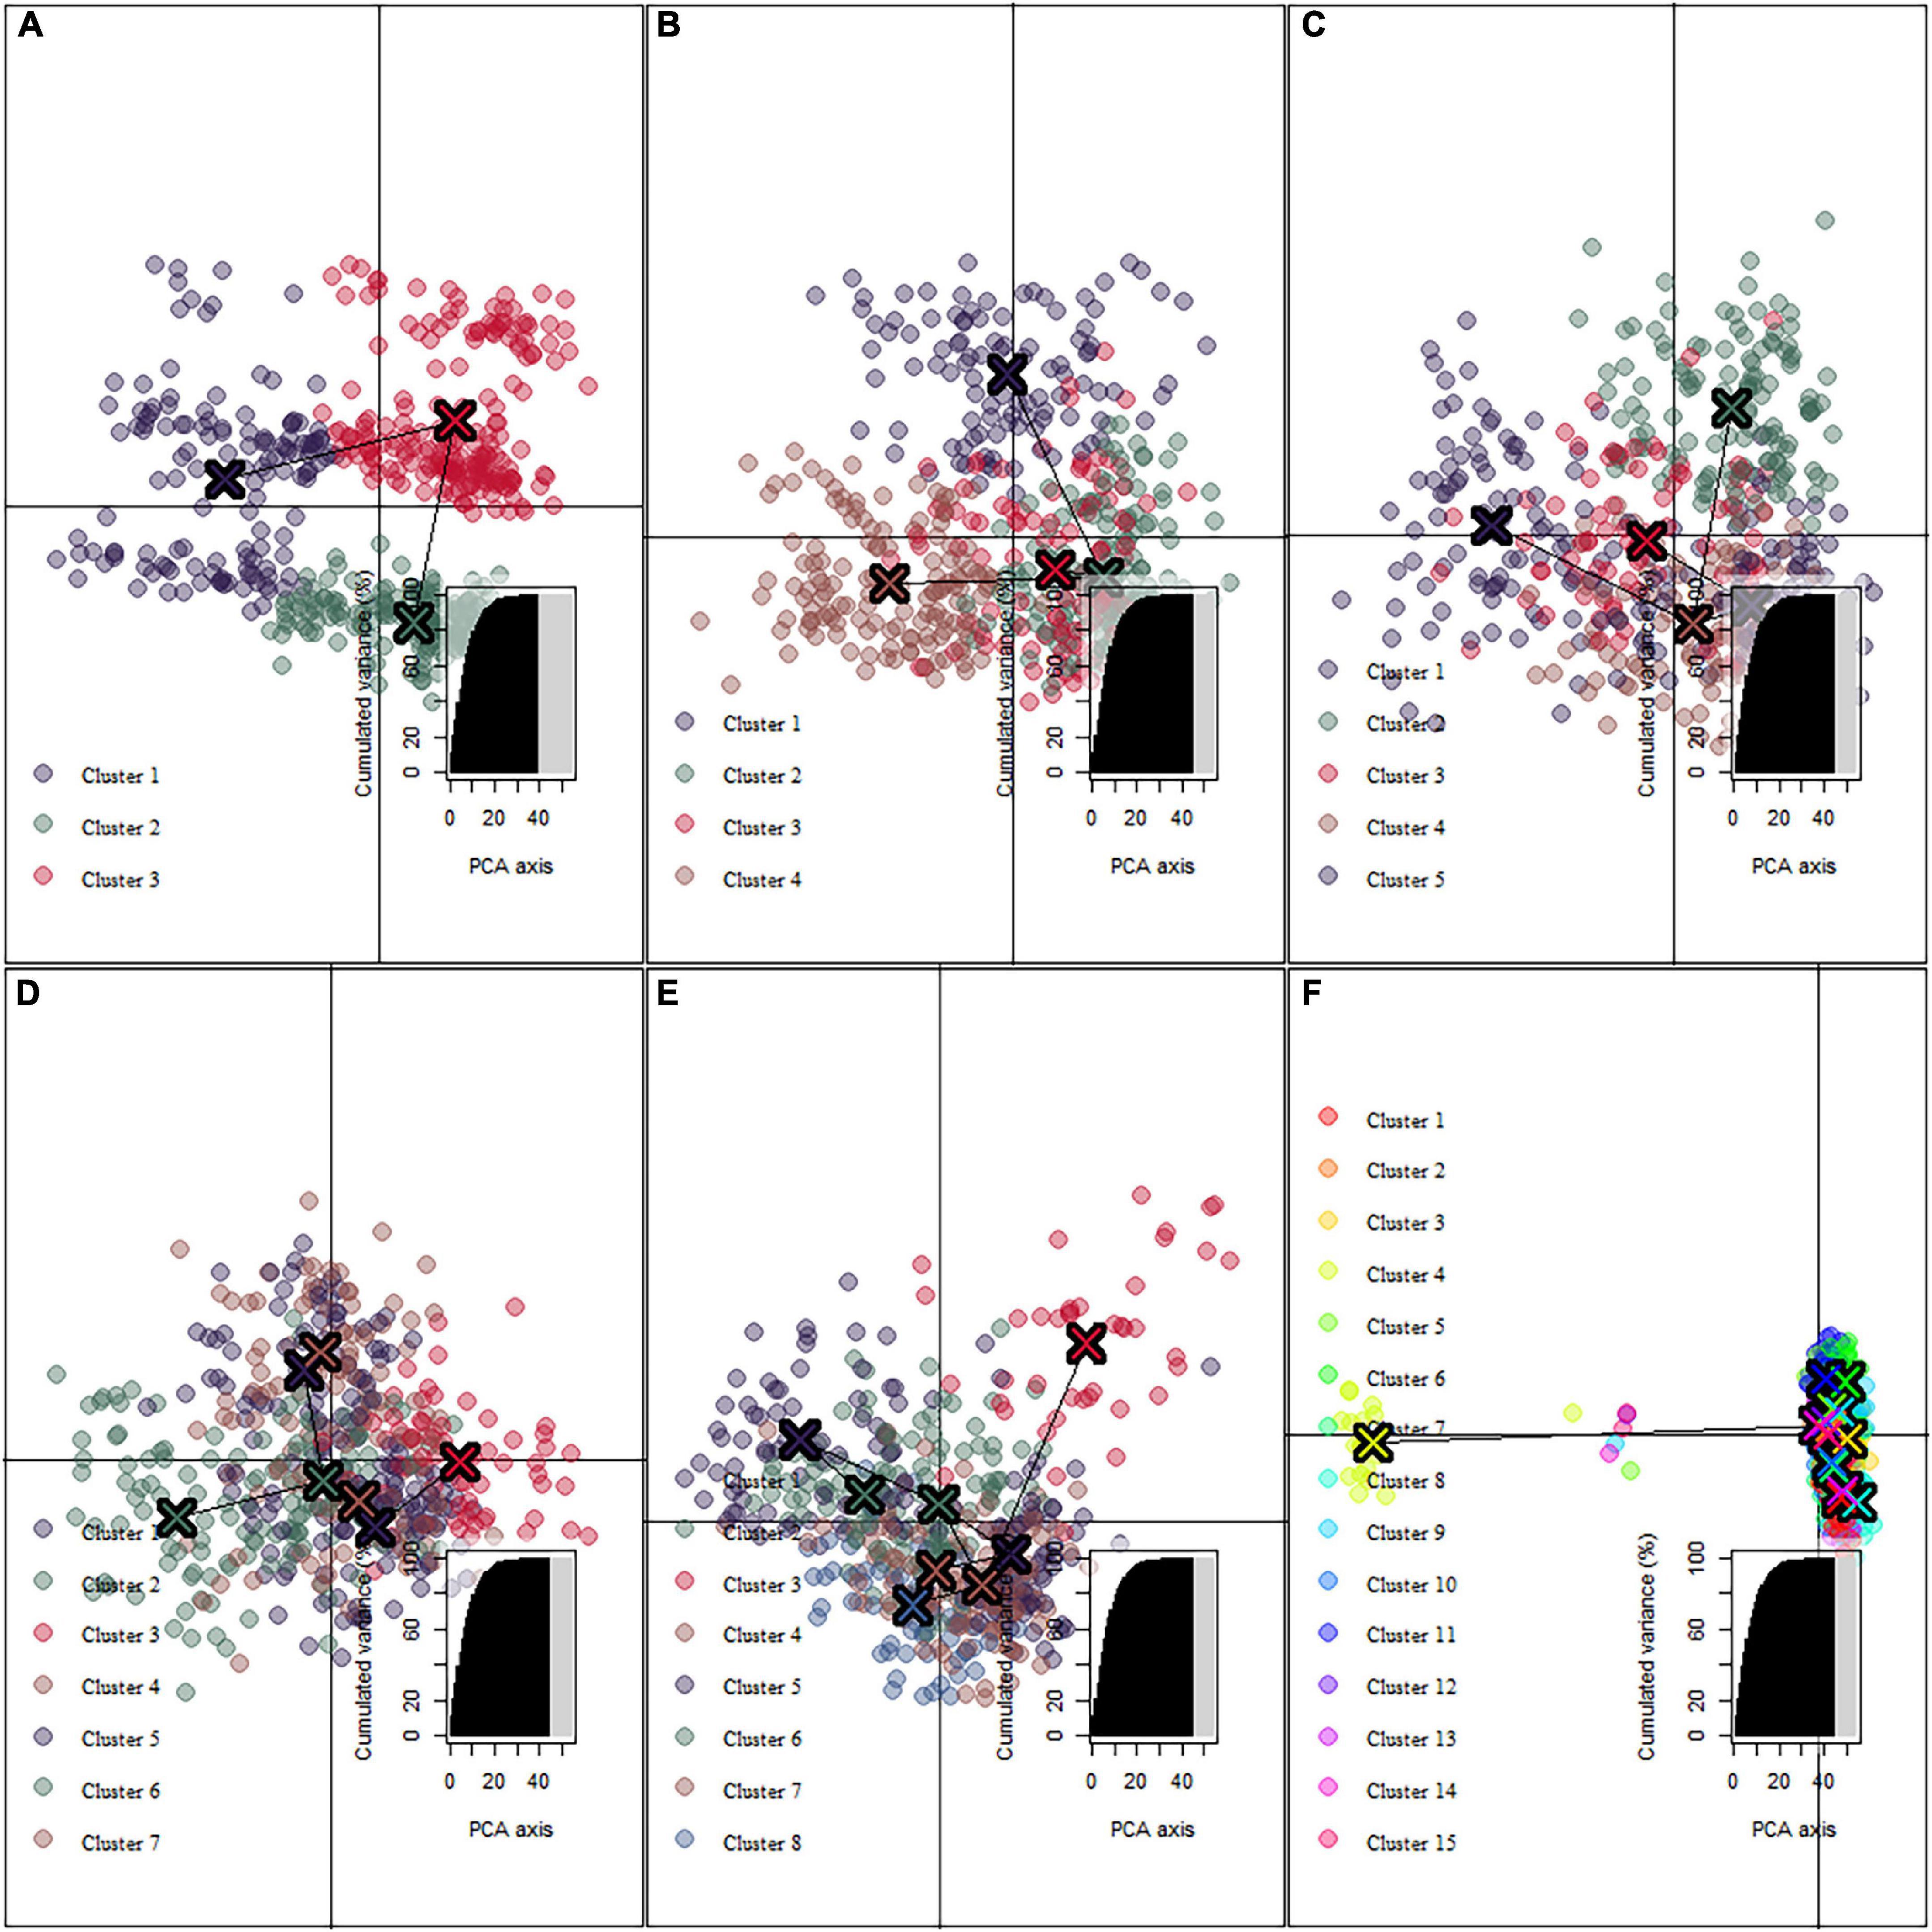
Figure 2. Estimated population genetic cluster of S. empoasca populations. (A–F) DAPC cluster results at K = 3, 4, 5, 7, 8, and 15 separately.
Effect of environmental factors and landscape features on genetic variation
The model comparison results showed that the eXtreme gradient boosting algorithm with a random forest regression model (XGBoost-RFR) performed better than the other seven boosting algorithms (Figure 4), with the highest R2 and r-value and the lowest RMSE value. The MAPE value of the XGBoost-RFR model is not the lowest. However, this model still has an overall advantage over others. The Adaboost algorithm with random forest regression model (Adaboost-RFR) showed similar evaluation metrics, including r, R2, and MSE, but showed a higher MAPE value compared with the XGBoost-RFR model (Figure 4). For both STR and LCP models, the XGBoost-RFR model performed slightly worse on the test set than on the train set (Table 2). The permutation importance results showed that in the STR-based model, the top four important factors were annual precipitation (bio_12), temperature seasonality (bio_4), precipitation of the driest quarter (bio_17), and precipitation of the driest month (bio_14), while other factors, such as cultivated and managed vegetation (class_7), evergreen/deciduous needleleaf trees (class_1), and min temperature of the coldest month (bio_6), explained only a small fraction of the prediction of genetic differentiation (Figure 5). In the LCP-based model, the top four important factors were bio_6, bio_12, class_1, and bio_18. Moreover, in the test set, there is a strong correlation between the predicted values produced by the XGBoost-RFR model with LCP distance and the true values, but poor predictive power was found for low values in the FST dataset (Figure 6). The predicted genetic connectivity (Figure 7) and the map of the top four important environmental factors (Figure 8) showed that less precipitation and higher minimum temperature could block the genetic connectivity of S. empoasca.
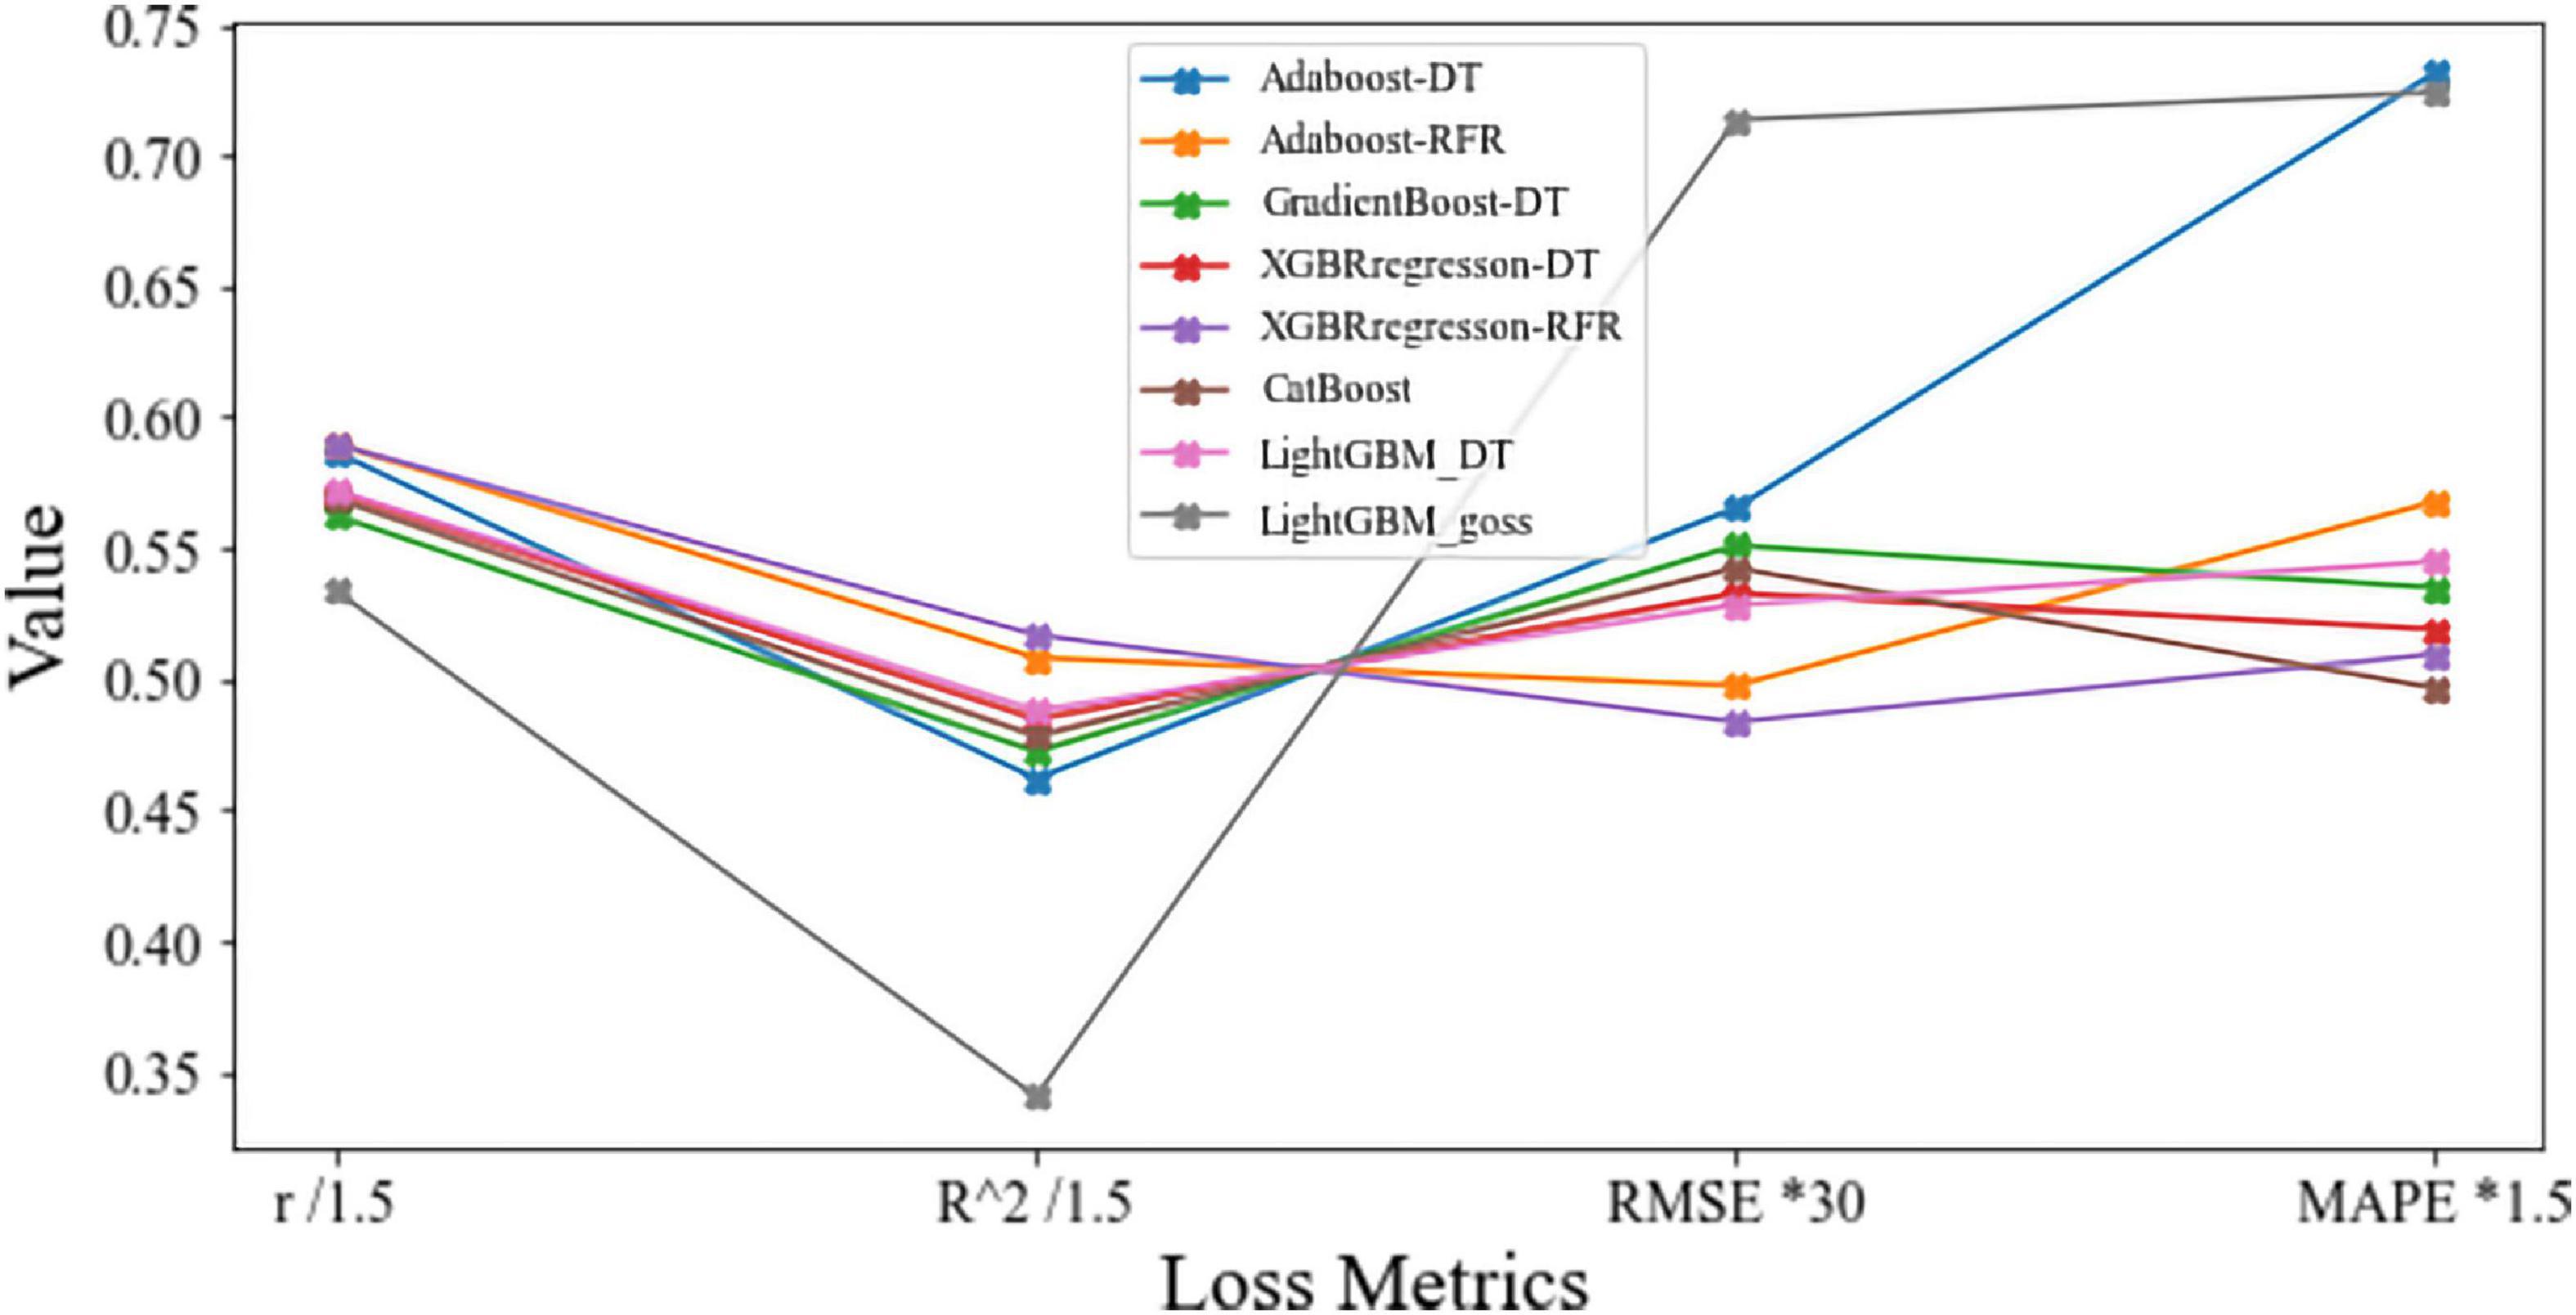
Figure 4. Model comparison of eight boosting algorithms with four loss metrics. “Adaboost-DT” and “Adaboost-RFR” are Adaboost algorithms with the decision tree and the random forest classifier. “XGBoost-DT” and “XGBoost-RFR” are XGBoost algorithms with the decision tree and the random forest classifier. “LightGBM-DT” and “LightGBM-goss” are light gradient boosting algorithms with the decision tree classifier and goss algorithm. “GBM” is the gradient boost algorithm with the decision tree.

Table 2. XGBoost-RFR model performance for train, test, and full sets using straight-line and least cost path methods.
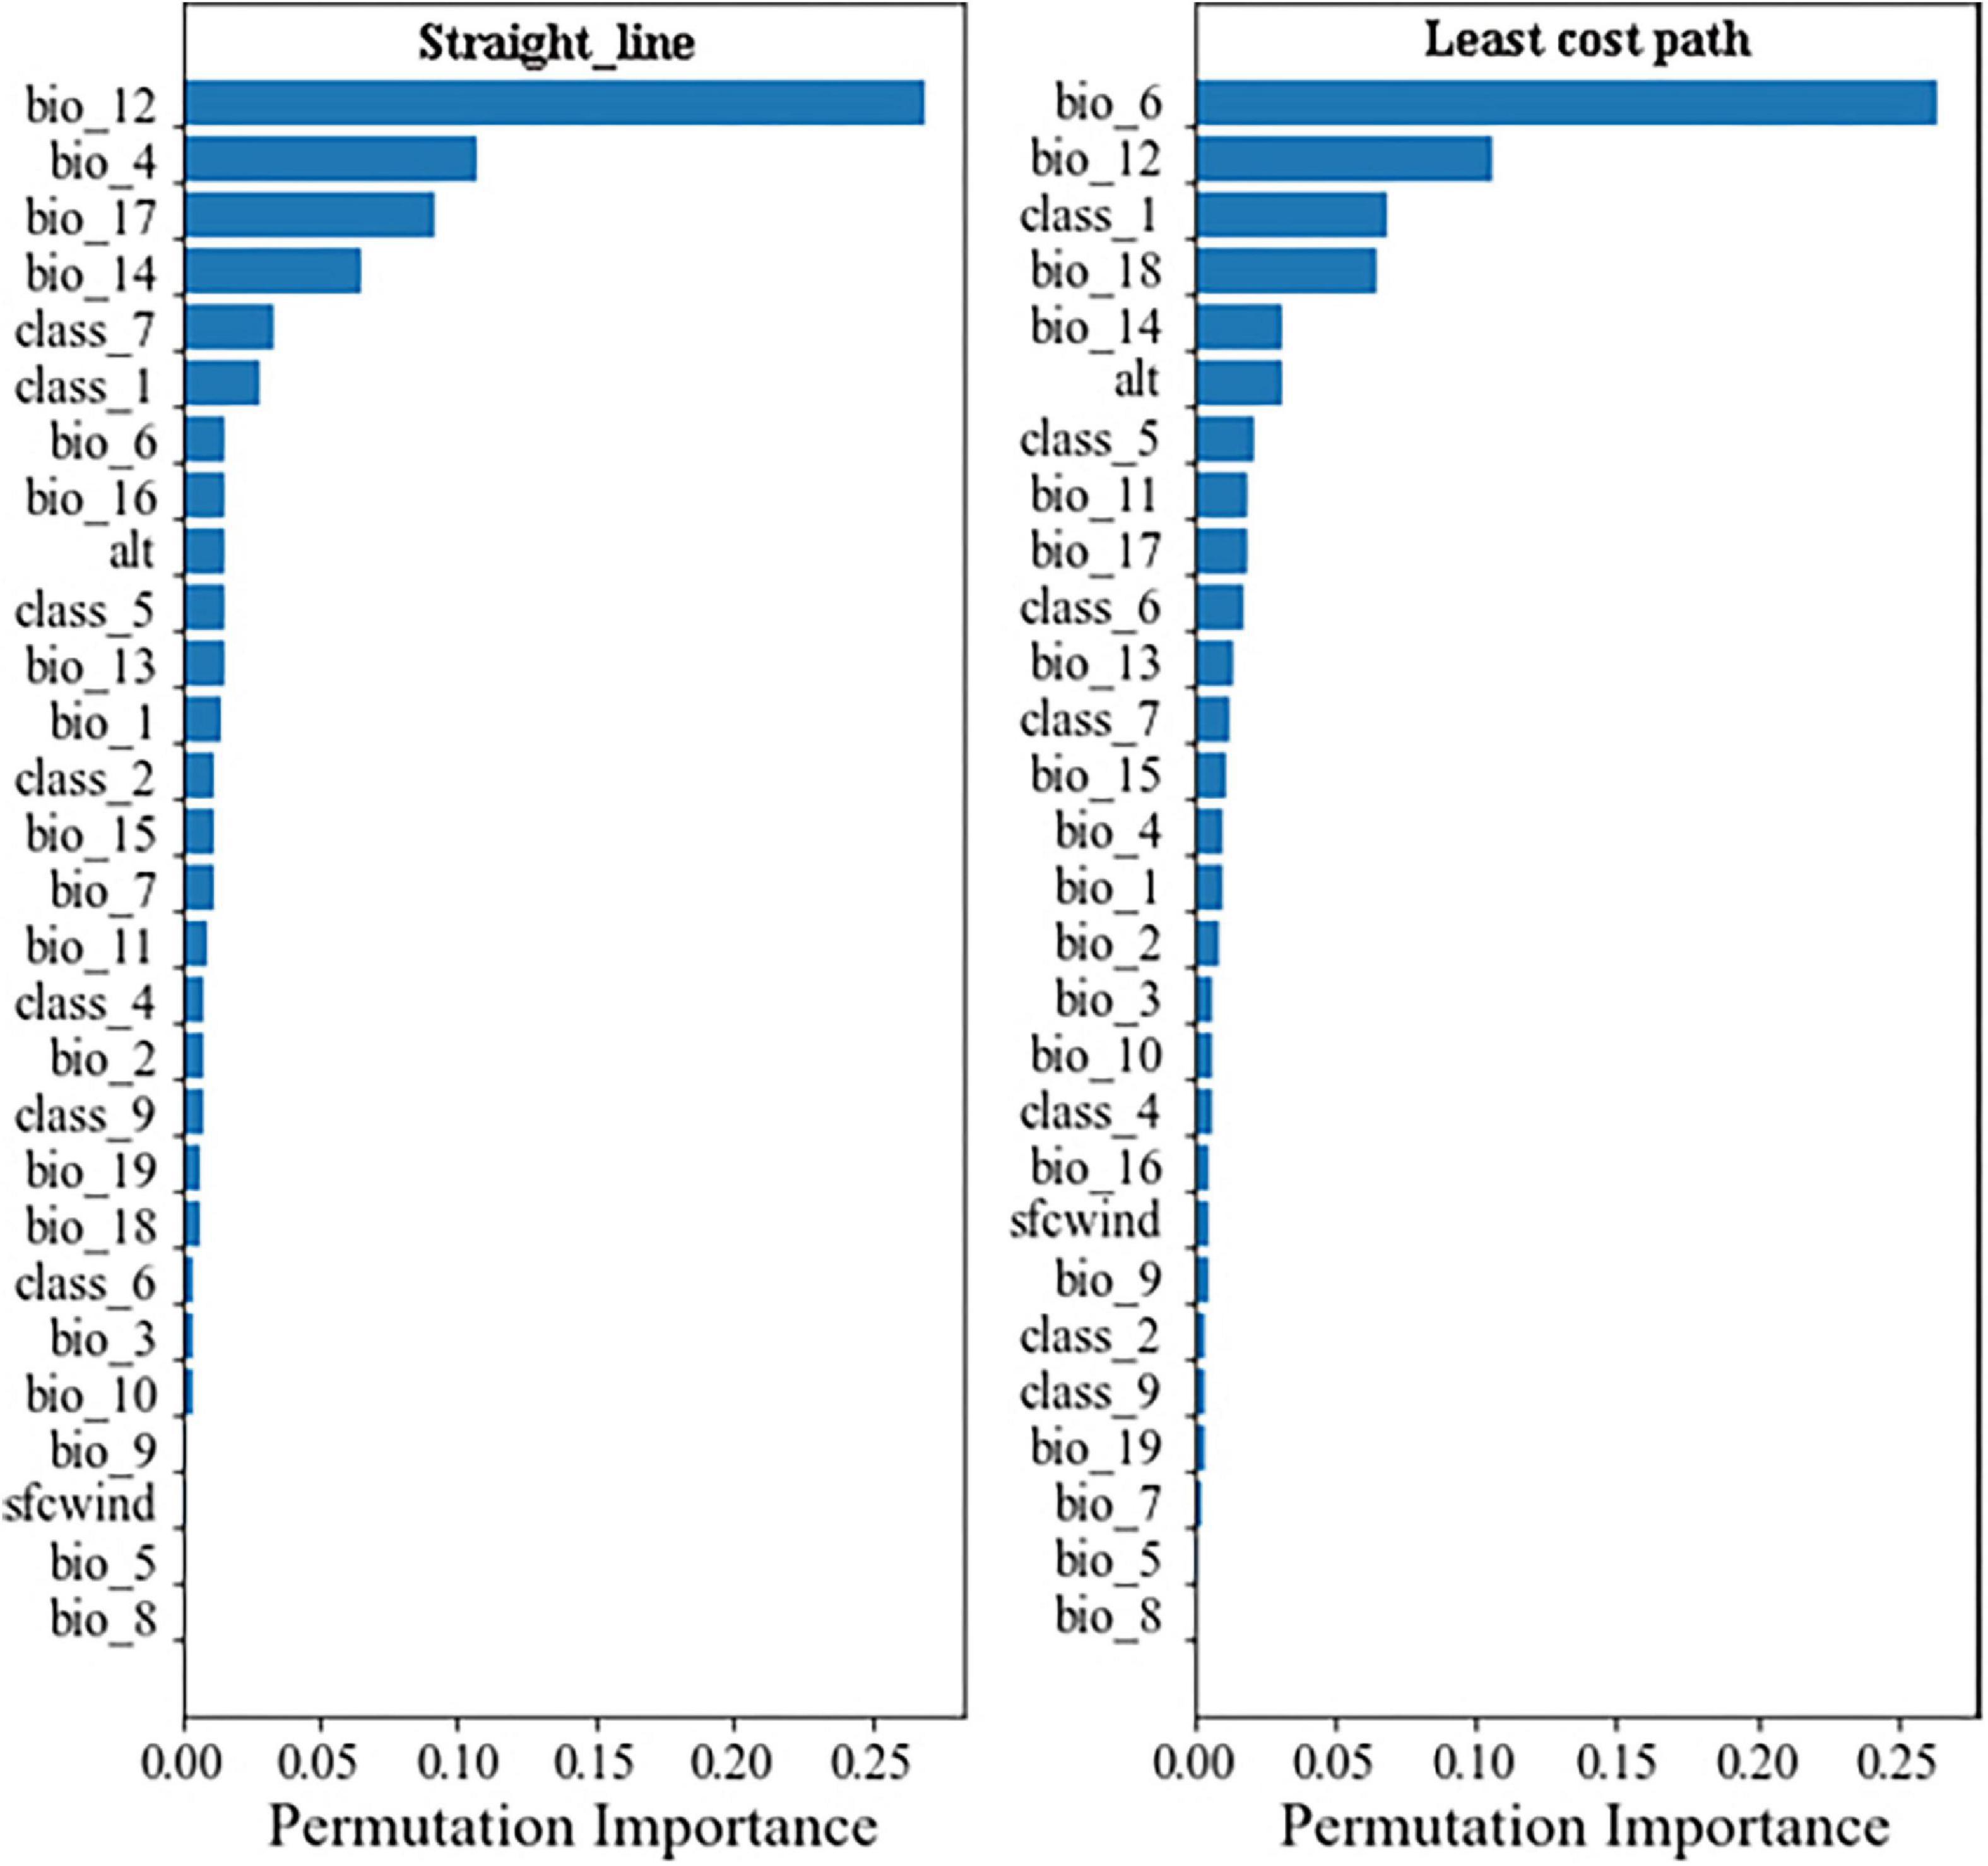
Figure 5. Permutation feature the importance of the straight-line-based and LCP-based XGBoost-RFR model. The X-axis represents the permutation importance score for each environmental factor.
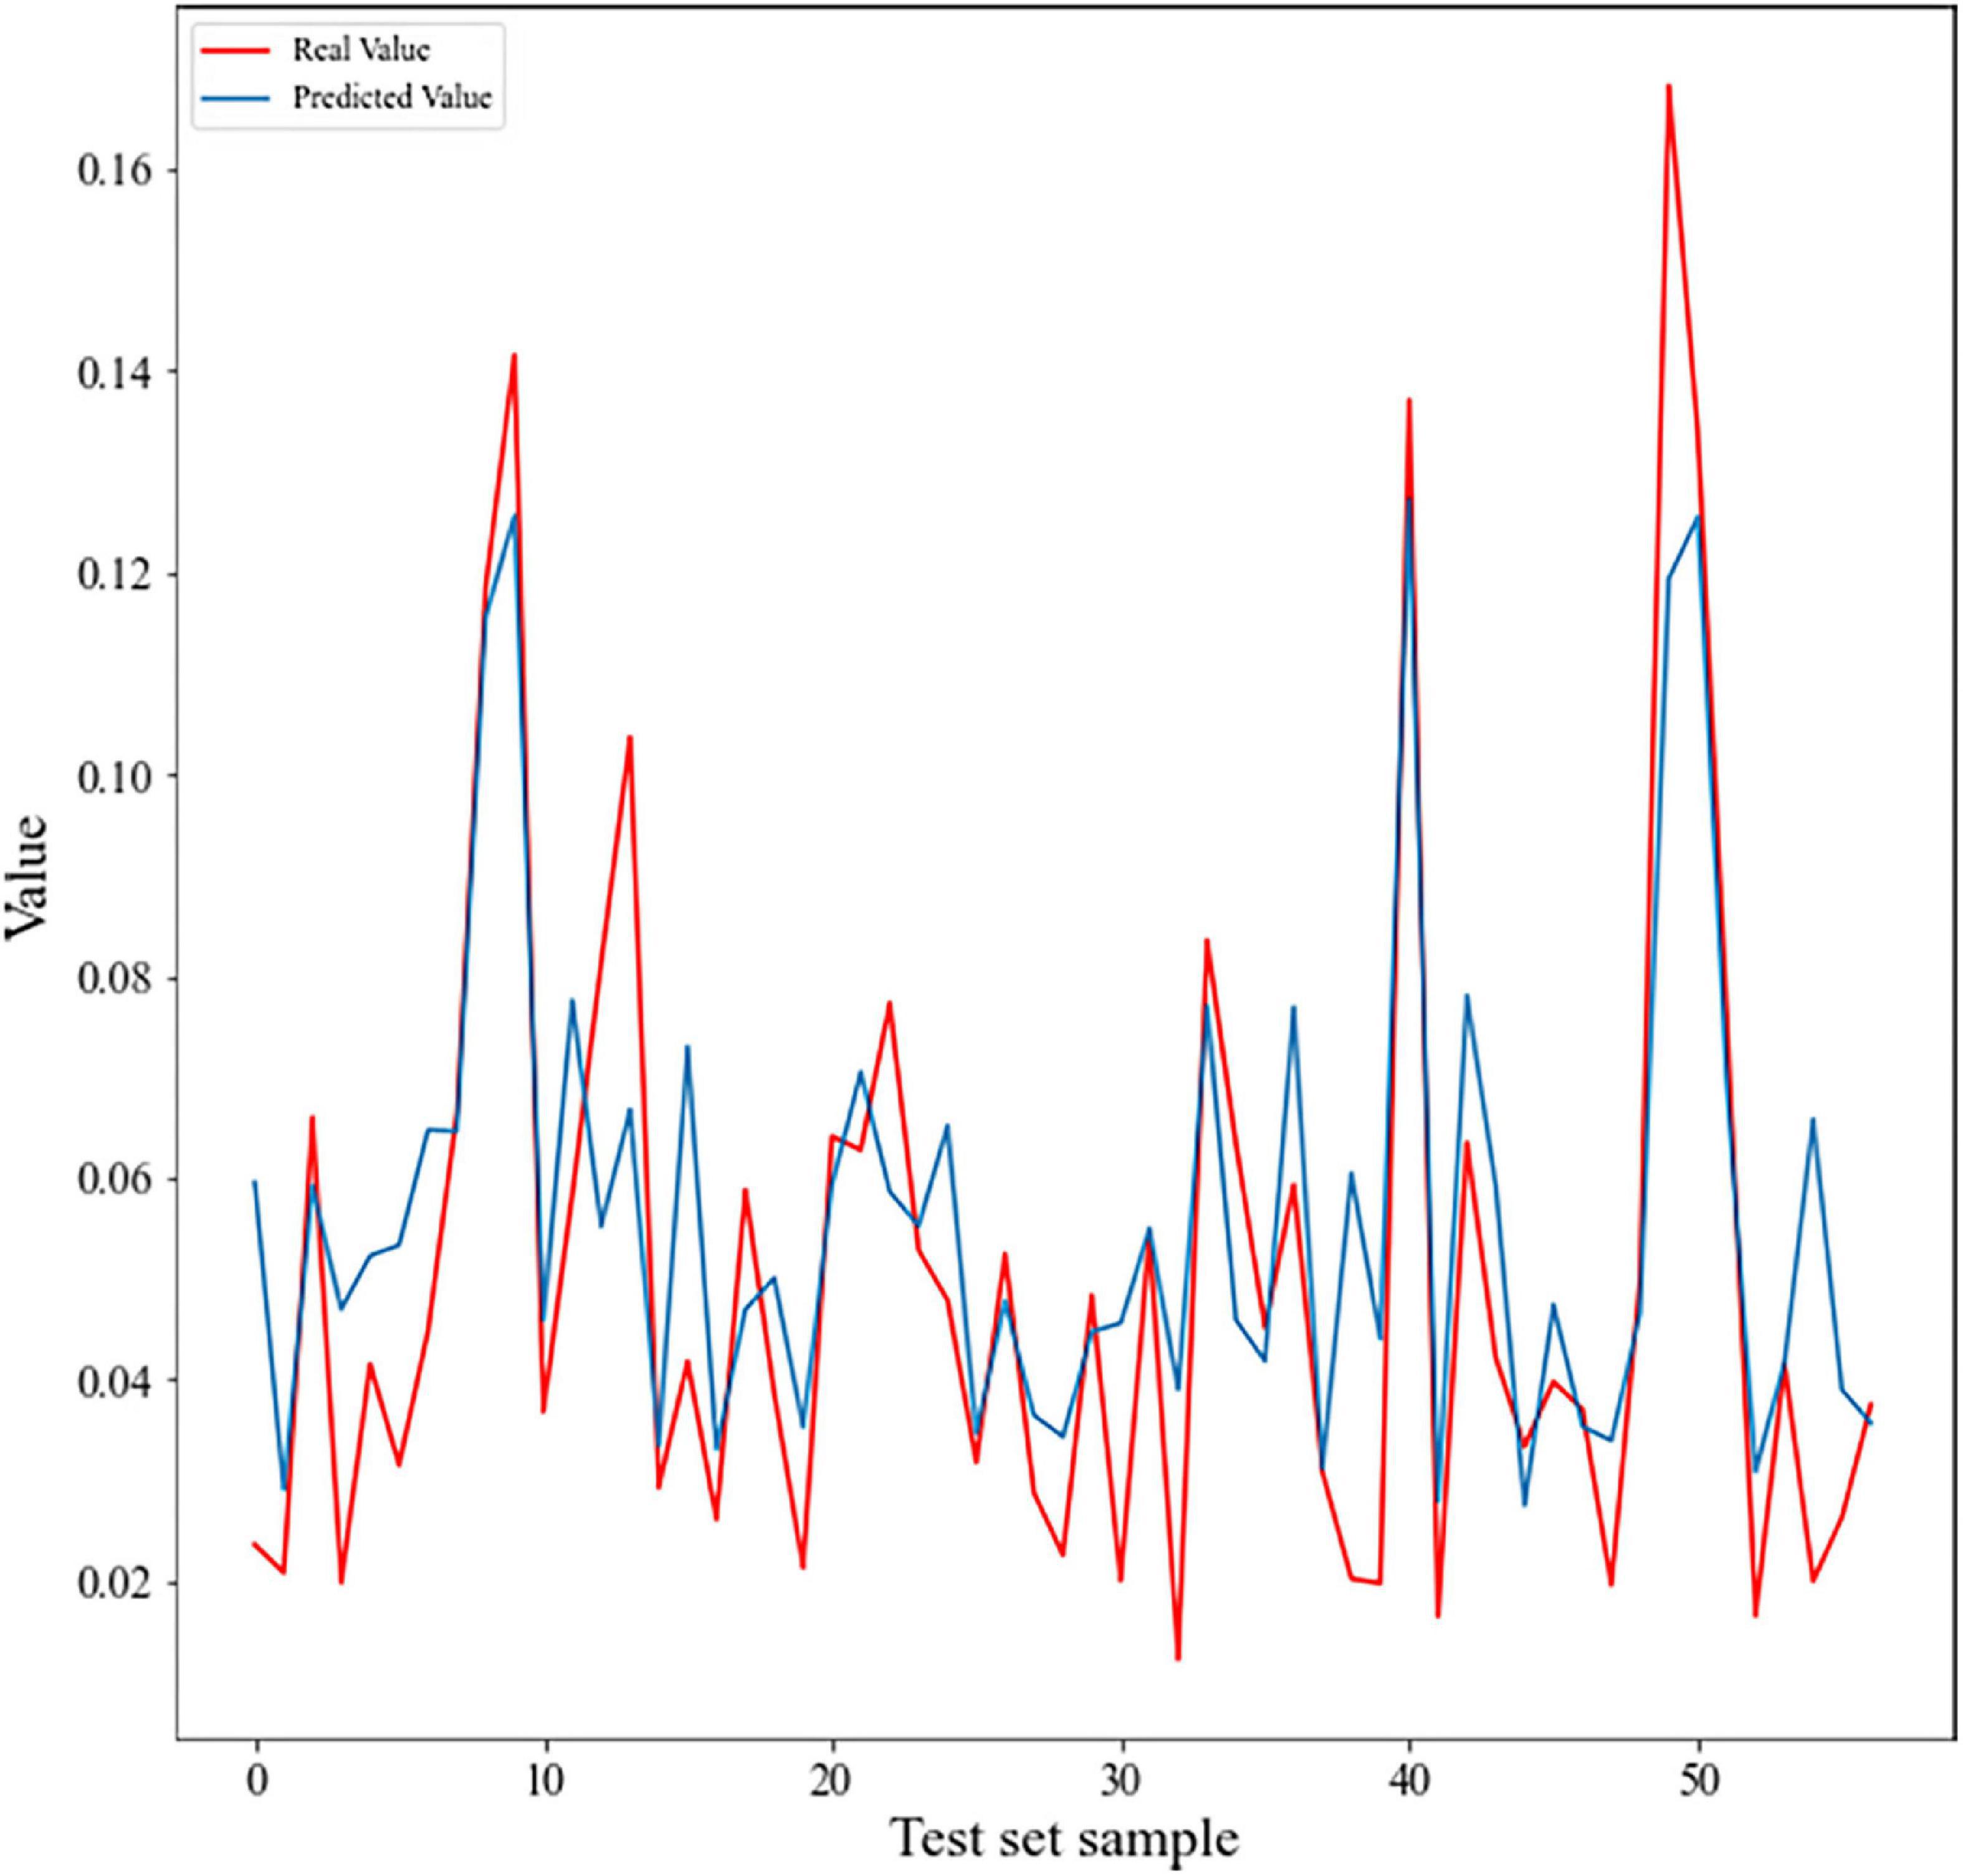
Figure 6. Line chart showing FST vs. predicted genetic differentiation value for the FST test set. Pearson’s correlation coefficient is 0.87 (p < 2.2e–16).
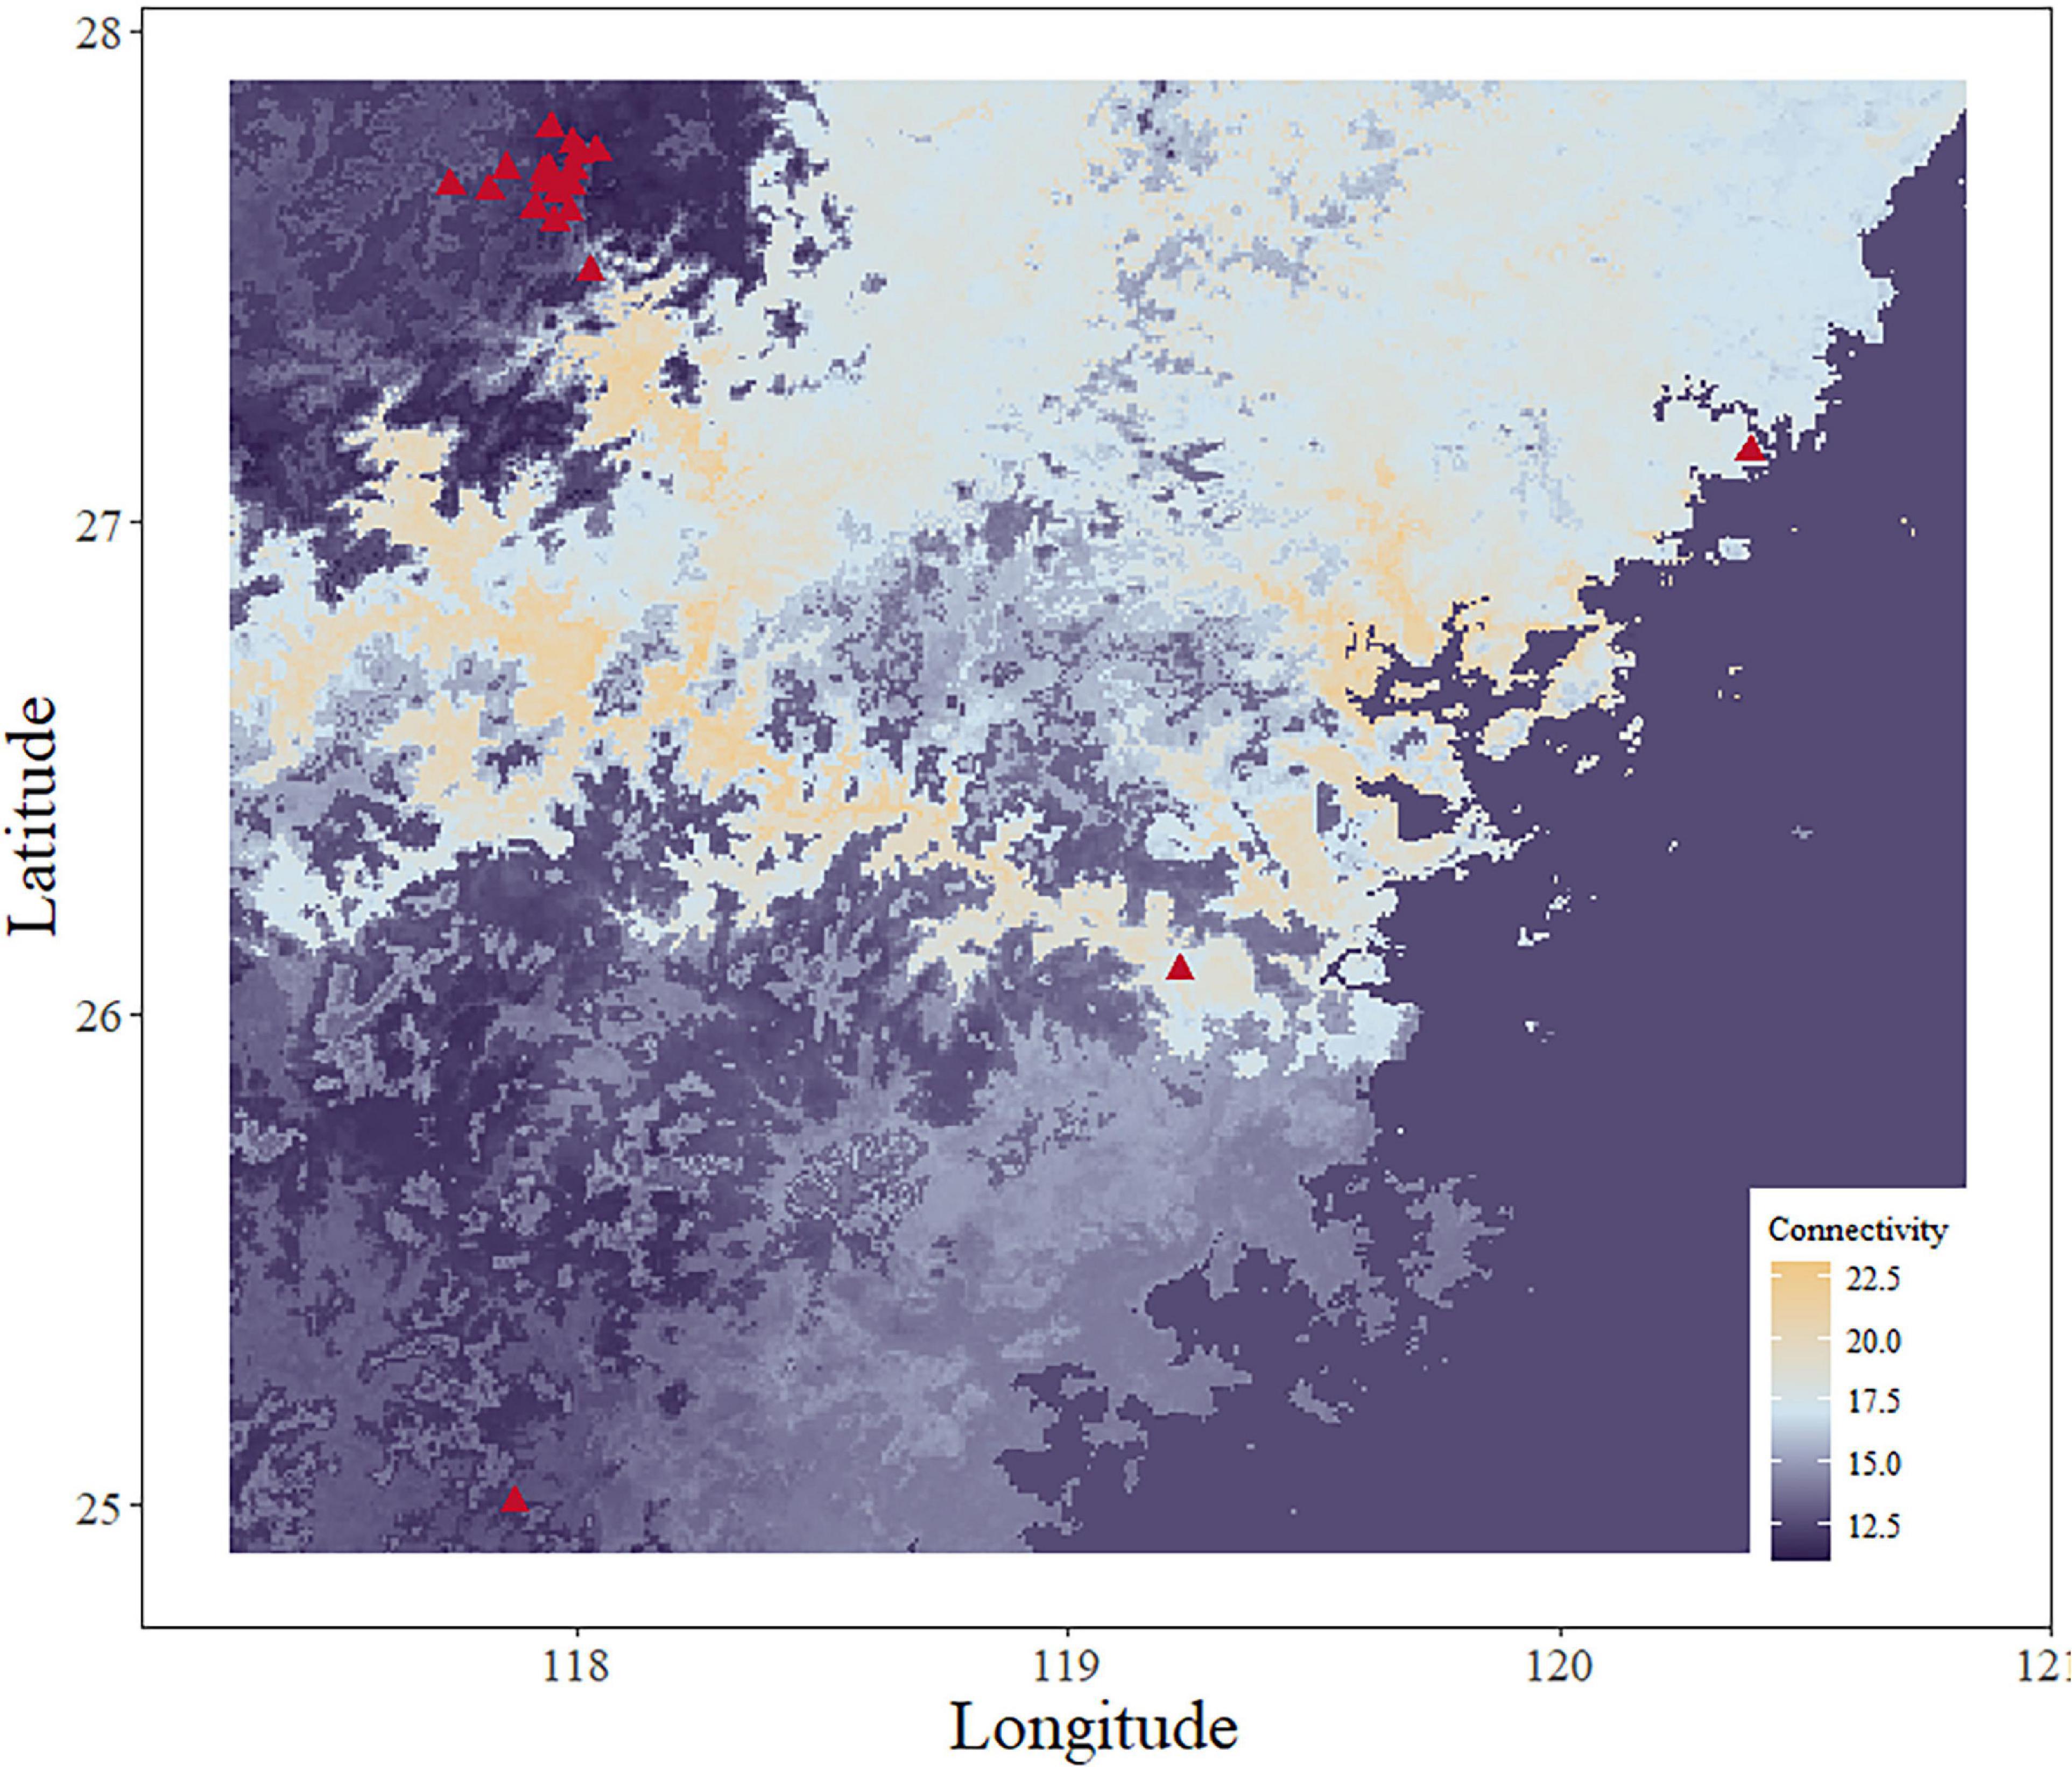
Figure 7. Genetic connectivity map using the FST full set. The red triangle shows the collection sites for S. empoasca (genetic data).
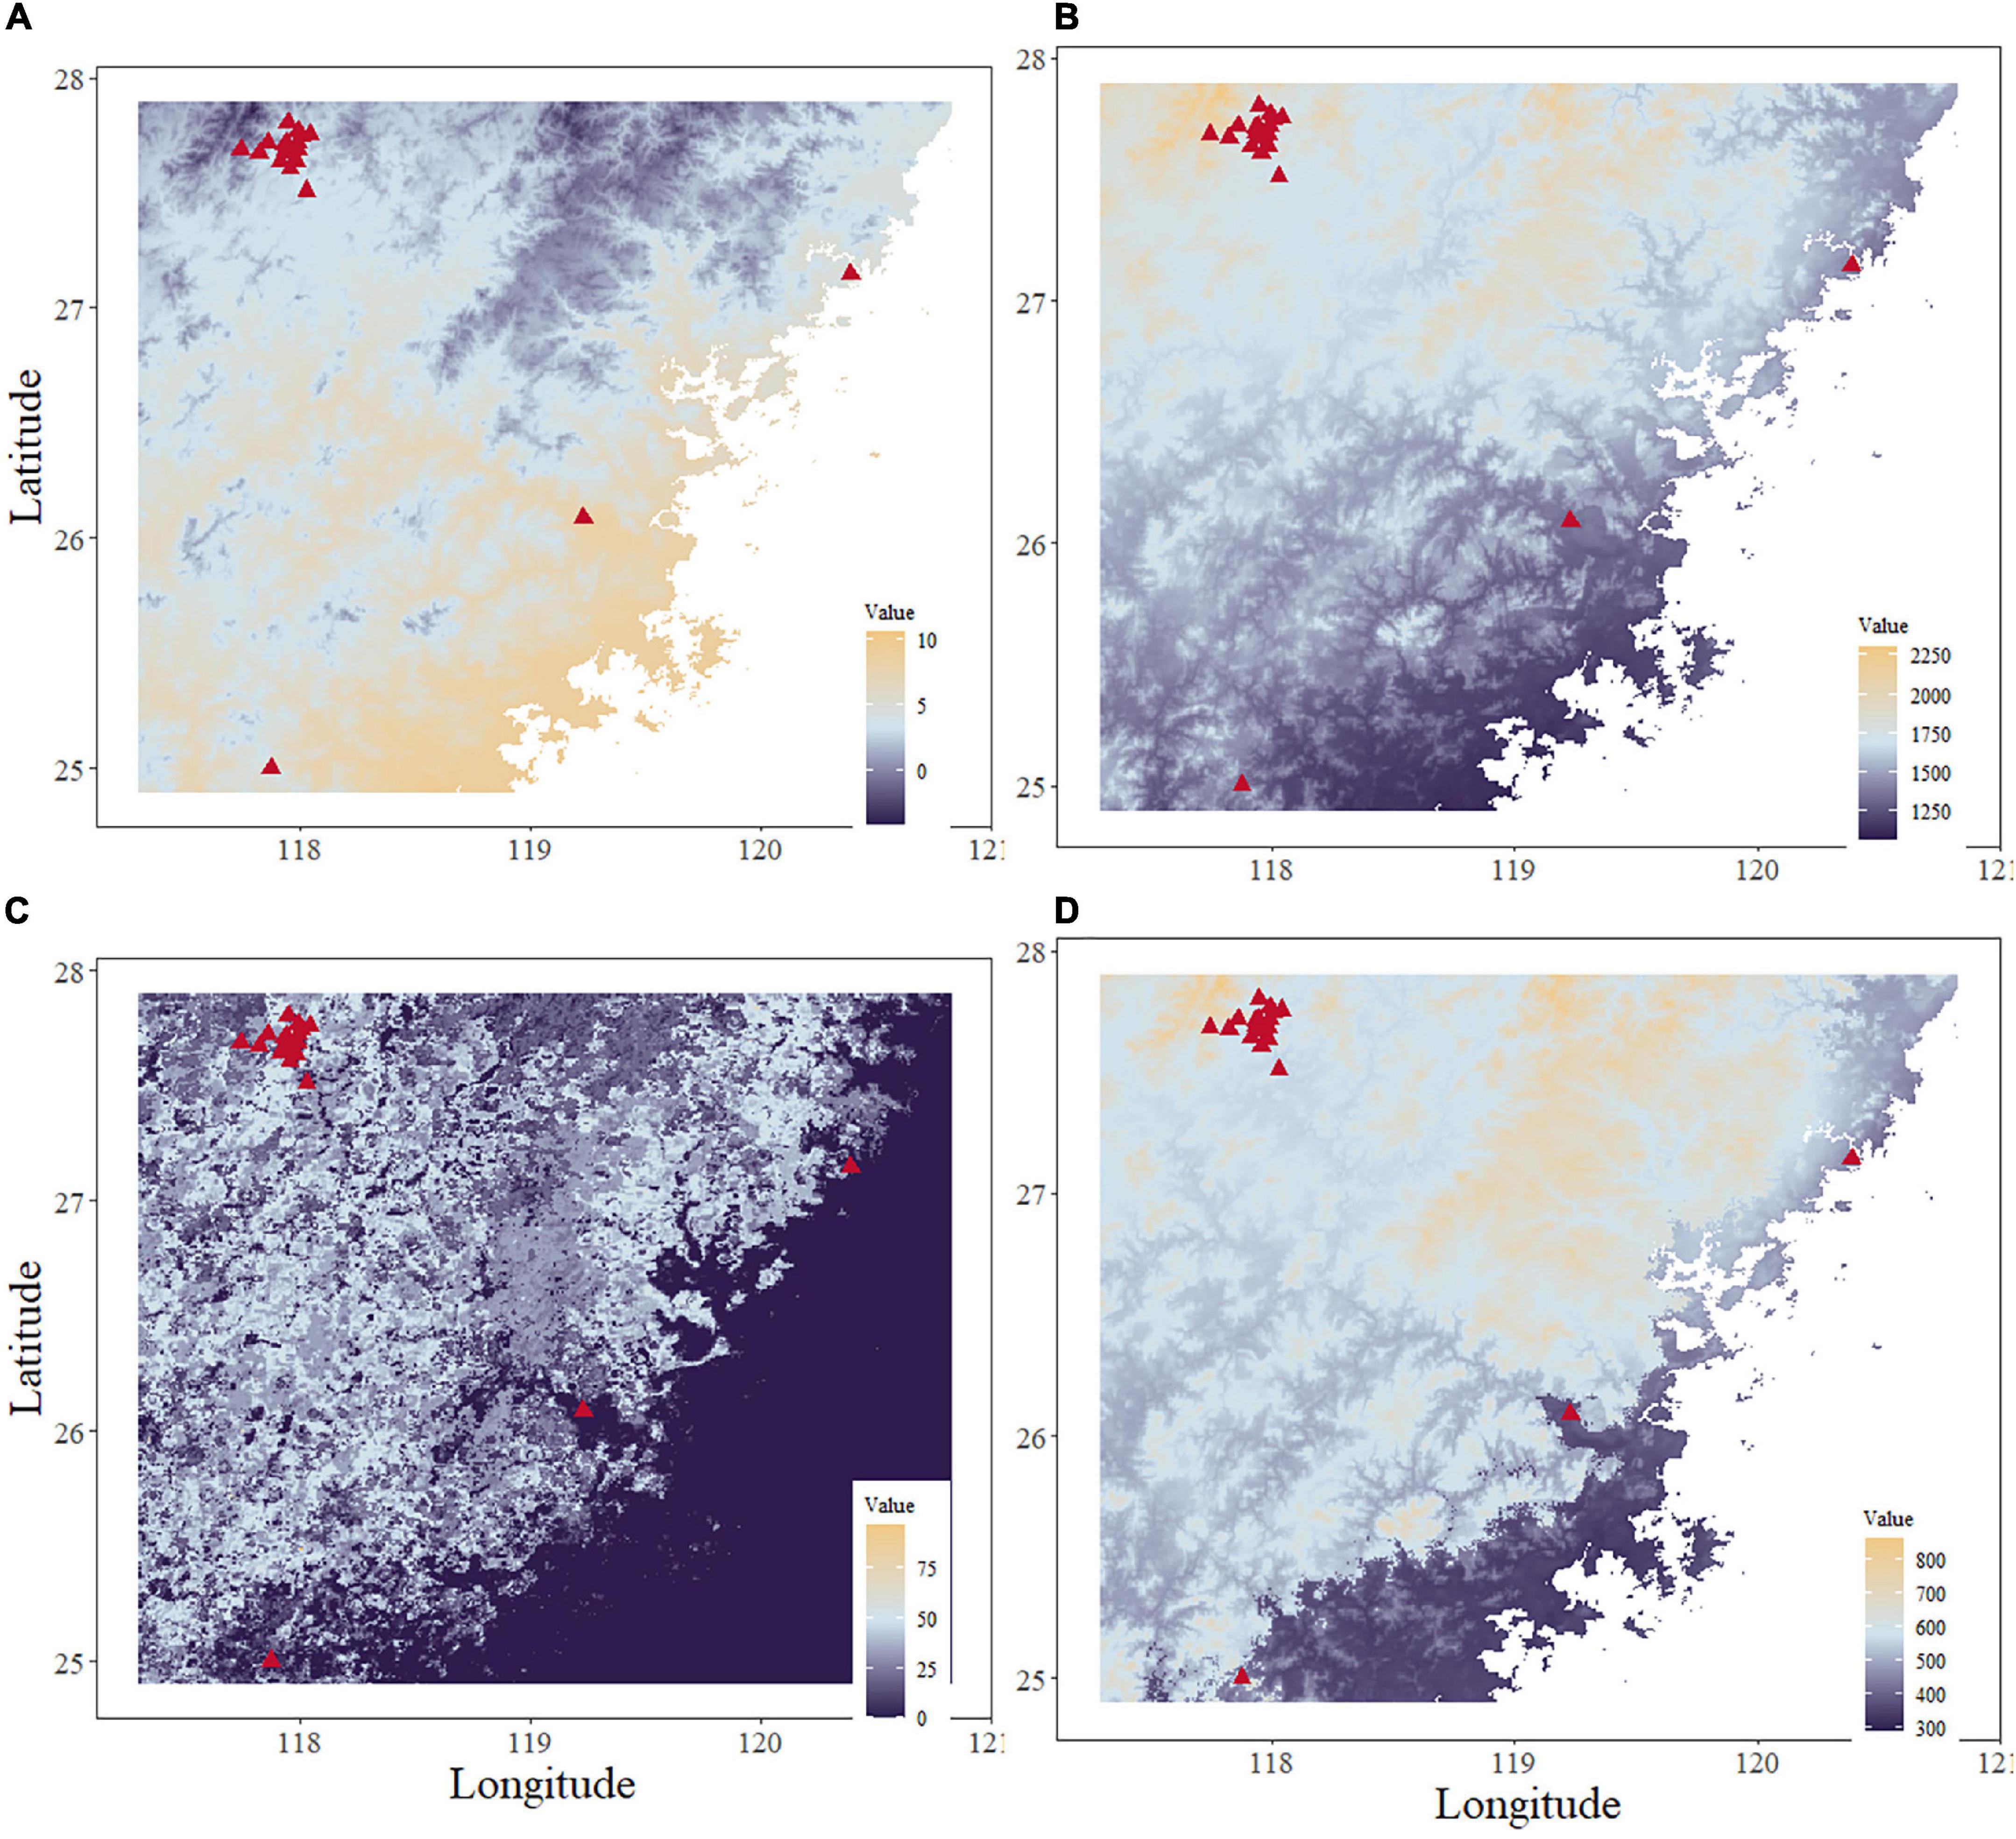
Figure 8. Maps of the top four environmental variables. (A) Minimum temperature of the coldest month. (B) Annual precipitation. (C) Evergreen/deciduous needleleaf trees. (D) Precipitation in the warmest quarter.
Most landscape metrics showed no significant relationship with the three population’s genetic diversity metrics (i.e., AR, He, and Ho). At the 1,000 and 2,000-m radius buffers (Supplementary Table 4), He and Ho showed a significantly negative relationship with the cohesion index of the cropland cover [1,000 m: r (He) = −0.57, r (Ho) = −0.56; 2,000 m: r (He) = −0.47, r (Ho) = −0.51]. At the 2,000-m radius buffer, AR was significantly positively correlated to the cohesion index of non-vegetation land cover [r (AR) = 0.53]. In contrast, Ho was significantly negatively correlated to the cohesion index of non-vegetation land cover [r (Ho) = −0.53].
Discussion
Mapping genetic connectivity and exploring the relationship between environmental variables and genetic differentiation in a species are critical preliminary aspects of landscape genetics (Manel et al., 2003; Manel and Holderegger, 2013). In this study, based on the population genetic differentiation analyses using DAPC and FST estimation, we proposed an ensemble learning method that uses XGBoost-RFR to map landscape connectivity and identify the most critical landscape variables associated with the population genetic variations in S. empoasca, an essential parasitic natural enemy in tea plantations.
Regarding population genetic differentiation, DAPC showed an unclear genetic cluster of S. empoasca populations, while FST estimation proved significant differences between the PKK, SPC, FZ, and AX populations. Previous studies on other parasitoids conducted at large scales (Mitrović et al., 2013; Tait et al., 2017) or both large and small scales (Zepeda-Paulo et al., 2016; Garba et al., 2019) showed a distinct population genetic structure considering the large scale and an unclear population genetic structure considering the small scale. Based on the substantial differences between S. empoasca and other taxa in terms of body size and dispersal capacity, we interpreted that the genetic structure of parasitoids could be remarkably influenced by dispersal capacity (Kankare et al., 2005). Our results demonstrated that IBD strongly affected the genetic differentiation of S. empoasca populations, with population genetic distance increasing linearly with the log of geographic distance, as previously detected in most arthropod species (Silva-Brandão et al., 2015; Wright et al., 2015).
The results of primary model selection revealed that booting strategy evaluation results were similar for all models, except for the light gradient boost algorithm and the goss algorithm. The XGBoost-RFR model showed the best metrics. Therefore, XGBoost-RFR model algorithms can be a useful tool in landscape genetics, especially at small sampling scales. Our model exhibited a high correlation (r = 0.87) between the final predicted value and actual genetic differentiation data, which contrasts compared to the results of previous studies (Murphy et al., 2010; Hether and Hoffman, 2012; Sylvester et al., 2018; Pless et al., 2021; Shanley et al., 2021) with comparatively fewer computing resources and workload. Although the accuracy of the prediction depends on many aspects, such as data size, data quality (Farooqi et al., 2018), feature number, model selection, and parameter tuning (Deiss et al., 2020), the boosting algorithm has been proven to be more efficient than the bagging algorithm (Kotsiantis and Kanellopoulos, 2012). Conversely, the error metrics of the XGBoost-RFR model indicated that no overfitting was detected on the test set. Therefore, we believe that our model is a good representation of genetic status.
We use the inverse of each pixel value of each predicted map to represent genetic connectivity in our study region, which means an area with high resistance capacity will exhibit a low genetic connectivity value. All regions with distinctive features (high or low genetic connectivity value regions) in the connectivity map have a similar pattern to the original map (Figures 7, 8) but are not the same. In other words, this connectivity map can be seen as a comprehensive result of all input factors. Individuals from high genetic connectivity regions (light blue and light orange regions on the map) may encounter more resistance when they move to the dark color region.
When we first used STR methods to build the resistance surface, each pixel on this surface contained information about the environment and genetic data. When we constructed the LCP using the STR-based resistance surface, each pixel in the map represented a comprehensive result of 19 bioclimatic factors and was used for subsequent analysis. Annual precipitation is considered the critical factor, given that it has the highest importance score in both two models. The effect of precipitation on genetic differentiation has been frequently detected in plant and virus species (Avolio et al., 2013; Palinski et al., 2021) but seldom in arthropods (Du et al., 2009; Wellenreuther et al., 2011; French et al., 2022). This could be attributed to some reasons. For example, the precipitation variance across different seasons may be inconsistent with the life cycle of S. empoasca.
On the other hand, precipitation in the warmest quarter (bio_18) contains similar information to that of minimum precipitation in the driest quarter and month (bio_17 and bio_14) but deeper. As we know, higher temperatures always accompany lower precipitation amounts. Moreover, temperature seasonality was also implied in bio_18 and bio_6 in the LCP model; this could indicate that temperature seasonality across a year affects genetic differentiation, but lower temperature contributes more. Some other factors, such as wind speed (sfcwind), mean temperature of the wettest quarter (bio_8), the max temperature of the warmest month (bio_5), and others show less contribution to genetic differentiation, therefore can be seen as irrelevant factors. Regarding minimum temperature, many studies have shown that temperature, especially cold weather (Chen Y. et al., 2021), has a significant effect on the genetic differentiation and evolution process of living species (Lamb, 1992; Sinclair et al., 2003; Soderberg, 2021), and our results further confirmed this relationship. In contrast to the connectivity map and the original map, in the LCP model, areas with higher coverage of evergreen/deciduous needleleaf trees always occur with a lower genetic connectivity value. Previous studies on other species have shown a positive relationship between elevation and population genetic differentiation (Bowman et al., 2018; Mushegian et al., 2021). Our results showed that elevation has a marginal effect on the S. empoasca population’s genetic differentiation, although it is not a decisive factor.
Furthermore, genetic diversity indexes and most landscape metrics were not significantly associated—only a few landscape metrics, for example, the cohesion of cropland, significantly negatively affected the S. empoasca population’s genetic diversity. This could be attributed to anthropogenic factors, such as pesticide utilization and farming practices, which may decrease the genetic diversity in S. empoasca (Dong et al., 2018; Mushegian et al., 2021).
Conclusion and implications for conservation
Our study indicated that annual precipitation, minimum precipitation in the warmest quarter, and minimum temperature in the coldest quarter are key climate factors in shaping the genetic differentiation of S. empoasca; moreover, evergreen/deciduous needleleaf tree land cover is the only key landscape factor that was related to the genetic differentiation of S. empoasca. The genetic connectivity map showed that S. empoasca populations in our sampling regions are genetically isolated. Therefore, the increasing occurrence of extreme weather events is unfavorable for the growth and development of S. empoasca populations, particularly those with a slight pattern of IBD. Our analyses also demonstrated a significant pattern of isolation by geographical distance in S. empoasca and a significantly negative effect of cropland on its population’s genetic diversity. These findings indicate that reductions in anthropogenic activities may be one of the strategies to ensure better conservation strategies for S. empoasca populations. Further, to better promote the natural control of S. empoasca on the tea green leafhopper, a relatively stable environment should be considered when managing tea plantations, with lower temperature variation and appropriate precipitation. Besides, our study demonstrated that the XGBoost algorithm could be helpful in mapping genetic connectivity and identifying key environmental factors at fine spatial scales for living species. From a broader perspective, we believe that the proposed method can be applied to other species at any scale.
To the best of our knowledge, this study is the first to practically explore the landscape genetics of a member of the Mymaridae family. We believe that the findings of this work may facilitate the development of more efficacious strategies for employing these natural enemies in biological control. Future studies could focus on expanding the study scale of landscape genetics.
Data availability statement
The original contributions presented in this study are included in the article/Supplementary material, further inquiries can be directed to the corresponding author.
Author contributions
JL, HH, and WC: material collection and preparation. JC, LS, ZY, and JS: experiments and data analysis. LS: writing—original draft preparation. JL, SY, and MY: writing—review and editing. MY and SY: supervision. All authors have agreed to be accountable for all aspects of the work, read, and agreed to the published version of the manuscript.
Funding
This work was supported by the National Key Research and Development Program of China (Grant Number: 2019YFD1002100), Agricultural “Five New” Program of the Development and Reform Commission of Fujian, China [Minfa Reform Agriculture, Grant Number: (2017) 410], the Natural Science Foundation of Fujian Province, China (Grant Number: 2022J05080), and the Technology Research and Development Program of Quanzhou, China (Grant Number: 2020N008s).
Conflict of interest
ZY, JS, and SY were employed by BGI Genomics Shenzhen Technology Co., Ltd.
The remaining authors declare that the research was conducted in the absence of any commercial or financial relationships that could be construed as a potential conflict of interest.
Publisher’s note
All claims expressed in this article are solely those of the authors and do not necessarily represent those of their affiliated organizations, or those of the publisher, the editors and the reviewers. Any product that may be evaluated in this article, or claim that may be made by its manufacturer, is not guaranteed or endorsed by the publisher.
Supplementary material
The Supplementary Material for this article can be found online at: https://www.frontiersin.org/articles/10.3389/fevo.2022.943299/full#supplementary-material
Footnotes
References
Avolio, M. L., Beaulieu, J. M., and Smith, M. D. (2013). T diversity of a dominant C4 grass is altered with increased precipitation variability. Oecologia 171, 571–581. doi: 10.1007/s00442-012-2427-4
Bivand, R., Rundel, C., Pebesma, E., Stuetz, R., Hufthammer, K. O., and Bivand, M. R. (2017). Package ‘rgeos’. The Comprehensive R Archive Network (CRAN).
Blacket, M., Robin, C., Good, R., Lee, S., and Miller, A. (2012). Universal primers for fluorescent labelling of PCR fragments—an efficient and cost-effective approach to genotyping by fluorescence. Mole. Ecol. Resour. 12, 456–463. doi: 10.1111/j.1755-0998.2011.03104.x
Bossavy, A., Girard, R., and Kariniotakis, G. (2013). Forecasting ramps of wind power production with numerical weather prediction ensembles. Wind Energ. 16, 51–63. doi: 10.1002/we.526
Bowman, J., Greenhorn, J. E., Marrotte, R. R., Mckay, M. M., Morris, K. Y., Prentice, M. B., et al. (2016). On applications of landscape genetics. Conserv. Genet. 17, 753–760. doi: 10.1007/s10592-016-0834-5
Bowman, L. L., Kondrateva, E. S., Timofeyev, M. A., and Yampolsky, L. Y. (2018). Temperature gradient affects differentiation of gene expression and SNP allele frequencies in the dominant Lake Baikal zooplankton species. Mole. Ecol. 27, 2544–2559. doi: 10.1111/mec.14704
Carvalho, F. P. (2017). Pesticides, environment, and food safety. Food Energy Secur. 6, 48–60. doi: 10.1002/fes3.108
Chen, K., Peng, Y., Lu, S., Lin, B., and Li, X. (2021). Bagging based ensemble learning approaches for modeling the emission of PCDD/Fs from municipal solid waste incinerators. Chemosphere 274:129802. doi: 10.1016/j.chemosphere.2021.129802
Chen, Y., Liu, Z., Regniere, J., Vasseur, L., Lin, J., Huang, S., et al. (2021). Large-scale genome-wide study reveals climate adaptive variability in a cosmopolitan pest. Nat. Commun. 12:7206. doi: 10.1038/s41467-021-27510-2
Cranham, J. (1966). Tea pests and their control. Annu. Rev. Entomol. 11, 491–514. doi: 10.1146/annurev.en.11.010166.002423
de León, J., and Jones, W. (2005). Genetic differentiation among geographic populations of Gonatocerus ashmeadi (Hymenoptera: Mymaridae), the predominant egg parasitoid of Homalodisca coagulata (Homoptera: Cicadellidae). Insect. Sci. 5:9. doi: 10.1673/031.005.0201
De Leon, J., Triapitsyn, S., Matteucig, G., and Viggiani, G. (2009). Molecular and morphometric analyses of Anagrus erythroneurae S. Trjapitzin and Chiappinni and A. ustulatus Haliday (Hymenoptera: Mymaridae). Boll. Entomol. Agrar. 62, 75–88.
Deiss, L., Margenot, A. J., Culman, S. W., and Demyan, M. S. (2020). Tuning support vector machines regression models improves prediction accuracy of soil properties in MIR spectroscopy. Geoderma 365:114227. doi: 10.1016/j.geoderma.2020.114227
Dong, Z., Li, Y., and Zhang, Z. (2018). Genetic diversity of melon aphids Aphis gossypii associated with landscape features. Ecol. Evolut. 8, 6308–6316. doi: 10.1002/ece3.4181
Du, J., Gao, B.-J., Zhou, G.-N., and Miao, A.-M. (2009). Genetic diversity and differentiation of fall webworm (Hyphantria cunea Drury) populations. Forest. Stud. China 11, 158–163. doi: 10.1007/s11632-009-0034-1
Elavarasan, D., Vincent, D. R., Sharma, V., Zomaya, A. Y., Srinivasan, K. J. C., and Agriculture, E. I. (2018). Forecasting yield by integrating agrarian factors and machine learning models: A survey. Comput. Electr. Agricult. 155, 257–282. doi: 10.1016/j.compag.2018.10.024
Farooqi, M. M., Khattak, H. A., and Imran, M. (2018). “Data quality techniques in the internet of things: Random forest regression,” in 2018 14th International Conference on Emerging Technologies (ICET), (Netherland: IEEE), 1–4. doi: 10.1109/ICET.2018.8603594
Fick, S. E., and Hijmans, R. J. (2017). WorldClim 2: new 1-km spatial resolution climate surfaces for global land areas. Int. J. Climatol. 37, 4302–4315. doi: 10.1002/joc.5086
French, C. M., Bertola, L. D., Carnaval, A. C., Economo, E. P., Kass, J. M., Lohman, D. J., et al. (2022). Global determinants of the distribution of insect genetic diversity. bioRxiv [Preprint]. doi: 10.1101/2022.02.09.479762
Funasaki, G. Y., Lai, P.-Y., Nakahara, L. M., Beardsley, J. W., and Ota, A. K. (1988). “A review of biological control introductions in Hawaii: 1890 to 1985,” in Proceedings, Hawaiian Entomological Society, (Netherland: IEEE).
Garba, M., Loiseau, A., Tatard, C., Benoit, L., and Gauthier, N. J. B. O. E. R. (2019). Patterns and drivers of genetic diversity and structure in the biological control parasitoid Habrobracon hebetor in Niger. 109, 794–811. doi: 10.1017/S0007485319000142
Grandgirard, J., Hoddle, M. S., Petit, J. N., Roderick, G. K., and Davies, N. (2007). Engineering an invasion: classical biological control of the glassy-winged sharpshooter, Homalodisca vitripennis, by the egg parasitoid Gonatocerus ashmeadi in Tahiti and Moorea, French Polynesia. Biol. Invas. 10, 135–148. doi: 10.1007/s10530-007-9116-y
Hesselbarth, M. H., Sciaini, M., With, K. A., Wiegand, K., and Nowosad, J. (2019). landscapemetrics: An open-source R tool to calculate landscape metrics. Ecography 42, 1648–1657. doi: 10.1111/ecog.04617
Hether, T., and Hoffman, E. (2012). Machine learning identifies specific habitats associated with genetic connectivity in Hyla squirella. J. Evolut. Biol. 25, 1039–1052. doi: 10.1111/j.1420-9101.2012.02497.x
Huber, J. T. (1986). Systematics, biology, and hosts of the Mymaridae and Mymarommatidae (Insecta: Hymenoptera): 1758–1984. Entomography 4:185.
Jombart, T. (2008). adegenet: a R package for the multivariate analysis of genetic markers. Bioinformatics 24, 1403–1405. doi: 10.1093/bioinformatics/btn129
Jombart, T., Devillard, S., and Balloux, F. (2010). Discriminant analysis of principal components: a new method for the analysis of genetically structured populations. BMC Genet. 11:94. doi: 10.1186/1471-2156-11-94
Jonsson, M., Kaartinen, R., and Straub, C. S. (2017). Relationships between natural enemy diversity and biological control. Curr. Opin. Insect. Sci. 20, 1–6. doi: 10.1016/j.cois.2017.01.001
Kankare, M., Van Nouhuys, S., Gaggiotti, O., and Hanski, I. (2005). Metapopulation genetic structure of two coexisting parasitoids of the Glanville fritillary butterfly. Oecologia 143, 77–84. doi: 10.1007/s00442-004-1782-1
Keenan, K., Mcginnity, P., Cross, T. F., Crozier, W. W., and Prodöhl, P. A. (2013). diveRsity: An R package for the estimation and exploration of population genetics parameters and their associated errors. Methods Ecol. Evol. 4, 782–788. doi: 10.1111/2041-210X.12067
Kittlein, M. J., Mora, M. S., Mapelli, F. J., Austrich, A., and Gaggiotti, O. E., and Evolution. (2022). Deep learning and satellite imagery predict genetic diversity and differentiation. Methods Ecol. Evolut. 13, 711–721. doi: 10.1111/2041-210X.13775
Kotsiantis, S., and Kanellopoulos, D. (2012). Combining bagging, boosting and random subspace ensembles for regression problems. Int. J. Innov. Comput. Inform. Control 8, 3953–3961.
Lamb, R. (1992). Developmental rate of Acyrthosiphon pisum (Homoptera: Aphididae) at low temperatures: implications for estimating rate parameters for insects. Environ. Entomol. 21, 10–19. doi: 10.1093/ee/21.1.10
Li, J., Shi, L., Chen, J., You, M., and You, S. (2021). Development and characterization of novel microsatellite markers for a dominant parasitoid Stethynium empoasca (Hymenoptera: Mymaridae) in tea plantations using high-throughput sequencing. Appl. Entomol. Zool. 56, 41–50. doi: 10.1007/s13355-020-00704-8
Liu, W., Liu, W. D., and Gu, J. (2020). Forecasting oil production using ensemble empirical model decomposition based Long Short-Term Memory neural network. J. Petrol. Sci. Engin. 189:107013. doi: 10.1016/j.petrol.2020.107013
Manel, S., and Holderegger, R. (2013). Ten years of landscape genetics. Trends Ecol. Evolut. 28, 614–621. doi: 10.1016/j.tree.2013.05.012
Manel, S., Schwartz, M. K., Luikart, G., and Taberlet, P. (2003). Landscape genetics: combining landscape ecology and population genetics. Trends Ecol. Evolut. 18, 189–197. doi: 10.1016/S0169-5347(03)00008-9
Mills, N. J. (1994). Parasitoid guilds: defining the structure of the parasitoid communities of endopterygote insect hosts. Environ. Entomol. 23, 1066–1083. doi: 10.1093/ee/23.5.1066
Mitrović, M., Petrović, A., Kavallieratos, N. G., Starý, P., Petrović-Obradović, O., Tomanović, Ž, et al. (2013). Geographic structure with no evidence for host-associated lineages in European populations of Lysiphlebus testaceipes, an introduced biological control agent. Biol. Control 66, 150–158. doi: 10.1016/j.biocontrol.2013.05.007
Murphy, M. A., Evans, J. S., and Storfer, A. J. E. (2010). Quantifying Bufo boreas connectivity in Yellowstone National Park with landscape genetics. Ecology 91, 252–261. doi: 10.1890/08-0879.1
Mushegian, A. A., Neupane, N., Batz, Z., Mogi, M., Tuno, N., Toma, T., et al. (2021). Ecological mechanism of climate-mediated selection in a rapidly evolving invasive species. Ecol. Lett. 24, 698–707. doi: 10.1111/ele.13686
Nadel, R. L., Wingfield, M. J., Scholes, M. C., Lawson, S. A., Noack, A., Neser, S., et al. (2012). Mitochondrial DNA diversity of Cleruchoides noackae (Hymenoptera: Mymaridae): a potential biological control agent for Thaumastocoris peregrinus (Hemiptera: Thaumastocoridae). Biol. Control 57, 397–404. doi: 10.1007/s10526-011-9409-z
Nakai, M. (2009). Biological control of tortricidae in tea fields in Japan using insect viruses and parasitoids. Virol. Sin. 24, 323–332. doi: 10.1007/s12250-009-3057-9
Opitz, D., and Maclin, R. (1999). Popular ensemble methods: An empirical study. J. Artif. Intellig. Res. 11, 169–198. doi: 10.1613/jair.614
Palinski, R., Pauszek, S. J., Humphreys, J. M., Peters, D. P., Mcvey, D. S., Pelzel-Mccluskey, A. M., et al. (2021). Evolution and expansion dynamics of a vector-borne virus: 2004–2006 vesicular stomatitis outbreak in the western USA. Ecosphere 12:e03793. doi: 10.1002/ecs2.3793
Pless, E., Saarman, N. P., Powell, J. R., Caccone, A., and Amatulli, G. (2021). A machine-learning approach to map landscape connectivity in Aedes aegypti with genetic and environmental data. Proc. Natl. Acad. Sci. U.S.A. 118:e2003201118. doi: 10.1073/pnas.2003201118
Polikar, R. (2006). Ensemble based systems in decision making. IEEE Circuits Syst. Magaz. 6, 21–45. doi: 10.1109/MCAS.2006.1688199
Rodriguez-Saona, C. (2018). Biological Control: Ecology and Applications. Am. Entomol. 64, E2–E2. doi: 10.1093/ae/tmy017
Shanley, C. S., Eacker, D. R., Reynolds, C. P., Bennetsen, B. M., and Gilbert, S. L., and Management. (2021). Using LiDAR and Random Forest to improve deer habitat models in a managed forest landscape. Forest Ecol. Manag. 499:119580. doi: 10.1016/j.foreco.2021.119580
Silva-Brandão, K. L., Santos, T. V., Cônsoli, F. L., and Omoto, C. (2015). Genetic diversity and structure of Brazilian populations of Diatraea saccharalis (Lepidoptera: Crambidae): Implications for pest management. J. Econ. Entomol. 108, 307–316. doi: 10.1093/jee/tou040
Sinclair, B. J., Vernon, P., Klok, C. J., and Chown, S. L. (2003). Insects at low temperatures: an ecological perspective. Trends Ecol. Evolut. 18, 257–262. doi: 10.1016/S0169-5347(03)00014-4
Soderberg, D. N. (2021). Susceptibility of High-Elevation Forests to Mountain Pine Beetle (Dendroctonus ponderosae Hopkins) Under Climate Change. United States: Utah State University.
Sylvester, E. V., Bentzen, P., Bradbury, I. R., Clément, M., Pearce, J., Horne, J., et al. (2018). Applications of random forest feature selection for fine-scale genetic population assignment. Evol. Appl. 11, 153–165. doi: 10.1111/eva.12524
Tait, G., Vezzulli, S., Sassù, F., Antonini, G., Biondi, A., Baser, N., et al. (2017). Genetic variability in Italian populations of Drosophila suzukii. BMC Genet. 18:87. doi: 10.1186/s12863-017-0558-7
Lemonick. (2000). Gene Mapper. The bad boy of science has jump-started a biological revolution. New York: Lemonick, 17.
Triapitsyn, S. V., Adachi-Hagimori, T., Rugman-Jones, P. F., Barry, A., Abe, A., Matsuo, K., et al. (2019). Egg parasitoids of the tea green leafhopper Empoascaonukii (Hemiptera, Cicadellidae) in Japan, with a description of a new species of Anagrus (Hymenoptera, Mymaridae). ZooKeys 836, 93–112. doi: 10.3897/zookeys.836.32634
Tuanmu, M. N., and Jetz, W. (2014). A global 1-km consensus land-cover product for biodiversity and ecosystem modelling. Glob. Ecol. Biogeogr. 23, 1031–1045. doi: 10.1111/geb.12182
Van Oosterhout, C., Hutchinson, W. F., Wills, D. P., and Shipley, P. (2004). MICRO-CHECKER: software for identifying and correcting genotyping errors in microsatellite data. Mole. Ecol. Notes 4, 535–538.
Wellenreuther, M., Sanchez-Guillen, R. A., Cordero-Rivera, A., Svensson, E. I., and Hansson, B. (2011). Environmental and climatic determinants of molecular diversity and genetic population structure in a coenagrionid damselfly. PLoS One 6:e20440. doi: 10.1371/journal.pone.0020440
Wright, D., Bishop, J. M., Matthee, C. A., and Von Der Heyden, S. (2015). Genetic isolation by distance reveals restricted dispersal across a range of life histories: implications for biodiversity conservation planning across highly variable marine environments. Div. Distrib. 21, 698–710. doi: 10.1111/ddi.12302
Yue, N., Kuang, H., Sun, L., Wu, L., and Xu, C. (2010). An empirical analysis of the impact of EU’s new food safety standards on China’s tea export. Int. J. Food Sci. Technol. 45, 745–750. doi: 10.1111/j.1365-2621.2010.02189.x
Zepeda-Paulo, F., Dion, E., Lavandero, B., Maheo, F., Outreman, Y., Simon, J.-C., et al. (2016). Signatures of genetic bottleneck and differentiation after the introduction of an exotic parasitoid for classical biological control. Biol. Invas. 18, 565–581. doi: 10.1007/s10530-015-1029-6
Keywords: landscape genetics, machine learning, parasitoid, climate change, biology conservation
Citation: Sun L, Li J, Chen J, Chen W, Yue Z, Shi J, Huang H, You M and You S (2022) An ensemble learning approach to map the genetic connectivity of the parasitoid Stethynium empoasca (Hymenoptera: Mymaridae) and identify the key influencing environmental and landscape factors. Front. Ecol. Evol. 10:943299. doi: 10.3389/fevo.2022.943299
Received: 13 May 2022; Accepted: 29 August 2022;
Published: 23 September 2022.
Edited by:
Nikica Šprem, University of Zagreb, CroatiaReviewed by:
Wenwu Zhou, Zhejiang University, ChinaAnkita Gupta, Indian Council of Agricultural Research (ICAR), India
Copyright © 2022 Sun, Li, Chen, Chen, Yue, Shi, Huang, You and You. This is an open-access article distributed under the terms of the Creative Commons Attribution License (CC BY). The use, distribution or reproduction in other forums is permitted, provided the original author(s) and the copyright owner(s) are credited and that the original publication in this journal is cited, in accordance with accepted academic practice. No use, distribution or reproduction is permitted which does not comply with these terms.
*Correspondence: Shijun You, c2p5b3VAZmFmdS5lZHUuY24=
†These authors have contributed equally to this work
 Linyang Sun
 Jinyu Li1,4†
 Wei Chen
 Minsheng You
 Shijun You