 Charles J. Krebs1*
 Stan Boutin2Rudy Boonstra3
 Dennis L. Murray4
 Thomas S. Jung5Mark O’Donoghue6B. Scott Gilbert7Piia M. Kukka5
 Shawn D. Taylor8T. Morgan9Ryan Drummond8Anthony R. E. Sinclair1Alice J. Kenney1
- 1Department of Zoology, University of British Columbia, Vancouver, BC, Canada
- 2Department of Biological Sciences, University of Alberta, Edmonton, AB, Canada
- 3Department of Biological Sciences, University of Toronto – Scarborough, Toronto, ON, Canada
- 4Department of Biology, Trent University, Peterborough, ON, Canada
- 5Environment Yukon, Government of Yukon, Whitehorse, YT, Canada
- 6Environment Yukon, Mayo, YT, Canada
- 7Renewable Resources Management Program, Yukon University, Whitehorse, YT, Canada
- 8Environment Yukon, Government of Yukon, Haines Junction, YT, Canada
- 9Environment Yukon, Government of Yukon, Watson Lake, YT, Canada
The boreal forest, the world’s largest terrestrial biome, is undergoing dramatic changes owing to anthropogenic stressors, including those of climate change. To track terrestrial ecosystem changes through space and time, robust monitoring programs are needed that survey a variety of ecosystem constituents. We monitored white spruce (Picea glauca) cone crops, berry (Empetrum nigrum, Shepherdia canadensis) production, above-ground mushroom abundance, and the abundance of small mammals (Clethrionomys rutilus, Peromyscus maniculatus), North American red squirrels (Tamiascirus hudsonicus), snowshoe hares (Lepus americanus), and carnivores (Lynx canadensis, Canis latrans, Vulpes vulpes, Martes americana, Mustela erminea) across 5 sites in the Yukon, Canada. Monitoring began in 1973 at Lhù’ààn Mân’ (Kluane Lake) and additional protocols were added until a complete sequence was fixed in 2005 at all 5 sites and continued until 2022. White spruce cone counts show mast years at 3–7-year intervals. Ground berries and soapberry counts were highly variable among sites and counts did not correlate among sites or between years for different species. Red-backed voles showed clear 3–4-year cycles at Kluane and probably at the Mayo and Watson Lake sites, but showed only annual cycles in Whitehorse and Faro. Snowshoe hares fluctuated in 9–10-year cycles in a travelling wave, peaking one year earlier at Watson Lake but in synchrony at all other sites, with no clear sign of peak density changing or cyclic attenuation over the last 50 years. Red squirrel numbers at Kluane exhibit marked inter-year variability, driven mainly by episodic white spruce cone crops and predation from Canada lynx and coyotes as hare densities undergo cyclic decline. Snow track counts to index mammalian predators have been conducted on our Kluane and Mayo sites, indicating that lynx numbers rise and fall with a 1–2-year lag at these two sites, tracking the hare cycle. Coyotes and lynx at Kluane peak together following the hare cycle, but coyote counts are also depressed during deep snow years. To summarize, we noted considerable inter-site variability in the population dynamics of many boreal forest ecosystem constituents, but the keystone species (snowshoe hare, Canada lynx) exhibit remarkably similar population trends across the region. We continue to monitor wildlife abundance, cone crops, berry production, and mushroom biomass to determine changes associated with increasing temperature and fluctuating rainfall. The Yukon boreal forest is changing as climate shifts, but the changes are slow, variable across sites, taxa specific, and of uncertain predictability.
Introduction
Human activities are having dramatic direct and indirect effects on natural environments worldwide, resulting in profound changes to the distribution and abundance of plants and animals and altering the structure and function of virtually all ecosystems (Nelson et al., 2006; Hooper et al., 2012). These fundamental challenges are expected to increase in the next decades, meaning that major changes to biodiversity, environmental sustainability, and quality of all life are virtually assured (Beaumont et al., 2011). In an effort to establish a reference of current conditions to compare to the future, it is necessary to develop programs that measure and monitor ecosystems in relatively undisturbed environments (Lindenmayer et al., 2015). More specifically, long-term measurement and monitoring of ecosystems is primarily designed to detect the influences of two important drivers. One is the change in global climate and the second is the effect of human exploitation and disturbance on biodiversity, in addition to those on climate (Beaumont et al., 2011). However, to detect these direct and indirect effects of humans, one needs reference areas with minimal human use, which serve as baselines and allow tracking the effects of environmental change through time. There are few examples of successful long-term ecosystem monitoring programs in areas with limited direct human impact: three examples are the Greater Yellowstone Ecosystem, USA (White et al., 2013), Kruger National Park, South Africa (du Toit et al., 2003) and the Greater Serengeti Ecosystem Program, East Africa (Sinclair et al., 2015).
The boreal forest is the world’s largest terrestrial biome and is circumpolar in its distribution. In North America, the boreal forest ranges from the Pacific to Atlantic oceans and extends northward to portions of the Arctic region, covering most of Canada and Alaska (Price et al., 2013). The North American boreal forest is subject to the effects of both climate change and human exploitation, with many areas being sufficiently disturbed that they offer limited merit as a baseline for comparison with future conditions. Thus, in an attempt to establish a baseline for the northwestern region of the boreal forest of North America, we have conducted detailed ecological studies since 1973 at Kluane Lake in the southern Yukon (see Krebs et al., 2001a; Krebs et al. 2017a). We have measured changes in both climate and biota so that they can be used to compare with other sites in the boreal forest that are subject to increasing human influence (Boonstra et al., 2016), as well as through time as the effects of climate change become more pronounced in the region. By way of background, we began with studies of small rodents (Clethrionomys rutilus, Peromyscus maniculatus) and snowshoe hares (Lepus americanus), and then expanded our studies in 1986 to predators (primarily Lynx canadensis and Canis latrans), red squirrels (Tamiasciurus hudsonicus), and white spruce (Picea glauca) cone crops (Krebs et al., 2001a). From 1993 to 2005, we further expanded the range of species monitored at Kluane to include mushrooms and berries (mainly Empetrum nigrum, Shepherdia canadensis), and in 2005 we were able to expand some of the monitoring protocols, with the assistance of Environment Yukon, to other communities in the Yukon, including Mayo, Watson Lake, Faro, and Whitehorse (Figure 1). This approach was strategic to determine which changes being monitored were regional rather than purely local, and the extent of replication needed to establish a reliable baseline of conditions for future comparison. Since then, the plan has been to monitor some of the major elements in this part of the boreal forest, to explore regional correlations in indicator species across the southern and central Yukon, and to obtain trends in measures of ecosystem shifts associated with climate change.
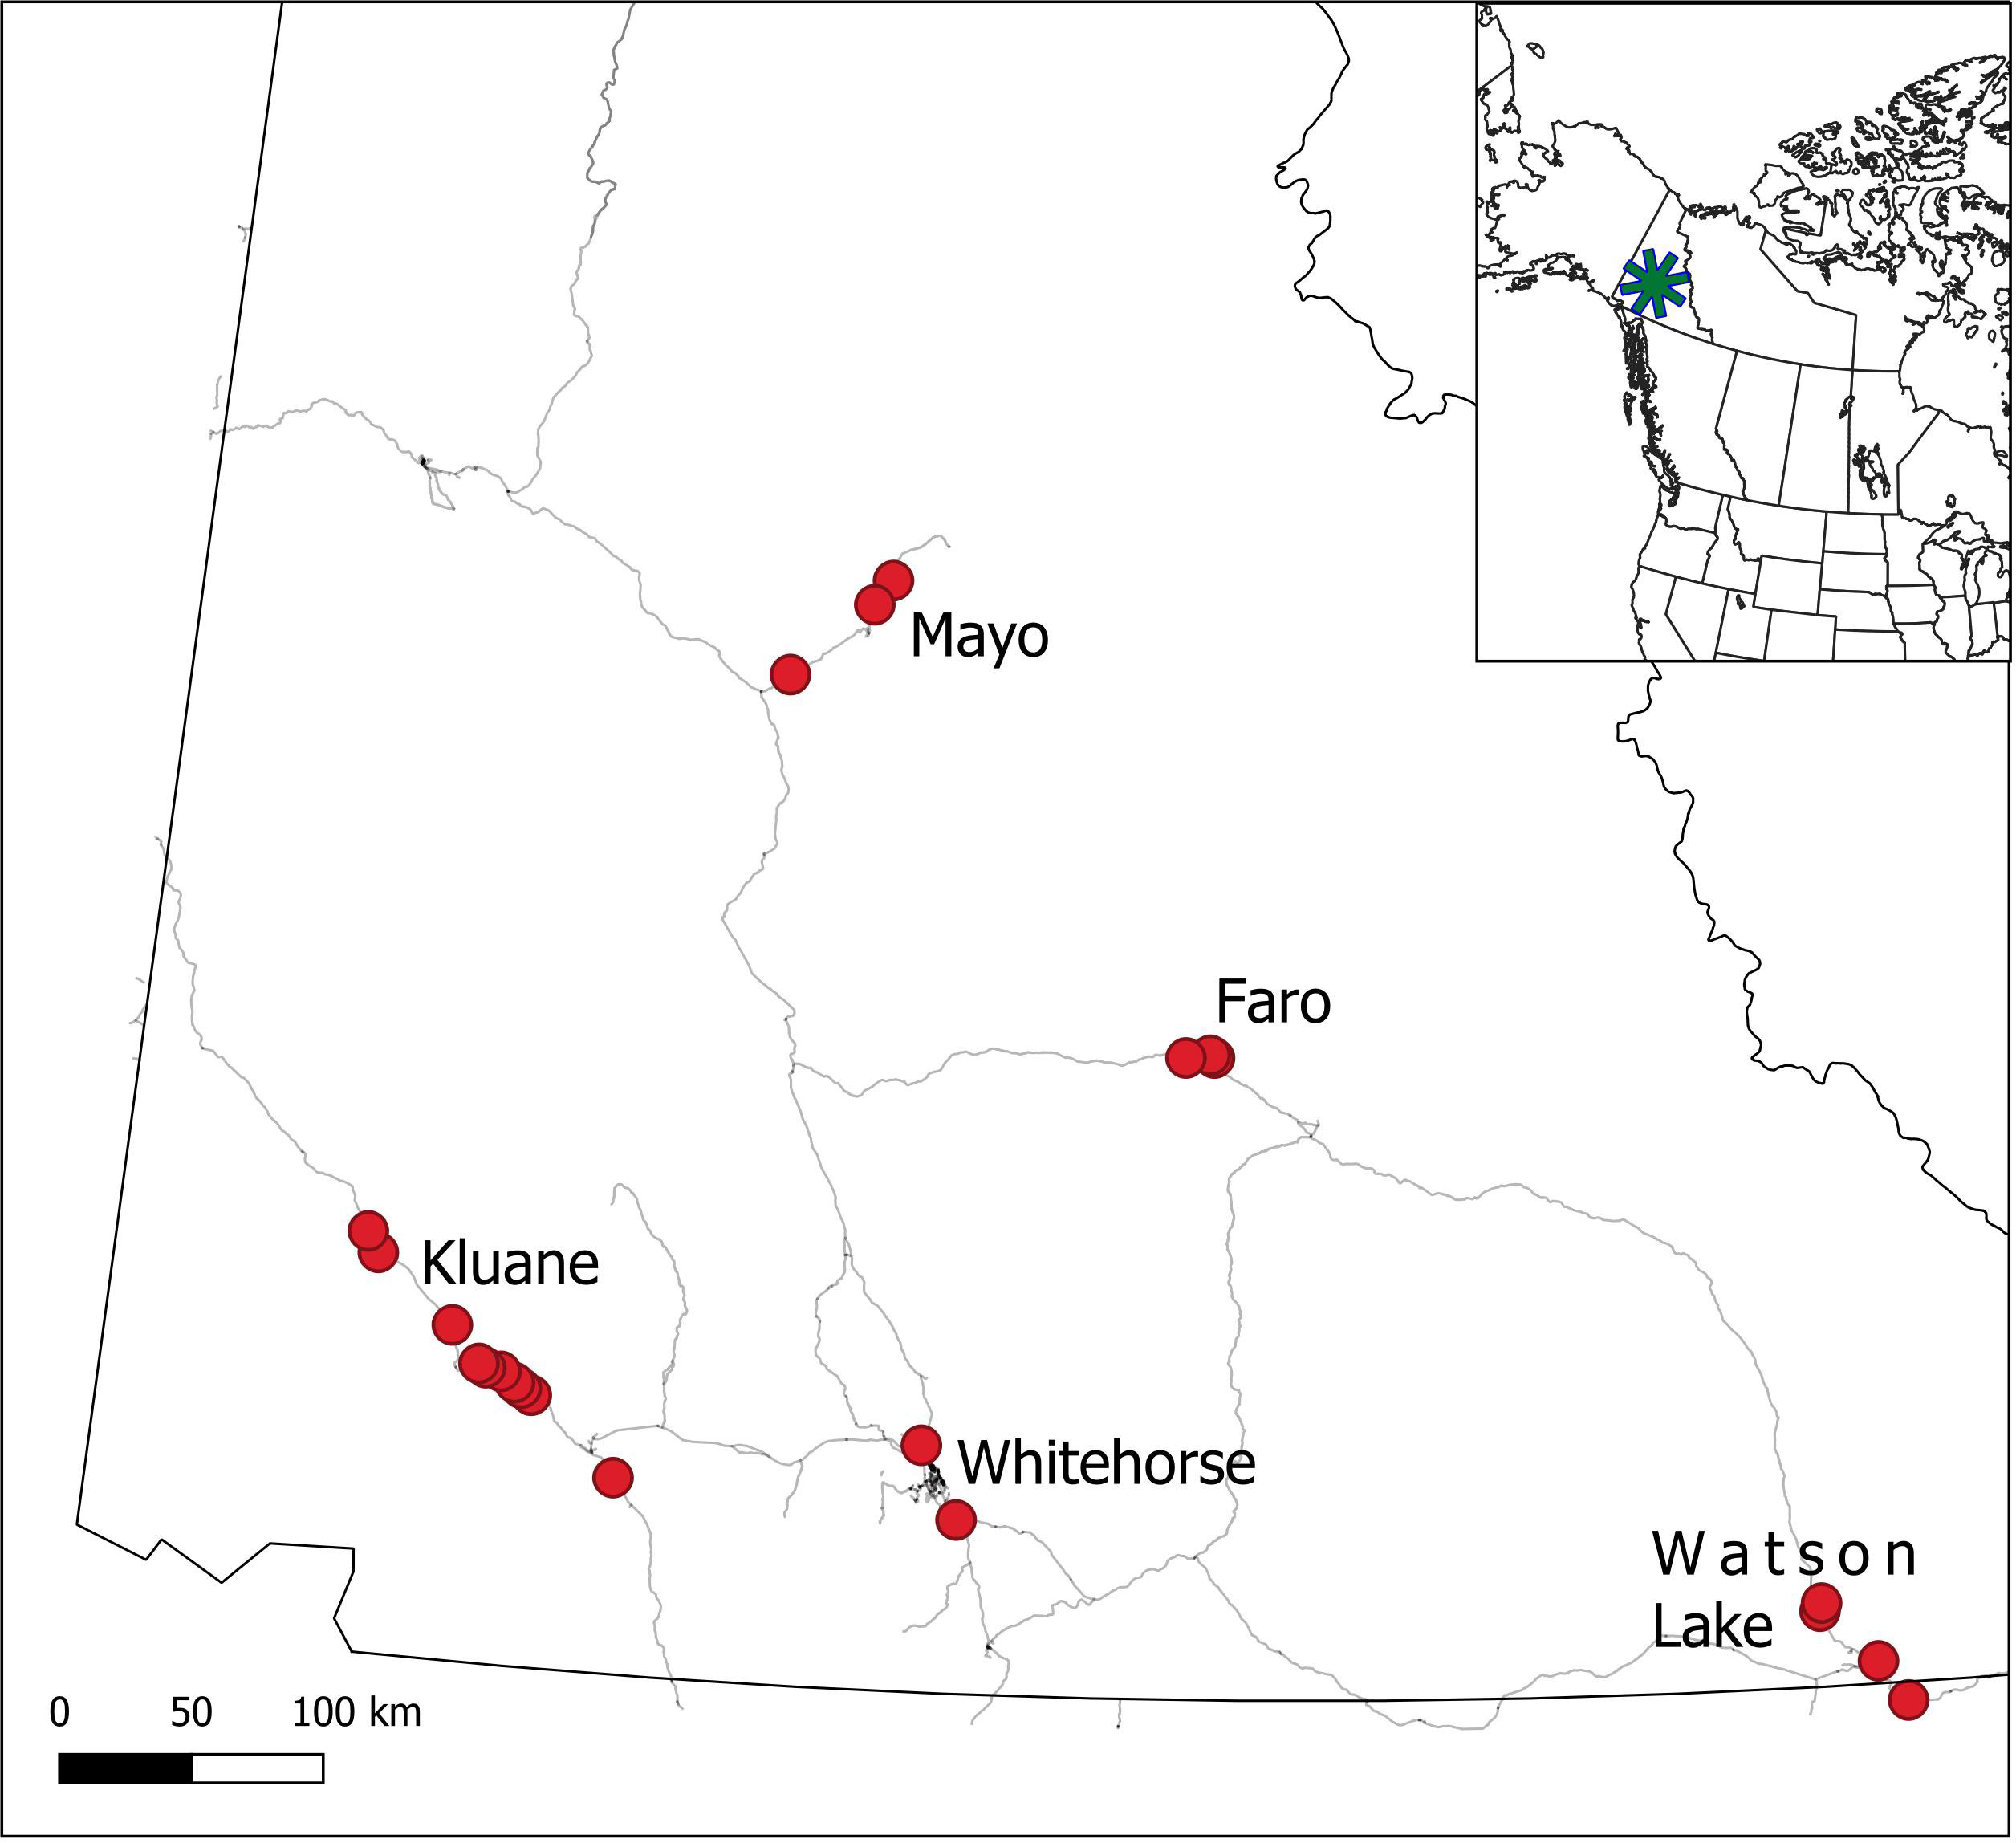
Figure 1 Location of the 5 CEMP monitoring sites in the southern and central Yukon. Red points represent focal monitoring areas within each site.
Ultimately, we consider that the key question ecologists around the world need to be able to answer is: how will ecosystems respond to climate change, and we localize this question to Yukon’s boreal forest. However, it has become increasingly apparent through our monitoring efforts that the answer to this simple question is not simple nor is it easy to collect the data required, but we have information spanning up to 40 years that serves as a starting point. Indeed, some parts of our southern Yukon ecosystems, like spruce cone crops, are directly dependent on climatic variables like temperature and rainfall (Krebs et al., 2017b). Others, for example snowshoe hares, depend immediately on the abundance and hunting success of predators like Canada lynx, which may be impacted by ongoing changes to snow conditions (Peers et al., 2020). So, the question then becomes: will climate change affect the boreal forest ecosystem and if so, how?
In this paper we summarize what we have so far achieved through our monitoring efforts. We expected that long-term monitoring at our 5 sites would reveal: i) change in the ecosystem constituents we chose to monitor; ii) ecosystem changes that correlate with climate-related variables (i.e., precipitation, temperature); and iii) changes that are consistent across our study areas spanning the southern Yukon region (Figure 1). As detailed below, many of our original research questions from when the work was first initiated have been answered, but answers to the above predictions are far from simple, and we have almost as many new questions today as we did when the work was initiated a half-century ago.
Methods
Study areas
Our primary study area is in near Lhù’ààn Mân’ (Kluane Lake), in southwest Yukon (61°57’N, 138°12’W), where we have worked since 1973 (Krebs et al., 2018a) (Figure 1). The region is characterized as semiarid, with summer rainfall averaging 170–200 mm and winter snowfall averaging ~25–60 cm (Peers et al., 2020). Vegetation is dominated by white spruce (Picea glauca) with stands of trembling aspen (Populus tremuloides) primarily on south-facing slopes, and shrub-dominated patches (predominantly willow (Salix sp.) and resin birch (Betula glandulosa)). Elevation ranges from 800 to 1500 m. Our more recently-added study areas include Faro, YT (62°13’N, 133°21’W), Mayo, YT (63°35’N, 135°53’W), Whitehorse, YT (60°43’N, 135°03’W) and Watson Lake, YT (60°03’N, 128°42’W) (Figure 1). Each new site is located in the northwestern boreal forest and is largely comparable to our Kluane site in terms of major landcover characteristics, elevation and topography, and forest species distribution and abundance, with the Mayo and Faro sites having slightly harsher winters and less deciduous forest, and the Whitehorse and Watson Lake sites being more southerly and slightly warmer and wetter, respectively. The Whitehorse site is near the largest community in the Yukon and may have some influence of human disturbance, whereas the remaining sites are more remote from intensive human activities. Climate change is a major driver of recent and ongoing changes across the region, and these changes already exceed thresholds for predicted dramatic effects in the region (Qian et al., 2011; Bush and Lemmen, 2019).
Monitoring program design and implementation
Monitoring an ecosystem at a sufficiently large scale that will yield representative data requires a partnership of investigators and facilities. We established the Community Ecological Monitoring Program (CEMP) as a partnership between biologists at Environment Yukon, Yukon University, the Kluane Red Squirrel Project, the Arctic Institute of North America Kluane Research Station, and the Outpost Research Station at Kluane Lake. A critical first step in establishing a successful monitoring program is to determine the key linkages in the food web, to help prioritize which components to track. Figure 2 shows the food web of this southern Yukon boreal forest region. In an effort to monitor ecological integrity of this web, we need to measure major components in each of the three trophic levels. However, we cannot monitor everything, and we have concentrated our efforts on the keystones and indicators highlighted in Figure 2. Each selection is linked to a variety of other species in the food web, and therefore should play a crucial role in boreal forest ecosystem dynamics. Thus, we believe that the selected species constitute a reliable start for obtaining an early warning of ecosystem change as well as establishing baseline data on the natural range of variation of key ecosystem components (Lindenmayer et al., 2015). As is the case with many ecosystem monitoring programs worldwide, we do not have the funding to monitor all species and large mammals in particular are cost-prohibitive. Many large mammals are monitored by other programs in Environment Yukon and by local First Nations.
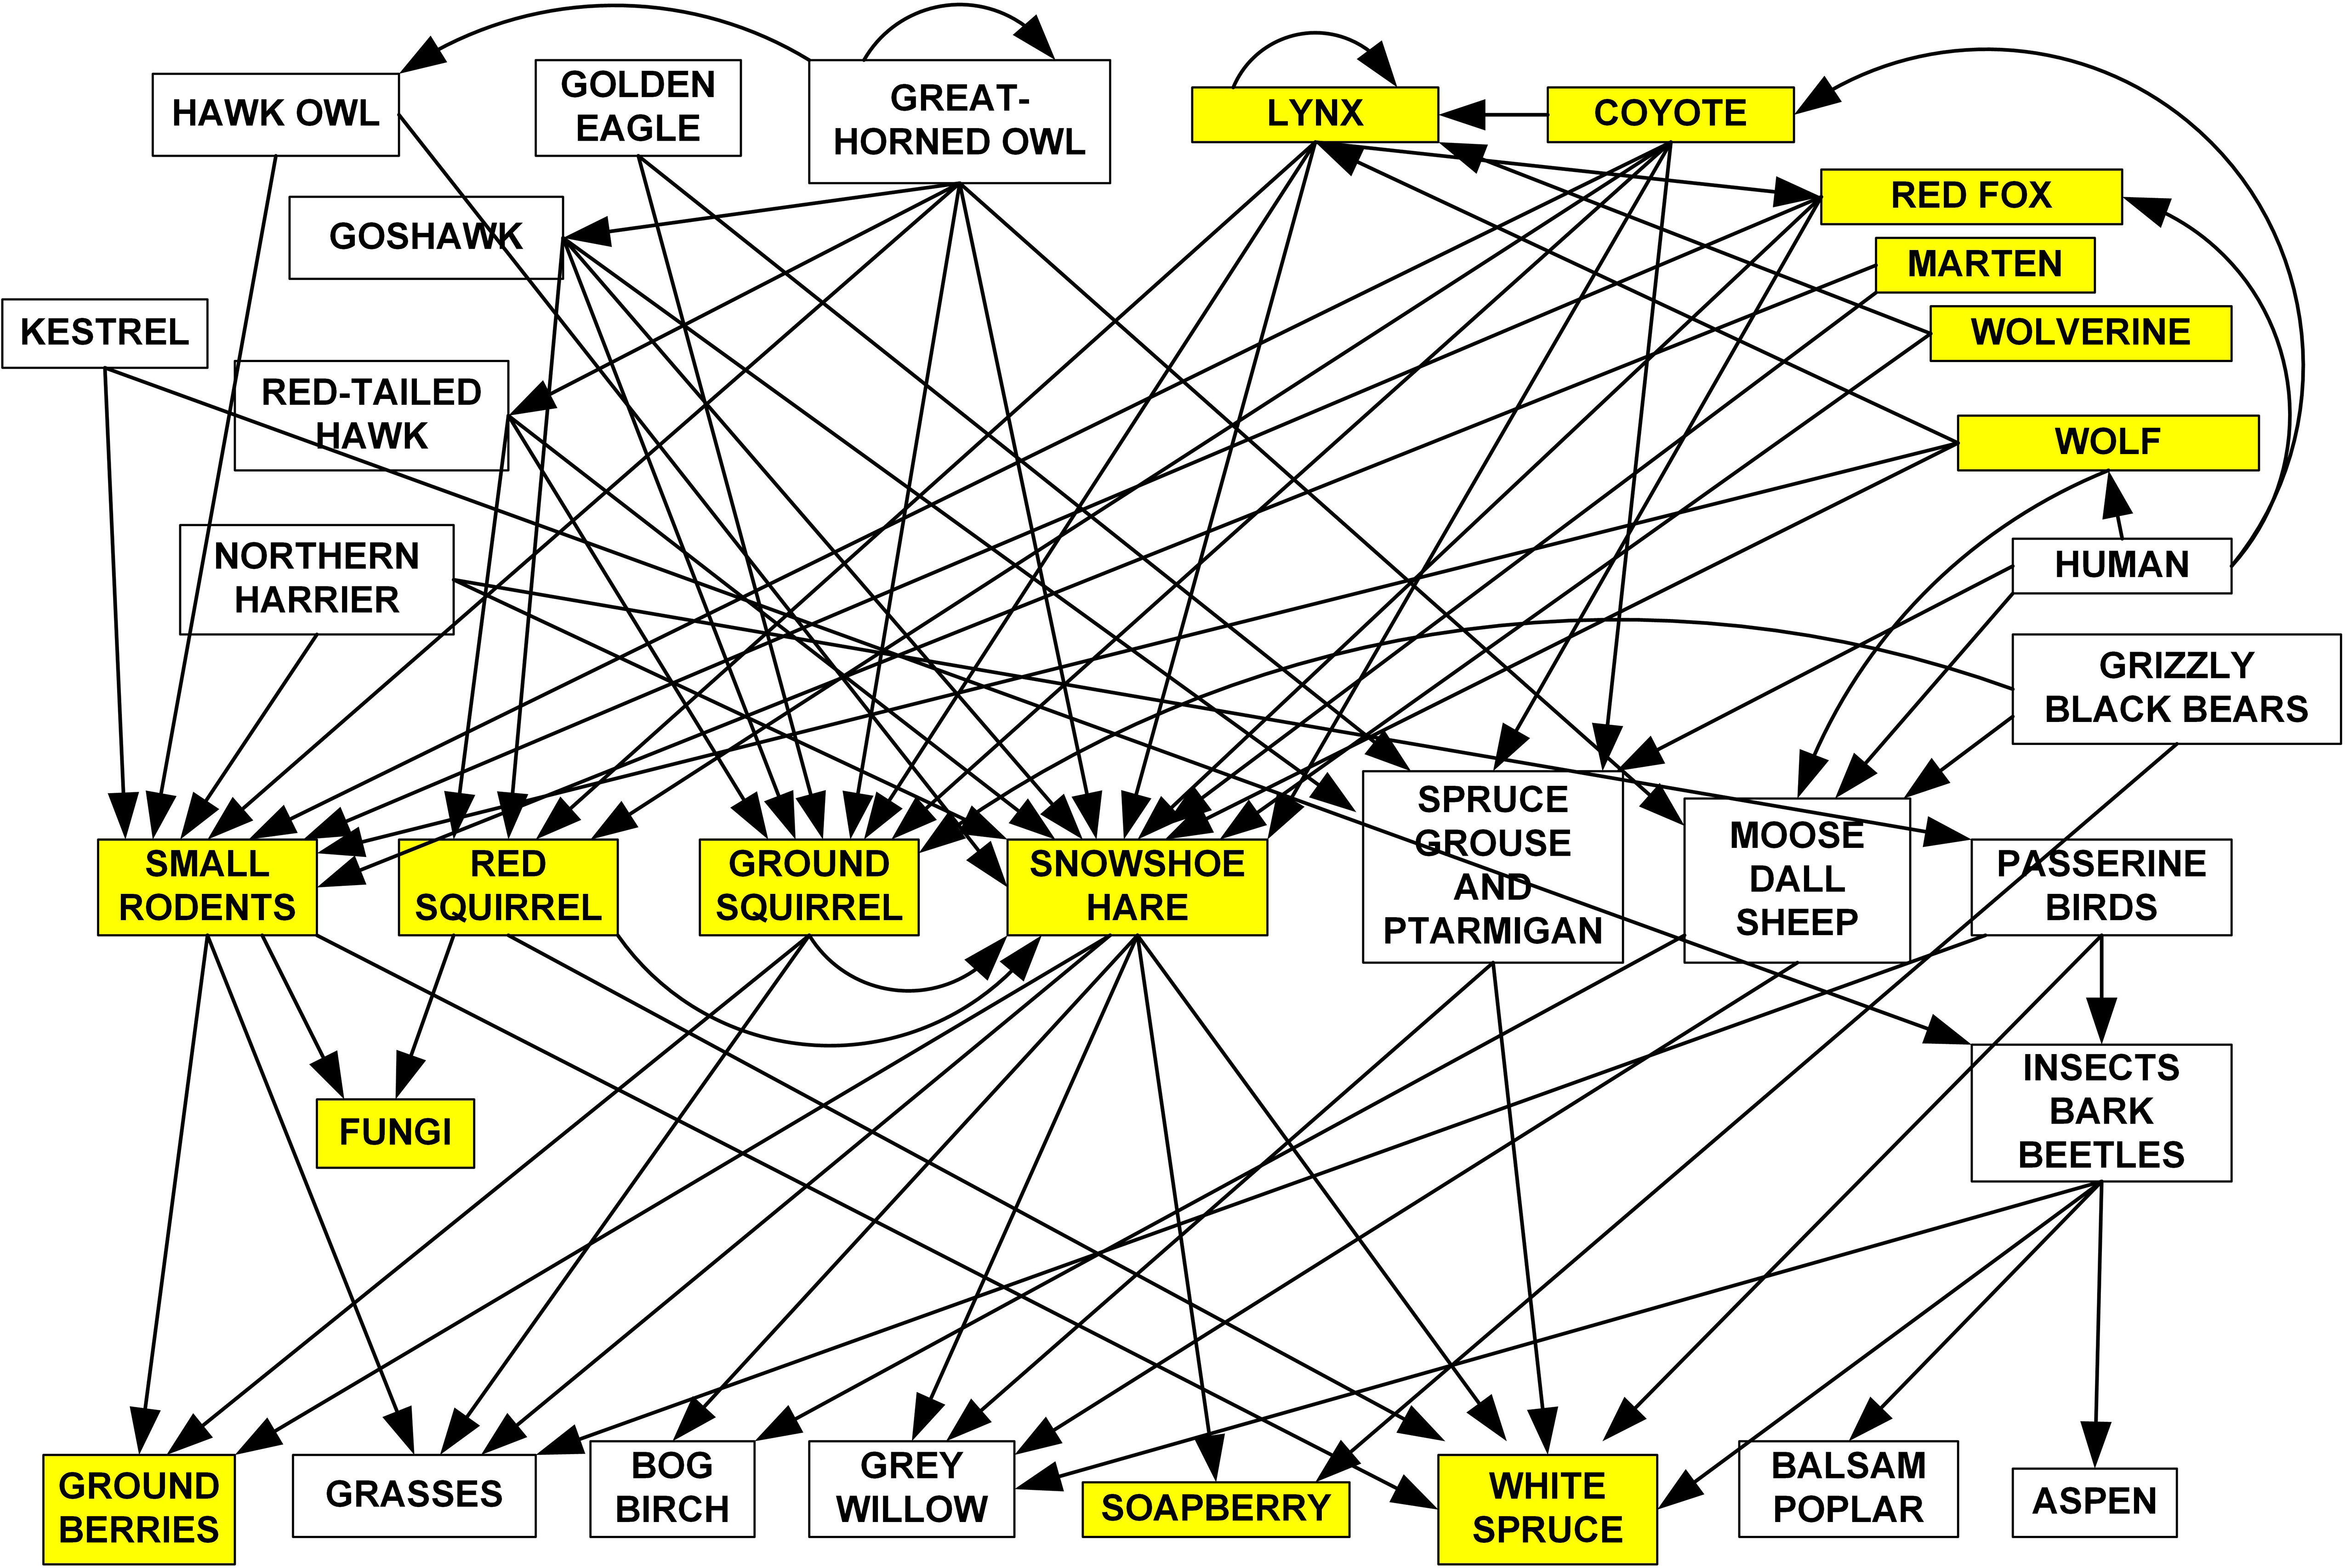
Figure 2 Food web for the boreal forest in the southern and central Yukon. The species being monitored in at least two of the CEMP sites are shaded. Only the major feeding linkages are shown. Two major data gaps in what we measure are the lack of monitoring of trends in abundance of birds and the large mammals.
Two general procedures underlie this monitoring program. First, each summer all the plant and fungi data are collected from fixed quadrats or individually tagged trees, so the same sites are monitored each year. For example, white spruce cone counts have been carried out on an average of 938 individually-marked white spruce trees per year. Five species of ground berries are counted in 1326 permanent 40 × 40 cm quadrats each year. The major berry-producing plants are bearberry (Arctostaphylos uva-ursi), crowberry (Empetrum nigrum) soapberry (Shepherdia canadensis) and cranberry (Vaccinium vitis-idaea). We count the number of ripe berries on permanent quadrats because berry distribution is patchy and varies in abundance in different areas of the general landscape. Marked trees and berry sampling sites were selected randomly in areas that provided good access for data collection, such as our snowshoe hare study areas and major roadways (Figure 1).
The most common rodent on all CEMP sites is the red-backed vole (Clethrionomys rutilus), and we estimated the abundance of this species by live trapping, marking, and releasing individuals for Capture-Mark-Recapture-based population estimation (Boonstra et al., 2001). Owing to logistics and the sampling constraints for reliable CMR-based population estimation, live trapping at Kluane and Whitehorse is conducted in spring and late summer each year, and only in late summer at Mayo, Faro, and Watson Lake. Small rodents are live trapped with 100 Longworth live traps on two to five 2.2-ha grids per site (10 × 10, 15 m spacing).
Snowshoe hares at Kluane are live trapped with 86 live traps on three 36-ha control grids (20 × 20, 30 m spacing) mapped in Krebs et al. (2001a). Hares are trapped each spring and fall, and population density is estimated by spatially-explicit CMR-based estimators (Efford and Fewster, 2013). We have also developed a simple census method for hares by means of fecal pellet counts carried out once a year in summer on permanent plots (Krebs et al., 2001b); this technique has been used at all the CEMP sites to obtain comparative data. The advantages of the pellet plot approach is that it is previously validated with known hare densities at our Kluane Lake site (Krebs et al., 1987; Krebs et al., 2001b) and can be applied quickly and efficiently at all sites without having to livetrap hares.
At the Kluane site, red squirrels and arctic ground squirrels (Urocitellus parryii) are live-trapped in late May and late July on two 9 ha grids (50 traps 10 × 10, 30 m spacing) and densities are estimated by CMR-based population estimation.
We have followed lynx and coyote abundance in the Kluane region since 1987 by means of winter snow track counts along established routes. We expanded this tracking to Mayo in 1999. We count lynx and coyote tracks crossing standard and fixed snowmobile routes after fresh snowfalls each winter, depending on wind conditions. On average about 200 km are tracked each winter at Kluane and about 200–250 km at Mayo. Tracks per 100 km per night are used as an index of abundance or converted to densities following methods described in O’Donoghue et al. (2023).
Data standardization and quality control
Ecosystem monitoring programs that are conducted over long periods or at multiple sites are subject to a variety of potential sources of error, including observer error due to uncertainty about how data should be collected or individual variability arising from different levels of experience or competency. Inevitably, long-term monitoring programs require a variety of field personnel who differ between years or across sites, and therefore may collect data inconsistently. One oft-overlooked aspect of designing an effective monitoring program is the development of standard operating procedures (SOP) that explicitly guide observers to collect data accurately and objectively (Reynolds et al., 2016). To standardize data collection between researchers and across sites, we prepared a SOP handbook of the details of the monitoring protocols for each of the taxa we have studied (CEMP Monitoring Handbook, available for download at http://www.zoology.ubc.ca/~krebs/kluane.html). The SOP document details monitoring schedules, equipment needs, species identification and handling and data collection protocols, as well as computer database data recording procedures. In the field, observers usually work in teams that can include experienced and novice observers who are paired to ensure quality control. For further details, general information on the Kluane boreal forest is detailed in Krebs et al. (2001a), and Annual reports of our monitoring are available at https://www.zoology.ubc.ca/~krebs/kluane.html. The protocols that were conducted at each site are listed in Table S1 (Supplementary Materials). Further details about the location and forest cover types of each plot and site can be found in the CEMP Monitoring Handbook at the website listed above.
Data analysis
The present paper is a synthesis of our long-term monitoring efforts for the boreal forest of northwestern North America, and includes summary information from many published papers, reports, and unpublished analyses that we worked on during our 40+ years of research on this system. The results presented herein are summaries of our major findings and therefore presented mostly qualitatively, in figure format. Where appropriate we conduct pairwise correlations and linear regressions, but for the most part we do not present original statistical analyses. Interested readers are referred to the original sources, which we cite throughout the document. We also provide a useful overview of the main procedures in Supplementary Materials.
Results and discussion
Regional climate conditions
In the Kluane region, temperature of the mid-winter months (Nov–Feb) is currently ~3.8°C warmer (27.7%) than the winter average of the 1970s, and temperature of the summer months (May–Aug) is ~1.4°C warmer (13.3%) than the summer average of the 1970s (Figure 3). Monthly rainfall, by contrast, although highly variable from year to year has been increasing in at a rate of 4 mm per summer season per decade (17% in 50 years), and increasing in winter at 8 mm per decade (33% in 50 years) with large year-to-year variance (see Supplementary Materials for graphs of rainfall and details of linear regressions). These data are from the Haines Junction Meteorological Station of Environment Canada, about 55 km from Kluane Lake. Data from the Mayo Meteorological Station shows the same trends illustrated in Figure 3. Local sites at any given study area are highly correlated in temperature but can vary greatly in rainfall (Krebs et al., 2018b). Snow depth fluctuates greatly from year to year, but there is roughly a 40% (~25 cm) decline in mean January snow depth and a 25% (~35 cm) decline in maximum snow depth, during the last 20 years at Kluane (Peers et al., 2020). There is a suggestion from climate change models that snowfall in northwestern Canada may deepen in coming years, but most predictions are for an overall warmer and drier climate (Price et al., 2013).
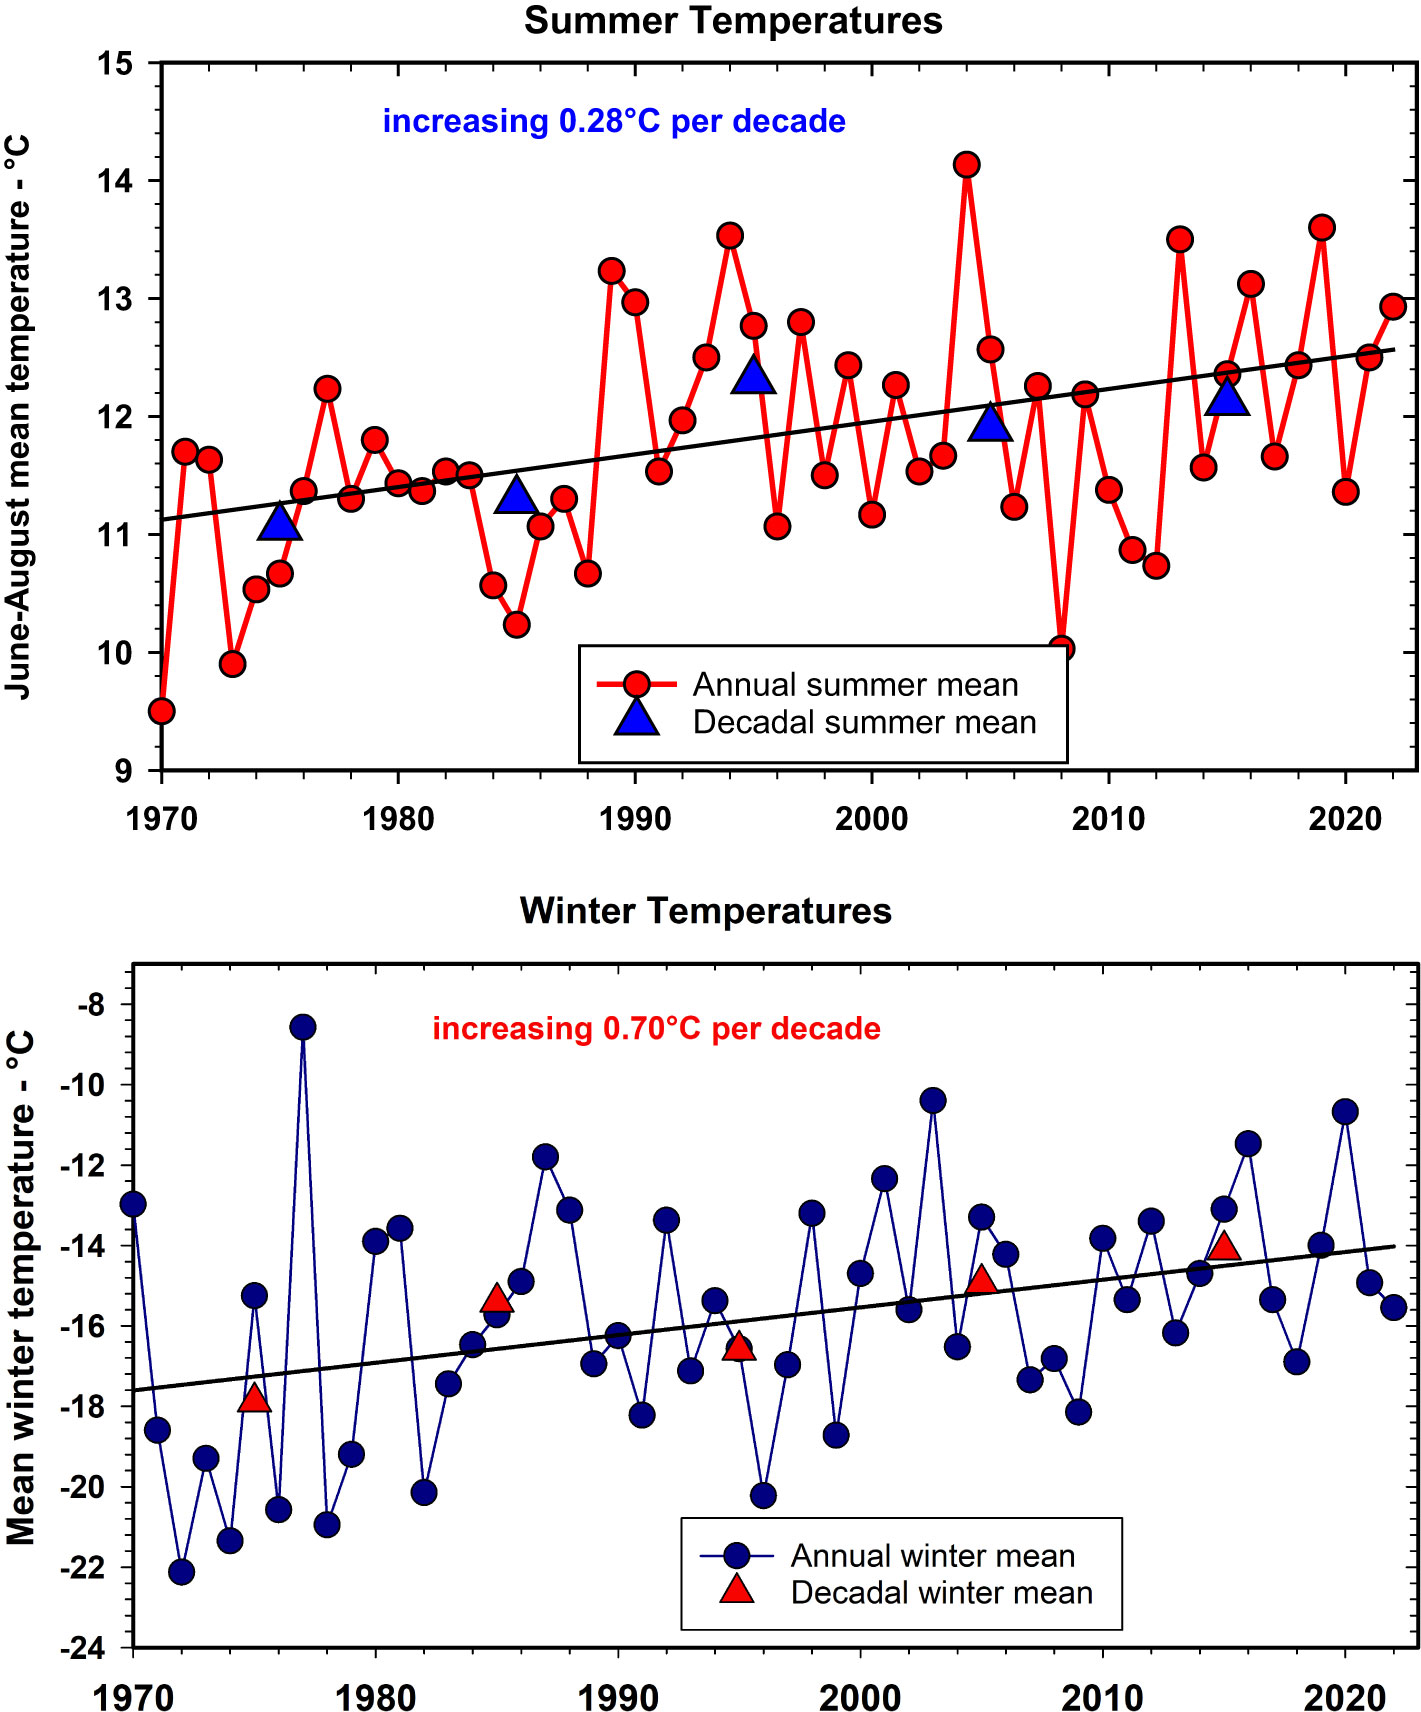
Figure 3 Summer (June to August, top panel) and winter (November to February, bottom panel) average temperatures measured at Environment Canada’s Haines Junction Weather Station for the period 1970 to 2022. Decadal averages as triangles. For summer annual temperatures r2 =0.17; for winter annual temperatures r2 =0.14, n = 52.
White spruce cone production
Figure 4 shows cone counts on spruce trees over the CEMP sampling sites since 1986 at Kluane and after 2005 at all the other 4 CEMP sites. White spruce trees produce a variable number of cones each year, and at irregular intervals very large crops are produced in mast years (LaMontagne et al., 2005; LaMontagne et al., 2020). Although some high cone crop years are general across the southern and central Yukon, the overall correlation among our study sites is moderate (Cronbach’s alpha = 0.84, cf. www.ncss.com). The 1986, 1993, 1998, 2005, 2010, 2014, 2019, and 2022 cone crops at Kluane were moderate or high. The mast year of 2022 was particularly strong and widespread, with high cone production at all 5 sites including the Watson Lake site that tended to have low crops in previous years. We found that mast years are highly correlated with summer temperatures in July of the previous two years. More broadly, previous-year drought is known to correlate strongly with white spruce masting across large geographical areas (Ascoli et al., 2019), and thus long-term inter-site synchronicity in masting events is expected from our monitoring program, possibly triggered by climate change impacts on summer temperature. Note that we recalculated the predictive regression (Krebs et al., 2017b) for white spruce cone counts in 2021 and found that the two best variables for predicting cone crops were July temperature one and two years prior to the actual cone crop. Surprisingly, no rainfall variable was a significant predictor. The 2021 regression we use to predict spruce cone counts one year ahead is given in Supplementary Materials.
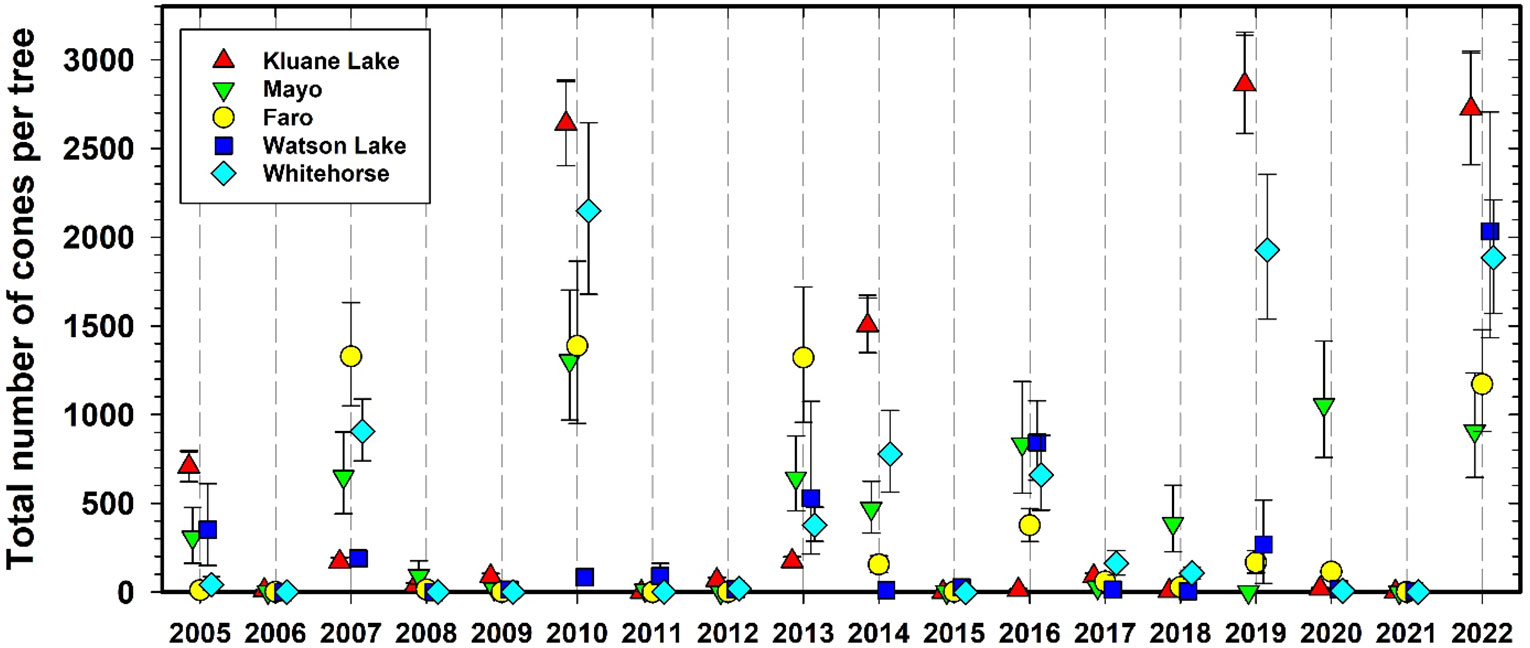
Figure 4 Average white spruce cone counts at Kluane for 1986 to 2022 and for all CEMP sites since 2005. Green cones are counted from the top 3 m of a tagged set of trees each August. These index counts are converted to total cones per tree by the LaMontagne conversion (LaMontagne et al., 2005). Mean cones per individual tree ± 95% confidence limits.
Large cone crops in white spruce are occurring progressively more frequently in the last 35 years in the Kluane area, and it is understood that changes in masting dynamics are known to be affected by climate change (Ascoli et al., 2019; Hacket-Pain and Bogdziewicz, 2021). Qualitatively, we note that large cone crops since 2006 have tended to occur at intervals of 2–4 years while those prior to 2006 at Kluane were 5–7 years apart (Figure 5). Red squirrels and seed-eating birds like white-winged crossbills (Loxia leucoptera) respond to high cone crops so it is likely that changes in the frequency of mast years have ecosystem-level consequences. This phenomenon also occurs in other terrestrial ecosystems where tree masting or other pulsed resources support a variety of species and top-down or bottom-up processes governing ecosystem function (Ostfeld and Keesing, 2000). Interestingly, we found that there are no detectable effects of high cone crops on the numbers of small rodents on our sites (Boonstra et al., 2001).
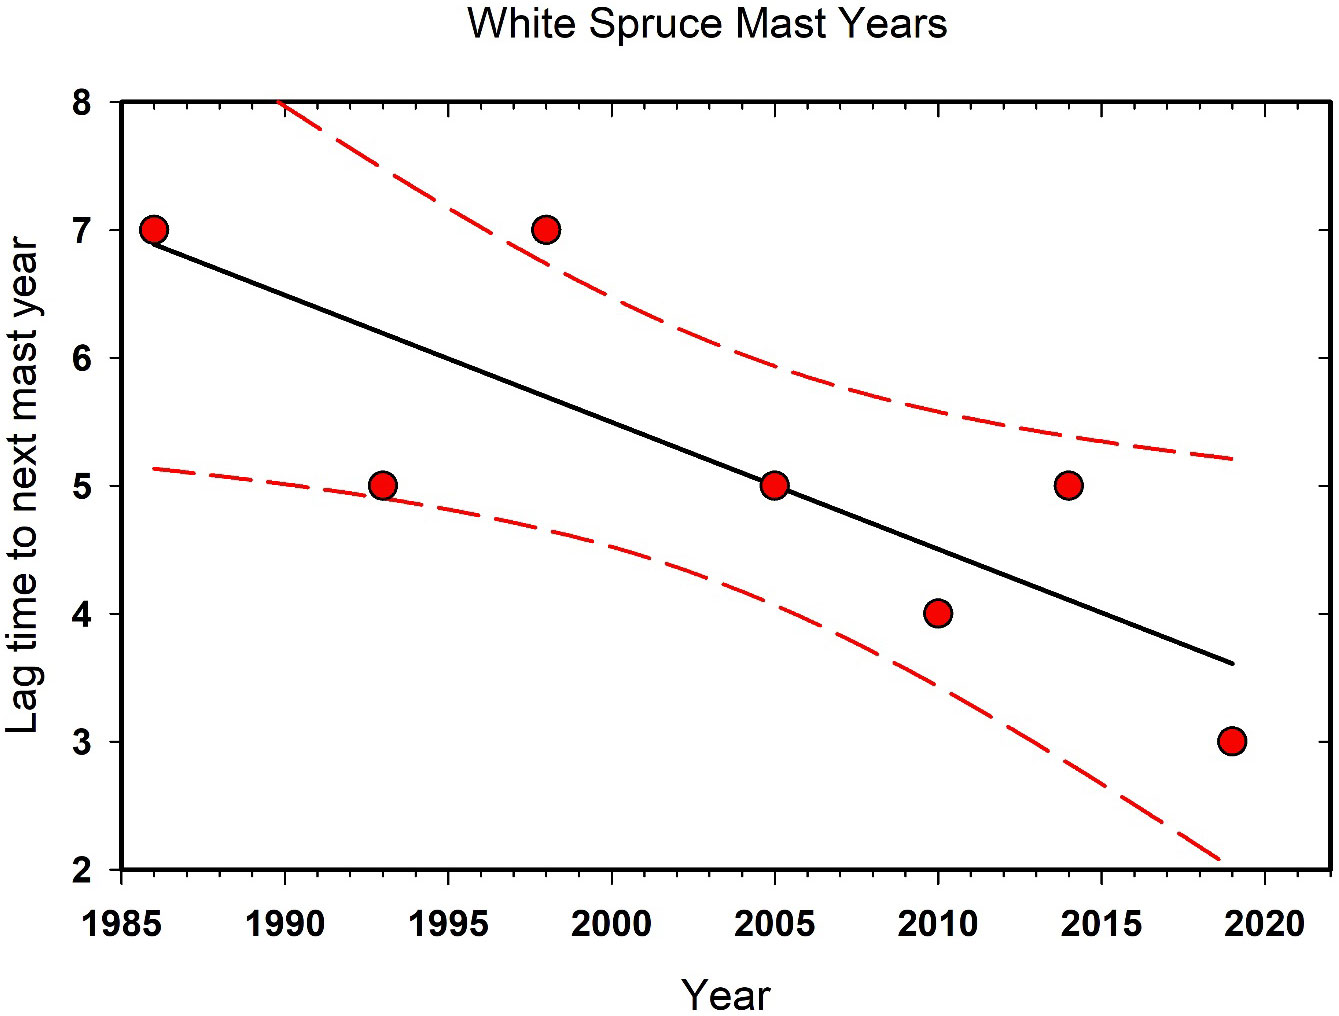
Figure 5 The interval in years between high white spruce (Picea glauca) cone counts at Kluane Lake since 1985. This trend is correlated with the warming climate in the southern Yukon. The linear regression and its 95% confidence limits are shown.
The spruce bark beetle (Dendroctonus rufipennis) outbreak of 1993 to 2003 killed about 14% of the white spruce > 10 cm DBH in the Kluane Lake study area (Krebs et al., 2014b), but this dieoff had only a thinning effect in our study areas. We consider that the outbreak was driven by climate change and the warmer and drier conditions that have prevailed across western North America (Fettig et al., 2022). Nevertheless, while a number of our sample of tagged and monitored trees died following beetle infection, we were unable to detect any impact of the beetle outbreak and subsequent forest clearing on any of our monitored species at Kluane, including no discernible change in red squirrel densities or their population carrying capacity (see below). However, through remote sensing surveys we have recently detected evidence of accelerated greening and forest regeneration in areas of recent tree mortality (O. Lucas, Trent University, unpubl. data), the extent and implications of this change have yet to be fully explored.
Ground berry production
Figure 6 shows the data we have accumulated on crowberry since 2005 (the two other berry species plots are shown in Supplementary Materials). All berry species show an irregular boom–bust cycle of annual berry production (Krebs et al., 2009). Crowberry counts show large site-to-site variation with some similarity in yearly trends over the 5 CEMP sites (average Pearson r = 0.59 among sites). Overall, species berry counts were relatively low from 2015 to 2020, compared with the previous 6 years which showed more regional variation with an occasional high year in only one species at a single site. Since berry sampling takes place at fixed plots each year, we are confident that these changes are not due to quadrat-to-quadrat variations within the 5 CEMP areas.
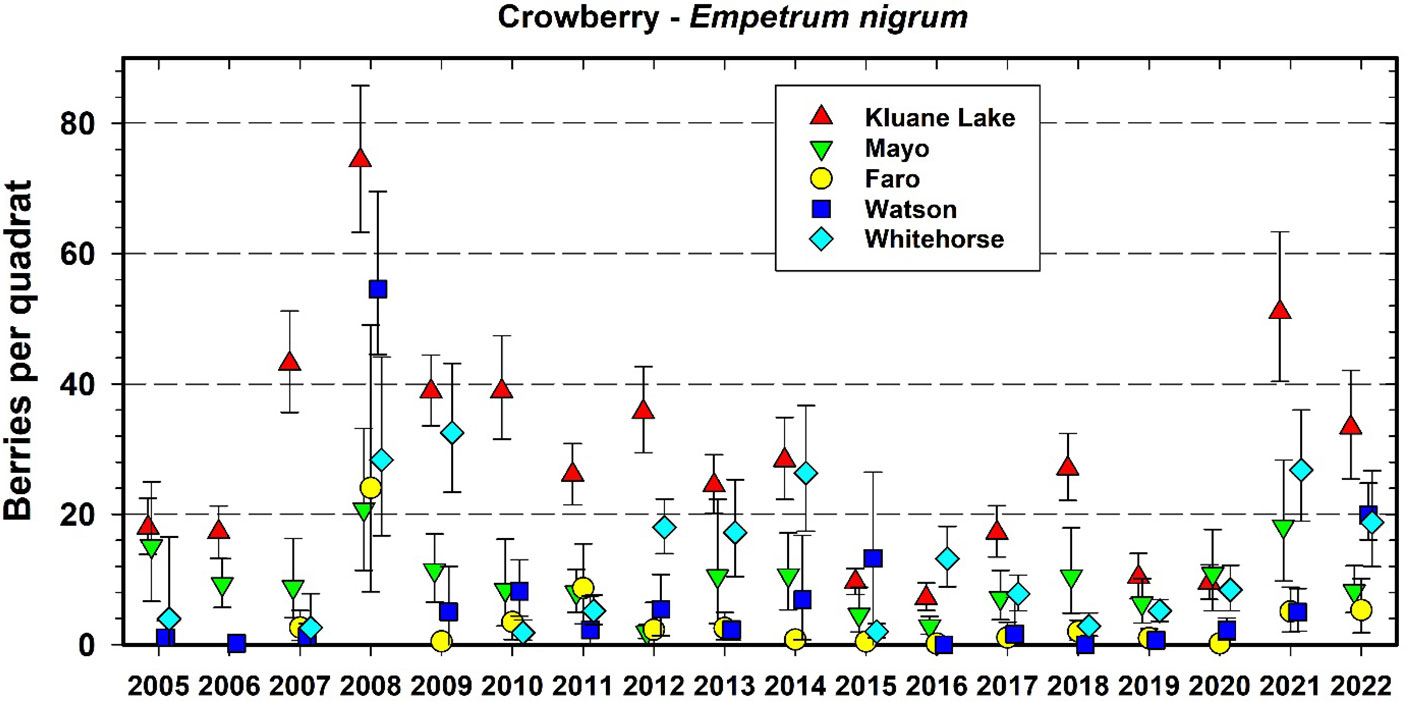
Figure 6 Average berry counts for one common species of ground berry (crowberry (Empetrum nigrum) at 5 CEMP sites from 2005 to 2022. Quadrat size is 40 by 40 cm (0.16 m2). Error bars are 95% confidence intervals. The same quadrats are counted each year.
We re-analyzed the climatic controls of ground berry production in the Kluane region from data gathered between 1994 to 2021, resulting in equations relating berry production to climate (see Supplementary Materials for details of the predictive equations). Each species of ground berry in the Kluane area responded to different signals of temperature and rainfall, and there was no general climate pattern to which all the species of ground berries responded. Our working hypothesis is that ground berry production responds primarily to temperature and rainfall of the previous year, but that individual berry species require a different suite of weather variables (monthly temperatures, monthly rainfall) from the previous year to produce a large berry crop. Since detailed weather variables differ among the 5 CEMP sites, there is no reason to expect all sites to be equally productive in any particular year. Weather conditions in the current year can alter berry production, but we do not think that the current year weather produces a very large impact on a given year’s production. Boonstra et al. (2017) showed that nitrogen levels in the soil also affect ground berry species differentially. An alternative and important view is that pollinator abundance has a strong influence on berry crops in correlation with weather, but at present we have no regional data on pollinator abundance from the southern Yukon. Another alternative view is that small mammals feeding on berry flowers in spring reduce potential berry crops, which would lead to the prediction of high berry crops in low small mammal years. However, at Kluane there was no correlation between red-backed vole numbers and productivity of any of the 6 berry crops, so despite some evidence that small mammals at Kluane Lake are limited by food and that berry production may influence their population dynamics (Krebs et al., 2010), we doubt that small rodent feeding is the main agent affecting variation in our counts. Alternatively, other insects could produce galls on flower buds and reduce berry crops. The question of whether the long-term trend (6 years, 2015 to 2020) toward lower berry numbers has finished and whether the recovery in counts in 2021 and 2022 will continue, is important. Note that since we correct all berry counts to a standard 50% plant cover, this trend is not because of individual plants dying back in our sampling quadrats. In any one year < 2% of the permanent quadrats must be moved because of berry plant deaths, so we have high confidence in our berry production monitoring protocol.
Soapberries (S. canadensis) are a preferred food of grizzly bears (Ursus arctos) during July and August, and are being counted at study sites where they are most common (Kluane, Mayo, and Whitehorse). Mayo did not have a high count of soapberries from 2010 to 2020. But in summer 2021 and 2022, soapberries were very abundant at Kluane, Whitehorse and Mayo (Figure 7). Soapberries fix nitrogen so they are not constrained by soil nitrogen levels (Boonstra et al., 2017) and their year-to-year changes in berry production are driven by summer temperatures.
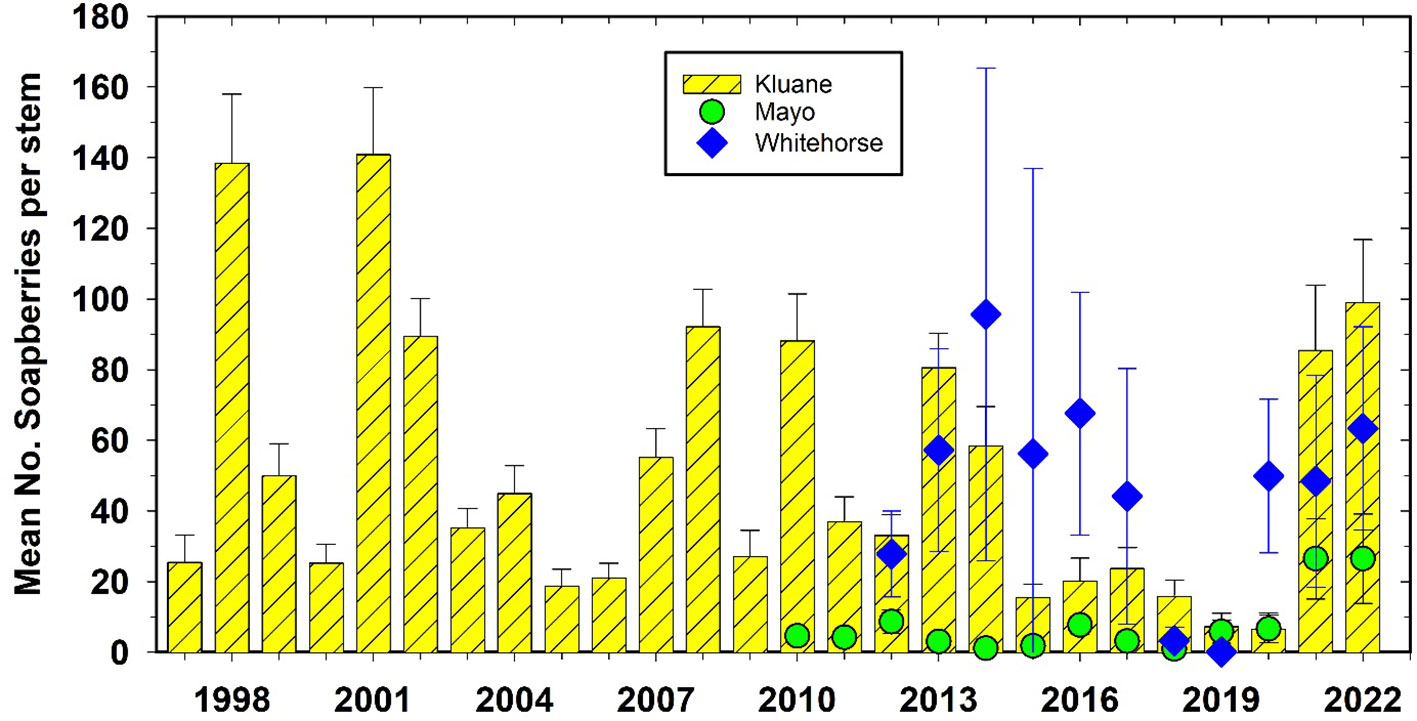
Figure 7 Soapberry (Shepherdia canadensis) counts at Kluane, Mayo, and Whitehorse, 1997 to 2022. Counts are the number of berries on an individual stem of average 10 mm diameter. There is no significant correlation among these 3 sites. Soapberries are rare at Watson Lake and Faro.
We measure rainfall at official weather stations of Environment Canada, which is crude because rainfall is spatially variable in our mountainous region. We know that rainfall and temperature from previous years predict future berry crops with reasonable confidence, at least in the Kluane region (Krebs et al., 2009), but the extent to which these factors explain inter-site variability in berry production is not clear. However, our real interest is in soil moisture and how it may affect berry production, so a future plan would be to add soil moisture probes to select berry plots and use local moisture profiles as a covariate in predictive models of berry production.
Small rodent numbers
Figure 8 shows the changes in red-backed vole numbers for the period 2004 to 2021. Vole numbers were relatively high in 2022 at all CEMP areas except Mayo, which had low numbers. Red-backed voles at Kluane have fluctuated in 3–4-year cycles for at least the past 50 years (Krebs et al., 2010), and in the last 25 years this pattern continues. Figure 8 illustrates peak years of 2005, 2009, 2013, 2017 and again in 2020 and 2021. Perhaps surprisingly, the other 4 CEMP areas do not have sufficient data to suggest clear 3–4-year population cycles. Although vole cycles are common in Fennoscandian boreal forests (Hanski and Henttonen, 2002; Lambin et al., 2006), we previously noted (Boonstra and Krebs, 2012) that a minority of studied red-backed vole populations in North America exhibit population cyclicity, and we speculated that differences in density-dependent food regulation and overwinter mortality are primarily responsible for these differences. Although we have not specifically investigated the role of overwinter food limitation on red-backed vole populations at our other sites, the pattern to date does not suggest universal population cycles in this species or any close synchrony in fluctuations in the 5 CEMP sites in the southern and central Yukon.
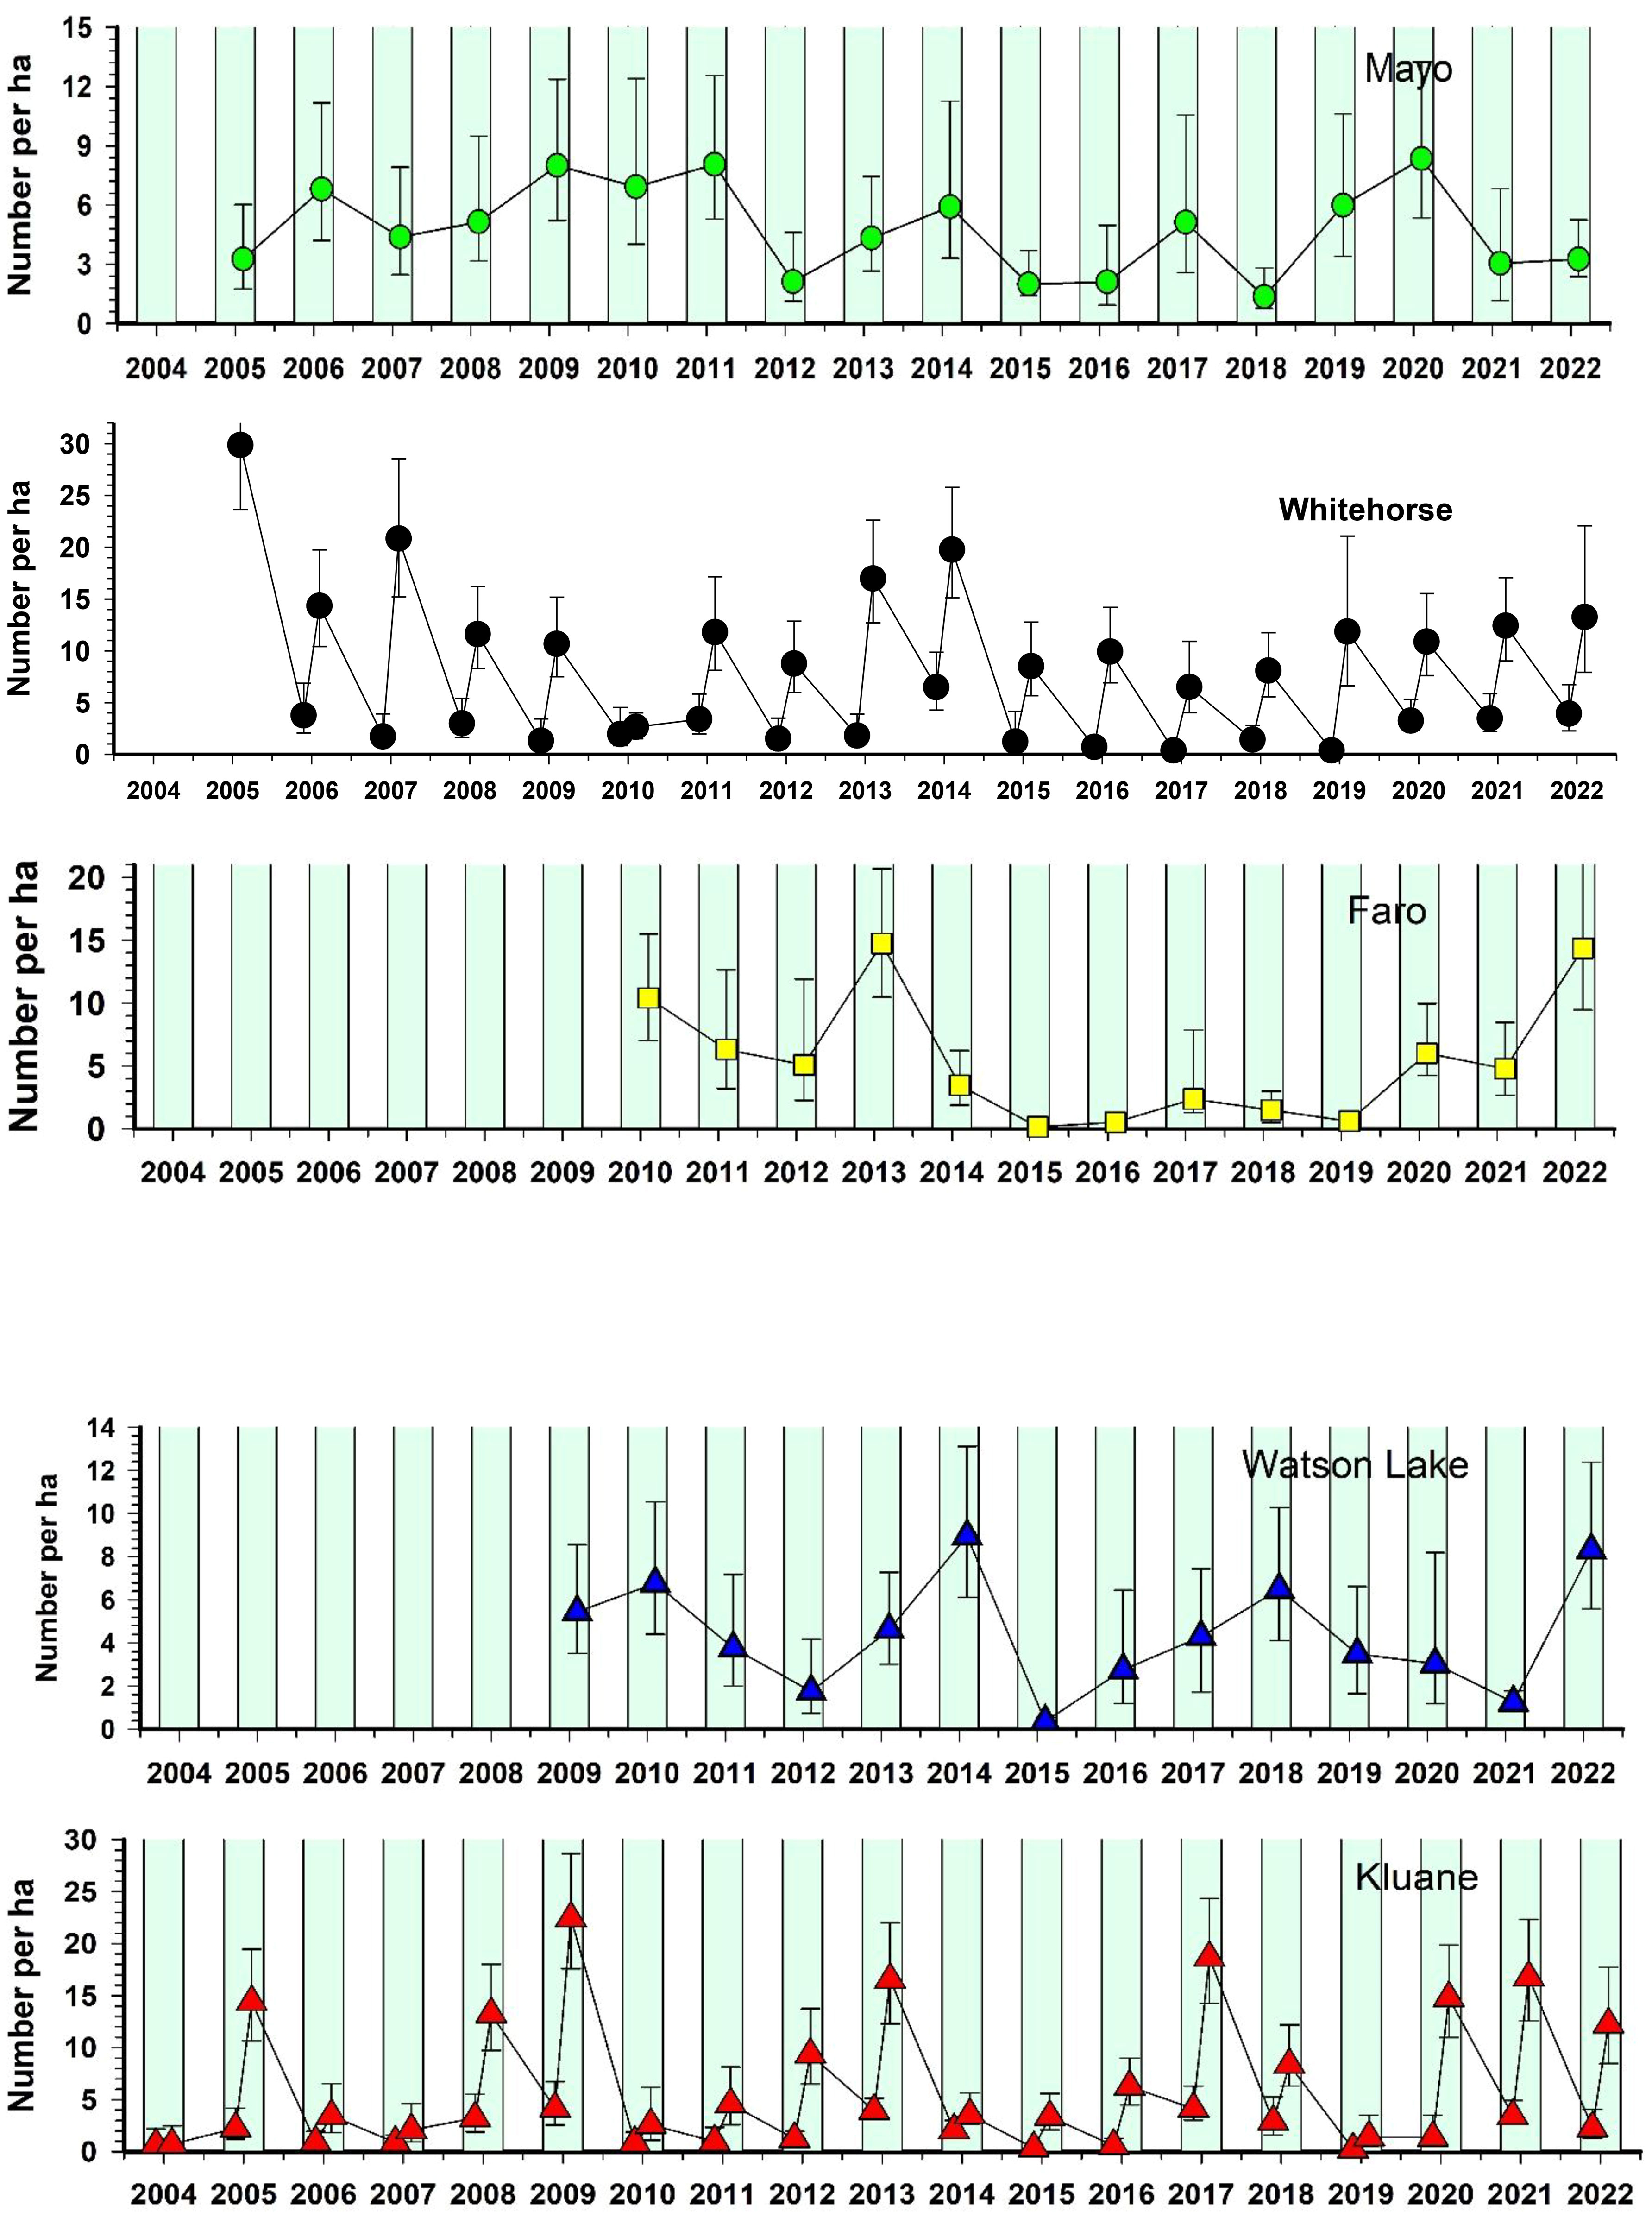
Figure 8 Population estimates for red-backed voles (Clethrionomys rutilus) in five CEMP areas, 2004–2022. Trapping grids have an effective trapping area of about 3 ha. Summer months are shaded green. Spring and late summer estimates are available only for Whitehorse and Kluane. Other areas have late summer estimates only.
The only other small mammal that is common to many of the CEMP sites is the deer mouse. At present the number of captures of this rodent species are too low on most of the sites to discuss common patterns of population change. The Mayo site has a nearly 3-year cycle in deer mouse density, but we need a longer time series to confirm that these dynamics are truly cyclic and not irruptive. The long-term density estimates for deer mice at Kluane from 1973 to 2022 is given in the Supplementary Materials. Deer mice remained between 1–10 per ha on all sites from 2005 to 2019 and then increased to high density in 2021 at Whitehorse (~10 mice/ha) and Kluane in 2022 (Figure 9). It is unlikely that the hantavirus carried by Peromyscus in the USA and southern Canada (Knust and Rollin, 2013) will be able to take hold in the Yukon because deer mice cannot transmit the virus at the low density populations we have recorded historically (Carver et al., 2015). Thus, despite that there is speculation that climate change may benefit hantavirus prevalence and spread in some small mammal populations (Dearing and Dizney, 2010), this seems unlikely for the northern boreal region unless there is a corresponding change in small mammal abundance. Notably, we detected no correlation between deer mouse and red-backed vole densities at any of our sites, which contrasts to some other regions of the boreal forest where several small mammal species are known to cycle synchronously (Korpimäki et al., 2005).
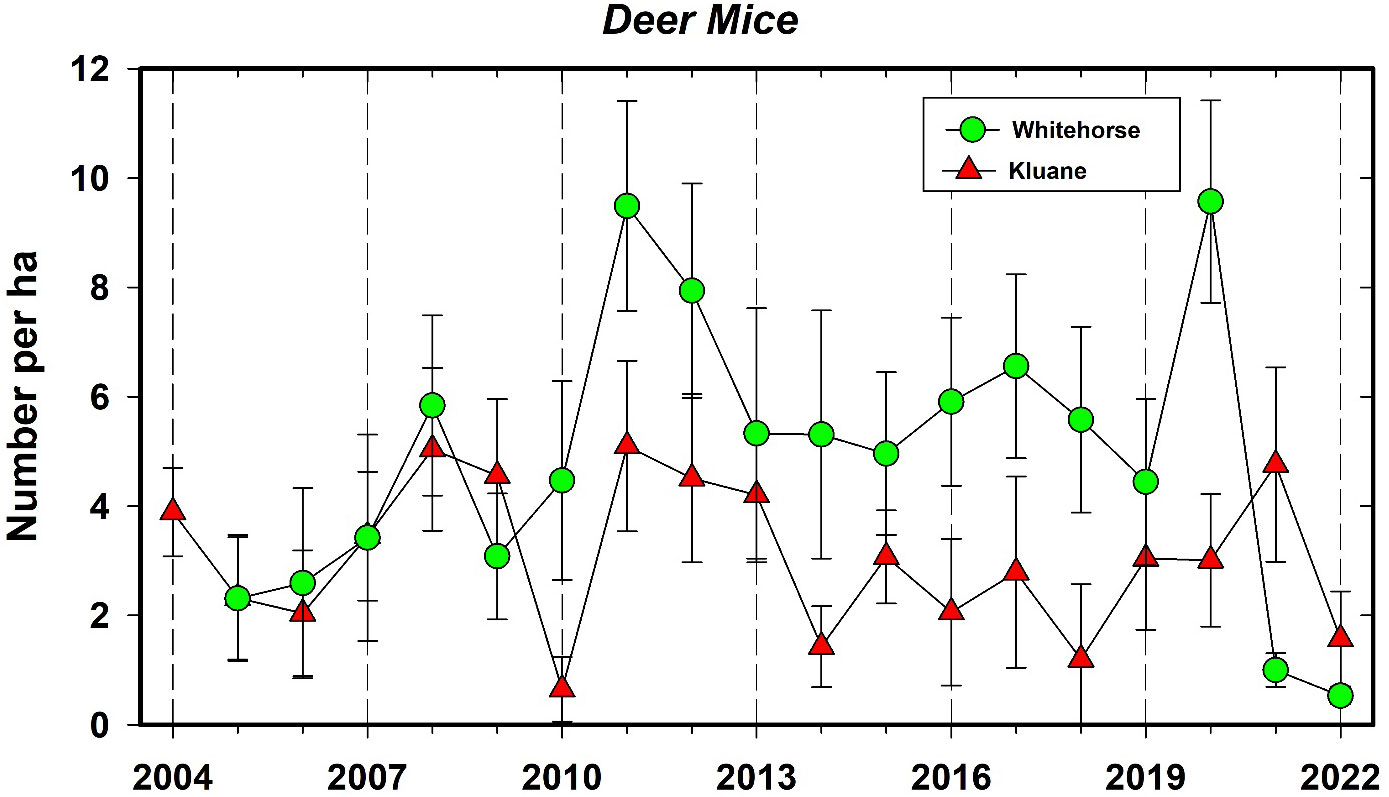
Figure 9 Population changes in the deermouse (Peromyscus maniculatus) at Kluane Lake, and Whitehorse in autumn, 2004–2022. Density rarely exceeds 10 per ha and fluctuations are irregular. The correlation between these time series is 0.24.
Three species of Microtus occur in our study area. They are most common in grasslands or open forest areas with a grassy understory, and none of our monitoring sites are situated in these uncommon habitats in this part of the boreal forest. However, our more casual observations show high Microtus numbers in some years near Kluane Lake (Krebs et al., 2019).
We can use the above density estimates to conduct back-of-the-envelope calculations of small mammal availability for boreal predators. Since most of these mice and voles weigh approximately 25 g, a density of 5/ha would provide an individual predator with only 125 g of potential food per day, assuming the predator could catch and eat all rodents in 1 ha of habitat. In this simple model a hypothetical coyote would consume all the small rodents in 1.5 km2 per month if it was able to eat 625 g per day. Simple calculations of this type suggest that small predators such as hawk owls (Surnia ulula) or ermine (Mustela erminea) may survive on available small mammals (but only marginally) whereas medium to large sized predators in the boreal forest cannot make a living on small rodents, which necessarily comprise an incidental part of their diets. For example, O’Donoghue et al. (1998) found that the biomass of small mammals in the winter diet of lynx and coyotes at our Kluane Lake site was always <10% of total biomass, irrespective of the phase of the snowshoe hare cycle and the availability of other prey. Therefore, we surmise that small mammals play a relatively minor role in the ecosystem dynamics of the larger mammal species at our Yukon sites.
Snowshoe hare numbers
The snowshoe hare is a keystone species in much of the boreal forest because it is the main prey of so many predators (O’Donoghue et al., 1997), and their population declines cause predators to switch to alternate prey such as red squirrels and grouse (Boutin et al., 1986). Snowshoe hare abundance fluctuates in 9–10-year cycles throughout the boreal zone and are in synchrony across the 5 CEMP areas of central and southern Yukon (Krebs et al., 2013).
Figure 10 shows the changes in hare numbers at the CEMP sites, with two main points standing out. First, Watson Lake sites had almost no snowshoe hares in any of the early years for which we have data. However, Don Reid (Wildlife Conservation Society Canada, pers. comm.) has shown that the hare cycle at Watson Lake occurs in phase only in old forest burns and is absent in undisturbed forest sites in this area, which we sampled prior to 2013. There is clear natural history information for Watson Lake that the hare cycle exists but may be slightly out of phase with Kluane. Both Watson Lake and Faro sites appeared to enter the increase phase of the next hare cycle by 2022 while Kluane, Whitehorse and Mayo sites are starting to increase in 2022. This pattern augers for 2023 to initiate a strong increase phase for all CEMP sites. Since the most promising explanation for regional synchrony in hare cycles involves predator movements that follow local declines in hare density, particularly for Canada lynx and great-horned owls, depending on the spatial orientation of the highs, such movements could produce a travelling wave of density changes (Krebs et al., 2013). It is important to highlight that travelling waves in cyclic animal populations, driven by migratory patterns in a variety of factors (weather, dispersal by herbivores or predators), is a longstanding concept in ecology that is supported by theory and models (Sherratt, 2001; Sherratt and Smith, 2008) as well as broad empirical observations across a variety of systems and ecoregions (Peltonen et al., 2002; Korpimäki et al., 2005). We highlight that such patterns can only be documented through research that spans conventional space and time limitations and therefore rigorous assessment of traveling waves can be a logical product of well-designed long-term biodiversity monitoring programs.
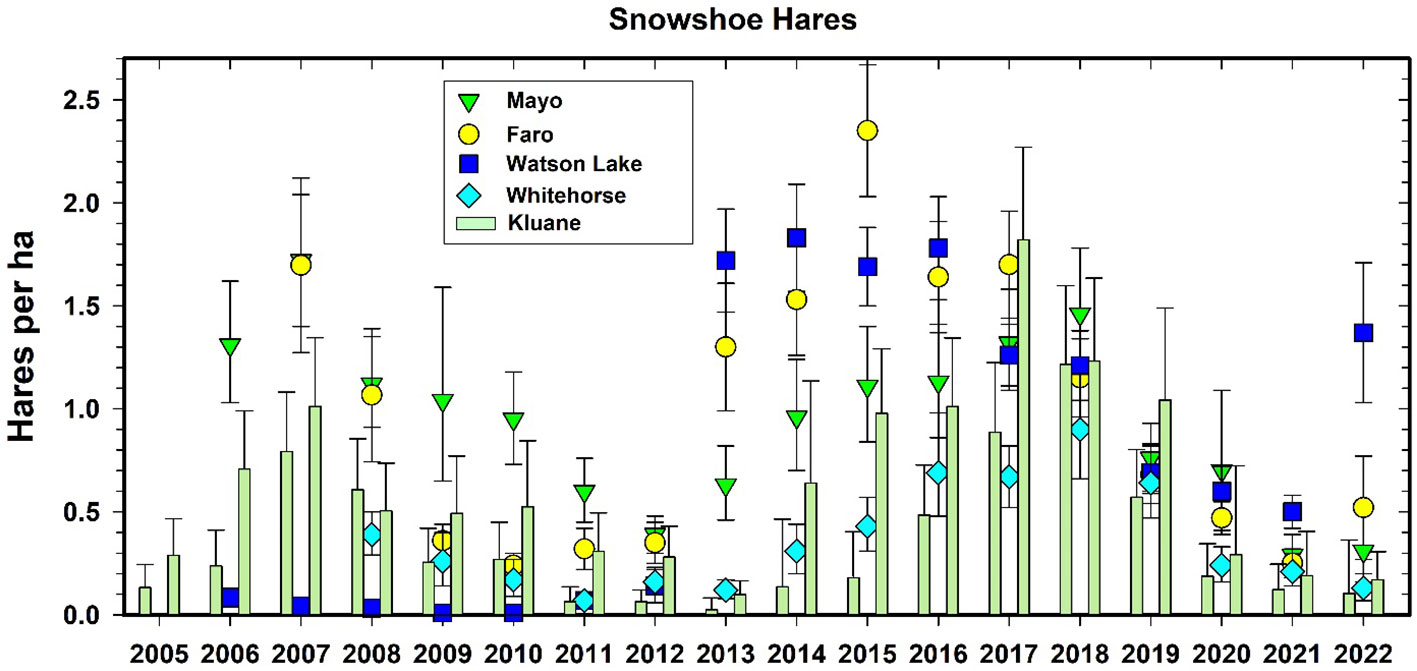
Figure 10 Population density estimates for snowshoe hares (Lepus americanus) in CEMP areas, 2005–2022. Mark-recapture data from Kluane are given as a bar graph for spring and fall of each year. Estimates from fecal pellet counts at the other 4 CEMP sites are given as points (95% confidence limits).
Canada lynx abundance
Canada lynx are known as important predators in the boreal forest, relying largely on snowshoe hares as prey and having population cycles that closely track those of hares (Elton and Nicholson, 1942). Figure 11 shows the changes in abundance of lynx in Mayo and Kluane as estimated by the snow track index (O’Donoghue et al., 2022). Because our winter snow tracking cannot be done in identical habitats in all areas, and given the expected high uncertainty and variability in winter track counts across space and time, we do not expect the absolute number of tracks to directly indicate lynx density, but rather trends in density. Two important points are highlighted in Figure 11. First, the penutimate lynx peak at Kluane (2006–07) was the lowest we have seen to date, coincidental with the lowest snowshoe hare peak at Kluane (Oli et al., 2020). However, there is no clear evidence from Figure 11 that the amplitude of the lynx cycle is changing. Second, lynx at the Mayo site appear to be out of phase with lynx at Kluane by a delay of 1 year. In winter 2020–21, lynx were at a low at Mayo and were still declining in the Kluane area, whereas hares throughout the southern Yukon had reached low numbers by September 2021. It is unlikely that lynx could survive by eating only hares in this current low phase, and therefore their use of alternate prey such as red squirrels is essential for lynx persistence on site (O’Donoghue et al., 1998). It is notable that lynx peak numbers from the most recent cycle did not reach the high levels they were at in 1998–99 (Figure 11), but we have no clear indication that the 9–10-year cycle in hares and lynx is attenuating (Krebs et al., 2014a).
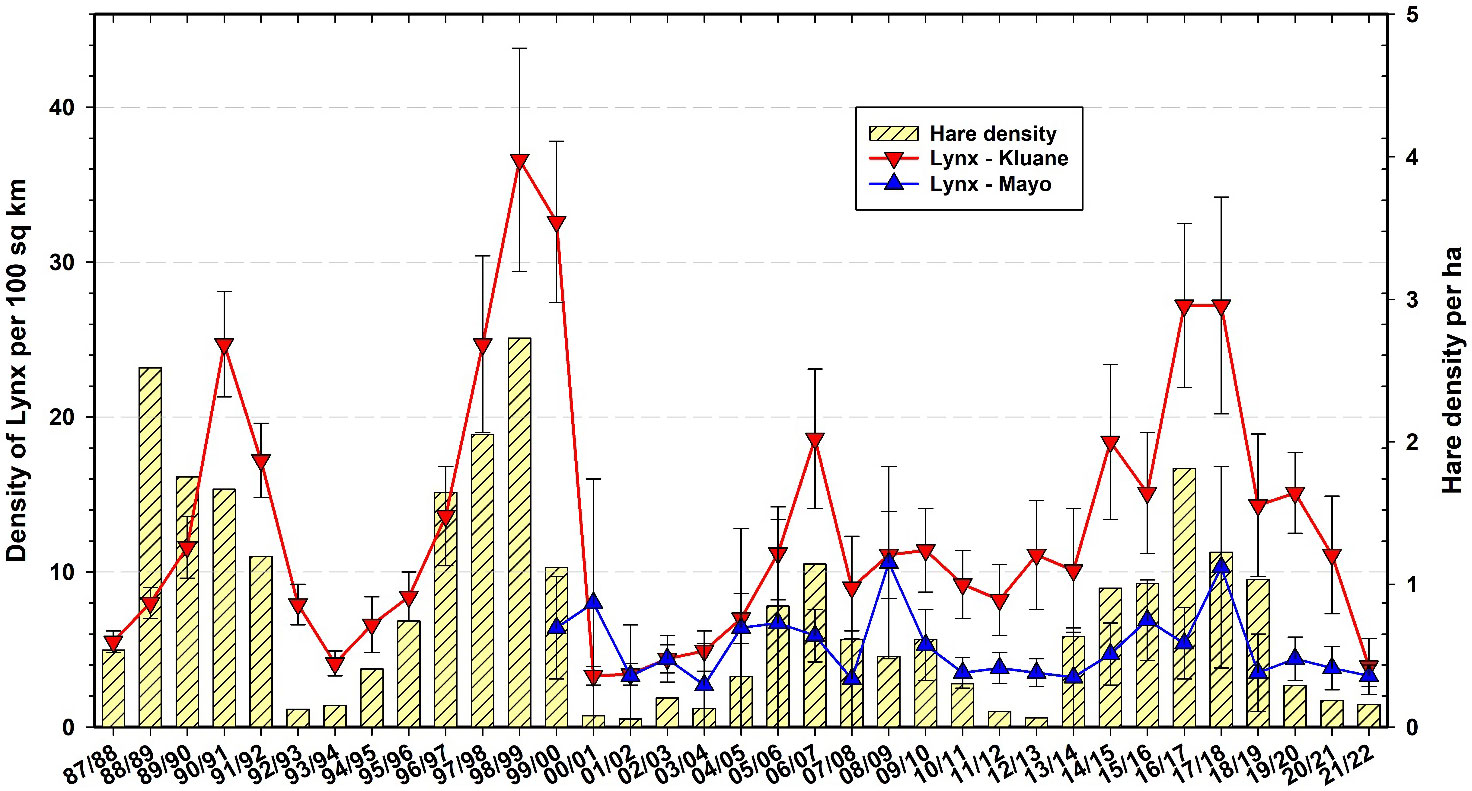
Figure 11 Snow tracking density estimates for Canada lynx (Lynx canadensis) at Kluane and Mayo, 1987–2022 with 95% confidence limits. Hare data are from control grid live trapping at Kluane in the autumn preceding the winter predator data.
To some extent, our current position about sustained hare–lynx population cyclicity in the Yukon region is contrary to earlier expectations that population cycles across a broad range of taxa and regions were attenuating due to climate change and other human impacts (Ims et al., 2008; Cornulier et al., 2013). Notably, in recent years some disappearing cycles in a variety of taxa have returned, and the hypothesis of broad cyclic attenuation involving climate change may be, to some extent, in the process of being attenuated itself (e.g., Brommer et al., 2010; Büntgen et al., 2020). In fact, based on our 45+ year study of hares at Kluane Lake, which spans 5 full population cycles (Figure 11), some members of our own team thought that the small population peak @2007 indicated a collapsing hare cycle on our site. However, given that the 2017 hare peak was roughly 30% higher than the previous one and that other cyclic properties (rate of population increase, cycle period, duration of the low) were comparable to previous cycles, we have revised this perspective and no longer anticipate cyclic attenuation of hare and lynx populations in the region. Regardless, the drivers of variability in population cycles remain poorly understood and long-term monitoring, combined with targeted investigations into potential mechanisms underlying inter-year and inter-cycle changes, continue to be needed (Krebs et al., 2017a; Myers, 2018).
We do not have any predator snow tracking data from the Faro, Whitehorse, or Watson Lake sites because of a lack of personnel to conduct these time-sensitive and demanding surveys. Limited snow conditions for tracking in some winters is becoming a problem, so we began in autumn 2015 to install a set of trail cameras in the Kluane area to take photos year-round of animals moving along game trails and paths. We are optimistic that this approach can fully replace snow tracking in winter to obtain a reliable index of predator abundance. To achieve this goal, we need at least 9 years of overlapping data from lynx snow track counts and lynx camera trap counts spanning the four phases of the cycle. Our preliminary results are very promising (Kenney and Krebs, 2020), and our plan is to wind down snow track counts in the coming years.
Brief Notes on other monitoring measurements
Above-ground mushroom biomass has been estimated at Kluane Lake since 1993 and at other CEMP sites since 2003. Mushroom relative abundance varies irregularly both within and among sites in the CEMP region. Since rainfall in the southern Yukon varies significantly on a local and regional scale (Krebs et al., 2018b), mushroom availability as a food source for small mammals and other consumers is highly variable. Based on our observations at Kluane Lake, mushrooms are eaten by moose (Alces alces), snowshoe hares, red squirrels as well as rodents.
Arctic ground squirrels (Urocitellus parryii) were very common in the Kluane region forests from 1973 to 2000, but then collapsed to zero in spruce forest habitats. Ground squirrels remain at very low numbers in the forested areas around Kluane and are mainly associated with human development and disturbed areas like airstrips. We have caught no ground squirrels in recent years in any of our live trapping grids in the Kluane forests where they used to be abundant until 2000 (Figure 12). Werner et al. (2015, 2016) suggested that the predator pit hypothesis is a likely explanation for the initial ground squirrel collapse and was assisted by an increase in shrub growth throughout the boreal forest, which reduced visibility of approaching predators like coyotes, thus increasing ground squirrel predation risk and locking them into a predator pit. Notably, we suspect that the pattern of boreal forest shrubification in the Yukon region may be a direct consequence of climate change, as seems to be the case in more well-studied systems such as the Arctic tundra (Zhang et al., 2013; Mekonnen et al., 2021; Macander et al., 2022).
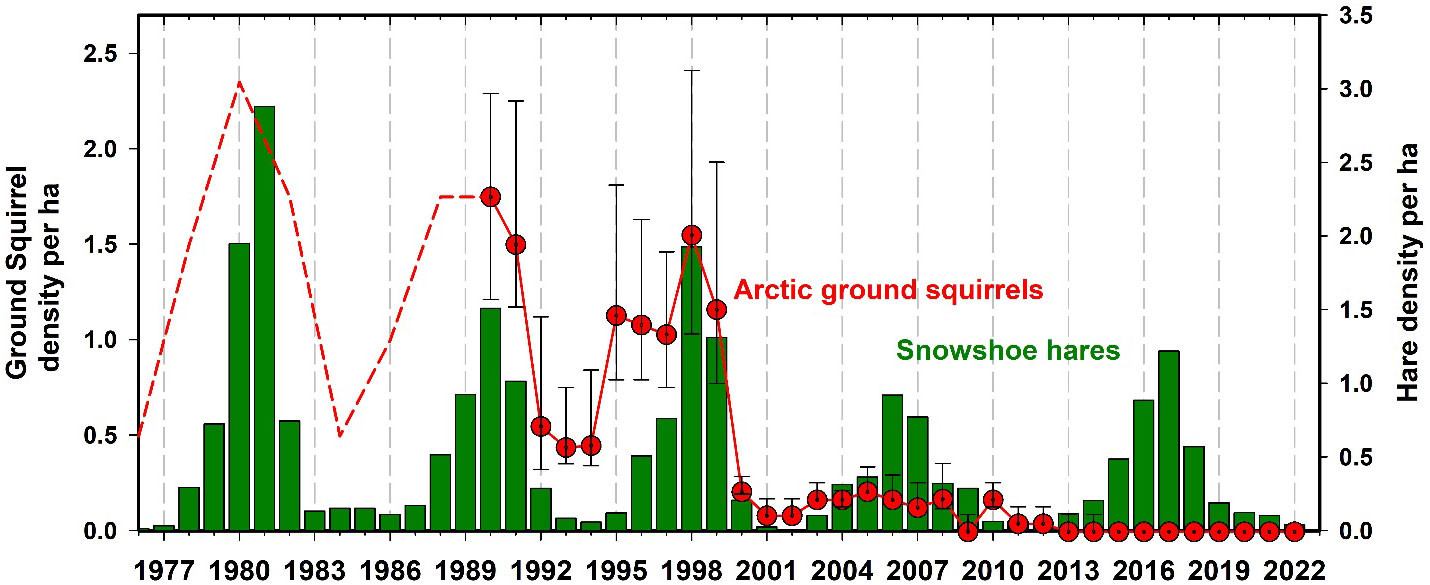
Figure 12 Arctic ground squirrel (Urocytellus parrii) density estimated by road counts 1976 to 1989 (dashed line) and live trapping from 1989 to 2022 (95% CL) in Kluane spruce forest sites. Ground squirrels are strongly affected by predation coming off the snowshoe hare cycle and they fell into a predator pit after 2000 in the Kluane boreal forest and have never recovered. They exist now as human commensals around houses and as wild populations only above in open habitats and above treeline.
Red squirrel numbers have been studied extensively at Kluane for almost 40 years by Stan Boutin’s Kluane Red Squirrel Project (https://redsquirrel.biology.ualberta.ca/). In general, red squirrel numbers have been relatively stationary (annual CV = 35%) in the boreal forest around Kluane at 2.25 per ha, but they increased rapidly after high white spruce cone crops in recent years (Figure 13). From 1993 to 2012, we estimate that the spruce bark beetle outbreak at Kluane was responsible for killing 25% of the live spruce trees in the region. Surprisingly, this die-off did not impact either the overall density of red squirrels or the frequency or magnitude of spruce cone crops in the Kluane region (see above). Red squirrel population changes are affected by both changes in cone supplies and predation rates. A synthesis of red squirrel dynamics will be presented in later publications, but it remains possible that the increased frequency of white spruce masting events has offset to some degree the deleterious effects of spruce tree mortality.
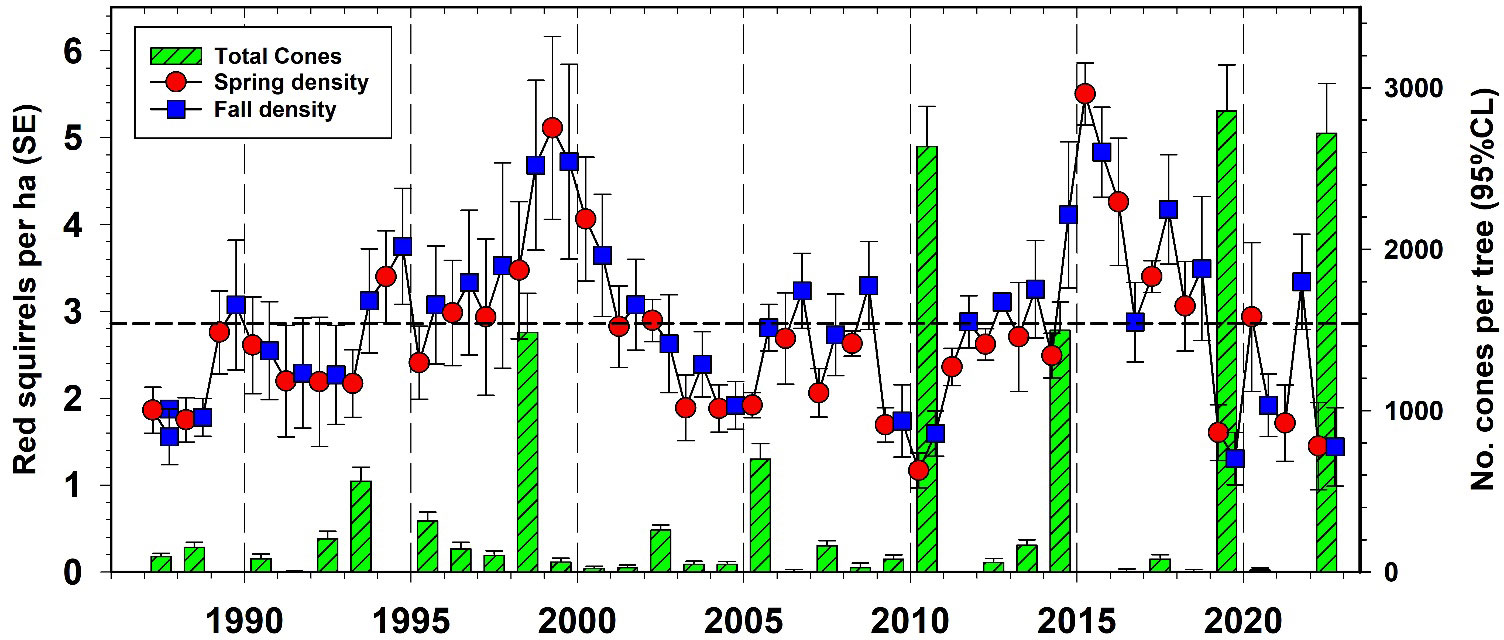
Figure 13 Red squirrel (Tamiasciurus hudsonicus) density changes on all control study areas at Kluane in relation to white spruce cone crops, 1987–2022. Dashed line is the long-term average red squirrel density for Kluane.
Snow track transect data show trends in several predator species besides Canada lynx, with lynx following the hare cycle closely as shown in Figure 10. First, we highlight that the patterns we report here (and related uncertainties) reflect the aforementioned challenges in collecting predator snow track data and our inability to translate snow track counts to density estimates, for most species. Nevertheless, it appears that marten (Martes americana) and weasels (Mustela erminea) became much more abundant after 2000 at Kluane but have inexplicably declined in the last 5 years to zero in winter 2020–21. In winter 2015–16 and winter 2016–17, coyote, marten, and weasel numbers at Kluane fell dramatically below 2014–15 levels (Figure 14), which might be a result of intraguild predation (large predators killing smaller predators). Marten numbers should also change with vole and possibly red squirrel numbers, but we have not done a formal analysis of changes in marten numbers. Snow tracking from 1999 to 2022 suggests that lynx are more abundant at Kluane and marten numbers are higher in Mayo, but these patterns may reflect different habitat characteristics along the two different snow tracking transects, as well as animal abundances. Weasel numbers are comparable between the two areas (measured by snow tracking).
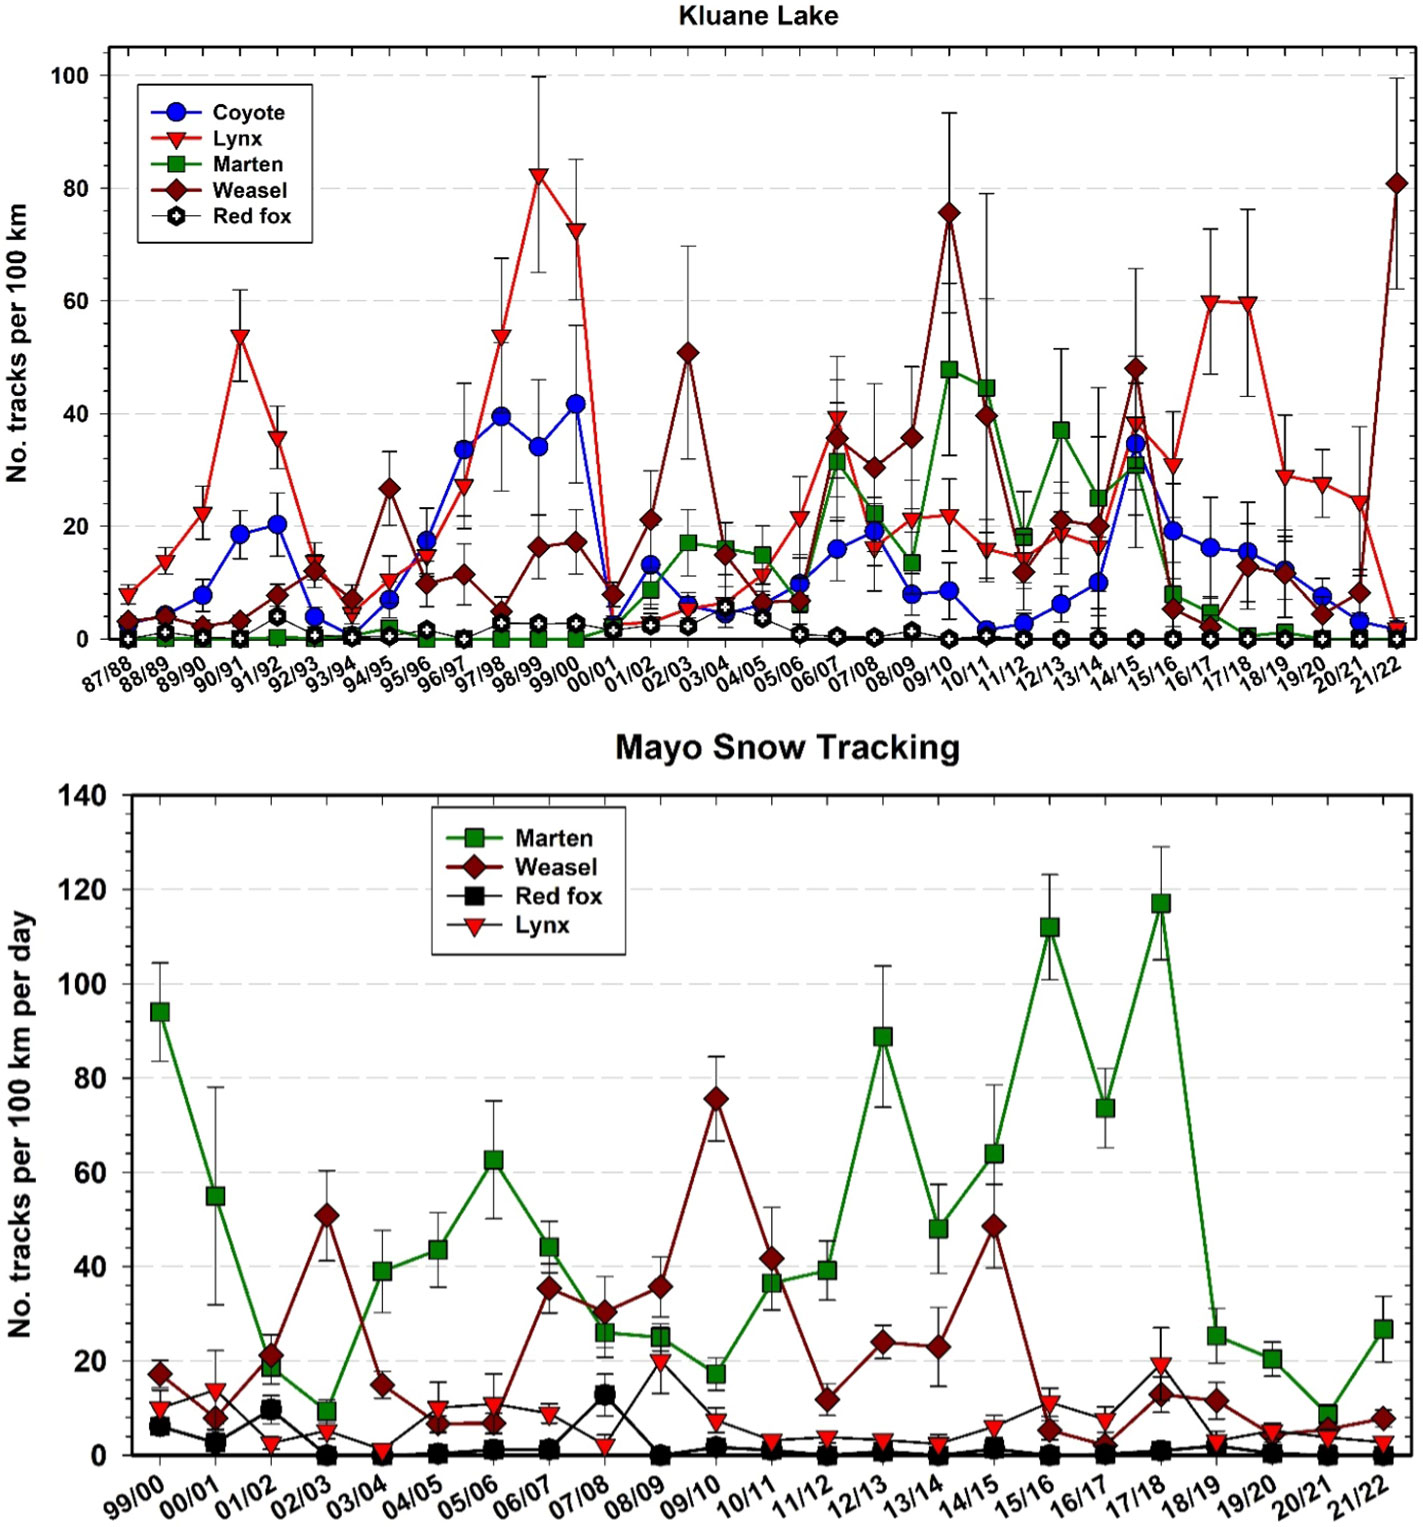
Figure 14 Snow tracking abundance estimates (top panel) for coyote (Canis latrans), Canada lynx (Lynx canadensis), marten (Martes americana), weasel (Mustela erminea), and red fox (Vulpes vulpes) at Kluane, 1987–2022 and (bottom panel) for Mayo, 1999–2022. Track counts are affected by activity as well as by density, so must be considered an index of abundance.
The observed patterns in coyote abundance are perplexing. There are few coyotes at our more northerly site in Mayo, but coyotes have been slowly moving north in the Yukon during the past century, hampered by snow which impedes their winter travel and hunting (Murray and Boutin, 1991). Coyotes were first seen in the Kluane area by First Nations in the 1930s, and in recent decades their track numbers appeared to be cyclic, corresponding to hare population fluctuations albeit with lower amplitude than for lynx track counts (Figure 14). However, since @2015, coyote track numbers have been steadily declining at Kluane, including during the last hare population peak. In contrast, 20–30 years ago we thought that coyotes would overtake lynx as the main hare predator in the ecosystem. Eventually, we still expect coyotes to benefit from anticipated changes in snow conditions associated with climate change (Peers et al., 2020), and recent trends in track numbers may simply reflect abnormally deep snowfall in recent years at Kluane.
Bird surveys in Yukon are not being done on the CEMP sites at the present time, and we acknowledge that this has been a major weakness. We have good data on grouse and ptarmigan numbers at Kluane from 1987 to 1996 (Martin et al., 2001), and only recently began deploying acoustic recorders in the Kluane area to track owls and songbird populations. Mayo has carried out BC Owl Surveys since 2003, Breeding Bird Surveys since 2004, and Nighthawk Surveys since 2016. Other bird surveys have now been put in place to obtain a better picture of regional trends for the southern Yukon. The availability of acoustic recorders will allow a large scale gathering of data on bird abundance from song surveys, to track both occurrence of year-round resident birds as well as phenology and prevalence of neotropical migrants. However, it is notable that there is a major need to implement a large-scale monitoring program for avian predators in the Yukon to determine their population trends.
One major part of the food web shown in Figure 2 that is missing in our studies is shrub growth. We do not have good measures of the increasing shrub growth that is accompanying climatic warming (see above), but evidence is emerging that such patterns are occurring more broadly across both Arctic and boreal regions. Shrub dynamics are especially relevant because they affect winter food supply of snowshoe hares and moose and structural complexity which provides cover for hares. This area of investigation is a priority for the future, and we are currently exploring use of remote sensing to track the distribution, abundance, structure, and species composition of shrubs at Kluane.
One of our goals in this monitoring program is to develop statistical methods for estimating the abundance and productivity of our indicators of ecosystem function for the Yukon boreal forest. We expect the key indicators to change as the climate varies, and we need to be able to predict how climatic variables may affect our indicators. There are three ways to determine the impact of climate change – to observe what happens, to monitor changes and try to explain them ecologically, and to develop and use models which include climatic variables to predict what will happen. We have used linear models for the most part in our analyses while realizing that climate effects may well be non-linear. We justify this by taking the most parsimonious statistical approach, realizing that many more years of data are required to test non-linear effects. Long-term data sets are essential in all these endeavours, and we learn as we go along from year to year. Figure 15 shows in simplified style how our monitored species have changed in average abundance over the last 25 to 40 years, with the most dramatic changes being evident among marten, weasel, ground squirrels and voles. Notably, in this context we also report moderate declines in lynx, coyotes and hares (Figure 15).
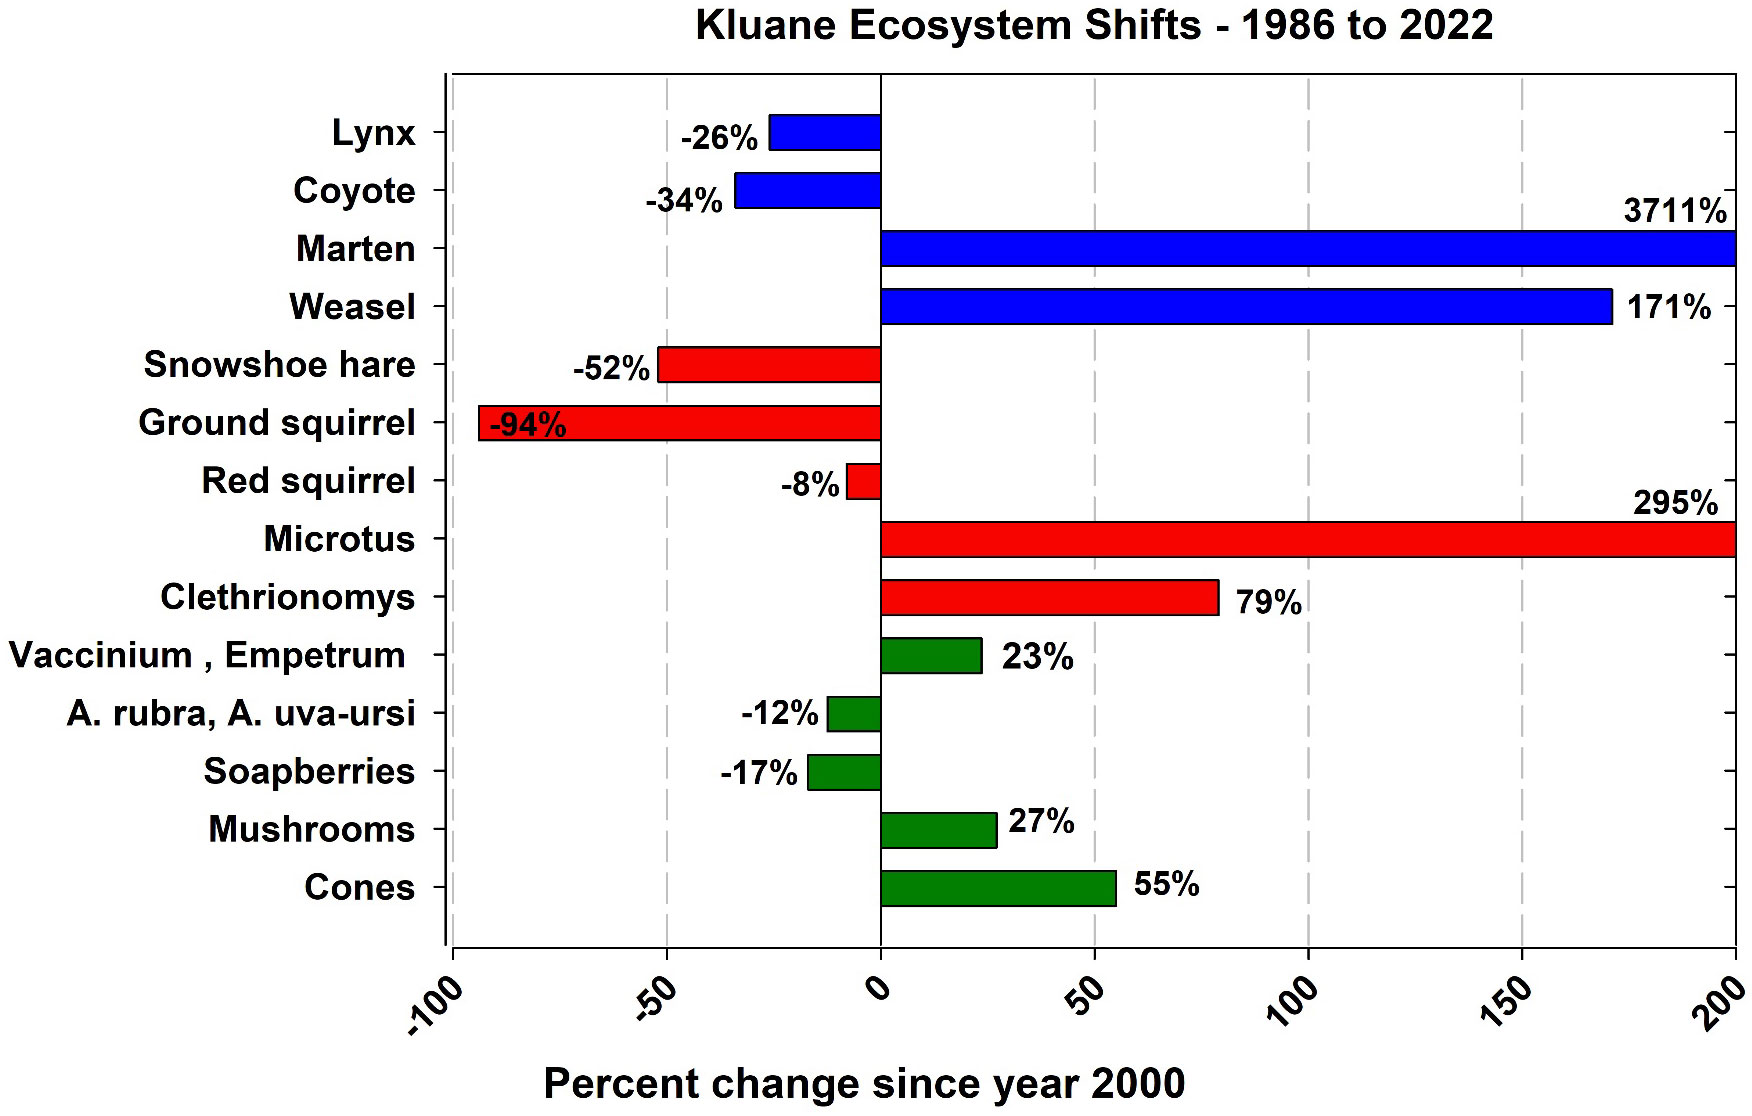
Figure 15 A simplified overview of how the abundance of our monitored species has changed in the average abundance before 2000 to that post 2000. The year 2000 was chosen as a break point because at this point the arctic ground squirrel effectively disappeared from the boreal forest ecosystem at Kluane.
Predictions for indicator species in future years
We have developed statistical models for mushrooms, ground berries, soapberries, and spruce cones, and we use the patterns we measured for mammals to produce predictions that can be made one year ahead. A list of these statistical models is given in the Supplementary Materials.
Testing all these models as the years go by will allow us to determine how reliable our understanding is of how the boreal forest ecosystem is responding to climate change as well as adjust models with new data to improve their accuracy and precision. In the future, we hope to expand our monitoring to bears, moose, wolves (Canis lupus), and wolverine (Gulo gulo), using remote cameras (Kenney and Krebs, 2020).
Conclusion
Despite a time series of 18–50 years for different ecosystem components in the boreal forest of northwestern North America, our conclusions to date must remain tentative, but we have a firm foundation for coordinating these regional data sets. The boreal forest ecosystem is a boom–bust ecosystem, characterized by relatively low productivity, few trophic levels, limited species diversity (especially in winter) and with all major components showing strong fluctuations in abundance that are either periodic or irruptive. Determining the associations between climate change and fluctuating components of the ecosystem is underway, and in the same way that we needed a long time-series of weather data to recognize climate change, achieving an understanding of this northern ecosystem will require long-term ecological data to be correlated with environmental data.
There are many questions that we leave unanswered. We need to proceed in the next 10+ years to answer three questions that relate directly to how climate change is affecting this part of Canada’s boreal forest:
1. How can we get a better index of changes in large mammal and predator populations in a time when snowfall and winter conditions have become so variable yet the long-term trend is clear? Can we utilize remote camera trapping (Abolaffio et al., 2019; Tabak et al., 2019) as one way of improving the spatial extent and consistency of our sampling efforts?
2. How much correlation is there between the Kluane Lake sites and other sites in the southern Yukon at Mayo, Faro, Watson Lake, and Whitehorse? To date measuring this correlation has been limited for many of the ecosystem constituents that we track, but longer time series and more detailed investigations are needed for robust assessment.
3. How much correlation is there between climatic measurements and biological measurements? For example, can we develop a predictive equation for plant production from temperature and rainfall data that will apply across all CEMP sites?
When we started our work at Kluane our interest was in understanding the snowshoe hare cycle and this naturally expanded to how the hare cycle affects other components of the ecosystem. Our bias has always been toward understanding the small mammals in the system and our selection of species to monitor reflects this bias. One can never monitor all biodiversity at any site, so decisions need to be made and many monitoring programs spend far too much effort deciding on the “right” set of indicator species (Carignan and Villard, 2002; Bal et al., 2018). Our advice is to pick a reasonable set of species and get on with it. Some argue that monitoring programs need to be question driven which sounds good in principle, but the reality is that the questions will always change with the times, and no one had the question of climate change effects in mind 50 years ago and no one can predict what the big questions will be in 20–50 years. This is not to say that we expect the question of climate change impacts to diminish in the future, but rather that the specifics will vary depending on new trends and findings. It follows that effective biodiversity monitoring programs need to be robust to these changes (Lindenmayer et al., 2015). While we are optimistic that changes in biodiversity and species interactions will maintain the interest of the public, government, and funding agencies, we sincerely hope that the importance of monitoring programs will be increasingly recognized and supported. The long-term changes in climate will slowly unfold as we move on to add to the synopsis shown in Figure 15.
Coda – major changes in 50 years of Yukon boreal forest monitoring
- Deciduous vegetation growth in the boreal region, particularly with shrubs, has greatly increased particularly in the last 30 years in correlation with temperature and rainfall increases (see also Macander et al., 2022).
- White spruce mast years continue with 3–7 years between large cone crops which are synchronized across the southern Yukon. The interval between mast years is shortening over the last 35 years.
- Ground berry production fluctuates greatly from year to year and between sites, and is driven largely by weather conditions of the previous summer growing season.
- Small rodent 3–4-year cycles continue in Clethrionomys rutilus with a tendency for higher peak numbers since 2000.
- Arctic ground squirrels, one of the most common small mammals in the Kluane area before 2000, have completely disappeared from the Kluane boreal forest since 2000 but persist in alpine and developed areas, causing a large change to the food web at Kluane.
- Snowshoe hare numbers continue their 9–10-year cycles with no clear sign of attenuation. Predation is a major cause of these cycles with a continuing puzzle of why reproductive rates of hares collapse in the peak, decline, and low phases of the cycle. There is no clear relationship between the timing of rodent cycles and hare cycles.
- Canada lynx and coyotes continue to follow the hare cycle with a lag of 1–2 years, and the same pattern occurs in great-horned owl numbers.
- Years of deep snow reduce coyote numbers and snow depth fluctuates greatly between years. There are conflicting predictions about future snow conditions in the northwestern boreal forest.
- Climate change is playing a major role in reshaping the boreal forest of northwestern North America, although to date there is no sign of ecosystem collapse or dramatic biodiversity loss in mammals (with the exception of Arctic ground squirrels in forests). Some species like coyotes, marten, mule deer and bison (reintroduced) are at various stages of colonization, so vertebrate diversity is increasing rather than declining.
Data availability statement
The original contributions presented in the study are included in the article/Supplementary Material. Further inquiries can be directed to the corresponding author.
Ethics statement
The animal study was reviewed and approved by University of British Columbia, Animal Care Committee.
Author contributions
All authors contributed to writing this review, doing the field work to gather the data, and providing funding. All authors contributed to the article and approved the submitted version.
Funding
Natural Science and Engineering Research Council, Canada Government of Yukon, Environment
Acknowledgments
We are grateful for financial support in 2022 from the Government of Yukon and the Natural Science and Engineering Research Council of Canada. Funding for monitoring programs is never plentiful and we are grateful for the support we have received. We are indebted to the Kluane First Nation and the Champagne-Aishihik First Nation for permission to carry out our Kluane studies on their traditional territories. We thank the key assistants who have assisted in the field work over the years, Elizabeth Hofer, Susan Hannon, Kathy Martin, the late Jamie Smith, the late Peter Upton, Villis and Magie Nams, and all the people who toiled under the summer sun and rain from the original Kluane Project from 1977 to 1996, Kluane Red Squirrel Project, and the Yukon Government’s Green Team to produce the data tallied here.
Conflict of interest
The authors declare that the research was conducted in the absence of any commercial or financial relationships that could be construed as a potential conflict of interest.
Publisher’s note
All claims expressed in this article are solely those of the authors and do not necessarily represent those of their affiliated organizations, or those of the publisher, the editors and the reviewers. Any product that may be evaluated in this article, or claim that may be made by its manufacturer, is not guaranteed or endorsed by the publisher.
Supplementary material
The Supplementary Material for this article can be found online at: https://www.frontiersin.org/articles/10.3389/fevo.2023.1187222/full#supplementary-material
References
Abolaffio M., Focardi S., Santini G. (2019). Avoiding misleading messages: Population assessment using camera trapping is not a simple task. J. Anim. Ecol. 88, 2011–2016. doi: 10.1111/1365-2656.13085
Ascoli D., Hacket-Pain A., LaMontagne J. M., Cardil A., Conedera M., Maringer J., et al. (2019). Climate teleconnections synchronize Picea glauca masting and fire disturbance: Evidence for a fire-related form of environmental prediction. J. Ecol. 108, 1186–1198. doi: 10.1111/1365-2745.13308
Bal P., Tulloch A. I. T., Addison P. F. E., McDonald-Madden E., Rhodes J. R. (2018). Selecting indicator species for biodiversity management. Front. Ecol. Environ. 16, 589–598. doi: 10.1002/fee.1972
Beaumont L. J., Pitman A., Perkins S., Zimmermann N. E., Yoccoz N. G., Thuiller W. (2011). Impacts of climate change on the world’s most exceptional ecoregions. Proc. Natl. Acad. Sci. 108, 2306–2311. doi: 10.1073/pnas.1007217108
Boonstra R., Andreassen H. P., Boutin S., Husek J., Ims R. A., Krebs C. J., et al. (2016). Why do the Boreal Forest ecosystems of Northwestern Europe differ from those of Western North America? BioScience 66 (9), 722–734. doi: 10.1093/biosci/biw080
Boonstra R., Krebs C. J. (2012). Population dynamics of red-backed voles (Myodes) in North America. Oecologia 168, 601–620. doi: 10.1007/s00442-011-2120-z
Boonstra R., Krebs C. J., Cowcill K. (2017). Responses of key understory plants in the boreal forests of western North America to natural versus anthropogenic nitrogen levels. For. Ecol. Manage. 401, 45–54. doi: 10.1016/j.foreco.2017.06.065
Boonstra R., Krebs C. J., Gilbert S., Schweiger S. (2001). “Chapter 10: Voles and Mice,” in Ecosystem Dynamics of the Boreal Forest: The Kluane Project. Eds. Krebs C. J., Boutin S., Boonstra R. (New York: Oxford University Press), 215–239.
Boutin S. A., Krebs C. J., Sinclair A. R. E., Smith J. N. M. (1986). Proximate causes of losses in a snowshoe hare population. Can. J. Zool. 64, 606–610. doi: 10.1139/z86-090
Brommer J. E., Pietiäinen H., Ahila K., Karell P., Karstinen T., Kolunen H. (2010). The return of the vole cycle in northern Finland refutes the generality of the loss of cycles through ‘climate forcing’. Global Change Biol. 16, 577–586. doi: 10.1111/j.1365-2486.2009.02012.x
Büntgen U., Leibhold A., Nievergelt D., Wermelinger B., Roques A., Reinig F., et al. (2020). Return of the moth: Rethinking the effect of climate on insect outbreaks. Oecologia 192, 543–552. doi: 10.1007/s00442-019-04585-9
Bush E., Lemmen D. S. (2019). Canada’s Changing Climate Report. Eds. Bush E., Lemmen D. S. (Ottawa, ON: Government of Canada). 444pp.
Carignan V., Villard M. A. (2002). Selecting indicator species to monitor ecological integrity: A review. Environ. Monit. Assess. 78, 45–61. doi: 10.1023/A:1016136723584
Carver S., Mills J. N., Parmenter C. A., Parmenter R. R., Richardson K. S., Harris R. L., et al. (2015). Toward a mechanistic understanding of environmentally forced zoonotic disease emergence: Sin Nombre hantavirus. BioScience 65, 651–666. doi: 10.1093/biosci/biv047
Cornulier T., Yoccoz N. G., Bretagnolle V., Brommer J. E., Bu. A., Ecke F., et al. (2013). Europe-wide dampening of population cycles in keystone herbivores. Science 340 (6128), 63–66. doi: 10.1126/science.1228992
Dearing D., Dizney L. (2010). Ecology of hantavirus in a changing world. Ann. New York Acad. Sci. 1195, 99–112. doi: 10.1111/j.1749-6632.2010.05452.x
du Toit J. T., Rogers K. H., Biggs H. C. (eds.) (2003). The Kruger Experience: Ecology and Management of Savanna Heterogeneity. Island Press: Washington, DC, 519pp.
Efford M. G., Fewster R. M. (2013). Estimating population size by spatially explicit capture-recapture. Oikos 122, 918–928. doi: 10.1111/j.1600-0706.2012.20440.x
Elton C., Nicholson M. (1942). The ten-year cycle in numbers of the lynx in Canada. J. Anim. Ecol. 11, 215–244. doi: 10.2307/1358
Fettig C. J., Asaro C., Nowak J. T., Dodds K. J., Gandhi K. J. K., Moan J. E., et al. (2022). Trends in bark beetle impacts in North America during a period, (2000–2020) of rapid environmental change. J. Forestry 120, 693–713. doi: 10.1093/jofore/fvac021
Hacket-Pain A., Bogdziewicz M. (2021). Climate change and plant reproduction: trends and drivers of mast seeding change. Philos. Trans. R. Soc. B 376, 20200379. doi: 10.1098/rstb.2020.0379
Hanski I., Henttonen H. (2002). “Population cycles of small rodents in Fennoscandia,” in Population Cycles: The Case for Trophic Interactions. Ed. Berryman A. (New York: Oxford Academic), 44–68.
Hooper D., Adair E., Cardinale B., Byrnes J. E. K., Hungate B. A., Matulich K. L., et al. (2012). A global synthesis reveals biodiversity loss as a major driver of ecosystem change. Nature 486, 105–108. doi: 10.1038/nature11118
Ims R. A., Henden J. A., Killengreen S. T. (2008). Collapsing population cycles. Trends Ecol. Evol. 23, 79-86. doi: 10.1016/j.tree.2007.10.010
Kenney A. J., Krebs C. J. (2020). Kluane Camera Trap Project – Annual Report 2020 (Burwash, Yukon: Dan Keyi Renewable Resource Council, Kluane First Nation).
Knust B., Rollin P. E. (2013). Twenty-year summary of surveillance for human hantavirus infections, United States. Emerging Infect. Dis. 19, 1934–1937. doi: 10.3201/eid1912.131217
Korpimäki E., Norrdahl K., Huitu O., Klemola T. (2005). Predator-induced synchrony in population oscillations if coexisting small mammal species. Proc. R. Soc. London Ser. B. 272, 193–202. doi: 10.1098/rspb.2004.2860
Krebs C. J., Boonstra R., Boutin S. (2017a). Using experimentation to understand the 10-year snowshoe hare cycle in the boreal forest of North America. J. Anim. Ecol. 87, 87–100. doi: 10.1111/1365-2656.12720
Krebs C. J., Boonstra R., Boutin S., Sinclair A. R. E., Smith J. N. M., Gilbert B. S., et al. (2014b). Trophic dynamics of the boreal forests of the Kluane Region. Arctic 67, 71–81. doi: 10.14430/arctic4350
Krebs C. J., Boonstra R., Cowcill K., Kenney A. J. (2009). Climatic determinants of berry crops in the boreal forest of the southwestern Yukon. Botany 87, 401–408. doi: 10.1139/B09-013
Krebs C. J., Boonstra R., Gilbert B. S., Kenney A. J., Boutin S. (2019). Impact of climate change on the small mammal community of the Yukon boreal forest. Integr. Zool. 14, 528–541. doi: 10.1111/1749-4877.12397
Krebs C. J., Boonstra R., Kenney A. J., Gilbert B. S. (2018a). Hares and small rodent cycles: a 45-year perspective on predator-prey dynamics in the Yukon Boreal forest. Aust. Zoologist 39, 724–732. doi: 10.7882/AZ.2018.012
Krebs C. J., Boonstra R., Nams V., O’Donoghue M., Hodges K. E., Boutin S. (2001b). Estimating snowshoe hare population density from pellet plots: a further evaluation. Can. J. Zool. 79, 1–4. doi: 10.1139/z87-087
Krebs C. J., Boutin S., Boonstra R. (2001a). Ecosystem Dynamics of the Boreal Forest: The Kluane Project (Oxford, England: Oxford University Press), ISBN: ISBN: 0-19-513393-5. 511pp.
Krebs C. J., Bryant J., O’Donoghue M., Kielland K., Doyle F., McIntyre C., et al. (2014a). What factors determine cyclic amplitude in the snowshoe hare cycle? Can. J. Zool. 92, 1039–1048. doi: 10.1139/cjz-2014-0159
Krebs C. J., Cowcill K., Boonstra R., Kenney A. J. (2010). Do changes in berry crops drive population fluctuations in small rodents in the southwestern Yukon? J. Mammal. 91, 500–509. doi: 10.1644/09-MAMM-A-005.1
Krebs C. J., Gilbert S., Boutin S., Boonstra R. (1987). Estimation of snowshoe hare population density from turd transects. Can. J. Zool. 65, 565–567. doi: 10.1139/z00-177
Krebs C. J., Henry J. D., Kenney A. J., Hofer E. J. (2018b). Empirical test of the ClimateWNA model for local accuracy in the Kluane Lake area of the southern Yukon, Canada. Climate Res. 75, 111–115. doi: 10.3354/cr01511
Krebs C. J., Kielland K., Bryant J., O’Donoghue M., Doyle F., McIntyre C., et al. (2013). Synchrony in the snowshoe hare cycle in Northwestern North America 1970-2012. Can. J. Zool. 91, 562–572. doi: 10.1139/cjz-2013-0012
Krebs C. J., O’Donoghue M., Taylor S., Kenney A. J., Hofer E. J., Boutin S. (2017b). Predicting white spruce cone crops in the boreal forests of the southern and central Yukon. Can. J. For. Res. 47, 47–52. doi: 10.1139/cjfr-2016-0180
Lambin X., Bretagnolle V., Yoccoz N. G. (2006). Vole population cycles in northern and southern Europe: Is there a need for different explanations for single pattern? J. Anim. Ecol. 75, 340–349. doi: 10.1111/j.1365-2656.2006.01051.x
LaMontagne J. M., Pearse I. S., Greene D. F., Koenig W. D. (2020). Mast seeding patterns are asynchronous at a continental scale. Nat. Plants 6, 460–465. doi: 10.1038/s41477-020-0647-x
LaMontagne J. M., Peters S., Boutin S. (2005). A visual index for estimating cone production for individual white spruce trees. Can. J. For. Res. 35, 3020–3026. doi: 10.1139/X05-210
Lindenmayer D. B., Burns E. L., Tennant P., Dickman C. R., Green P. T., Keith D. A., et al. (2015). Contemplating the future: Acting now on long-term monitoring to answer 2050’s questions. Austral Ecol. 40, 213–224. doi: 10.1111/aec.12207
Macander M. J., Nelson P. R., Nawrocki T. W., Frost G. V., Orndahl K. M., Palm E. C., et al. (2022). Time-series maps reveal widespread change in plant functional type cover across Arctic and boreal Alaska and Yukon. Environ. Res. Lett. 17, 054042. doi: 10.1088/1748-9326/ac6965
Martin K., Doyle C., Hannon S., Mueller F. (2001). “Chapter 11. Forest grouse and ptarmigan,” in Ecosystem Dynamics of the Boreal Forest: The Kluane Project. Eds. Krebs C. J., Boutin S., Boonstra R. (New York: Oxford University Press), 240–260.
Mekonnen Z. A., Riley W. J., Berner L. T., Bouskill N. J., Torn M. S., Iwahana G., et al. (2021). Arctic tundra shrubification: a review of mechanisms and impacts on ecosystem carbon balance, (2021). Environ. Res. Lett. 16, 053001. doi: 10.1088/1748-9326/abf28b
Murray D. L., Boutin S. (1991). The influence of snow on lynx and coyote movements in southwestern Yukon: does morphology affect behaviour? Oecologia 88, 463–469. doi: 10.1007/BF00317707
Myers J. H. (2018). Population cycles: generalities, exceptions, and remaining mysteries. Proc. R. Soc. London Ser. B. 285, 20172841. doi: 10.1098/rspb.2017.2841
Nelson G. C., Bennett E., Berthe A. A., Cassman K., DeFries R., Dietz T., et al. (2006). Anthropogenic drivers of ecosystem change: An overview. Ecol. Soc. Ecol. Soc. 11 (2), 29. Available at: http://www.ecologyandsociety.org/vol11/iss2/art29/.
O’Donoghue M., Boutin S., Krebs C. J., Hofer E. J. (1997). Numerical responses of coyotes and lynx to the snowshoe hare cycle. Oikos 80, 150–162. doi: 10.2307/3546526
O’Donoghue M., Boutin S., Krebs C. J., Zuleta G., Murray D. L., Hofer E. J. (1998). Functional responses of coyotes and lynx to the snowshoe hare cycle. Ecology 79, 1193–1208. doi: 10.2307/176736
O’Donoghue M., Slough B. G., Poole K., Boutin S., Hofer E. J., Mowat G., et al. (2023). Snow track counts for density estimation of mamMalian predators in the boreal forest. Wildlife Res. 50, 425–434. doi: 10.1071/WR21159
Oli M. K., Krebs C. J., Kenney A. J., Boonstra R., Boutin S., Hines J. E. (2020). Demography of snowshoe hare population cycles. Ecology 101, e02969. doi: 10.1002/ecy.2969
Ostfeld R. S., Keesing F. (2000). Pulsed resources and community dynamics of consumers in terrestrial ecosystems. Trends Ecol. Evol. 15, 232–237. doi: 10.1016/S0169-5347(00)01862-0
Peers M. J. L., Majchrzak Y. N., Menzies A. K., Studd E. K., Bastille-Rousseau G., Boonstra R., et al. (2020). Climate change increases predation risk for a keystone species of the boreal forest. Nat. Climate Change. 10, 1149–1153. doi: 10.1038/s41558-020-00908-4
Peltonen M., Liebhold A. M., Bjørnstad O. N., Williams D. W. (2002). Spatial synchrony in forest insect outbreaks: Roles of regional stochasticity and dispersal. Ecology 83, 3120–3129. doi: 10.1890/0012-9658(2002)083[3120:SSIFIO]2.0.CO;2
Price D. T., Brown A. K. J., Alfaro R. I., Brown K. J., Flannigan M. D., Fleming R. A., et al. (2013). Anticipating the consequences of climate change for Canada’s boreal forest ecosystems. Environ. Rev. 21, 322–365. doi: 10.1139/er-2013-0042
Qian B., Gregorich E. G., Gameda S., Hopkins D. W., Wang X. L. (2011). Observed soil temperature trends associated with climate change in Canada. J. Geophys. Res. 116, D02106. doi: 10.1029/2010JD015012
Reynolds J. H., Knutson M. G., Newman K. B., Silverman E. D., Thompson W. L. (2016). A road map for designing and implementing a biological monitoring program. Environ. Monit. Assess. 188, 399. doi: 10.1007/s10661-016-5397-x
Sherratt J. A. (2001). Periodic travelling waves in cyclic predator–prey systems. Ecol. Lett. 4, 30–37. doi: 10.1046/j.1461-0248.2001.00193.x
Sherratt J. A., Smith M. J. (2008). Periodic travelling waves in cyclic populations: field studies andreaction–diffusion models. J. R. Soc. Interface 5, 483–505. doi: 10.1098/rsif.2007.1327
Sinclair A. R. E., Metzger K. L., Mduma S. A. R., Fryxell J. M. (2015). Serengeti IV: Sustaining Biodiversity in a Coupled Human-Natural System. (Chicago, IL: University of Chicago Press), 841pp.
Tabak M. A., Norouzzadeh M. S., Wolfson D. W., Sweeney S. J., Vercauteren K. C. (2019). Machine learning to classify animal species in camera trap images: Applications in ecology. Methods Ecol. Evol. 10, 585–590. doi: 10.1111/2041-210X.13120
Werner J. R., Gillis E. A., Boonstra R., Krebs C. J. (2016). You can hide but you can’t run: apparent competition, predator responses and the decline of Arctic ground squirrels in boreal forests of the southwest Yukon. PeerJ 4, e2303. doi: 10.7717/peerj.2303
Werner J. R., Krebs C. J., Donker S. A., Boonstra R., Sheriff M. J. (2015). Arctic ground squirrel population collapse in the boreal forests of the Southern Yukon. Wildlife Res. 42, 176–184. doi: 10.1071/WR14240
White P. J., Garrott R. A., Plumb G. E. (2013) Yellowstone’s Wildlife in Transition. (Cambridge, MA: Harvard University Press), 368 pp.
Keywords: Yukon, boreal forest, monitoring, snowshoe hares, boom–bust cycle
Citation: Krebs CJ, Boutin S, Boonstra R, Murray DL, Jung TS, O’Donoghue M, Gilbert BS, Kukka PM, Taylor SD, Morgan T, Drummond R, Sinclair ARE and Kenney AJ (2023) Long-term monitoring in the boreal forest reveals high spatio-temporal variability among primary ecosystem constituents. Front. Ecol. Evol. 11:1187222. doi: 10.3389/fevo.2023.1187222
Received: 15 March 2023; Accepted: 09 August 2023;
Published: 25 September 2023.
Edited by:
Stein Joar Hegland, Western Norway University of Applied Sciences, NorwayReviewed by:
Rolf A. Ims, UiT The Arctic University of Norway, NorwayVidar Selås, Norwegian University of Life Sciences, Norway
Edward A. Johnson, University of Calgary, Canada
Copyright © 2023 Krebs, Boutin, Boonstra, Murray, Jung, O’Donoghue, Gilbert, Kukka, Taylor, Morgan, Drummond, Sinclair and Kenney. This is an open-access article distributed under the terms of the Creative Commons Attribution License (CC BY). The use, distribution or reproduction in other forums is permitted, provided the original author(s) and the copyright owner(s) are credited and that the original publication in this journal is cited, in accordance with accepted academic practice. No use, distribution or reproduction is permitted which does not comply with these terms.
*Correspondence: Charles J. Krebs, a3JlYnNAem9vbG9neS51YmMuY2E=