 Anlly Fresno-Rueda1,2*
 Hayden Wolfe3Christian Ramirez-Camba2Andrew Antaya4Tom Bragg5
 Carter Kruse5
 Jameson Brennan1
 Jeff M. Martin3*
- 1Department of Animal Sciences, South Dakota State University, Brookings, SD, United States
- 2Department of Animal Sciences, University of Minnesota, St. Paul, MN, United States
- 3Department of Natural Resource Management, South Dakota State University, Brookings, SD, United States
- 4West River Agricultural Experiment Station, South Dakota State University, Rapid City, SD, United States
- 5Turner Institute of Ecoagriculture, Bozeman, MT, United States
Introduction: Body size is a fundamental trait that influences survival, reproduction, and ecosystem functioning in large herbivores. Despite their ecological importance, our understanding of how North American bison (Bison bison) respond to climatic variation over time remains limited.
Methods: To address this, we analyzed a large dataset comprising more than 672,000 weight observations from 186,732 individuals collected over 20 years across 14 widely-dispersed geographic locations to investigate how climate, birth cohorts, and translocation practices shape bison growth dynamics. Using a three-parameter logistic model, we estimated asymptotic body mass (ABM) across seven quinquennial cohorts and correlated these estimates with local climatic conditions, specifically mean annual temperature (MAT) and precipitation (MAP).
Results: Bison ABM varied geographically in accordance with climate: individuals attained their greatest adult body masses in moderate climates (around 10–12°C MAT and 500–650 mm MAP), whereas both warmer-drier and cooler climates were associated with reduced ABM, as confirmed by a significant quadratic climate–size relationship (p < 0.01). Sexual size dimorphism was also highest under these moderate conditions, with males achieving disproportionately larger sizes than females in such environments. Significant cohort effects were detected, with certain birth year cohorts consistently exhibiting higher or lower ABM, likely reflecting the influence of early-life environmental conditions. Furthermore, animals that were translocated between localities exhibited changed growth patterns. Female bison translocated between herds showed growth trajectories that were intermediate between their herd of origin and their new destination, potentially indicating partial convergence to local size norms.
Discussion: This work supports the dominant influence of environmental conditions on bison body size, consistent with previous findings, while expanding our understanding on a broader spatial and temporal scale. Future management strategies should consider localized climate optima and the long-term impacts of translocation, ensuring that bison continue to fulfill their critical ecological roles in North America.
1 Introduction
The decline of megaherbivore abundance and body size diminishes their roles as ecosystem engineers on a mass-specific basis (Doughty et al., 2015; Peters, 1983a; Owen-Smith, 1988; Hardesty et al., 1988). The last remaining large native herbivores in North America since the end of the Pleistocene are bison (Bison bison). Bison perform key roles as ecosystem engineers and ecological keystone species in grassland systems, and changes in either their abundance or body size (as total biomass) can have cascading effects on ecological processes (Enquist et al., 2020; Smith et al., 2023). Historically, bison body size was assumed to be primarily genetic and relatively fixed, except in cases of cattle (Bos taurus) introgression (hybridization) which were thought to potentially decrease body size (Derr et al., 2012). However, recent evidence has challenged this assumption. Genetic introgression, when present, accounts for merely 2–9% of body size variation in bison (White and Wallen, 2012; Licht and Johnson, 2018). In contrast, mechanistic climate-body size models, drive and explain 95% of bison body size variation (Martin and Barboza, 2020a), highlighting the dominant role of climate and environment regulating asymptotic body size. These modeling results using long-term data from the Wind Cave National Park revealed that bison born in the 2000s and 2010s were smaller at maturity than those from the 1960s, a decline correlated with rising temperatures and increased drought severity (Martin and Barboza, 2020a). Across the Great Plains, higher temperatures and more intense drought conditions have been linked to reductions in asymptotic body mass of bison, and projections suggest that bison body size will likely decline further in coming decades if warming trends continue (Martin and Barboza, 2020a). Under extreme scenarios (e.g., ~4°C of global warming by late 21st century), models even predict that bison body mass could be reduced by nearly 50% (Martin et al., 2018) which would have profound implications for their ecology and management across all sectors of the Bison Management System (Martin et al., 2021).
A variety of ecological hypotheses predict how body size might respond to environmental conditions. For instance, Bergmann’s rule predicts larger body size in cooler climates (Bergmann, 1848; Watt et al., 2010), while Allen’s and (Allen, 1877) Geist’s (Geist, 1987; Huston and Wolverton, 2011) rules emphasize thermoregulation and resource availability as drivers of morphological adaptation. Cope’s rule further suggests evolutionary trends toward larger size under favorable conditions (Stanley, 1973). These frameworks highlight how both environment and resource constraints can shape growth and morphology in large mammals. In modern bison populations, these same ecological principles play out not through unrestricted natural movement, as they once did, but through management interventions that facilitate adaptation, such as selective translocations and herd structuring. Because contemporary bison are largely confined by fences, translocation has become the functional equivalent of migration, and standardly used between and within across all bison sectors (Silveira et al., 2025) allowing gene flow, reducing inbreeding depression, and enabling herds to persist across variable climates. Although each hypothesis targets a different driver (thermoregulation, limb geometry, resource dynamics, evolutionary trends), separating their relative importance in long‐lived mammals like bison has been difficult. Recent efforts (Gardner et al., 2011; Lovegrove and Mowoe, 2013; Martin and Barboza, 2020b; Martin and Barboza, 2020a; Mundinger et al., 2021; McQueen et al., 2024; McQueen et al., 2022), highlight conflicting signals across space and time, underscoring the need for large, longitudinal datasets to tease apart these interacting factors.
Although such data gaps are common in wildlife studies, an exception exists within private-sector bison management programs. Of the approximately 440,000 bison in North America, about 420,000 (~95%) are managed in private commercial herds, primarily as livestock, while only around 20,500 are maintained in conservation-focused herds (U.S. Fish & Wildlife Service, 2025). These private operations routinely collect detailed, individual-level records of body mass and demographics (Martin et al., 2021), providing a unique opportunity to examine body size dynamics with fine detail. Another distinguishing feature of these private-sector datasets is that they are spatially and temporally extensive. Long-term records (spanning decades) of these observations are invaluable for discerning the effects of slow processes like climate change and evolving management strategies influencing bison growth. Additionally, although these herds are privately managed, they operate under a conservation-oriented framework that emphasizes ecological restoration, genetic diversity, and sustainable grazing practices rather than intensive livestock production. Animal movements among properties are coordinated primarily to maintain herd structure, promote gene flow, and align animal distribution with available forage resources, reflecting an ecological rather than commercial management philosophy. Consequently, while these herds differ from publicly managed or wild bison in oversight and setting, their long-term ecological management provides a valuable model for studying environmental influences on growth within low-intensity, conservation-based production systems.
Despite prior studies linking climate and bison size, a comprehensive assessment across multiple regions and herd histories remain limited and the impact of translocation on body size dynamics in bison is completely unknown. Translocation (the movement of animals from one site to another) is a common practice in bison management for both conservation and production reasons, such as establishing new herds, improving genetic diversity, or reducing local density (Halbert and Derr, 2008; Hedrick, 2009). However, it is unclear how a bison’s growth may be influenced by being moved at certain ages to a new geographic location, especially if the climate and forage conditions substantially differ from its origin. Translocated animals might experience additional environmental stress or exposure to novel diets, vector-borne diseases, and parasites (Herskind et al., 2023), which could temporarily slow their growth or alter their body condition. Over the long term, multiple generations of translocations could potentially allow bison to attain sizes more typical of their new environment, but empirical data of this process are lacking. Understanding translocation effects is not only scientifically novel but also practical with bison increasingly being moved between public, private, nonprofit non-governmental organizations (NGOs), and tribal sectors for conservation or production purposes. Managers need to know if translocated individuals will thrive and how to mitigate potential negative effects (e.g., through acclimation periods or quarantine-based health surveillance).
To address these knowledge gaps and expand current understanding, we analyzed 20 years of bison growth data, integrating demographic information (sex, age), birth year cohorts, translocation status, and environmental variables across multiple geographic locations. The overall goal of this study is to evaluate how environmental factors shape long-term patterns in bison growth through three complementary dimensions: temporal variation across birth cohorts, spatial and climatic differences among herds, and changes associated with translocations between contrasting environments. Although these analyses are presented separately for clarity, together they form an integrated framework for understanding how environmental and management factors interact to influence body size across space and time. Specifically, our objectives were to (1) quantify cohort effects (sex and location differences) on bison growth and asymptotic body mass (ABM), (2) evaluate how climate factors (temperature and precipitation) influence ABM and sexual size dimorphism, and (3) assess the influence of translocation on growth trajectories. The first two objectives extend prior findings by testing consistency across a large-scale dataset, while the third introduces a novel ecological and management factor by evaluating translocation effects within this framework.
2 Materials and methods
2.1 Study population and data collection
We used bison herd data obtained from Turner Enterprises Inc. (Bozeman, Montana, USA), which manages multiple private ranches across the United States. These herds are privately managed, and they operate under extensive range conditions typical of bison production systems which include low-density grazing, seasonal movements among large pastures, and limited handling beyond essential herd monitoring. The initial dataset included 1,469,053 records from 210,010 unique bison born between 1986 and 2021. Each record contained body weight (kg), sex, birth year (YOB, 1986–2021), year of observation (YOO, 1998–2022), herd location, and whether the animal had been translocated (i.e., moved from its birth location to another). In some cases, individuals were translocated multiple times; therefore, we calculated a cumulative translocation count per animal.
These records came from 41 unique sites where bison weights had been recorded over time. However, not all of these sites represented active ranches. Some were temporary locations such as feedlots, slaughter facilities, or short-term holding areas used during the early phases of herd establishment. These sites often lacked consistent longitudinal data or reflected artificial weight gain conditions unrelated to natural growth trajectories. To ensure the analysis focused only on biologically meaningful patterns and to flag and remove records not relevant to the study objectives, we performed a data cleaning and filtering step.
2.2 Data cleaning and preparation
Data quality checks and filtering steps were performed to ensure a reliable analysis. We removed any entries missing essential information (body mass, birth year, sex, or location), which eliminated 527,062 records. Obvious data errors and redundancies were also eliminated including duplicate entries (n = 204,863) and records from feedlots or slaughter facilities (n = 59,911). Dates were also cleaned and standardized to a common date format (i.e., YYYY-MM-DD). Subjects from locations with very sparse data (<50 observations; n = 538) were omitted to focus on well-represented herds. Electronic identification (EID) numbers were also cleaned to ensure that all observations conformed to exactly 15 digits. In instances where individuals were missing an EID number, a unique surrogate EID number was assigned to that individual. Finally, Outliers were identified using the selected growth curve (described in the next section) as a baseline to capture the overall body mass trend across all animals over their entire lifespan. Body mass values that deviated significantly from this baseline (falling outside the 0.3rd to 99.7th percentile range for each age and sex class) were considered biologically implausible and were removed from further analyses. After all filtering steps, the final data set consisted of 672,549 observations from 186,732 individual bison across 14 distinct sites, all corresponding to active Turner ranch locations (Figure 1). These herds span diverse environmental settings, from northern prairies with cold winters to southern plains with hot, arid summers, enabling a robust analysis of climate-related growth variation (Figure 1). Figure 1 was generated in R (version 4.4.3) using the leaflet package. Basemap tiles © OpenStreetMap contributors and © OpenTopoMap (licensed under CC BY-SA 4.0).
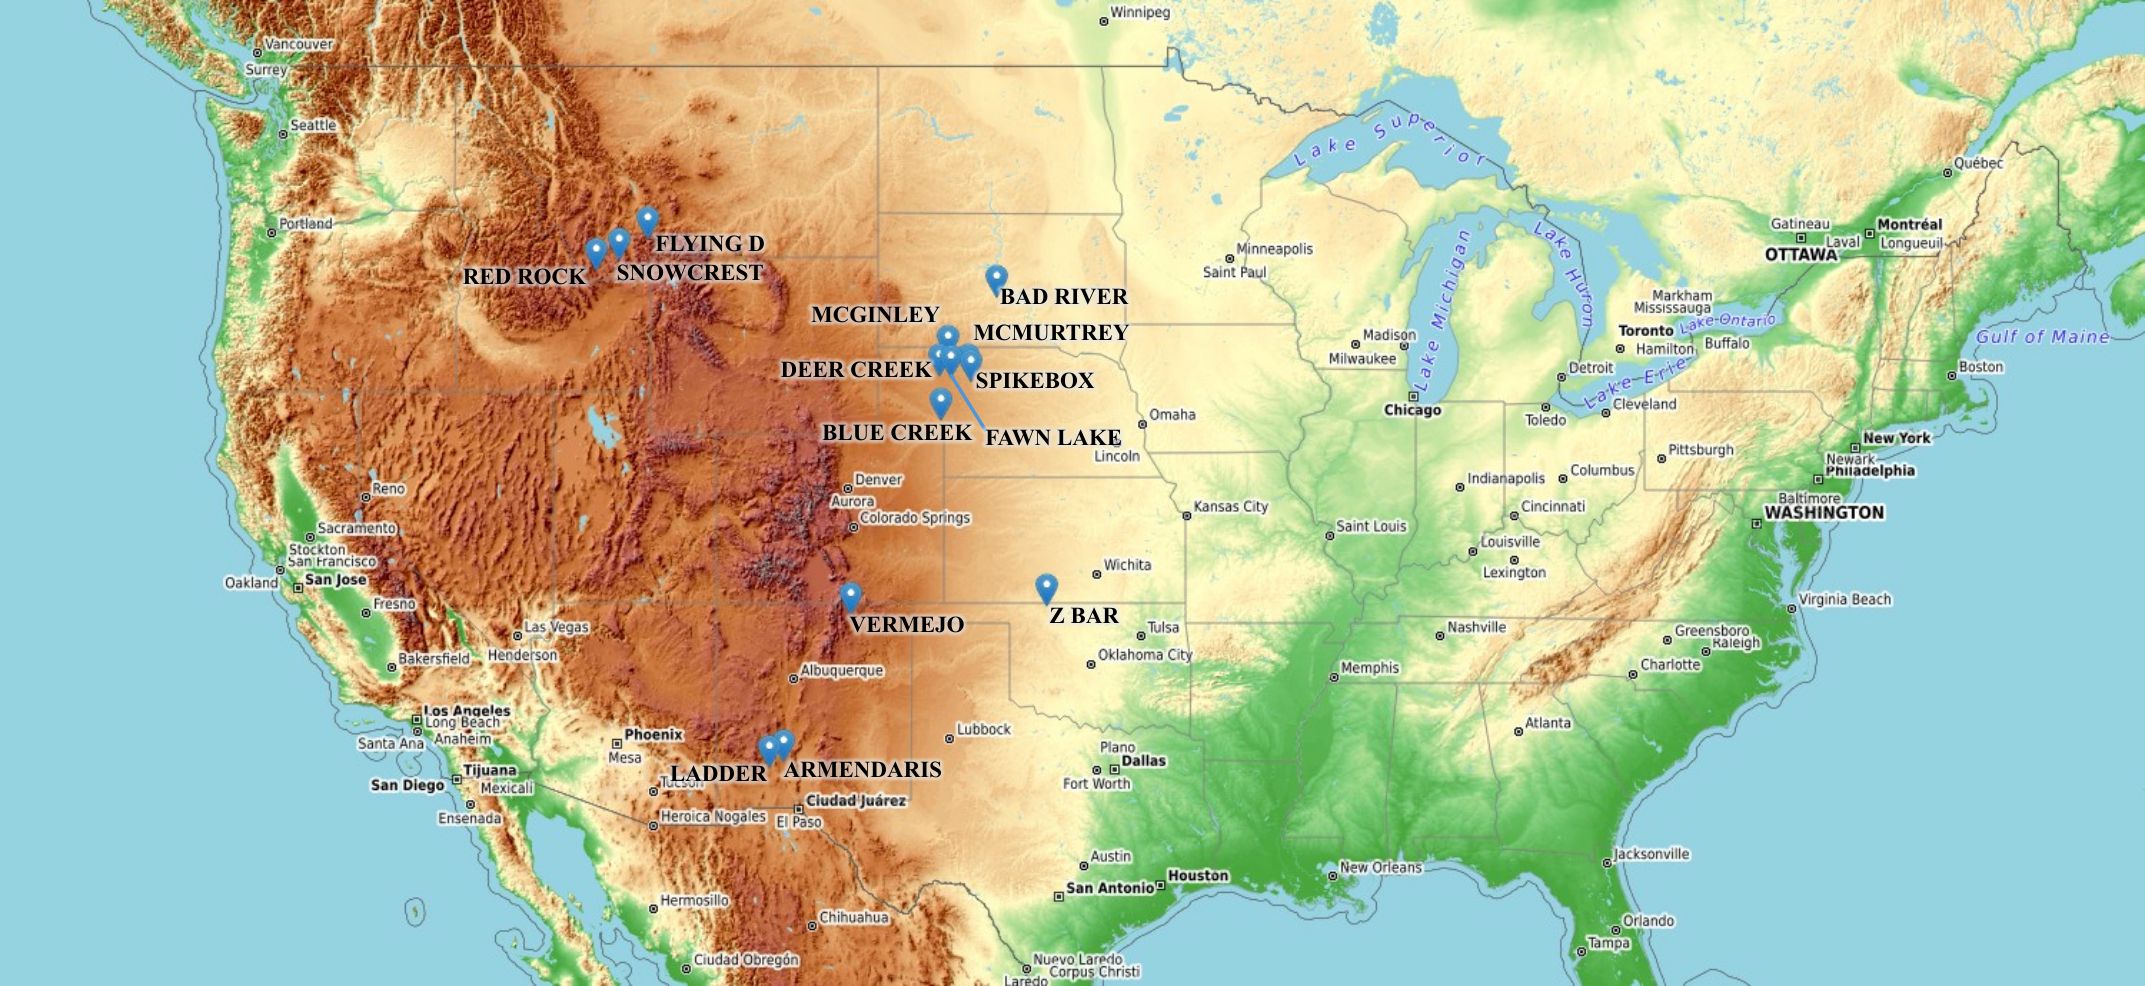
Figure 1. Geographic distribution of the Turner Enterprises bison herds included in the study (n=14). Each point represents a managed herd site with long-term individual-level body weight data used to analyze growth dynamics, climate associations, and translocation effects. The underlying topographic map highlights elevation gradients across the U.S., with darker shades indicating mountainous and high-altitude regions, and green tones representing lowland and coastal areas. Source: © OpenStreetMap contributors, © OpenTopoMap (licensed under CC BY-SA 4.0).
2.3 Statistical and data analysis
2.3.1 Growth model selection
We modeled bison growth (body mass as a function of age) using sigmoidal growth functions to estimate key growth parameters. Two common sigmoidal models (the Gompertz and the logistic) were considered, each in both 3-parameter and 4-parameter forms. For each sex, we fit the four candidate models to the data. Model fitting was implemented in R (version 4.2.2) using the ‘drc’ [Dose-response curve modeling; (Ritz et al., 2015)]. To avoid overfitting and assess generalizability, we performed an iterative 5-fold cross-validation. In each iteration, 80% of the observations were used for model training while the remaining 20% served model validation. We assessed model performance with Akaike’s Information Criterion (AIC) as well as predictive error metrics (root mean squared error, RMSE; and mean absolute error, MAE). The validation metrics from the five iterations were then averaged, with lower AIC, RMSE, and MAE values indicating a better fit.
Among the models evaluated, the 3-parameter logistic regression model provided the best fit for describing bison growth. For female bison, which comprised ~80% of our dataset, the 3-parameter logistic had the lowest AIC and error metrics (Table 1). For males, the top-ranked model by AIC was a 4-parameter logistic, but its advantage was minimal meaning that predictions from the 3-parameter logistic differed by an average of only 0.38-0.48 kg (Table 1), essentially a negligible difference in biological terms. Following the principle of model parsimony (Burnham and Anderson, 2004) and considering the small performance gap, we selected the simpler 3-parameter logistic for both sexes as our standard growth model which is given by the following equation:
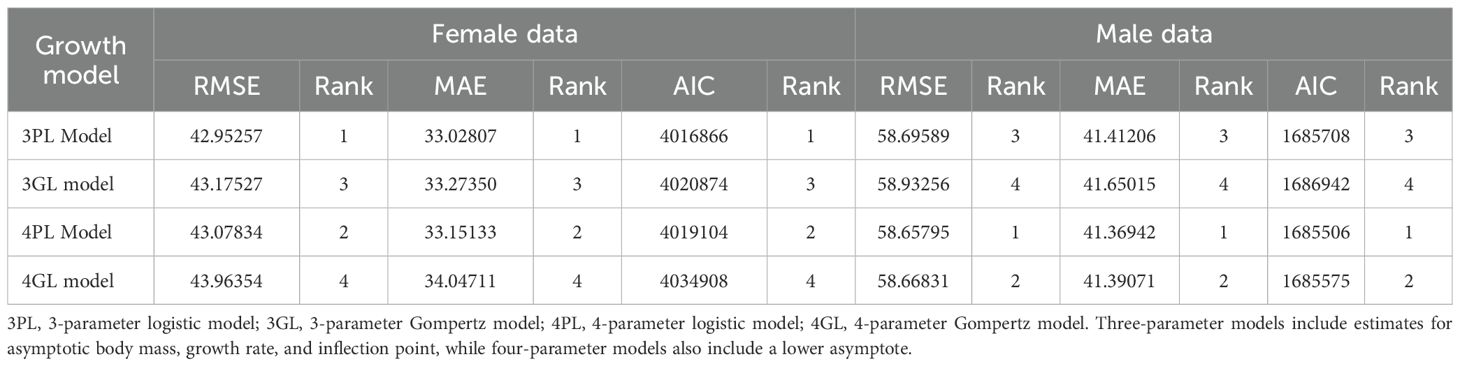
Table 1. Evaluation of nonlinear growth model performance using AIC, RMSE, and MAE to compare fits to bison growth data.
Where:
● is the predicted weight at age
● d is the upper asymptote, representing the cohort average asymptotic body mass (ABM)
● b is the growth rate, indicating how quickly the weight increases with age
● e is the age at the inflection point, representing the age at which the growth rate is highest.
To reduce the influence of short-term fluctuations, we used asymptotic body mass (ABM), defined as the estimated maximum body weight an animal is expected to reach at maturity based on its growth trajectory, as a long-term growth indicator rather than instantaneous body weight. Because each ABM estimate was derived from large numbers of individuals measured across years and seasons, transient variation is expected to average out. Although the exact timing of weighing was not available, the scale and consistency of the dataset minimize potential bias from seasonal or daily effects.
2.3.2 Cohort definitions, growth curve estimation and validation
To account for potential effects of climatic, environmental, and management practices over time, we divided the dataset into seven quinquennial (five-year) cohorts: 1) 1986–1990, 2) 1991–1995, 3) 1996–2000, 4) 2001–2005, 5) 2006–2010, 6) 2011–2015, and 7) 2016–2022. For each combination of sex, location, and birth cohort, we fitted the 3-parameter logistic growth curve to that subgroup’s data. This yielded cohort-specific growth parameters (d, b, e for each subgroup). We then calculated the average ABM (coefficient d) and excluded any values that deviated more than three standard deviations from the sex-specific mean, as these were considered biologically implausible (Figure 2). These outlier cohorts occurred due to limited data availability in certain age groups, which caused the model to overfit sparse observations, leading to unrealistic growth estimates.
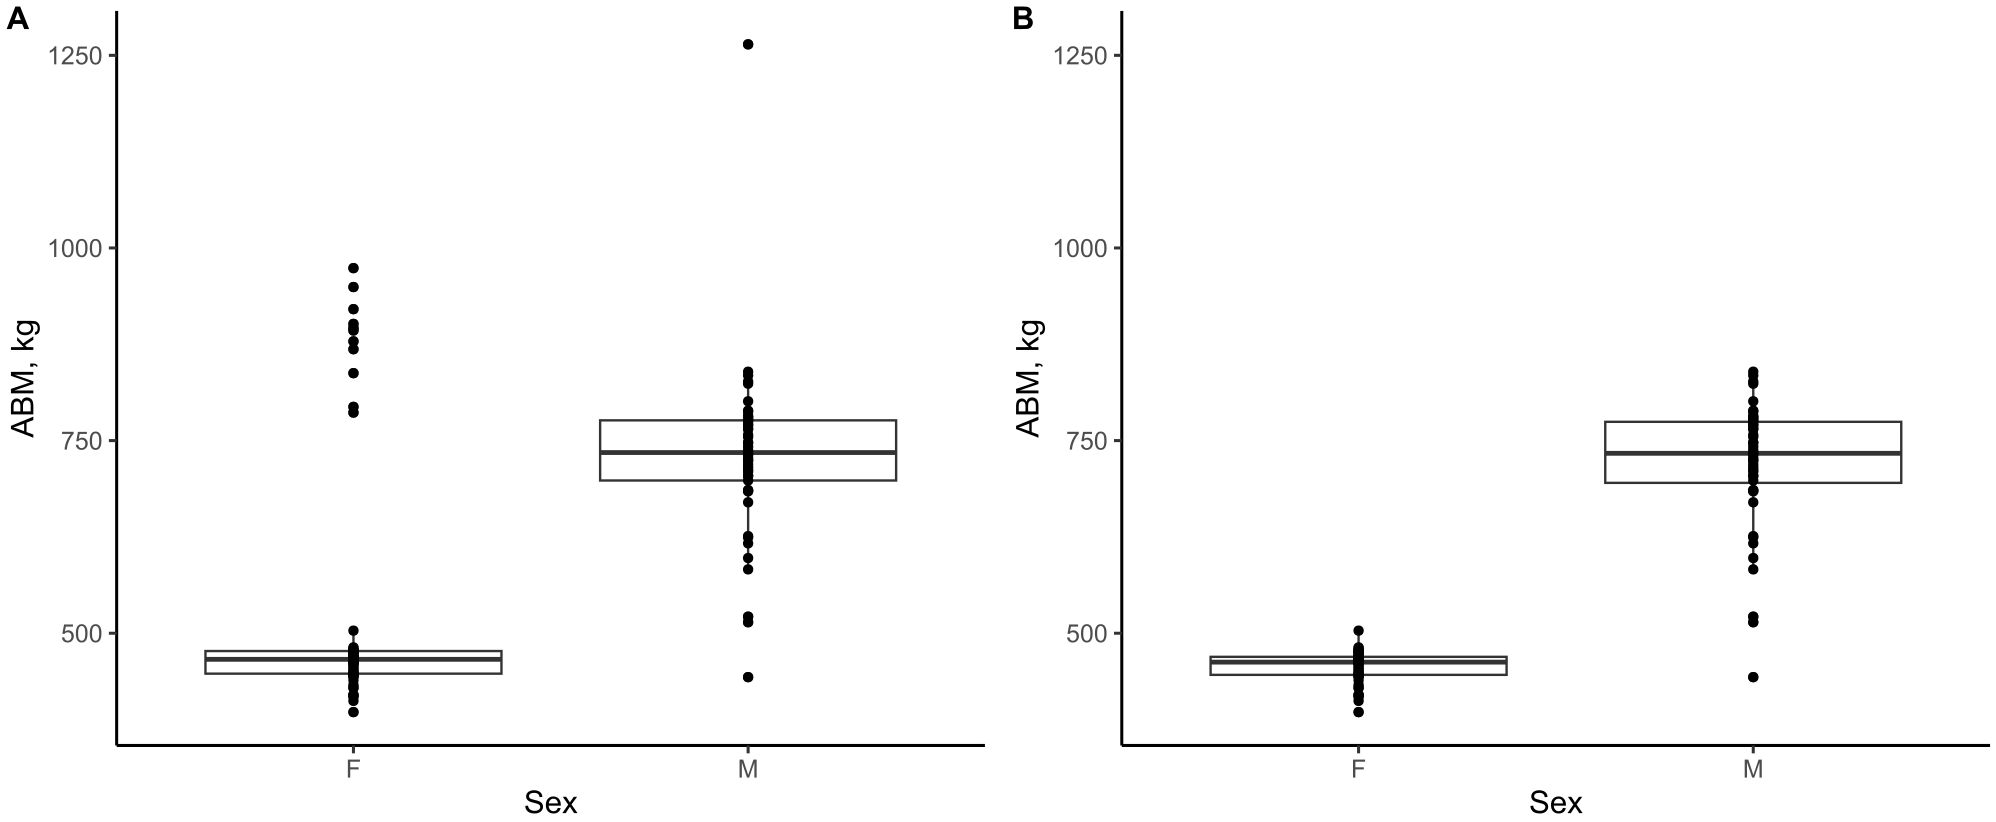
Figure 2. Sex-specific distributions of cohort asymptotic body mass (ABM; logistic-model coefficient d) before (A) and after (B) removal of biologically implausible outliers.
Two complementary validation analyses were conducted to assess the stability and robustness of the quinquennial models linking climate variables to sexual dimorphism and asymptotic body mass (ABM): (1) a leave-one-year-out (LOYO) cross-validation, and (2) a sliding-window analysis. The goal of these analyses was to determine whether the estimated climate–trait relationships were driven by specific years or arbitrary cohort boundaries, or whether they represented consistent, biologically meaningful patterns across time.
2.3.2.1 Leave-one-year-out analysis
To evaluate the stability of the quinquennial models, a leave-one-year-out (LOYO) cross-validation was performed. This approach systematically omits one year at a time from each quinquennial block, re-estimates model parameters, and compares the resulting fitted curves and vertex positions (maximum points) with those from the full quinquennial analysis. The objective was to determine whether the observed temperature- and precipitation-trait relationships were driven by specific years or represented consistent patterns across time.
The LOYO models produced nearly identical quadratic patterns, with minimal shifts in both the position and magnitude of the predicted maxima. This indicates that the fitted relationships are not driven by single-year effects but represent stable temporal patterns. The close correspondence between LOYO and quinquennial curves (particularly in the position of their peaks) supports the reliability of the original model fits.
Supplementary Figures SA, B; (Temperature and Precipitation vs. Dimorphism) and Supplementary Figures S2A–D; (Temperature and Precipitation vs. ABM) illustrate this consistency. In both figures, the LOYO-derived lines (red) closely overlap the quinquennial fits (black), with overlapping 95% confidence intervals. Such agreement across independent validation folds demonstrates that the estimated responses are stable and repeatable, confirming the robustness of the fitted models. Differences between the LOYO and quinquennial maxima were minimal—typically < 0.5°C or < 150 mm in the predictors and < 3% in the predicted values, indicating that the quinquennial grouping yields consistent parameter estimates across independent temporal subsets.
2.3.2.2 Sliding window analysis
To further evaluate the stability of the quinquennial models, a sliding-window analysis was performed as an additional validation step. This approach applies overlapping five-year moving windows advanced by one year at a time, enabling finer temporal resolution. The analysis was designed to test whether the observed climate–ABM relationships depended on the fixed five-year boundaries used to define quinquennial cohorts. By relaxing these boundaries, the sliding-window approach assesses whether the results represent true biological patterns rather than artifacts of temporal binning, thereby increasing the robustness of the detected climate signals.
The overall patterns closely paralleled those observed in the quinquennial analysis. As illustrated in Supplementary Figures S3, S4, both frameworks produced consistent quadratic responses of dimorphism and asymptotic body mass to temperature and precipitation. The curvature, direction, and approximate location of the vertices were nearly identical, confirming that the biological interpretations are robust to the chosen temporal resolution.
As seen in Supplementary Figure S3B, average precipitation was slightly higher under the sliding-window approach than under the quinquennial grouping. This deviation was largely attributable to an influential point at approximately 970 mm of average annual precipitation, rather than to a systematic biological trend. Consequently, the apparent increase in the precipitation or temperature values associated with maximal sexual dimorphism likely reflects this local influence rather than a meaningful ecological difference.
Given these similarities, the interpretation of climate–trait relationships remains consistent between the quinquennial and sliding-window frameworks. However, because overlapping windows introduce partial data reuse across consecutive estimates, the sliding-window approach can generate auto replication, which may produce an artificial sense of precision. For this reason, and because the quinquennial grouping provides a more parsimonious, independent, and interpretable structure, the quinquennial analysis was adopted as the preferred framework for inference.
2.3.3 Environmental data compilation
To explore climate effects on body size, we gathered climate data for each of the 14 herd locations over the study period. We obtained mean annual temperature (MAT; °C) and mean annual precipitation (MAP; mm) from the GHCN Daily NOAA weather and climate databases using the R package ‘rNOAA’ (Chamberlain, 2023). For consistency with the cohort approach, and given the limitations of the dataset (uneven individual weight records per year), we averaged these climate variables over the same quinquennial intervals corresponding to our cohort definitions at each location (Supplementary Figures S5, S6), and only reported climate data for quinquennial intervals in which corresponding body mass data were available. Additionally, because bison typically take several years to reach maturity, multi-year climate means provide a biologically meaningful timescale for evaluating growth responses.
2.3.4 Environmental correlations with body size and sexual dimorphism
We examined the relationships between MAT and MAP with bison ABM using quadratic regressions. Additionally, we assessed how climate influenced sexual dimorphism (calculated as the ratio of male ABM to female ABM for each cohort-location) by modeling its relationship with MAT and MAP using the same regression approach. Model fits were assessed via R² and residual diagnostics, and the ‘ggplot2’ package of R was used for visual interpretation (Wickham et al., 2024). All statistical analyses were conducted in R, and significance was judged at the α = 0.05 level.
2.3.5 Translocation data analysis
We used animal transfer records to analyze growth dynamics associated with translocation events among the ranch sites. Animal growth data comprising individual ID, date, translocation status, weight, sex, age, and site identifier were imported into R statistical software (v.4.3.0) and processed using the ‘tidyverse’ package (Wickham et al., 2019). Dates were standardized, and calendar years were extracted using the ‘lubridate’ package (Grolemund and Wickham, 2011). The dataset was filtered using ‘dplyr’ (Wickham, 2015) functions to include only records involving actual translocations, and animals lacking valid identifiers were excluded. Translocations were further refined to include only movements between recognized origin and destination locations. Animal translocation flows were summarized and visualized using the ‘visNetwork’ package (Almende et al., 2019), employing the force-directed layout ‘forceAtlas2Based’ (Jacomy et al., 2014) to clearly and interactively represent translocation frequencies. For logistic growth analyses of translocation effects, subsets of female animals were extracted for each origin–destination pair with at least 50 recorded translocations, partitioned into three phases: pre-movement (origin), during transfer (translocated), and post-movement (destination). Logistic growth curves (three-parameter log-logistic, L.3() from the ‘drc’ package) were fitted separately to each subset, and estimated asymptotic body mass (ABM; parameter d) values were extracted for comparative analysis. Only subsets with sufficient data (≥10 animals per group) and valid model fits were retained; final ABM estimates and fitted curves were visualized using ‘ggplot2’ and interactive ‘plotly’ graphics (Sievert et al., 2021) to enable detailed exploration of growth performance differences attributed to animal translocation.
3 Results
3.1 Study herds and environmental variation
We analyzed data from 14 herd locations that had sufficient longitudinal data for climate analysis (Table 2; Supplementary Figures S5, S6). These herds covered a wide climatic gradient from cooler northern or high-elevation sites (e.g., Snowcrest and Red Rock) with MAT ranging between 4.6–5.7°C, to warmer southern sites (e.g., Armendaris and Ladder) ranging between 15–16.1°C. Mean annual precipitation varied substantially among ranches, from relatively drier sites such as Ladder (about 210–279 mm/year) and Red Rock (170–244 mm/year) to wetter sites including Spikebox, McMurtrey, and Z Bar, where precipitation reached approximately 411–707 mm/year (Table 2). Precipitation patterns fluctuated notably over time: several ranches (e.g., Bad River, Blue Creek, and Fawn Lake) exhibited peaks in precipitation during quinquennial 5 (2006–2010), followed by declines in quinquennial 6 (2011–2015). Similar patterns occurred at southwestern locations (e.g., Armendaris and Ladder), which showed increased precipitation during quinquennial 5 and subsequent declines (Table 2).
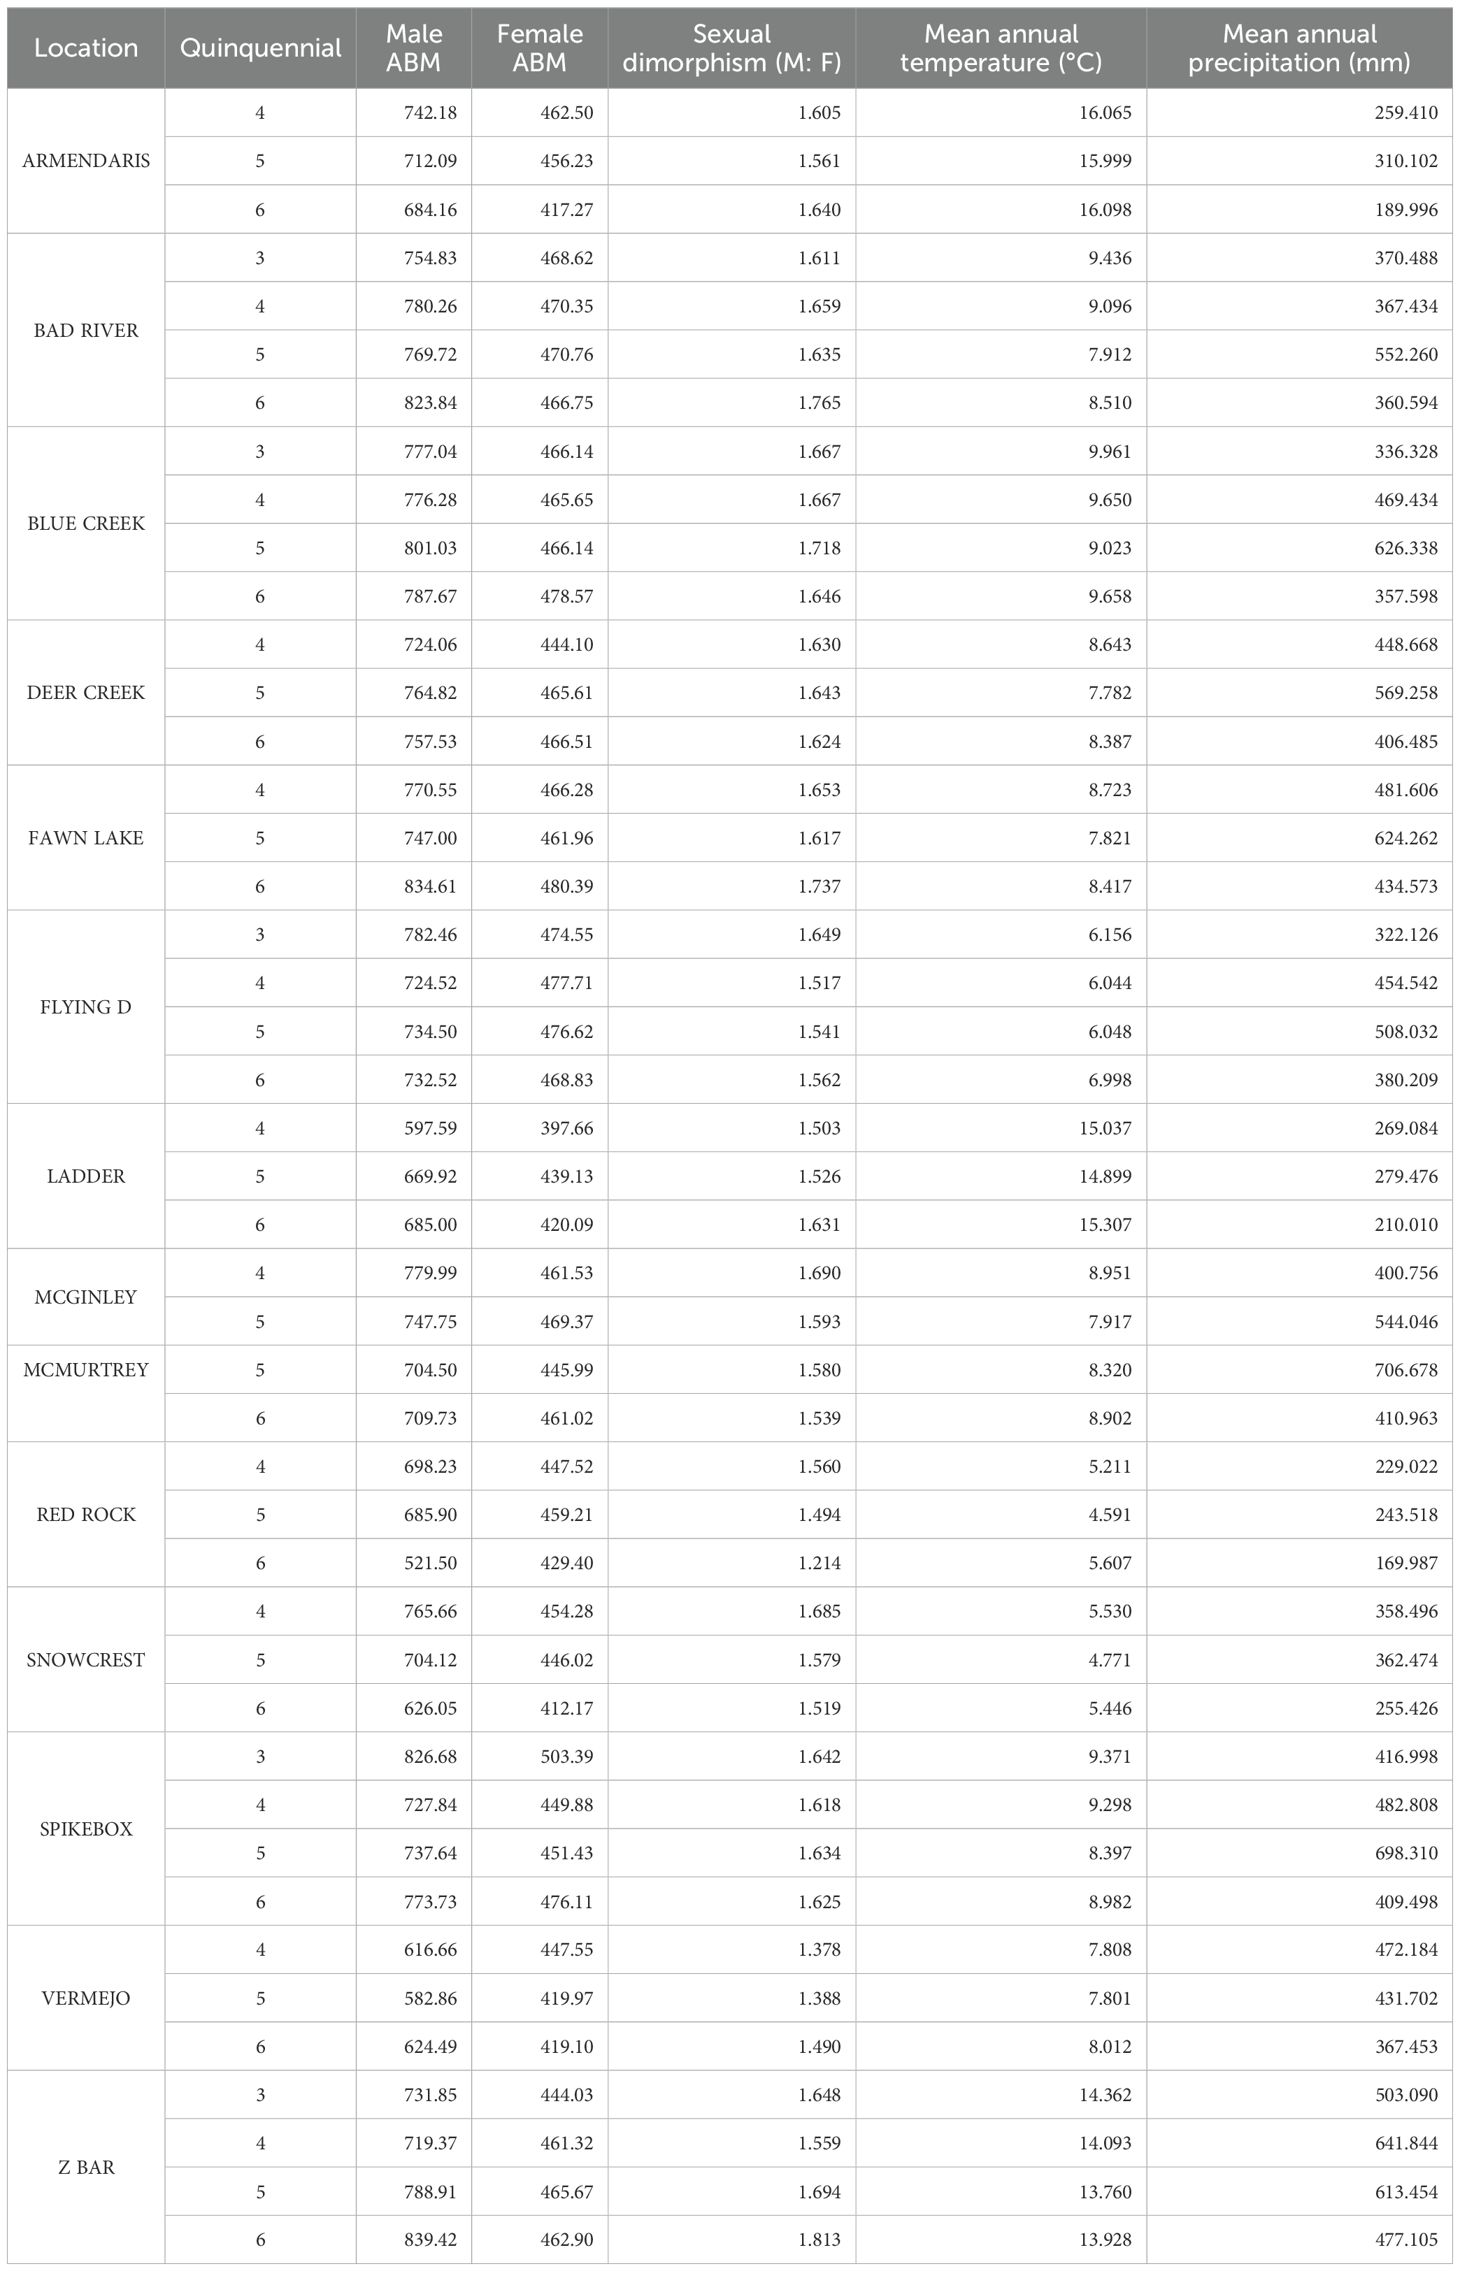
Table 2. Asymptotic body mass and sexual dimorphism trends in male and female bison across locations and climate variables, by quinquennial periods.
3.2 Spatial and cohort patterns in body size
Bison asymptotic body mass (ABM) varied significantly among herd locations and birth cohorts (Table 2; Figure 3). At northern locations with cooler climates (e.g., Flying D, Snowcrest, Red Rock), male ABM generally declined over time, dropping from 698–782 kg in earlier cohorts (quinquennials 3 and 4; late 1990s to early 2000s) to approximately 521–732 kg by quinquennial 6 (early 2010s; Table 2). Females in these northern herds showed a similar trend, with ABM decreasing from 447.5-477.7 kg to approximately 412–469 kg. At central locations with intermediate climates (e.g., Bad River, Blue Creek, Fawn Lake, Deer Creek, McGinley, Spikebox, and McMurtrey), body sizes were relatively stable or slightly increased over time; males ranged between 725–780 kg in earlier cohorts to around 747–839 kg in later cohorts, and females increased slightly from about 445–470 kg to around 461–480 kg (Table 2). Southern sites (Armendaris, Ladder, Vermejo, Z Bar) showed mixed patterns, with some herds decreasing in size over time (Armendaris: males from 742 to 684 kg; females from 462 to 417 kg), whereas others, like Z Bar, showed notable increases (male ABM increased from about 719 kg in quinquennial 4 to 839 kg in quinquennial 6 (Table 2). Despite cohort-level shifts, the regional size hierarchy remained stable: northern herds generally exceeded southern herds in body size throughout the study. Additionally, a linear regression detected no significant temporal trend in ABM for either sex across herds or quinquennials (Supplementary Figure S7).
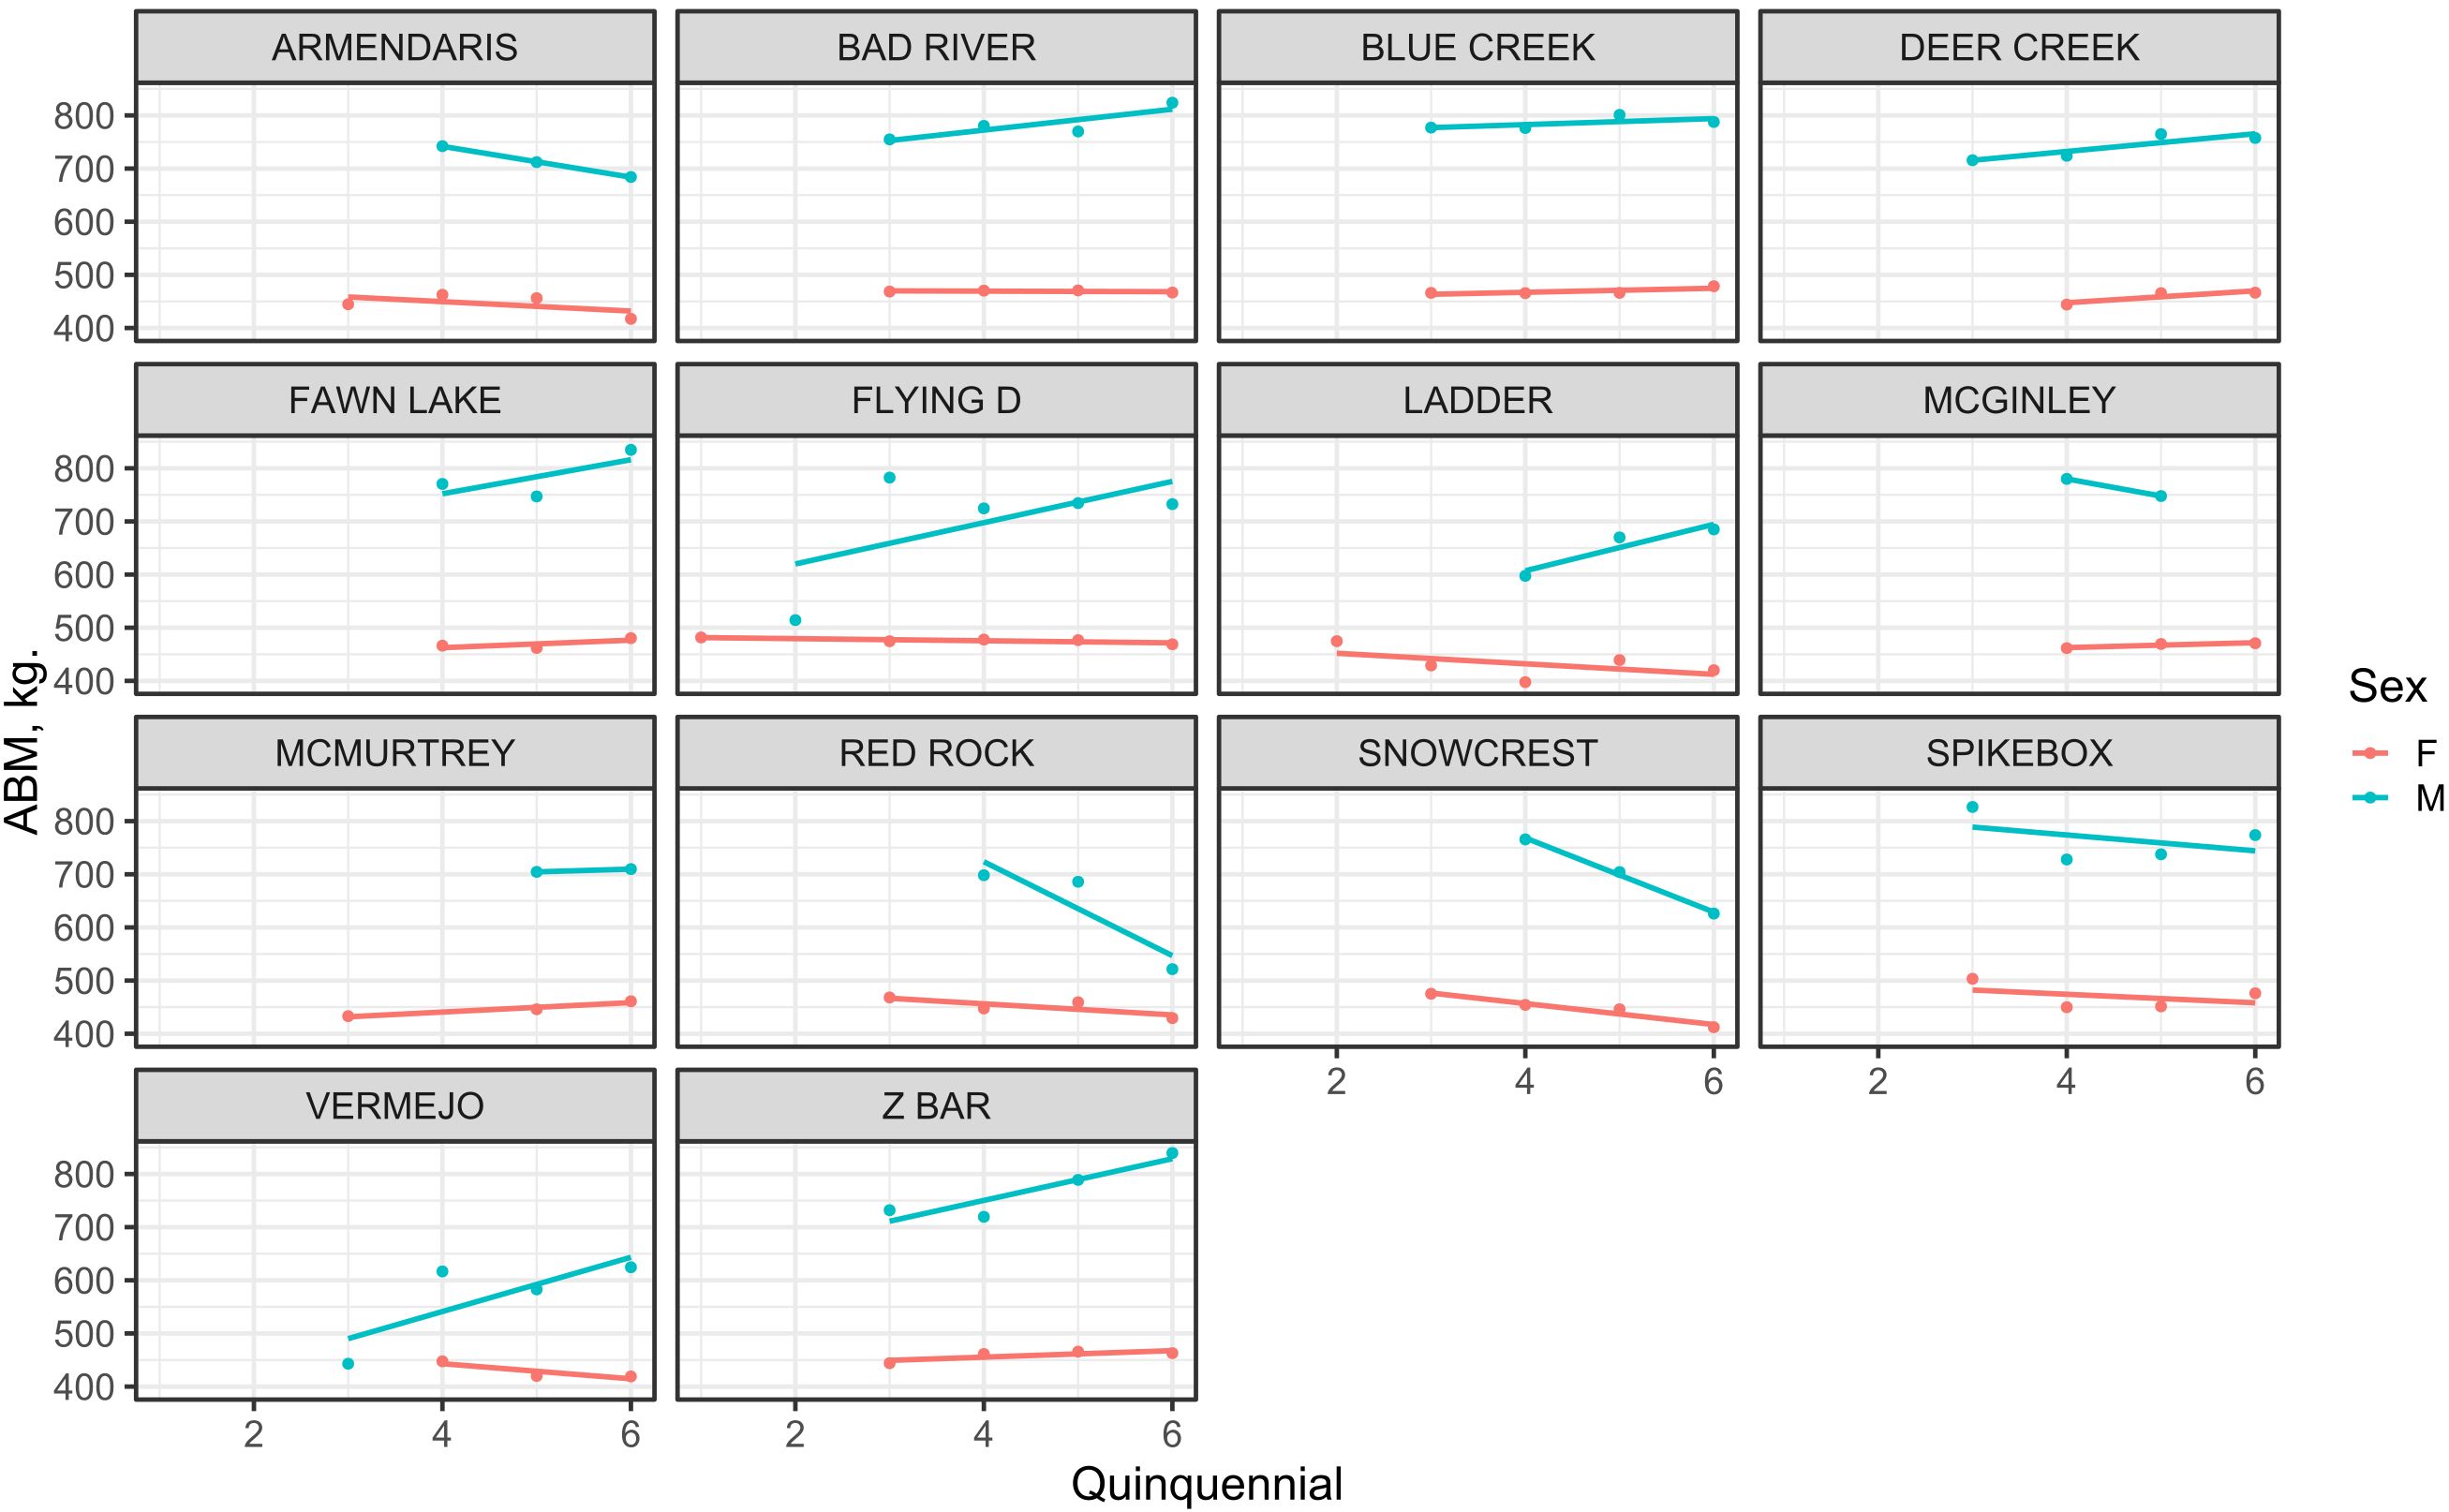
Figure 3. Sex-specific trends in asymptotic body mass (ABM) across quinquennial birth cohorts for each bison herd location (n = 14). Blue lines represent males, and red lines represent females. Each point corresponds to the estimated ABM for a specific cohort × location × sex combination.
3.3 Sexual size dimorphism trends
The sexual dimorphism ratio changed over time across herds (Table 2; Figure 4). In general, sexual dimorphism increased in populations where males either grew larger or maintained their size while females declined, and it decreased in populations where male size declined more sharply than female size. For instance, at Ladder Ranch in the Southwest, male ABM increased notably over time from 597.6 kg to 685 kg, while female ABM rose more modestly from 397.6 kg to 420 kg. As a result, sexual dimorphism (male-to-female ABM ratio) increased from 1.5 in earlier cohorts to 1.6 in more recent ones (Table 2).
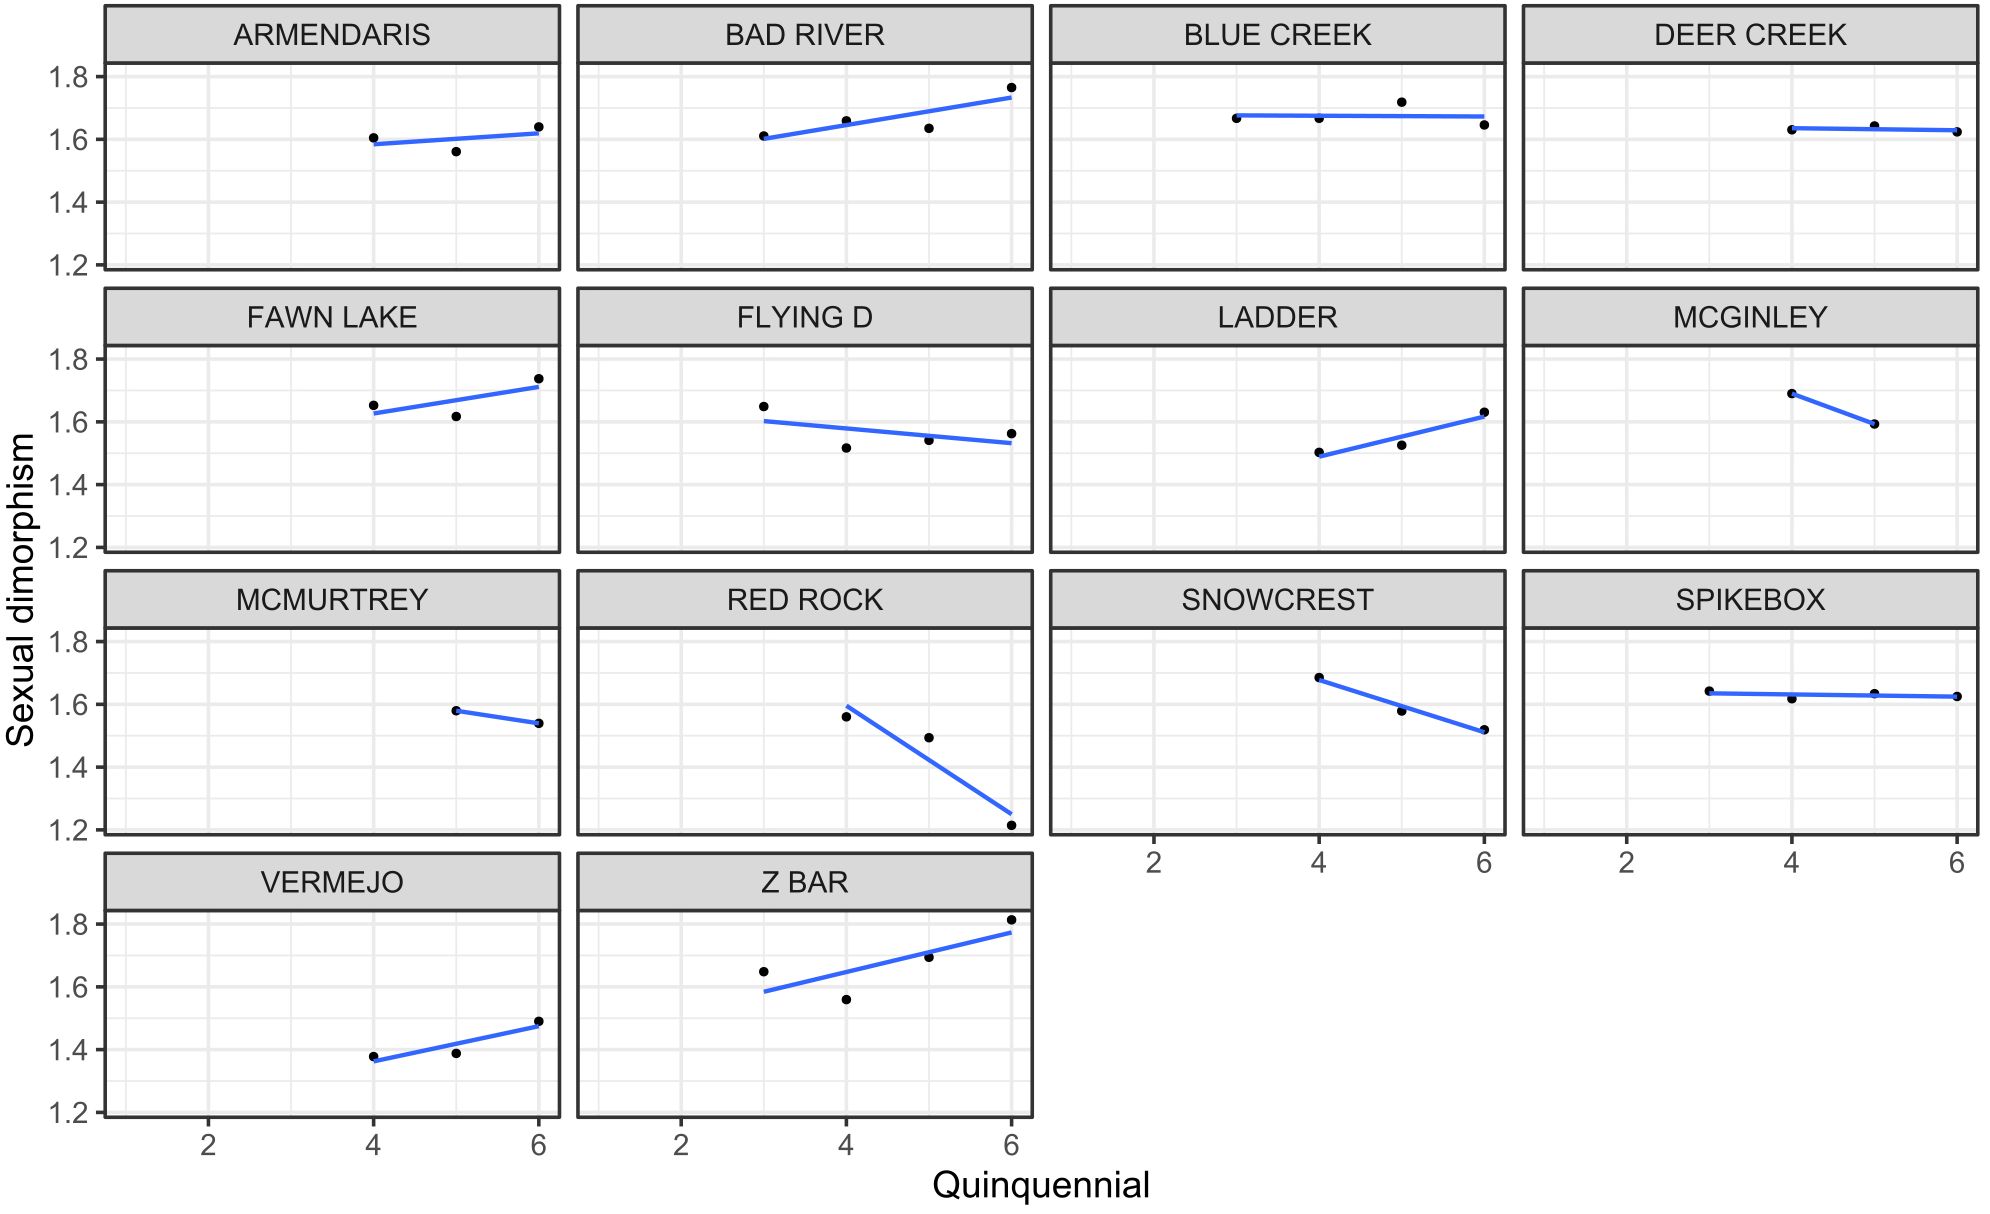
Figure 4. Temporal trends in sexual dimorphism, expressed as the male-to-female ratio of asymptotic body mass (ABM), across quinquennial birth cohorts for each herd location (n=14).
3.4 Climate relationships with body size and sexual dimorphism
Regression analyses showed statistically significant quadratic relationships (inverted parabola) between ABM and MAP for males (Figure 5A; p = 0.007) and females (Figure 5B; p = 0.002) and between ABM and MAT for males (Figure 5C; p = 0.003) and females (Figure 5D; p = 0.007). A statistically significant quadratic relationship was observed between the sexual dimorphism ratio and MAT (Figure 6A; p = 0.015); however, no significant relationship was detected with MAP (Figure 6B; p = 0.092). Both male and female body mass increased notably from the lowest precipitation conditions (>300 mm), reaching maximum body weights around intermediate to high levels (500–650 mm). Beyond this precipitation optimum, body sizes slightly declined at the highest observed precipitation levels (>700 mm MAP). While both sexes exhibited this pattern, males showed a slightly more pronounced decline or leveling off at very high precipitation compared to females.
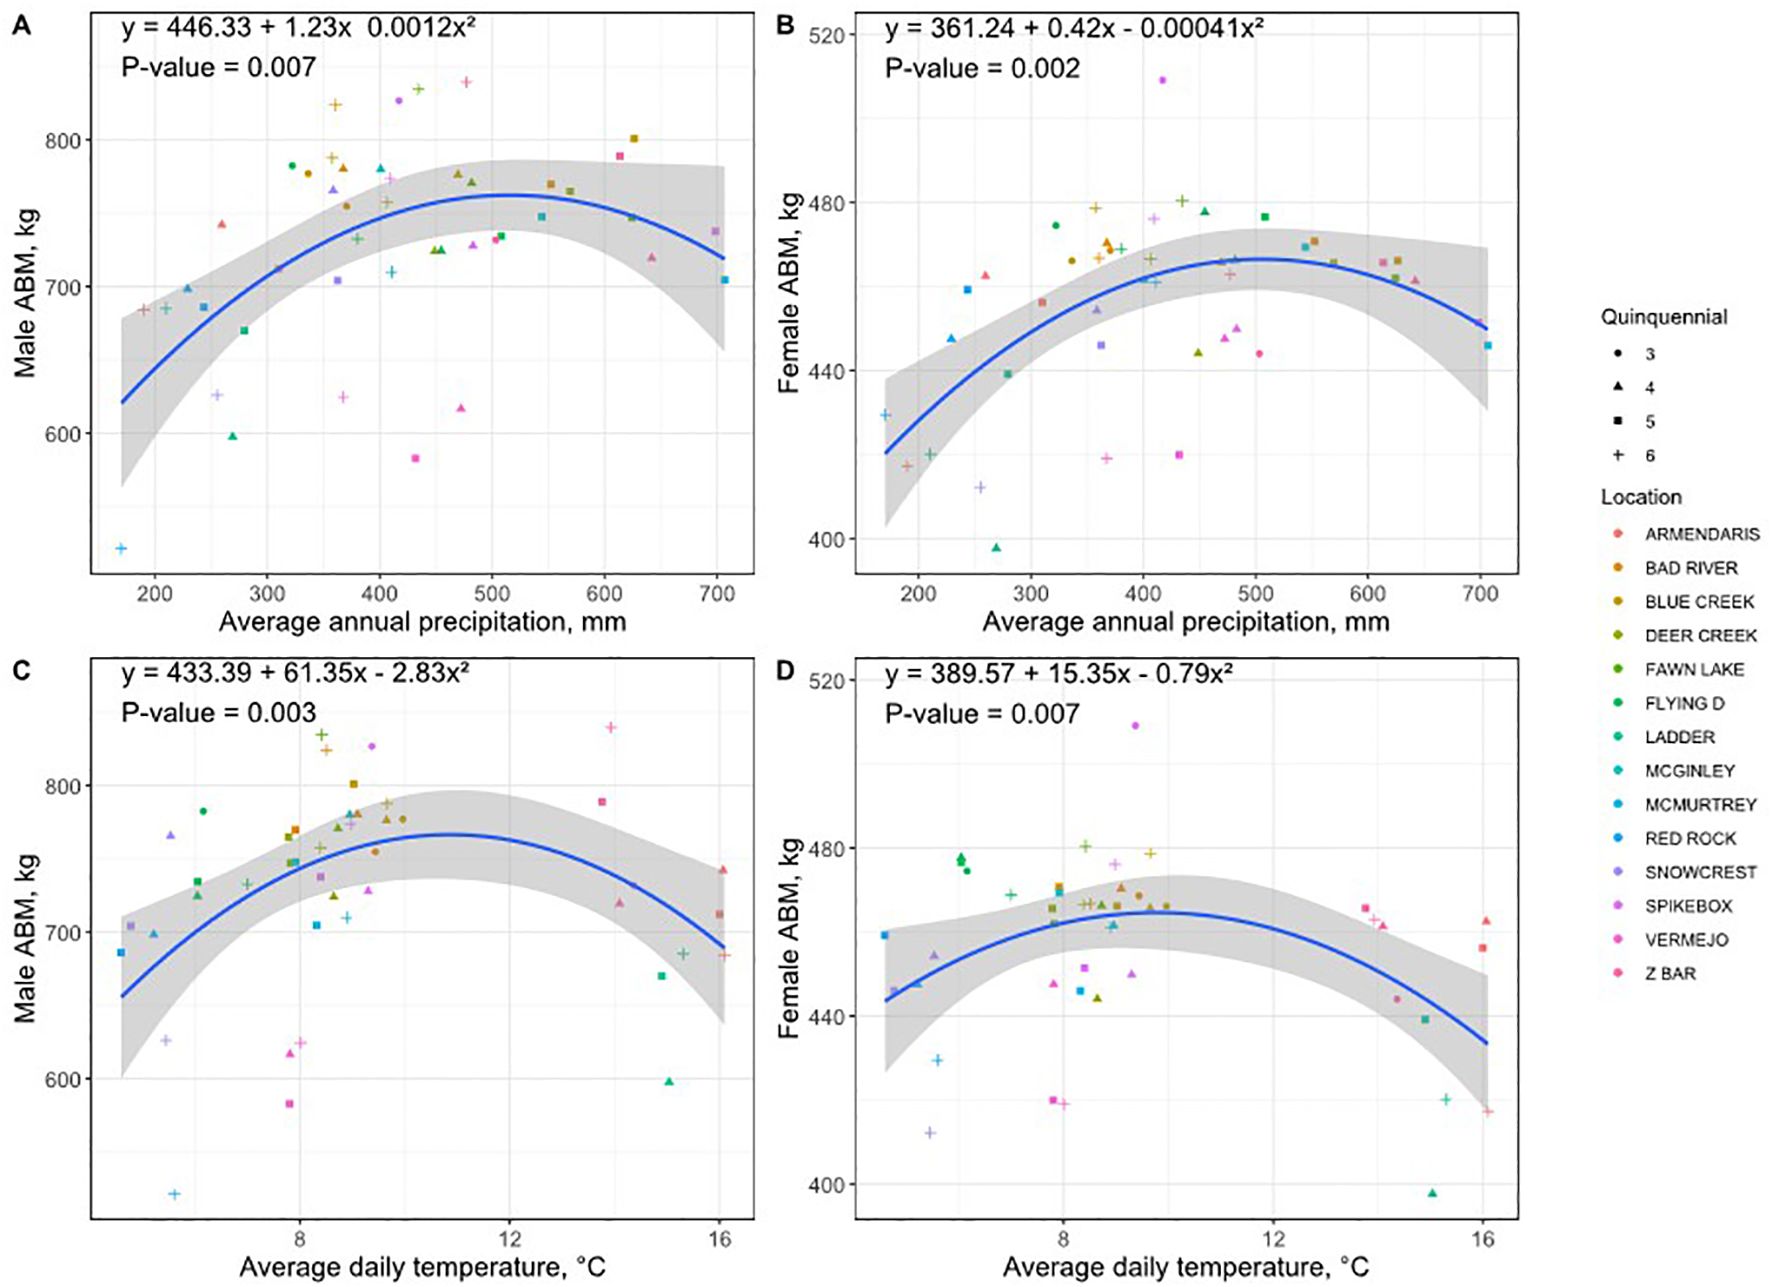
Figure 5. Quadratic relationships between asymptotic body mass (ABM, kg) and climate variables: MAP mm: panels (A, B); and MAT °C: panels (C, D), shown separately for males (A, C) and females (B, D). Blue lines represent quadratic regression fits ( ± 95% confidence interval).
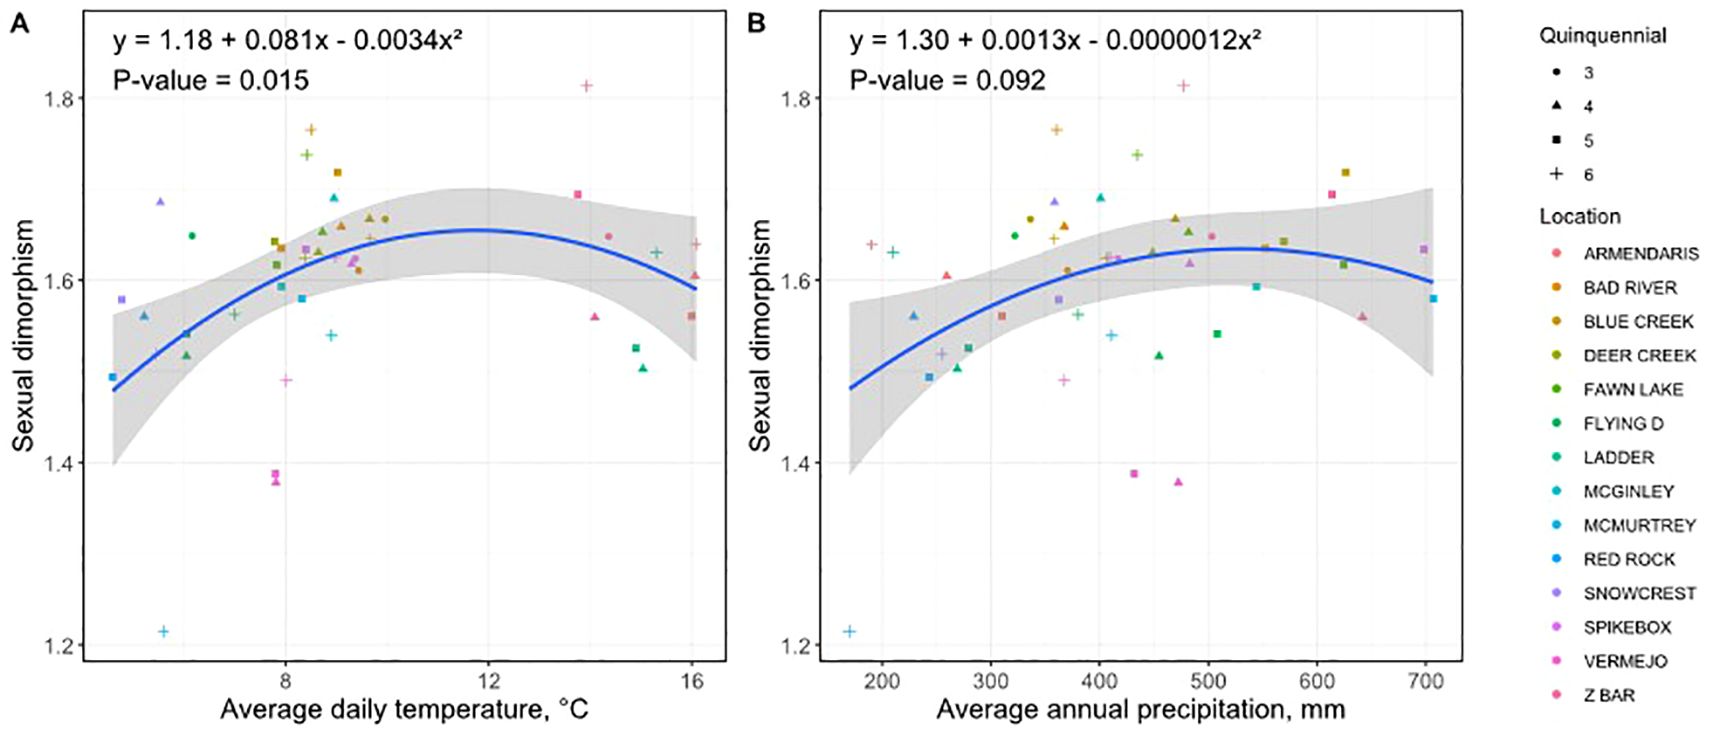
Figure 6. Quadratic relationships between sexual dimorphism in bison and climate variables: (A) mean annual temperature (MAT, °C) and (B) mean annual precipitation (MAP, mm). Blue lines represent quadratic regression fits ( ± 95% confidence interval).
Additionally, bison achieved maximum ABM at moderate temperatures (10-12°C MAT), with body mass reductions occurring toward both colder (5-6°C MAT) and warmer (15-16°C MAT) temperature extremes. As with precipitation, males showed a more noticeable reduction in ABM at higher temperatures compared to females.
The dimorphism ratio was highest within moderate climate conditions, reaching a maximum (1.65) at intermediate precipitation (500–650 mm MAP) and temperature (10–12°C MAT). Reduced sexual dimorphism occurred at both the lower and higher extremes of temperature and precipitation, indicating that environmental conditions influencing absolute body size similarly affected relative size differences between sexes.
3.5 Effects of translocation on bison ABM
We evaluated how bison translocation between ranches influenced growth patterns, focusing on asymptotic body mass (ABM) as the main outcome.
3.5.1 Male translocations
Translocation records for male bison totaled 1,451 entries, with most of them (~74%) lacking unique individual identifiers, primarily reflecting movements between 1999 and 2007 (Table 3). Due to the absence of unique IDs, analysis were conducted at the data-entry level rather than the individual level. Translocations involved all 14 ranches, with Spikebox receiving the highest number of entries (Supplementary Table S1; Supplementary Figure S7). The most prominent route was from Vermejo to Spikebox, accounting for 1,068 movement records representing the most frequent connection among all sites (Supplementary Figure S8). Other inbound translocations to Spikebox originated from Deer Creek (21) and McMurtrey (20), while Vermejo, Z Bar, Flying D, and Bad River functioned as both sending and receiving nodes, forming a dense network of male bison redistribution during the early herd development period. Due to the individual-level movement limitations in the male dataset, the analysis was restricted to translocation records based on data entries only without further growth assessments. This limitation largely reflects that most bison males are mainly translocated for slaughter, resulting in very few individual weight records. Therefore, the translocation results from females shown in the following section cannot be generalized to males, given the limited availability of male records.
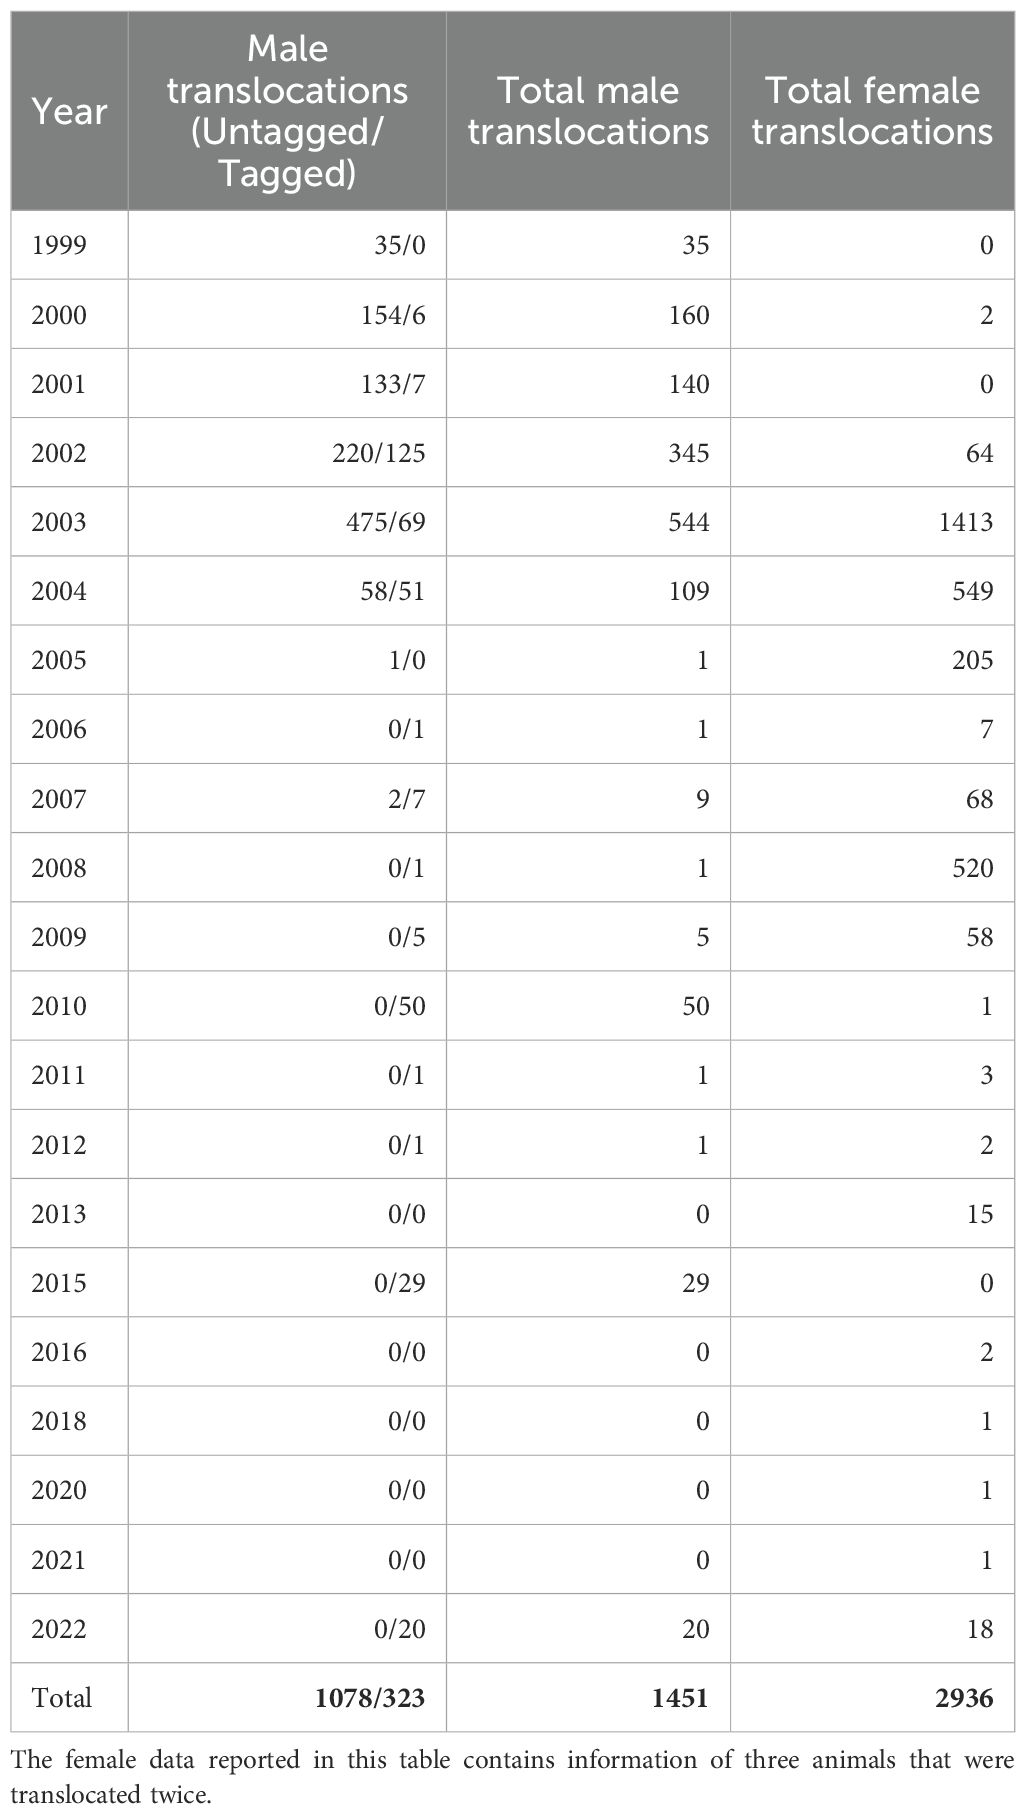
Table 3. Yearly record of male and female bison translocation events.
3.5.2 Female translocations
A total of 2,930 translocation events involving uniquely tagged female bison were retained after filtering for animals moved between the 14 primary ranch sites. These movements connected multiple locations, with Z Bar appearing as a dominant destination in several routes (Supplementary Table S2; Supplementary Figures S9, S10). Of the evaluated routes with sufficient sample sizes and valid model fits, nine origin–destination pathways were included in the ABM comparison analysis (Figure 7).
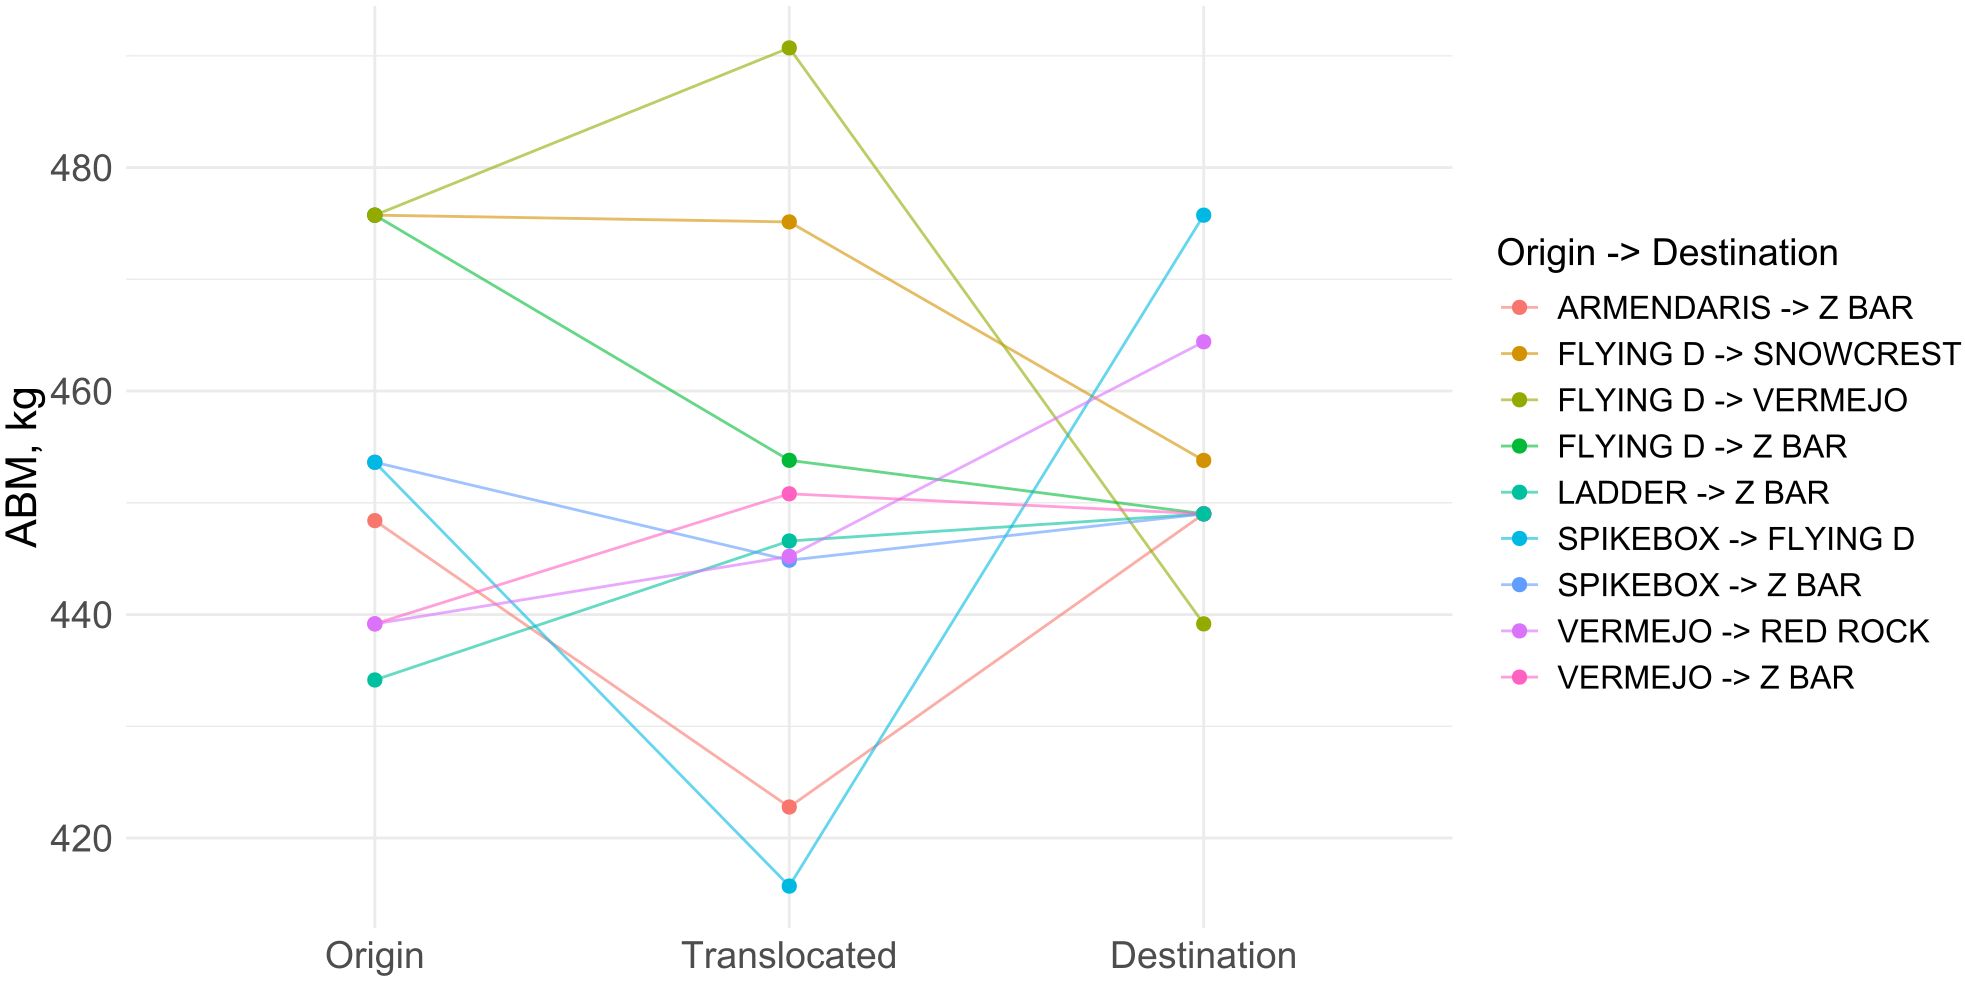
Figure 7. Comparison of adjusted female asymptotic body mass (ABM) along nine principal translocation routes after exclusion of a single extreme outlier. Points mark cohort-level ABM at the origin, during the translocated phase, and at the destination; colored lines trace each movement pathway.
In the Flying D to Snowcrest route, animals born at Flying D had an estimated ABM of 475.7 kg, while translocated individuals averaged 475.1 kg. Non-translocated animals at Snowcrest had an ABM of 453.8 kg. A similar pattern emerged in the Flying D to Z Bar route, where origin animals had an ABM of 475.7 kg, the translocated group averaged 453.8 kg, and the destination population 449 kg. Likewise, in the Spikebox to Z Bar route, the origin ABM was 453.6 kg, the translocated group averaged 444.9 kg, and the destination 449 kg. In all cases, translocated animals had lower ABMs than their origin counterparts and more closely resembled the ABM of animals at their destination site.
Other translocation pathways revealed more variation in ABM outcomes. In the Armendaris to Z Bar route, the ABM of translocated animals (422.8 kg) was lower than both the origin ABM (448.4 kg) and the destination ABM (449 kg). In contrast, bison translocated from Vermejo to Z Bar had a higher ABM (450.8 kg) compared to the origin group (439.2 kg) and slightly above the destination ABM (449 kg). The Flying D to Vermejo route also showed a higher ABM in translocated animals (490.7 kg) than in animals that remained at the origin (475.7 kg) or at the destination (439.2 kg).
For the Vermejo to Red Rock route, ABM values were 439.2 kg for origin animals, 445.2 kg for translocated animals, and 464.4 kg for destination animals. A similar pattern was observed in the Ladder to Z Bar route, with ABMs of 434.1 kg (origin), 446.6 kg (translocated), and 449 kg (destination). In the Spikebox to Flying D route, translocated animals had the lowest ABM (415.7 kg) compared to origin (453.6 kg) and destination (475.7 kg) animals. One additional route, from Armendaris to Vermejo, yielded an unusually high ABM of 787 kg for the translocated group, which substantially exceeded the origin (448.4 kg) and destination (439.2 kg) values. This route was excluded from the final comparison due to model instability caused by an extreme outlier (Figure 7).
4 Discussion
Climate warming is known to affect animal body size across many species. Numerous studies have shown that as temperature have risen, terrestrial mammals in particular have exhibited measurable declines in body size (Naya et al., 2017; Searing et al., 2023). Among these, bison have a well-documented history of size change in response to climate: during cooler periods bison grew larger, and as temperatures warmed, their body mass correspondingly was more diminutive. Indeed, fossil evidence show that Pleistocene bison were substantially larger during glacial periods (approximately 37% heavier during the Last Glacial Maximum which was on average 6°C cooler than the 20th century average) and that over long timescales bison body mass declined about 41 kg for each 1°C increase in global temperature (Martin et al., 2018). As evidence supporting this theory continues to grow, investigating current trends and evaluating their implications is becoming increasingly important in the context of bison conservation and production management.
4.1 Temporal trends in body mass over two decades
The results of our analysis of performance data from multiple bison herds across the early 21st century reinforce the strong association between body size and environmental conditions, extending previous findings across a broader spatial range (Martin and Barboza, 2020a). Patterns in asymptotic body mass (ABM) varied among regions and cohorts, with northern herds generally attaining larger body sizes than those in warmer, drier southern environments. These spatial differences are consistent with climate–size relationships documented in bison and other large mammals, where temperature and precipitation gradients shape growth potential and metabolic constraints (Mccain et al, 2014; Craine et al., 2015). While temporal fluctuations occurred within individual herds, they did not follow a consistent directional trend at the system level, suggesting that geographic and climatic context exert a stronger influence on body size than temporal changes within the observed period.
4.2 Climate effects on bison body size
Consistent to earlier reports, our results show a strong and nonlinear relationship between climate and bison body size, reinforcing their generality across geographically distinct herds. Bison reached their largest sizes in regions with intermediate temperatures (~10°C) and moderate annual precipitation (~500mm). In contrast, animals in both hotter/drier and colder/wetter environments tended to be smaller. This parabolic pattern, supported by quadratic models, not only reflects where conditions are tolerable, but also may highlight the narrow climate space where bison can thrive physiologically.
The consistent decline in size outside this optimal zone suggests that growth potential is not just temperature dependent, but potentially resource mediated. In drought-prone regions, forage availability and quality limit nutritional intake, while metabolic stress from accumulated heat loads may further constrain weight gain (Craine et al., 2015). For example, bison residing in a warmer, drier prairie in Kansas were found to rely more on low-protein shrubs and forbs, and averaged about 227 kg lighter than counterparts in a cooler, wetter South Dakota prairie (Craine et al., 2015). At the other extreme, cold or highly seasonal environments shorten growing seasons and elevate maintenance costs, forcing trade-offs between survival and growth. Recent work in cattle systems has shown that secondary production peaks at intermediate precipitation levels and tends to decline during particularly wetter years, in part due to associated shifts in forage quality (Raynor et al., 2024). Taking these findings together, what emerges is a potential optimal climatic habitable zone or a set of environmental conditions where energy intake and expenditure are balanced in ways that allow bison to reach their full growth potential.
This pattern further illustrates the environmental plasticity of bison growth, consistent with climate-size responses observed in other large mammals (McCain and King, 2014). Rather than all herds following a fixed trajectory, body size appears responsive to local conditions, either declining or increasing in concert with climate. Such plastic responses are the norm in wild mammals; reviews of climate-driven trait changes find that nearly all documented shifts in body size are due to short-term plasticity rather than rapid evolution (Boutin and Lane, 2014). That responsiveness, however, may have limits. The fact that even genetically mixed and well-managed herds consistently show smaller sizes in harsher climates suggests that environmental constraints override both management interventions and genetic diversity. Climate appears to shape growth outcomes, but climate also appears to set the upper boundaries of what is biologically possible under current local conditions (Boutin and Lane, 2014).
Importantly, the relationship we observed should not be viewed as a simple, gradual trend. The non-linear nature of the pattern suggests that there may be threshold effects and that further changes in temperature and precipitation may have a more pronounced impact on body size that may not be remediated with simple changes to management practices. Recent comparative analyses across birds and mammals show that body size shrinks most dramatically as populations approach their species’ thermal and aridity tolerance limits (Watson and Kerr, 2025). If climate conditions continue to shift, particularly in already hot and dry regions such as the southern Great Plains and arid southwest, more herds could begin to experience stronger constraints on growth. While the long term outcomes remain uncertain, these findings suggest that continued environmental change may increasingly influence bison body size, with potential implications for reproduction, health, and population performance.
4.3 Changes in sexual dimorphism
Bison sexual size dimorphism also shifted with climate. Bulls are typically ~30-80% heavier than cows, but dimorphism was inconstant across herds. We found the greatest dimorphism in moderate, resource-rich climates, and much narrower dimorphism in extreme environments. In favorable conditions (warm-season grazing, adequate forage), males seems to capitalize on abundant resources and optimal thermoregulation to bulk up disproportionately relative to females. Conversely, under nutritional or thermal stress (very hot, arid or extremely cold winters), male growth is curtailed more than female growth. In fact, males appear considerably more sensitive to environmental stressors than females. A previous cross-herd study revealed that each 1°C rise in local mean annual temperature led to roughly a 13 kg decrease in adult male mass, versus about a 9 kg decrease in adult female mass (Craine, 2013). This male vulnerability to stress is biologically sensible: polygynous ungulates evolve large male size for competitive mating advantage, whereas females face stabilizing selection to maintain body reserves for reproduction regardless of conditions (Clutton-Brock et al., 1992; Clutton-Brock, 1988). Indeed, theoretical models and empirical studies in other mammals suggest that females often exhibit greater stress tolerance (for example, female-biased cold resistance) than males (Hangartner et al., 2022).
Our results support a key biological insight: male bison appear physiologically more vulnerable than females to environmental conditions that constrain growth. Females tend to maintain relatively stable sizes across environmental gradients, likely due to strong evolutionary pressures favoring reproductive efficiency over maximum body size. Males, however, have evolve to maximize growth when conditions allow, given the reproductive advantages of a larger body size. When face with nutritional or thermal stress males thus suffer more pronounce reduction in growth potential. It’s also worth noting that herd management practices may influence these patterns to some extent, as males are often culled at younger ages than females, potentially affecting observed trends in size and dimorphism. Nevertheless, the consistent sex-specific differences across herds suggest a genuine biological signal. Consequently, changes in sexual dimorphism may serve as early indicators of environmental stress, potentially preceding or amplifying overall body size trends in populations.
Shifts in dimorphism have important demographic implications. Reduced male size may alter mating dynamics and the genetic structure of herds. For instance, if fewer males reach the traditional competitive size, dominance hierarchies and breeding success could change or begin to experience cohort effects due to climatic periodicities related to increased interannual variation of drought and warming. Even if body size is primarily environmentally determined (Musani et al., 2006), smaller males may still produce smaller or slower-growing calves due to shared environmental conditions during development. In this sense, monitoring sexual dimorphism alongside mean body size could provide an early warning of population stress: a shrinking male-female size gap might predate declines in reproduction or health. As climate continues to change, the loss of historically pronounced male-biased dimorphism in bison herds could thus have ripple effects on herd dynamics, mating systems, and genetic diversity.
4.4 Asymptotic body mass patterns following bison translocation
Our analysis of translocated female bison provides the first multi-herd quantitative evidence of how translocation relates to asymptotic body mass, revealing variation that may reflect partial acclimation to new environments. Because we lack information on the exact timing of weight measurements relative to each translocation event, it is not possible to determine whether individual animals gain or lose weight as a direct result of being moved Additionally, weight data is often collected infrequently under standard industry practices which also limits the temporal resolution required to identify short-term responses to movement. However, by comparing ABM values across animals born at the origin, translocated animals, and those born at the destination, we can evaluate broader patterns that reflect environmental or management influences between herds.
Across many translocation pathways, we observed that translocated animals exhibited ABM values that fell between those typical of their origin and destination herds. For example, females moved from Ladder Ranch (origin ABM ~434 kg) to Z Bar (destination ~ 449 kg) had an intermediate ABM of approximately 446 kg. A similar pattern was observed for bison translocated from Spikebox (origin ABM ~453 kg) to Z Bar (destination ~449 kg), which may indicate partial convergence with the destination herd. In contrast, animals translocated from Flying D (~476 kg) to Vermejo showed a translocated ABM (~490 kg) that exceeded both the origin (~475 kg) and destination (~439 kg) cohorts, while bison from Spikebox moved to Flying D had markedly lower translocated ABM (~416 kg) despite originating and arriving in herds with higher asymptotic body masses. These examples highlight that translocated cohorts do not uniformly mirror their origin nor destination, and may instead reflect a combination of environmental acclimation, physiological stress, or management differences. These patterns align with broader findings from this study, which demonstrate strong climate associations with body size: bison in cooler and moderately wet environments tend to attain larger ABM. This context helps explain some of the translocation results: movements from arid or hotter regions (i.e., Ladder) to more temperate or productive areas (i.e., Z Bar) aligned with higher ABM values in the translocated cohort, while the reverse: moves from cooler, productive herds to harsher climates, often showed lower translocated ABMs.
The limited precision in measurement timing and sometimes infrequent weight data collection indicate that these observed trends are correlative rather than causal. It is also important to acknowledge that translocation is stressful. The capture, handling, and transportation of bison can induce acute stress or acquire illness such as shipping fever complex which result in feed withdrawal (McCorkell et al., 2013; Caven et al., 2022), which is well known to cause short-term weight loss in ungulates (Brandlová and Hejcmanová, 2022; Kannan et al., 2000; Letty, 2007). Many large mammals lose a few percent of their body weight during transport and take days to recover, depending on health and age (Caven et al., 2022). Although our dataset does not specifically analyze individuals over time, the fact that some translocated cohorts exceeded even their original herds’ masses may suggest partial acclimation to the destination environment. Nonetheless, without individual tracking, these results cannot confirm whether weight differences arise from immediate stress recovery, longer-term adaptation, or environmental effects. In practice, managers should monitor if body condition after moves sustained low weights as could indicate maladaptation to the new habitat. In sum, although our translocation results provide the first indicative that local environment plays a major role in determining bison body size, interacting with genetics and management, without consistent weight measurements before and after translocation events, a clearer assessment of short and long-term effects on growth performance, is still limited. Future data collection approaches should aim to implement standardized and repeated weight monitoring across herds, consistent metadata on management practices and strategies, and improved individual tracking to enable more integrated analyses that strengthen the accuracy of growth performance assessments.
5 Implications for bison conservation and management
Our findings underscore that environmental context and cohort differences are closely associated with ABM, even though we did not detect a consistent temporal trend across quinquennials. Body size in large herbivores is linked to fitness as it affects reproduction, survival, and the ability to cope with winters or droughts (Clutton-Brock et al., 1992; Clutton-Brock, 1988). Even without a system-wide trend, period and site-specific variation can be biologically meaningful for reproduction, survival, and seasonal resilience. In ungulates, heavier females generally have higher reproductive success and recruitment, and larger males tend to win more mates during breeding season. For example, well-nourished female bison are more likely to breed at a younger age and produce a calf annually (Green and Rothstein, 1991) whereas underweight or smaller females often experience delayed breeding or skip calving in bad years. Moreover, smaller females generally produce smaller calves and populations may increase at a slower pace as a result. Those lighter calves can face higher risks: nearly half of Yellowstone bison calves that survived to their first winter still died before reaching 2.5 years old (National Park Service, 2005).
Another concern is resilience to environmental change. Historically, bison could migrate long distances to find better forage during droughts or tough winters. In the pre-settlement era, millions of bison ranged freely and undertook migrations of hundreds of miles, tracking shifts in vegetation and rainfall (Craine et al., 2015). Today, most herds are confined to fenced reserves or limited ranges (Silveira et al., 2025). If climate change continues to diminish forage in a given area, the bison there cannot simply roam to new pastures. Managers may face difficult choices by either having to reduce herd sizes further (to match lowered food availability), intervene with supplemental feeding, or assist with habitat management (i.e. reseeding with drought-tolerant forage plants). In practice, some bison managers are already adapting on certain conservancies and ranches, stocking rates are being adjusted downward after multiple successive drought years to prevent overgrazing, and efforts are underway to maintain a mix of high-quality forage plants. Research by Craine et al., 2015 emphasizes that promoting plant biodiversity, including protein-rich forbs and browse, beyond graminoids alone, will be key to sustaining bison nutrition on warming, drying prairies. Based on our results, we also suggest proactive steps such as improving water availability (e.g., additional water sources on the landscape, especially for during droughts), planting more drought-resilient native plant species, and reducing herd densities ahead of expected bad years could help buffer the impacts of climate stress on body condition.
While this study integrates multiple drivers of body size variation in bison, limitations related to the structure of data restricted the ability to evaluate these factors simultaneously. Although these constraints limited our capacity to assess potential additive or interactive effects between cohort, climate, and translocation factors, on a broader ecological scale, our study adds to a growing body of evidence that larger herbivores are not immune to rapid environmental change. Just as smaller mammals and birds have been documented to shrink with rising temperatures (Searing et al., 2023), the North American bison, an icon of resilience, is showing signs of this vulnerability. This could have cascading effects on grassland ecosystems: bison play a keystone role in prairie ecology, and changes in their body size and condition might alter their allometrically-scaled life history traits such as grazing patterns and intensities, nutrient cycling, and interactions with other species (Peters, 1983b). If body sizes continue to drop, it may signal that grasslands habitats are under significant stress, potentially requiring intervention to preserve ecosystem balance.
6 Conclusion
Our analysis across multiple herds confirms strong spatial and climatic associations with ABM and reveals lasting cohort and translocation effects, but no consistent temporal trend in ABM across quinquennials for either sex. Animals from different cohorts and sites vary in size in ways that align with local temperature and precipitation regimes, and translocated animals often exhibit ABM values that reflect destination environments. Animals born in less favorable years (hotter, drier cohorts) tended to reach smaller asymptotic body masses, suggesting that early-life environmental conditions can have enduring effects on adult size. Similarly, patterns observed among translocated animals show that body mass often adjusts toward the environmental context of the destination herd, reflecting both physiological plasticity and local adaptation.
Although this study does not include wild or publicly managed herds, its findings provide a framework for understanding how ecological and environmental factors influence bison growth within conservation-aligned management systems, and reiterate an urgent message: as the planet warms and weather becomes more erratic, even large, long-lived animals like bison could undergo measurable morphological responses. Fortunately, this knowledge will help us to respond. By understanding that climate and climate-driven resource availability are key, bison managers and conservation practitioners can take proactive steps such as habitat improvements, flexible herd sizes, and possibly creating wildlife corridors to more favorable climates, to support bison populations. Ongoing research will be vital to continuing to track bison size, health, and genetics and can reveal whether these trends persist, accelerate, or reverse with future climate scenarios or management interventions. Bison once survived prehistoric climate changes by moving and adapting; now, under our confined stewardship, they will need informed management to weather the challenges in the remainder of the 21st century and beyond. Our study highlights the need for integrating climate adaptation strategies into conservation plans for bison and other large mammals, ensuring these iconic creatures remain robust and ecologically functional on prairies, wherever they may migrate to, for generations to come.
Data availability statement
The datasets presented in this article are not readily available because the data that support the findings of this study are not publicly accessible due to ownership and access restrictions. Interested readers may request access to the dataset by contacting the Turner Institute of Ecoagriculture (TIE) directly. Requests will be evaluated in accordance with TIE’s data-sharing policies. A pseudocode outlining the full analytical workflow is available in Supplementary Material – Appendix I. Requests to access the datasets should be directed to Carter Kruse at Q2FydGVyLktydXNlQHJldHJhbmNoZXMuY29t.
Ethics statement
Ethical approval was not required for the studies involving animals in accordance with the local legislation and institutional requirements because This study used historical animal weight records collected by participating ranches as part of routine management practices. No live animals were handled for the purposes of this research, and therefore institutional animal care and use approval was not required. Written informed consent was obtained from the owners for the participation of their animals in this study.
Author contributions
AF-R: Formal analysis, Writing – review & editing, Writing – original draft. HW: Writing – review & editing, Investigation. CR-C: Conceptualization, Writing – review & editing, Methodology, Data curation, Visualization, Software. AA: Writing – review & editing, Investigation. TB: Writing – review & editing, Conceptualization, Investigation, Resources. CK: Resources, Writing – review & editing, Investigation, Conceptualization. JB: Writing – review & editing, Investigation. JM: Methodology, Investigation, Data curation, Writing – review & editing, Supervision, Resources, Funding acquisition, Conceptualization, Project administration.
Funding
The author(s) declare financial support was received for the research and/or publication of this article. This work is supported in part by the USDA-NIFA Hatch project award no. 1026173 (JMM), the USDA-NIFA Multistate project award no. 7004803 (JMM), and AFR was supported in part by the Turner Institute of Ecoagriculture.
Acknowledgments
The authors thank the countless ranch managers and ranch hands that helped to collect the data for the Turner Enterprises over the past three decades. Without their continued efforts of recording these analog and digital data, this project and knowledge would not be possible. We particularly thank Mark Kossler and Scott Morrison for their irreplaceable contributions to understanding the legacy of management practices captured in this large dataset across Turner Enterprises bison ranches.
Conflict of interest
CK is the Director of Conservation and Science, and TB oversees all animal health-related matters at the Turner Institute of Ecoagriculture, which owns and provided access to the data used in this study.
The remaining authors declare that the research was conducted in the absence of any commercial or financial relationships that could be construed as a potential conflict of interest.
Generative AI statement
The author(s) declare that Generative AI was used in the creation of this manuscript. Generative AI was used in the preparation of this manuscript, specifically for code debugging, English syntax and grammar check.
Any alternative text (alt text) provided alongside figures in this article has been generated by Frontiers with the support of artificial intelligence and reasonable efforts have been made to ensure accuracy, including review by the authors wherever possible. If you identify any issues, please contact us.
Publisher’s note
All claims expressed in this article are solely those of the authors and do not necessarily represent those of their affiliated organizations, or those of the publisher, the editors and the reviewers. Any product that may be evaluated in this article, or claim that may be made by its manufacturer, is not guaranteed or endorsed by the publisher.
Supplementary material
The Supplementary Material for this article can be found online at: https://www.frontiersin.org/articles/10.3389/fevo.2025.1683267/full#supplementary-material
References
Allen J. A. (1877). The influence of physical conditions in the genesis of species. Radical Rev. 1, 108–140.
Almende B. V., Thieurmel B., and Titouan R. (2019). Package ‘Visnetwork.’ Network visualization using ‘Vis. Js’ Library. Version 2. Available online at: https://cran.hafro.is/web/packages/visNetwork/visNetwork.pdf (Accessed April 14, 2025).
Bergmann C. (1848). Über die Verhältnisse der Wärmeökonomie der Thiere zu ihrer Größe (Göttingen, Germany: Vandenhoeck und Ruprecht).
Boutin S. and Lane J. E. (2014). Climate change and mammals: evolutionary versus plastic responses. Evolutionary Appl. 7, 29–415. doi: 10.1111/eva.12121
Brandlová K and Hejcmanová P. (2022). Individual-Based assessment of post-Translocation fitness of ungulates: lessons from the critically endangered derby eland conservation programme. Conserv. Sci. Pract. 4, e128375. doi: 10.1111/csp2.12837
Burnham K. P. and Anderson D. R. (2004). Multimodel inference: understanding AIC and BIC in model selection. Sociological Methods Res. 33, 261–3045. doi: 10.1177/0049124104268644
Caven A. J., Leung K. G., Vinton C., Krohn B., Wiese J. D., Salter J., et al. (2022). A behavioral index for assessing bison stress level during handling and demographic predictors of stress response. J. Appl. Anim. Welfare Sci. 25, 41–53. doi: 10.1080/10888705.2021.1963250
Chamberlain S. (2023). Rnoaa:’NOAA’Weather data from R. R package version 1.4. 0 (Vienna, Austria: R Foundation for Statistical Computing). Available online at: https://CRAN.R-project.org/package=rnoaa (Accessed March 25, 2025).
Clutton-Brock T. H. (1988). Reproductive success: studies of individual variation in contrasting breeding systems (Chicago, IL, USA: University of Chicago Press).
Clutton-Brock T. H., Price O. F., and MacColl A. D. C. (1992). Mate retention, harassment, and the evolution of ungulate leks. Behav. Ecol. 3, 234–242. doi: 10.1093/beheco/3.3.234
Craine J. M. (2013). Long-term climate sensitivity of grazer performance: A cross-site study. PloS One 8, e67065. doi: 10.1371/journal.pone.0067065
Craine J. M., Towne E. G., Miller M., and Fierer N. (2015). Climatic warming and the future of bison as grazers. Sci. Rep. 5, 167385. doi: 10.1038/srep16738
Derr J. N., Hedrick P. W., Halbert N. D., Plough L., Dobson L. K., King J., et al. (2012). Phenotypic effects of cattle mitochondrial DNA in american bison. Conserv. Biol. 26, 1130–1136. doi: 10.1111/j.1523-1739.2012.01905.x
Doughty C. E., Wolf A., Morueta-Holme N., Jørgensen P. M., Sandel B., Violle C., et al. (2015). Megafauna extinction, tree species range reduction, and carbon storage in amazonian forests. Ecography 39, 194–203. doi: 10.1111/ecog.01587
Enquist B. J., Abraham A. J., Harfoot M. B. J., Malhi Y., and Doughty C. E. (2020). The megabiota are disproportionately important for biosphere functioning. Nat. Commun. 11, 6995. doi: 10.1038/s41467-020-14369-y
Gardner J. L., Peters A., Michael R., Kearney L. J., and Heinsohn R. (2011). Declining body size: A third universal response to warming? Trends Ecol. Evol. 26, 285–915. doi: 10.1016/j.tree.2011.03.005
Green W. C. H. and Rothstein A. (1991). Trade-Offs between growth and reproduction in female bison. Oecologia 86, 521–275. doi: 10.1007/BF00318318
Grolemund G. and Wickham H. (2011). Dates and times made easy with lubridate. J. Stat. Software 40, 1–25. doi: 10.18637/jss.v040.i03
Halbert N. D. and Derr J. N. (2008). Patterns of genetic variation in US federal bison herds. Mol. Ecol. 17, 4963–4775. doi: 10.1111/j.1365-294X.2008.03973.x
Hangartner S., Sgrò C. M., Connallon T., and Booksmythe I. (2022). Sexual dimorphism in phenotypic plasticity and persistence under environmental change: an extension of theory and meta-analysis of current data. Ecol. Lett. 25, 1550–1655. doi: 10.1111/ele.14005
Hardesty L., Hudson R., and White R. (1988). Bioenergetics of wild herbivores. J. Range Manage. 41, 270. doi: 10.2307/3899186
Hedrick P. W. (2009). Conservation genetics and north american bison (Bison bison). J. Heredity 100, 411–420. doi: 10.1093/jhered/esp024
Herskind C., Petersen H. H., Pertoldi C., Østergaard S. K., Kołodziej-Soboci M., Soboci W., et al. (2023). Effect of translocation on host diet and parasite egg burden: A study of the european bison (Bison bonasus). Biology 12, 680. doi: 10.3390/biology12050680
Huston M. A. and Wolverton S. (2011). Regulation of animal size by eNPP, bergmann’s rule, and related phenomena. Ecol. Monogr. 81, 349–4055. doi: 10.1890/10-1523.1
Jacomy M., Venturini T., Heymann S., and Bastian M. (2014). ForceAtlas2, a continuous graph layout algorithm for handy network visualization designed for the gephi software. PloS One 9, e986795. doi: 10.1371/journal.pone.0098679
Kannan G., Terrill T. H., Kouakou B., Gazal O. S., Gelaye S., Amoah E. A., et al. (2000). Transportation of goats: effects on physiological stress responses and live weight loss. J. Anim. Sci. 78, 1450–1457. doi: 10.2527/2000.7861450x
Letty J. (2007). Problems encountered by individuals in animal translocations: lessons from field studies. Ecoscience 14, 420–431. doi: 10.2980/1195-6860(2007)14%255B420:PEBIIA%255D2.0.CO;2
Licht D. S. and Johnson D. H. (2018). Influences of precipitation on bison weights in the northern great plains. Rangelands 40, 115–235. doi: 10.1016/j.rala.2018.07.001
Lovegrove B. G. and Mowoe M. O. (2013). The evolution of mammal body sizes: responses to cenozoic climate change in north american mammals. J. Evolutionary Biol. 26, 1317–1329. doi: 10.1111/jeb.12138
Martin J. M. and Barboza P. S. (2020a). Decadal heat and drought drive body size of north american bison (Bison bison) along the great plains. Ecol. Evol. 10, 336–495. doi: 10.1002/ece3.5898
Martin J. M. and Barboza P. S. (2020b). Thermal biology and growth of bison (Bison bison) along the great plains: examining four theories of endotherm body size. Ecosphere 11, e031765. doi: 10.1002/ecs2.3176
Martin J. M., Mead J. I., and Barboza P. S. (2018). Bison body size and climate change. Ecol. Evol. 8, 4564–4745. doi: 10.1002/ece3.4019
Martin J. M., Zarestky J., Briske D. D., and Barboza P. S. (2021). Vulnerability assessment of the multi-Sector north american bison bison bison management system to climate change. People Nat. 3, 711–225. doi: 10.1002/pan3.10209
McCain C. M. and King S. R.B. (2014). Body size and activity times mediate mammalian responses to climate change. Global Change Biol. 20, 1760–1695. doi: 10.1111/gcb.12499
Mccain C., King S., McCain C. M., and King S. R. B. (2014). Body size and activity times mediate mammalian responses to climate change. Glob Change Biol. 20, 1760–1769. doi: 10.1111/gcb.12499
McCorkell R. B., Wynne-Edwards K. E., Galbraith J. K., Schaefer A. L., Caulkett N. A., Boysen S. R., et al. (2013). Transport versus on-farm slaughter of bison: physiological stress, animal welfare, and avoidable trim losses. Can. Veterinary J. La Rev. Veterinaire Can. 54, 769–774.
McQueen A., Klaassen M., Tattersall G. J., Atkinson R., Jessop R., Hassell C. J., et al. (2022). Thermal adaptation best explains bergmann’s and allen’s rules across ecologically diverse shorebirds. Nat. Commun. 13, 4727. doi: 10.1038/s41467-022-32108-3
McQueen A., Klaassen M., Tattersall G. J., Ryding S., Wader Study Group, Australasian Wader Studies Group, Atkinson R., Jessop R, et al. (2024). Shorebirds are shrinking and shape-shifting: declining body size and lengthening bills in the past half-century. Ecol. Lett. 27, e14513. doi: 10.1111/ele.14513
Mundinger C., Scheuerlein A., and Gerald K. (2021). Long-term study shows that increasing body size in response to warmer summers is associated with a higher mortality risk in a long-lived bat species. Proc. R. Soc. B: Biol. Sci. 288, 20210508. doi: 10.1098/rspb.2021.0508
Musani S. K., Halbert N. D., Redden D. T., Allison D. B., and Derr J. N. (2006). Marker genotypes and population admixture and their association with body weight, height and relative body mass in United States federal bison herds. Genetics 174, 775–835. doi: 10.1534/genetics.106.057547
Naya D. E., Naya H., and Cook J. (2017). Climate change and body size trends in aquatic and terrestrial endotherms: does habitat matter? PloS One 12, e01830515. doi: 10.1371/journal.pone.0183051
National Park Service (2005). The bison of yellowstone national park (Summary). Available online at: https://npshistory.com/series/science/1/summary.htm (Accessed July 10, 2025).
Owen-Smith R.N. (1988). Megaherbivores : the influence of very large body size on ecology. With internet archive (Cambridge ; New York: Cambridge University Press). Available online at: http://archive.org/details/megaherbivoresin0000owen (Accessed March 25, 2025).
Peters R. H. (1983a). The ecological implications of body size (Cambridge, UK: Cambridge Studies in Ecology. Cambridge University Press). doi: 10.1017/CBO9780511608551
Peters R. H. (1983b). The ecological implications of body size (Cambridge, UK: Cambridge Studies in Ecology. Cambridge University Press). doi: 10.1017/CBO9780511608551
Raynor E. J., Derner J. D., Hartman M. D., Dorich C. D., Parton W. J., Hendrickson J. R., et al. (2024). Secondary production of the central rangeland region of the United States. Ecol. Appl. 34, e2978. doi: 10.1002/eap.2978
Ritz C., Baty F., Streibig J. C., and Gerhard D. (2015). Dose-response analysis using R. PloS One. 10, e0146021. doi: 10.1371/journal.pone.0146021
Searing K. B., Lomolino M. V., and Rozzi R. (2023). Melting climates shrink north american small mammals. Proc. Natl. Acad. Sci. 120, e23108551205. doi: 10.1073/pnas.2310855120
Sievert C., Parmer C., Hocking T., et al. (2021). Package ‘Plotly.’ (Vienna: R Foundation for Statistical Computing). Available online at: http://cran.uni-muenster.de/web/packages/plotly/plotly.pdf (Accessed August 10, 2023).
Silveira E. M. O., Olimb S., Plumb G. E., Martin J. M., Ranglack D. H., Jorgensen D., et al. (2025). Potential fence density in central and western north america and implications for bison (Bison bison) restoration. Biol. Conserv. 307, 111194. doi: 10.1016/j.biocon.2025.111194
Smith F. A., Smith E. A.E., Hedberg C. P., Lyons S. K., Pardi M. I., and Tomé C. P. (2023). After the mammoths: the ecological legacy of late pleistocene megafauna extinctions. Cambridge Prisms: Extinction 1, e9. doi: 10.1017/ext.2023.6
U.S. Fish & Wildlife Service (2025). Plains bison (Bison bison bison) (U.S. Fish & Wildlife Service). Available online at: https://www.fws.gov/species/plains-bison-bison-bison-bison (Accessed July 1, 2025).
Watson M. J. and Kerr J. T. (2025). Climate-driven body size changes in birds and mammals reveal environmental tolerance limits. Global Change Biol. 31, e702415. doi: 10.1111/gcb.70241
Watt C., Mitchell S., and Salewski V. (2010). Bergmann’s rule; a concept cluster? Oikos 119, 89–1005. doi: 10.1111/j.1600-0706.2009.17959.x
White P. J. and Wallen R. L. (2012). Yellowstone bison—Should we preserve artificial population substructure or rely on ecological processes? J. Heredity 103, 751–535. doi: 10.1093/jhered/ess050
Wickham H., Averick M., Bryan J., Chang W., McGowan L. D., François R., et al. (2019). Welcome to the tidyverse. J. Open Source Software 4, 1686. doi: 10.21105/joss.01686
Keywords: body size, bison, conservation, climate change, cohort effect, management, translocation
Citation: Fresno-Rueda A, Wolfe H, Ramirez-Camba C, Antaya A, Bragg T, Kruse C, Brennan J and Martin JM (2025) Climate and translocations drive spatiotemporal variation in growth and body size of North American bison (Bison bison). Front. Ecol. Evol. 13:1683267. doi: 10.3389/fevo.2025.1683267
Received: 10 August 2025; Accepted: 20 November 2025; Revised: 18 November 2025;
Published: 10 December 2025.
Edited by:
Miguel Ferrer, Spanish National Research Council (CSIC), SpainReviewed by:
Virginia Morandini, Department of Integrative Ecology, Doñana Biological Station, Spanish National Research Council (CSIC), SpainShilu Zheng, College of the Environment and Ecology, Xiamen University, China
Copyright © 2025 Fresno-Rueda, Wolfe, Ramirez-Camba, Antaya, Bragg, Kruse, Brennan and Martin. This is an open-access article distributed under the terms of the Creative Commons Attribution License (CC BY). The use, distribution or reproduction in other forums is permitted, provided the original author(s) and the copyright owner(s) are credited and that the original publication in this journal is cited, in accordance with accepted academic practice. No use, distribution or reproduction is permitted which does not comply with these terms.
*Correspondence: Anlly Fresno-Rueda, YWZyZXNub3JAdW1uLmVkdQ==; Jeff M. Martin, SmVmZi5NYXJ0aW5Ac2RzdGF0ZS5lZHU=