 Chanda J. Littles1*†
 Emily R. Russ2†
 Bertrand H. Lemasson3†Martin T. Schultz2†
 Kyle S. Tidwell1†Hans R. Moritz1Sean T. Carroll1
- 1U.S. Army Corps of Engineers, Portland, OR, United States
- 2U.S. Army Engineer Research and Development Center (ERDC), Environmental Laboratory, Vicksburg, MS, United States
- 3U.S. Army ERDC, Environmental Laboratory, Newport, OR, United States
We adopted a matrix framework to evaluate potential ecological benefits at beneficial use of dredged material (BUDM) placement sites. Monitoring protocols developed in California (U.S.A.) were adapted to solicit feedback on ecosystem functions and indicators most relevant for BUDM applications. We present feedback received in the context of estuaries and a large coastal river in the Pacific Northwest of the United States, though methods are easily transferable. Through a series of workshops, stakeholders were asked to identify and prioritize functions and indicators they deemed most applicable to BUDM assessment. From a stakeholder group of over 50 invitees representing 21 organizations, we received matrices from just under half (n=9). Matrix input often reflected collaborative feedback from multiple individuals within a single organization. Top ecosystem functions identified were support for protected species, sea level rise amelioration, nursery habitat, support for vascular plants, and nekton habitat. Top indicators selected for assessing those functions were the marsh vegetation, benthic infauna, water quality, distribution of submerged vegetation and macroalgae, and the marshplain elevation. Not all indicators were applicable to selected functions and there was high variability in the indicator prioritization. A final stakeholder workshop was held to discuss results and participants expressed support for monitoring indicators (e.g., biomass) with the greatest potential to capture changes in benefits across multiple ecological functions and over time. We demonstrate a process to facilitate ongoing stakeholder collaboration to proactively plan for evaluating ecological priorities and selecting relevant indicators that enable users to effectively monitor and quantify BUDM benefits.
1 Introduction
While the U.S. Army Corps of Engineers (USACE) has been dredging navigation channels for hundreds of years and beneficially reused approximately 155 million cubic yards of material since 2022 (RSMP, 2025), there are opportunities to improve how the economic benefits, costs, and environmental consequences of these activities are assessed and disclosed (Bolam and Rees, 2003). Advances in dredging technology have helped to mitigate both the economic costs and the environmental consequences of dredging projects. Nevertheless, dredging activities continue to engender controversy and improvements in stakeholder communication and transparency are needed to help address controversies. Many early engagement efforts pertaining to dredged material placement focused on communicating costs, risks, and tradeoffs when placing contaminated sediments (Lee et al., 1991; Cura et al., 2004; Hong et al., 2010). The accounting has evolved to include the ecological benefits of dredged material placement, which may include shoreline stabilization, beach nourishment, and habitat improvement. However, regulatory, technical, psychological, financial and organizational barriers may still make it challenging to implement beneficial use of dredged material (BUDM) projects at a regional scale (Ulibarri et al., 2020).
There are decision tools that focus on planning and building consensus around placement alternatives (Cura et al., 2004; Bates et al., 2015; Arreola et al., 2022; Keil et al., 2022) or evaluating sediment suitability for potentially beneficial purposes (Keil et al., 2022). However, these tools do not necessarily help decision-makers determine what to measure to evaluate the effects of placement, especially in BUDM applications aimed at habitat improvement. The scope and scale of BUDM assessment can vary widely and there is no widespread consensus on what to monitor so practitioners often rely on opportunistic or ancillary data sources (Table 1). Additionally, assessing ecological benefits can be complex due to the spatio-temporal gradients across multiple ecological communities (Munari and Mistri, 2014; Janousek et al., 2019; Borde et al., 2020; Rankin et al., 2023). Thus, a core set of indicators may enable practitioners to monitor, document, and predict BUDM outcomes in a more consistent manner across sites and offer greater support to decision-makers.
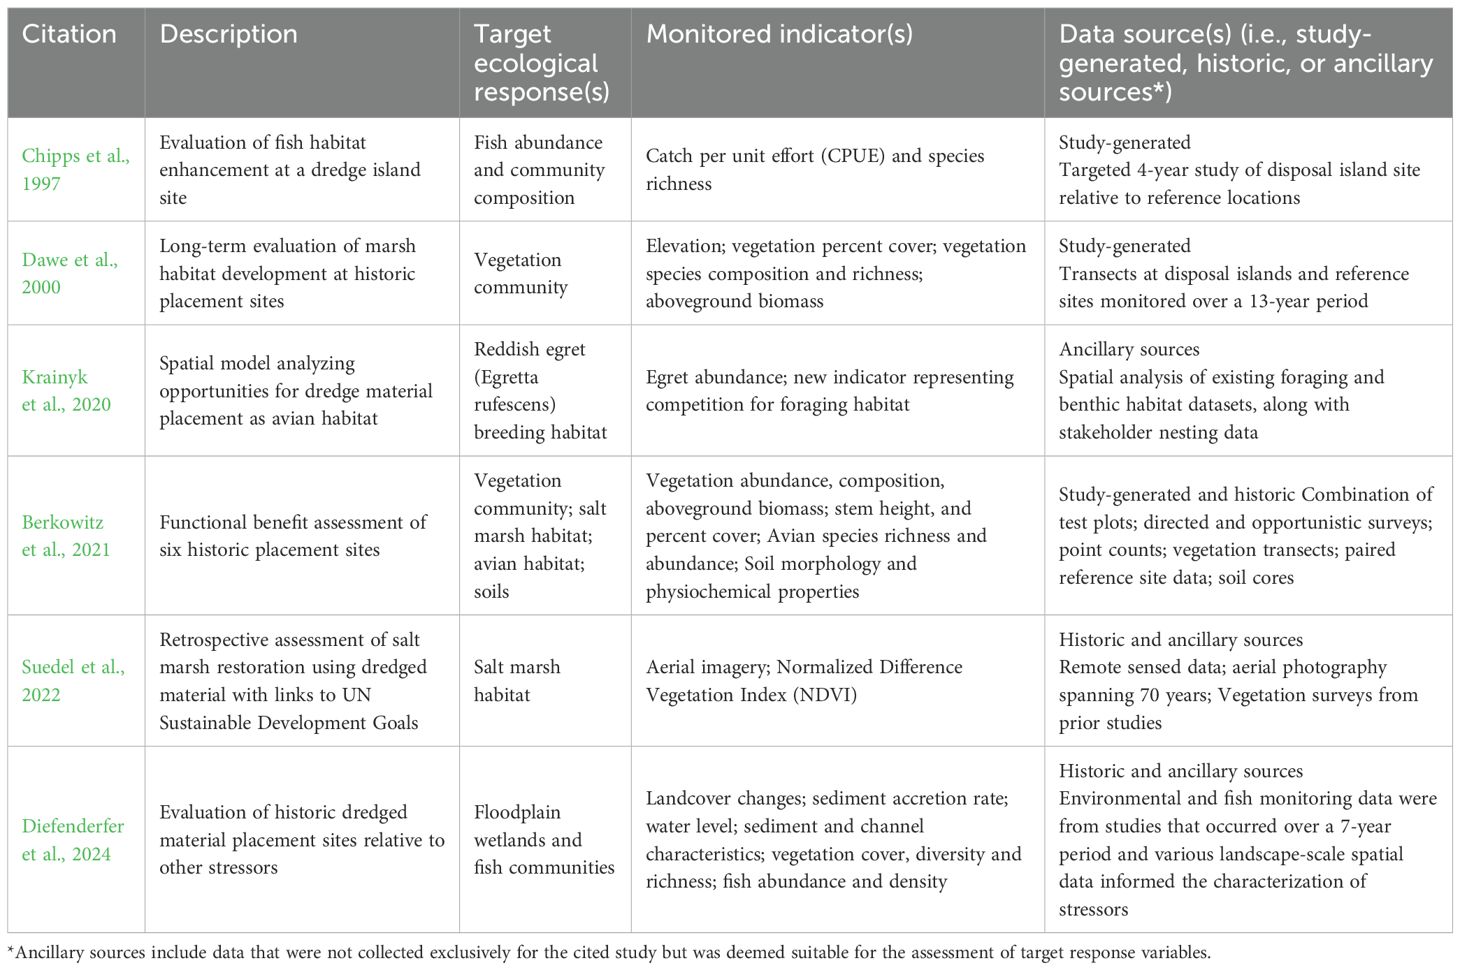
Table 1. Example BUDM studies representing diverse scopes of analyses to document ecological outcomes.
To address this need for general, actionable indicators, we built on an existing protocol to prioritize ecosystem functions of interest and their relevant response indicators. The request for engagement on this topic was sent to a range of potential stakeholders and we ultimately met iteratively with respondents that included restoration practitioners, state and federal natural resource managers, research entities, regional nonprofits, a community-centric organization, and one Tribe, tabulated their feedback on ecosystem functions and indicators, and discussed how this approach can further the development of a general framework to guide future BUDM efforts. We broadly characterize ecosystem “functions” in this manuscript, however, some of the ecological endpoints identified by stakeholders would be more accurately described as ecosystem services (Costanza et al., 1997; de Groot et al., 2002; Fisher et al., 2009; DeWitt et al., 2020). While our goal was to identify functions most directly linked to biophysical processes that could be affected by BUDM, all stakeholder feedback was deemed valuable at this stage and lays the groundwork for further collaboration. Ecosystem function and condition necessarily affect the delivery of ecosystem services (Costanza et al., 1997; Fisher et al., 2009), therefore, engaging stakeholders in a conversation about priority ecosystem services could ultimately lead to the same set of target indicators for evaluating how a BUDM application might affect the production of benefits derived from the environment.
These efforts demonstrate an approach for engaging stakeholders in a process to identify and build consensus around the ecological functions and indicators that can be quantified and tracked across BUDM projects to best document environmental benefits. We applied this approach to stakeholders working within estuaries of the Oregon and Washington coast broadly, as well as the Lower Columbia River (LCR) specifically, due to its long history of dredged material placement and stakeholder collaboration (Borde et al., 2011; Littles et al., 2024).
2 Methods
Selecting a common set of indicators with which to monitor ecological changes over a diverse landscape is challenging. We adopted the Estuary Marine Protected Area (EMPA) Monitoring Protocol (Walker et al., 2023) to initiate and guide stakeholder discussions and feedback on how to quantify ecological response to BUDM efforts in the LCR and broader region. This protocol is a comprehensive and standardized approach that identified a suite of priority ecosystem functions and measurable indicators for monitoring estuarine ecosystems in California. The EMPA protocol is flexible enough to be tailored to a variety of restoration projects and includes a suite of ecological functions with indicators used to assess the health of a given estuary (Walker et al., 2023). The final matrix included in the EMPA Monitoring Protocol reflects the consolidated feedback from a technical team that evaluated how well proposed indicators would facilitate evaluation of target ecological functions.
Because stakeholder feedback helps build consensus and collaboration around how to best track ecological benefits, we adopted an incremental process that increased the level of engagement and breadth of possible feedback at each step to allow stakeholders to participate at their preferred level of comfort and interest. Fifty-three (53) individuals who had previous interactions with USACE in some capacity regarding dredged material placement decisions were sent an email informing them of the overall project intent to improve the quantification of ecological benefits at BUDM sites (Supplementary Material S1). We requested their participation (or that of an appropriate colleague not originally identified in the email invite) in subsequent workshops if interested in engaging further in the benefits assessment process. The EMPA protocol was used to help guide our discussions with stakeholders and provided a means for soliciting feedback on key ecological objectives at BUDM sites. The matrix template allowed users to identify priority ecosystem functions (rows) relevant to focal BUDM habitat goals, and associated indicators (columns) that could be measured to determine the extent to which those functions are met (Supplementary Material S2). Although this application of EMPA to gather stakeholder feedback was not meant to be a prescriptive monitoring protocol for BUDM projects at this stage, it provided a framework for identifying indicators that can be used to measure ecosystem function.
The workshop invitations (Supplementary Material S1) included a summary of the study objectives, a brief introduction to EMPA, and three questions for stakeholder consideration (i.e., What are some of the key ecosystem functions in the LCR that could be affected by BUDM placement? What indicators could be evaluated to assess those functions? Are there functions or indicators that you would prioritize for monitoring, short or long-term assessment)?. Respondents primarily included individuals working in regulatory, restoration, monitoring, and research capacities. Ultimately, four, 2-hour targeted workshops were scheduled based on participant availability and affiliation. Initial group sizes were kept small (no more than ten individuals) to facilitate discussions by promoting common interests (e.g., regulatory, fish habitat, etc.) or organization-driven goals, when possible. Limiting the number of individuals in any one session also ensured ample time for feedback from each participant within the 2-hour time limit. Grouping participants with common areas of expertise and organizational affiliation, when possible, allowed for some degree of divergence from the agenda to delve into ancillary questions that may have been of shared interest. We also limited group sizes in these initial workshops to ensure ample opportunities for all to contribute to the broader discussion. The agenda was identical for each of the four targeted workshops, where the first half served to provide context including historic BUDM examples within the region, a conceptual graphical framework linking ecological functions to processes, and the EMPA matrix as a tool for helping prioritize measurable ecosystem objectives. The last half of each workshop was an open discussion allowing participants to share general feedback about the study objectives and approach, as well as ask clarifying questions about the proposed matrix tool for soliciting input. At the conclusion of each workshop, participants were provided an overview of the study time frame, including the preferred schedule for receiving stakeholder feedback within two weeks, and a plan to synthesize the input received in stakeholder matrices within a month of final matrix receipt. This information was sufficient for participants to decide whether to contribute further to the identification and ranking of ecological functions and indicators by customizing matrix content. At the conclusion of each workshop, we sent an email to all attendees expressing gratitude for their participation, providing a copy of the slides with instructions for completing the matrix, and summarized discussion highlights (Supplementary Material S3).
While some participants may have been involved in prior conversations about how BUDM could affect specific protected species in the LCR, we asked all participants to think broadly about relevant ecological functions for evaluating ecological BUDM goals. Several participants had extensive experience working in the Puget Sound of Washington and in smaller estuaries along the Oregon coast to provide that greater regional perspective. We encouraged stakeholders to add new ecosystem functions and indicators they considered appropriate for assessing an estuarine (or coastal riverine) BUDM application (Table 2). Each participant was provided an empty matrix template based on EMPA and requested to tailor the input (i.e., functions, indicators, and their relative importance) based on their organizational interests or professional expertise. Individuals were encouraged to solicit feedback from colleagues within their respective organizations at their discretion. For each ecosystem function selected, individuals were asked to score both the function and potential indicators using a score scale of 1–5 with 5 being the highest (Supplementary Material S2). The scores reflected the perceived importance of the functions and indicators identified through the lens of different stakeholders. Thus, indicator scores are not necessarily based on data-supported evidence about the degree to which indicators reflect the underlying ecological conditions. New ecosystem functions could be added as new rows at their discretion, along with new indicators, if desired. There was no requirement to score functions from the original EMPA matrix that were deemed irrelevant. The matrix was provided as a spreadsheet with functions as the row names and indicators represented along the columns. Each function’s potential indicators were scored within the matrix, while an additional column was included for participants to score the functions themselves (Supplementary Material S2).
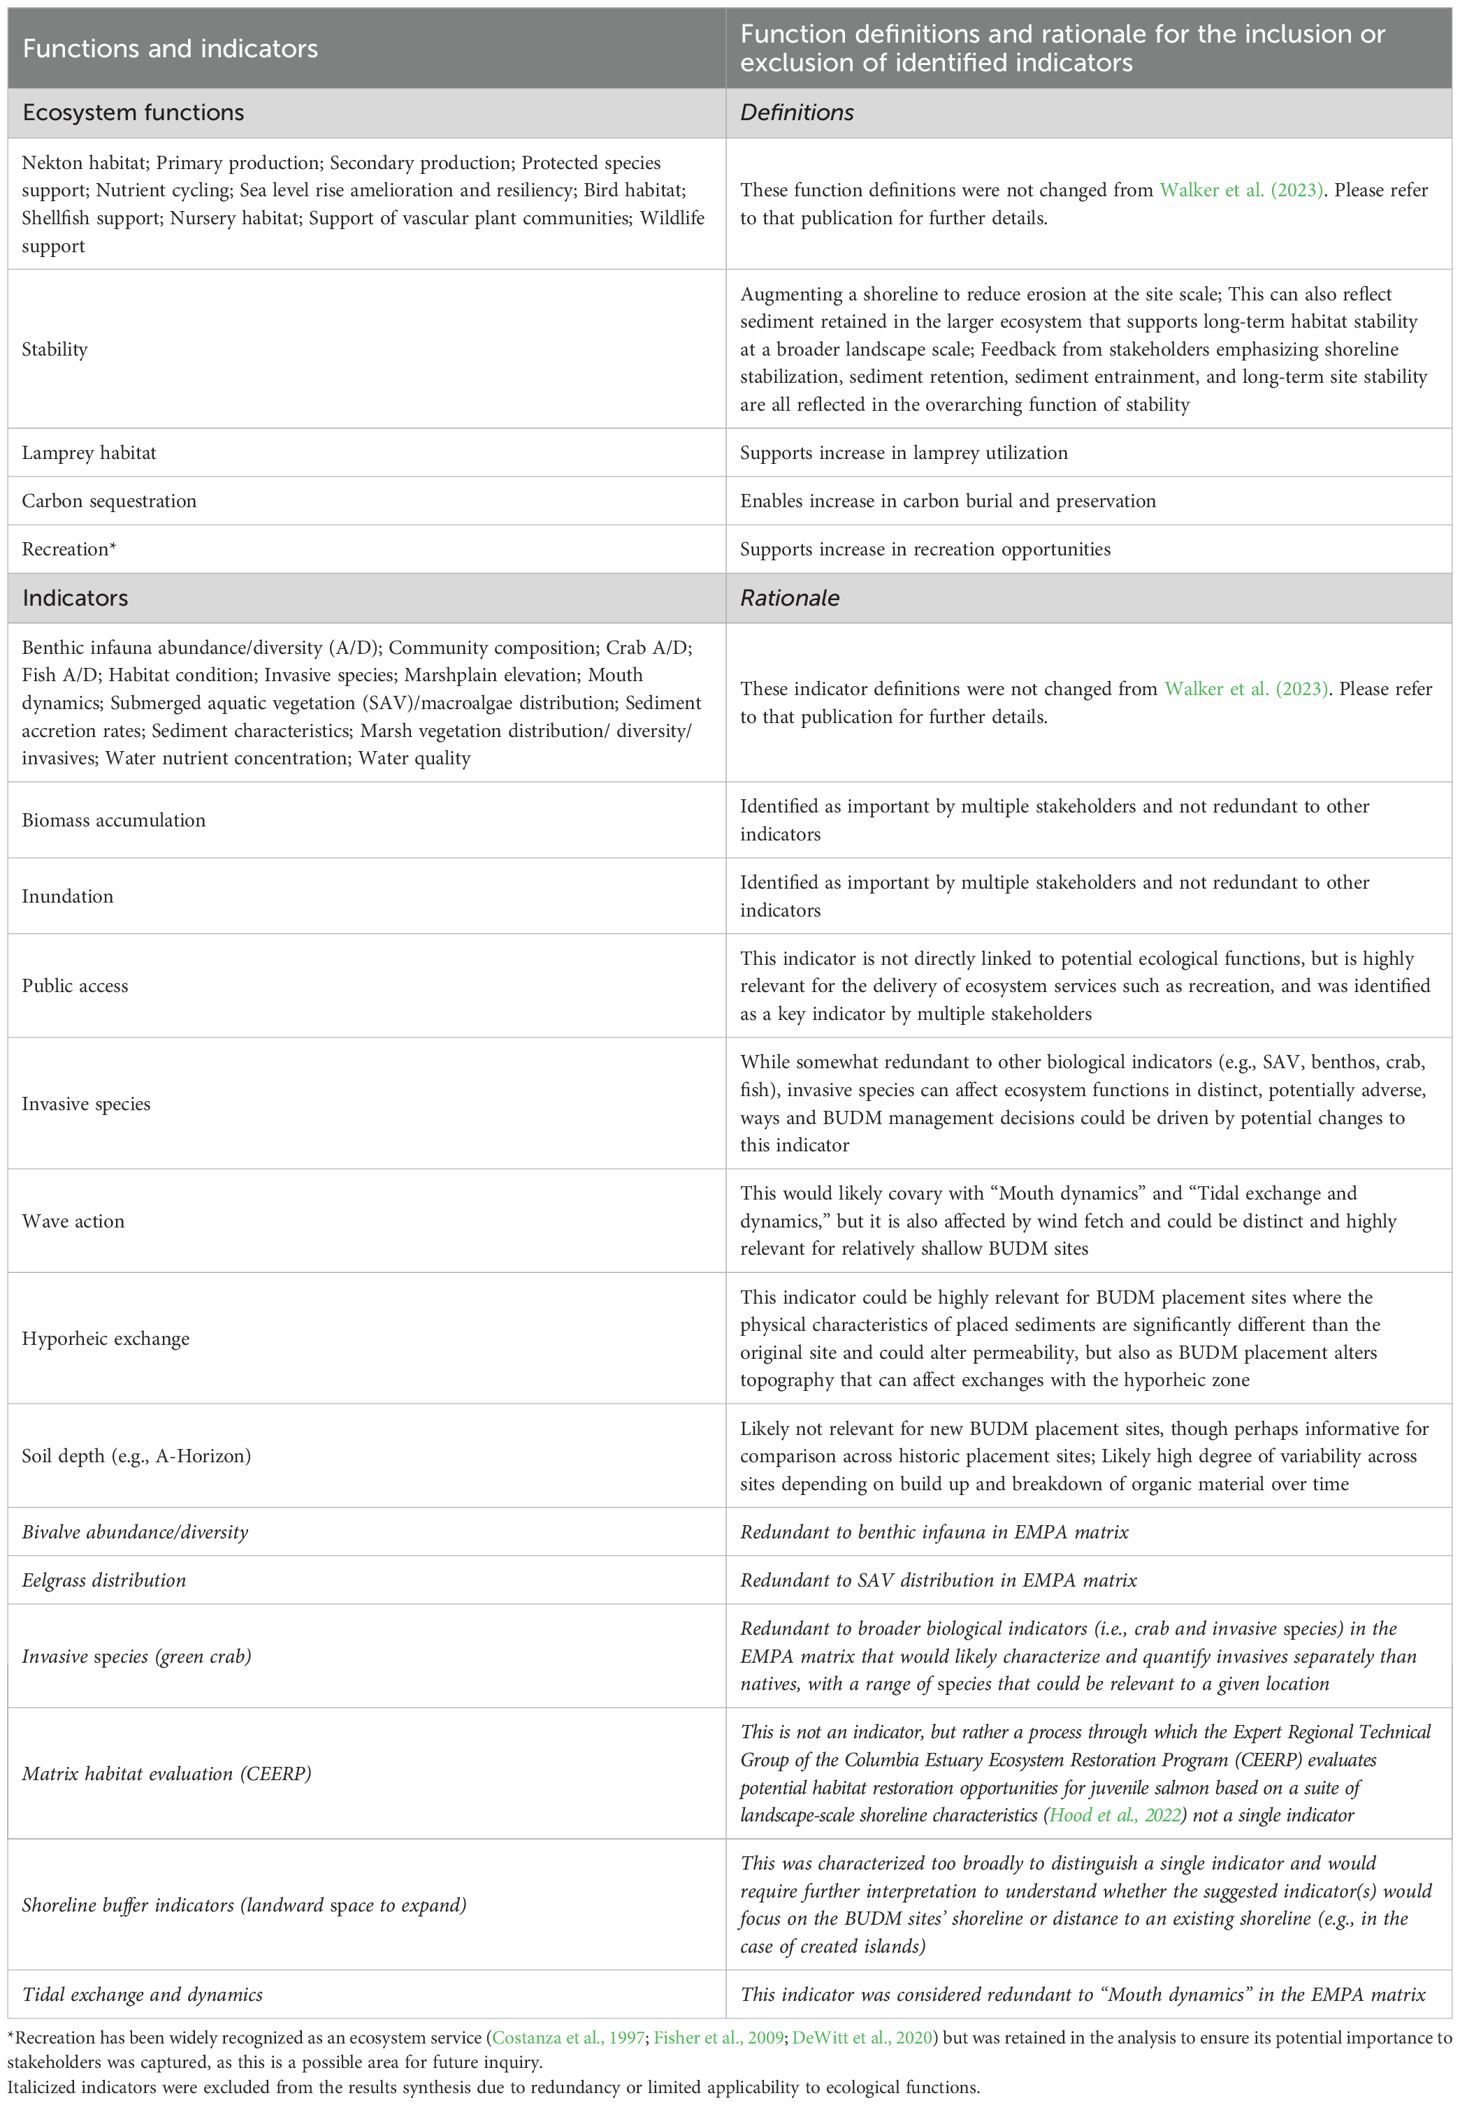
Table 2. Ecological functions and indicators that were identified by stakeholders and added to those identified in the original EMPA protocol (Walker et al., 2023) based on their perceived relevance to BUDM benefits assessment.
Following each workshop, we maintained communication with participants to encourage feedback and repeated the instructions for completing the assessment. Results from all returned matrices were integrated and grouped by stakeholder, with stakeholder identity being anonymized. Function and function-related indicator scores were tallied separately. Missing values were treated as zeros, as opposed to ‘not available’ (i.e., NA), to avoid biasing the results in favor of rarely chosen, but perhaps highly scored, functions or indicators. A final virtual workshop was then held, inviting participation from all stakeholders that submitted matrices, to present a synthesis of the results and offer stakeholders the opportunity for collective feedback and discussion (Supplementary Material S4). As part of this collaborative discussion on functions and indicators, we emphasized the need for transferability and asked participants to consider what might be most suited to assess ecological changes at BUDM sites in estuarine or large coastal rivers both within and outside their region of interest.
This research effort was exempt from Institutional Review Board review and approval because all feedback has been anonymized and disclosed in a manner such that the identity of human subjects cannot be readily ascertained. Additionally, disclosure of participant responses outside this research would not reasonably place subjects at risk of criminal or civil liability or be damaging to their respective financial standing, employability, educational advancement, or reputation.
3 Results
Of the 53 individuals initially notified, 30 individuals across 21 organizations (i.e., state, federal, and Tribal entities, as well as non-profit, research, and restoration organizations) participated in one of the four workshops presenting the BUDM assessment framework in more detail. All 30 participants, at minimum, contributed to the conversation during workshops and provided feedback about the potential utility of the matrix framework, and other conceptual ecological models in identifying valued ecosystem components. Nine matrices were returned for consideration and evaluation. Matrix contributor affiliations included three federal agencies, three state agencies, two regional estuary-management nonprofits, and one community organization focused on habitat restoration initiatives in the LCR. In some cases, multiple individuals from a single organization developed input for the BUDM matrix collaboratively. All matrix contributors were invited to a final workshop where preliminary results were presented, and further dialogue was encouraged. Of sixteen invitees, eleven individuals participated in the final workshop. All functions and indicators in the EMPA matrix were retained. Collectively, stakeholders added four additional functions for consideration in the assessment matrix and mapped several potential indicators to the expanded suite of functions (Table 2). While recreation and the related indicator of public access were included in the matrices received from participants representing three different state agencies, this is a broad category of ecosystem service (Costanza et al., 1997; de Groot et al., 2002). Recreational users in estuaries can be linked to multiple ecological end products, indicators, and a more nuanced connection to ecosystem function that were not addressed in this effort (Fisher et al., 2009; DeWitt et al., 2020; Littles et al., 2023). Other suggested indicators were merged in cases where stakeholders selected different words to describe similar processes or subsumed when stakeholders identified a new indicator that was redundant (Table 2). Two new indicators (i.e., biomass accumulation and inundation) were deemed broadly applicable for measuring potential ecological benefits across BUDM sites in the LCR and other estuaries of the region, based on stakeholder discussions in the final workshop after synthesized results were presented (Supplementary Material S4).
Most participants currently had work or projects focused in the LCR, however, there were individuals whose work was centered in other Oregon estuaries (e.g., Tillamook Bay, Yaquina Bay, Coos Bay). This difference in setting did not necessarily affect the identification of priority functions, but was evident in the scoring of those functions, with stakeholders in the LCR scoring the top five functions higher (mean score of 3.6 ± 0.28 standard error) than stakeholders working predominantly in smaller Oregon coast estuaries (mean score of 2.9 ± 0.46). This may have been attributed to fewer BUDM applications in those estuaries, relative to the LCR, leaving stakeholders with greater uncertainty about indicator suitability and potential outcomes. Aside from the matrix input, other valuable insights emerged from the stakeholder workshops. For example, one individual highlighted an effort to streamline and leverage information across beneficial use projects statewide. In another workshop, there was a robust discussion about system versus species-level concerns, as well as an acknowledgement that the identification of priority functions and indicators may be driven by target salmonid species in systems like the LCR.
In Figure 1A we see that the top 5 ecosystem functions identified (out of 16 total) were protected species support (4.2 ± 0.43), sea level rise amelioration (4.0 ± 0.24), nursery habitat (3.1 ± 0.73), vascular plant support (3.0 ± 0.47), and nekton habitat (2.4 ± 0.65). Indicators can be used to measure multiple functions, and stakeholders found the marsh vegetation, benthic infauna, water quality, SAV and macroalgae distribution, marshplain elevation, and fish abundance and distribution to be most useful for measuring BUDM-related ecosystem functions (Figure 1B). However, the stakeholder responses were variable, and not all top indicators were relevant to the top functions (Figure 2). For example, benthos, fish, and water quality indicators were not considered relevant for measuring potential benefits associated with sea level rise amelioration. There were also indicators like biomass accumulation that could indirectly support multiple functions but was only selected as a relevant indicator for evaluating support for vascular plants by most stakeholder participants (Figure 2).
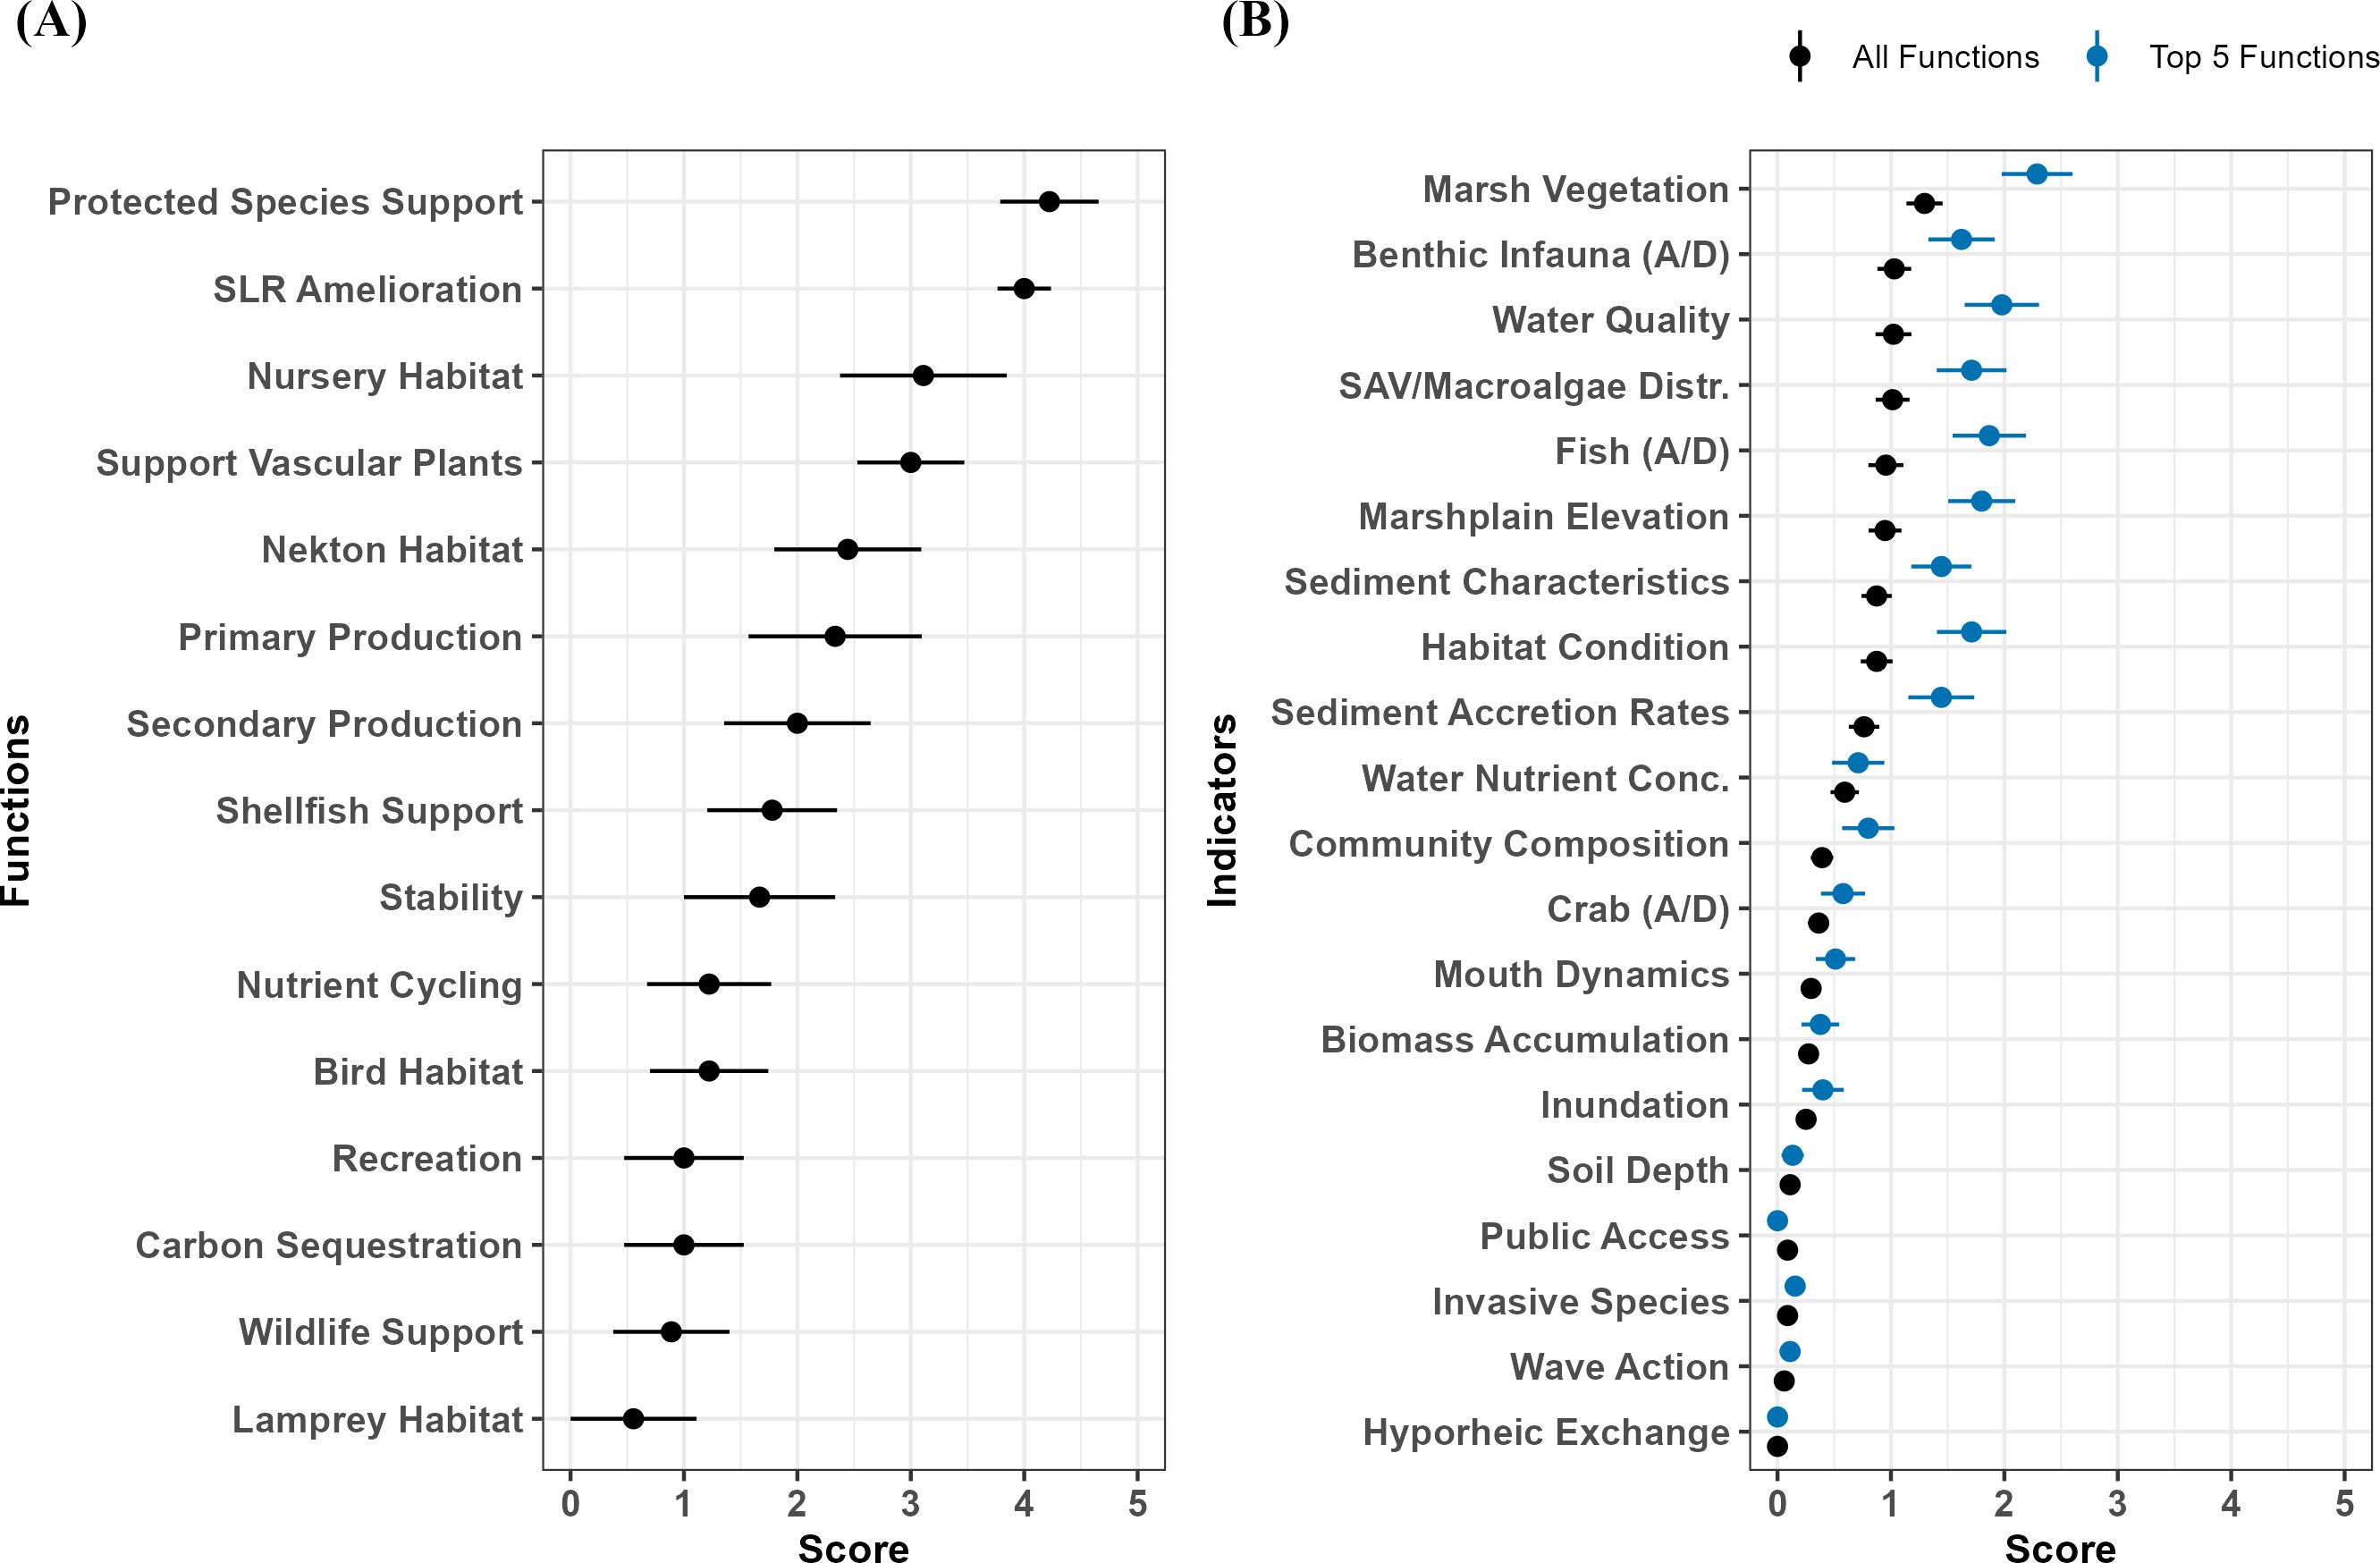
Figure 1. Scores of ecosystem functions (A) and indicators (B). Points represent mean ± S.E. in both panels. SLR = Sea Level Rise, A = Abundance, D = Diversity, and N = native vs. nonnative in the function and indicator nomenclature, as applicable.
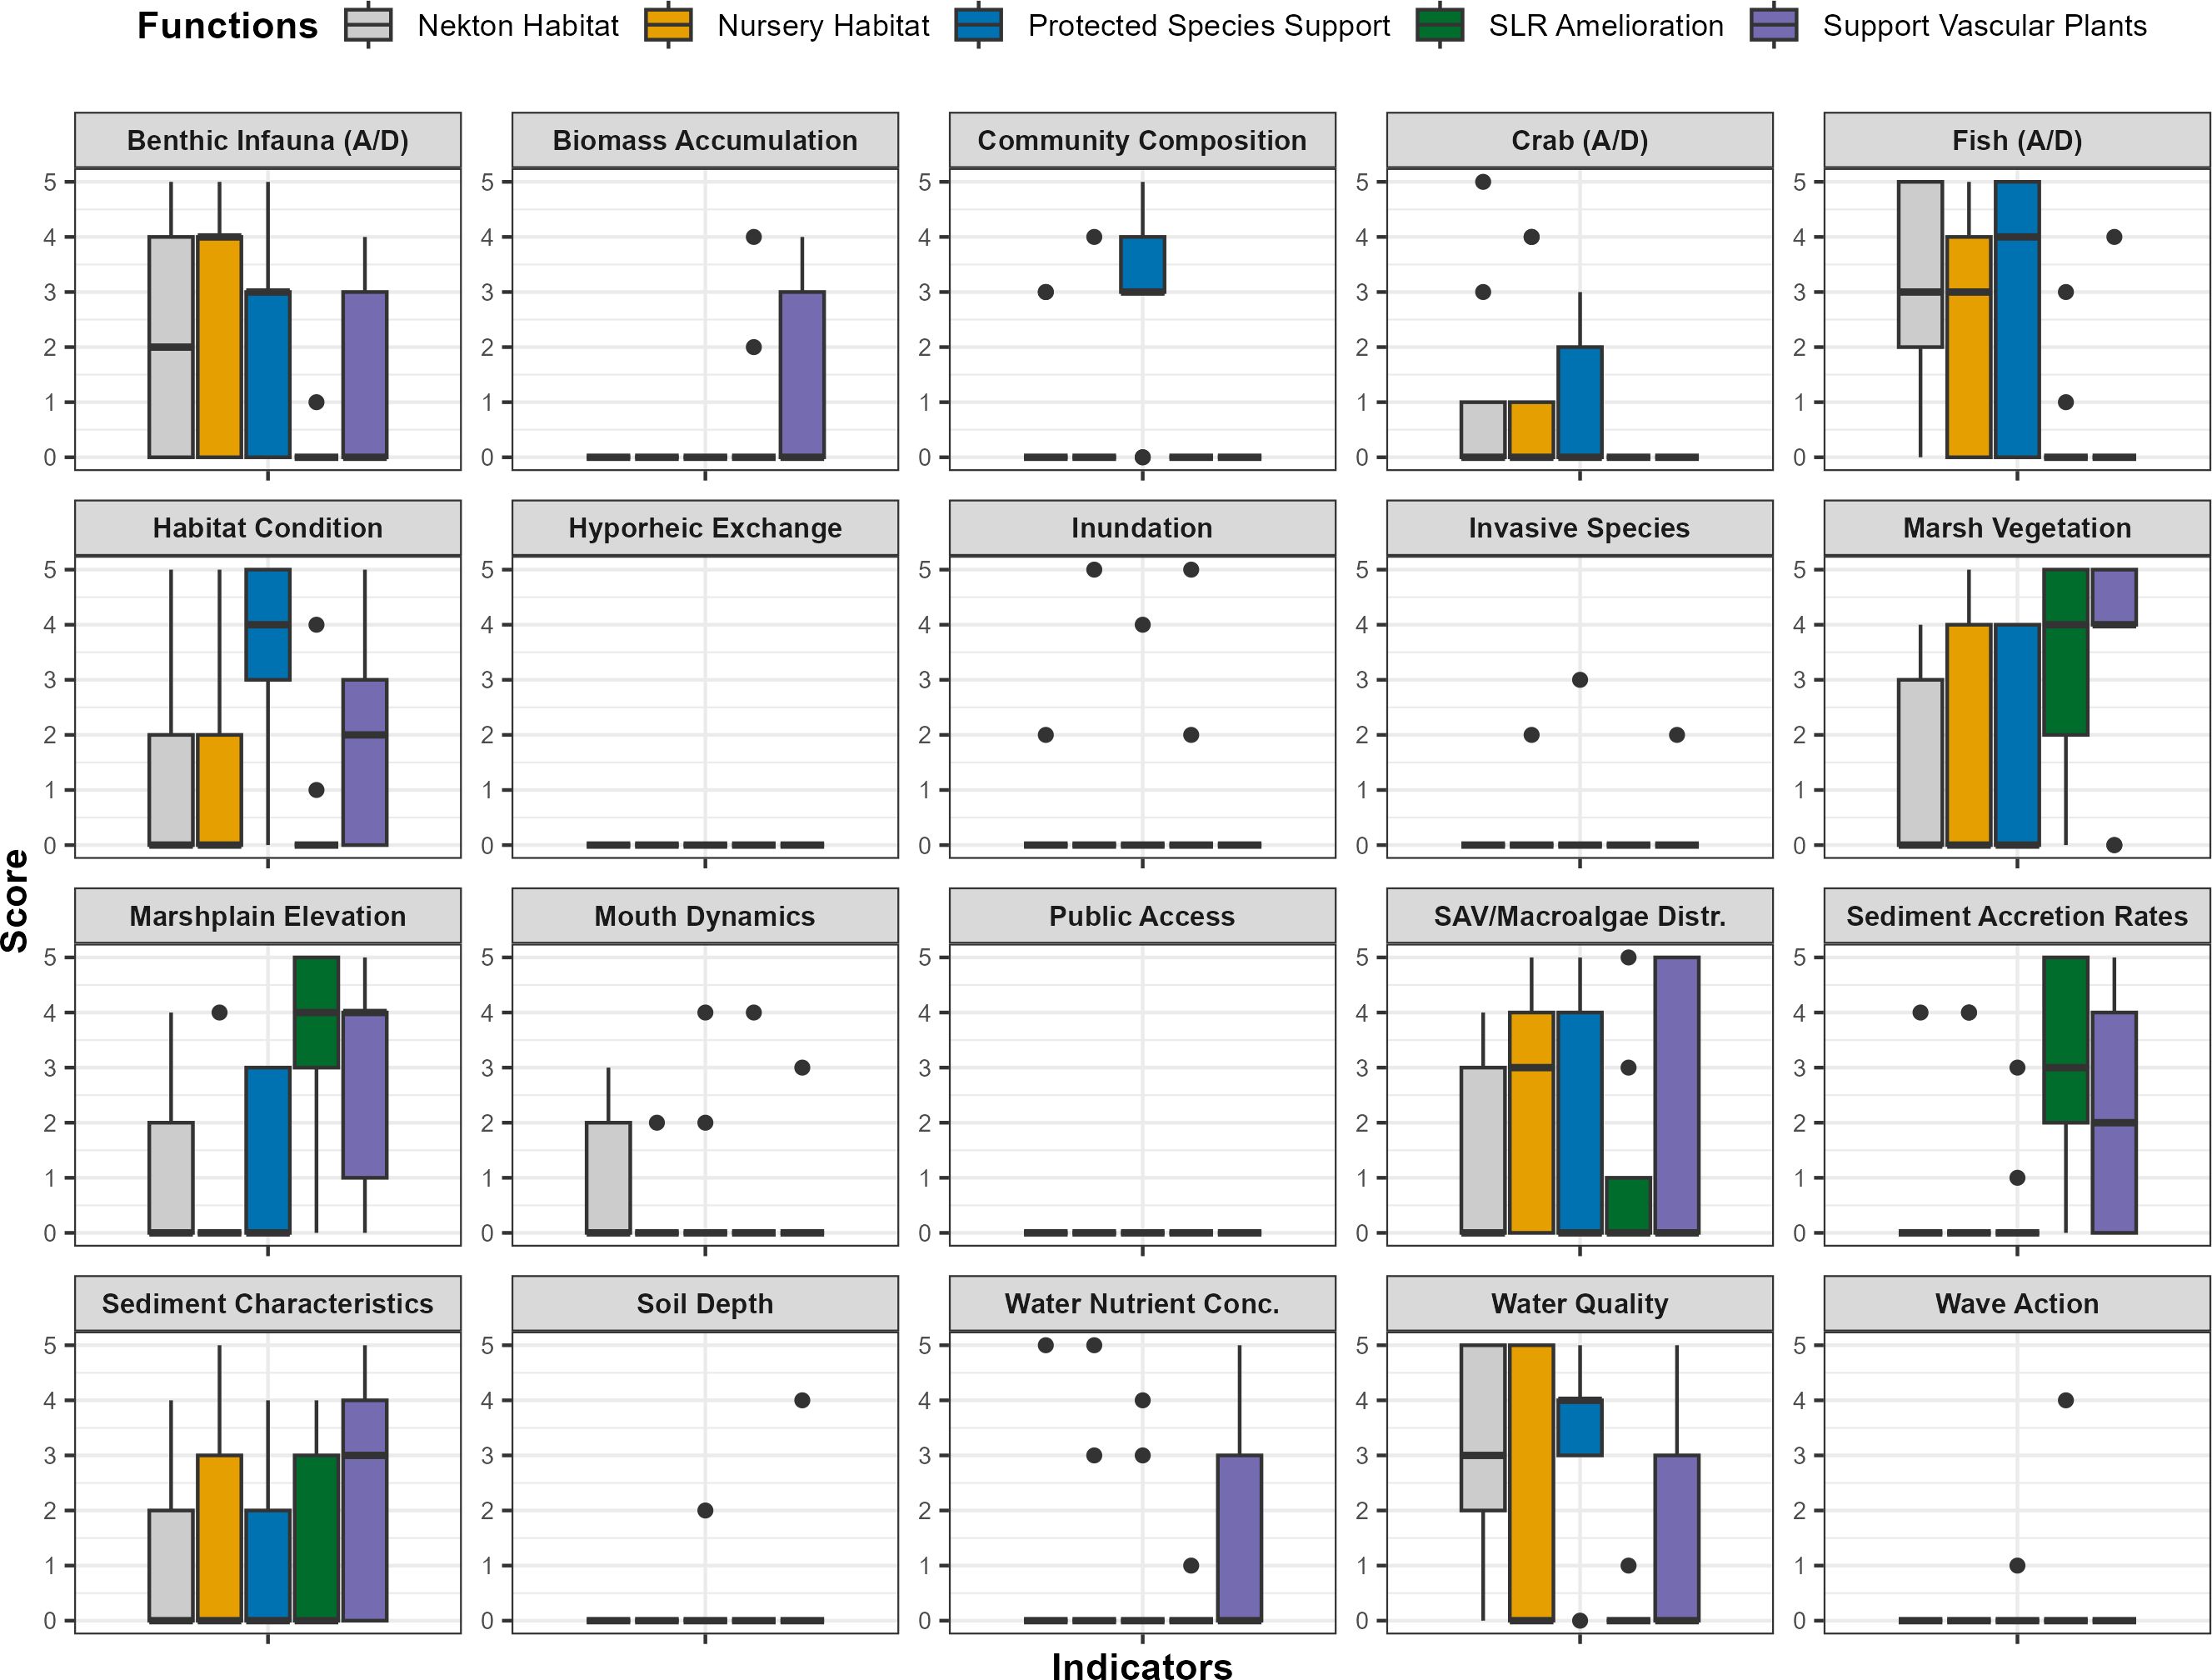
Figure 2. Indicator scores for the top five ecological functions. Each inset boxplot corresponds with selected indicators listed in Table 2, with boxes indicative of the interquartile range of the score assigned to each indicator. Dark horizontal bars depict the median score, whiskers show the extent of data within 1.5 times the interquartile range, and outliers are dots. Box colors correspond to each of the top five ecological functions prioritized by stakeholders, as described in the legend above the plots.
Aside from the matrices, we also received written feedback from stakeholders that revealed potential barriers for participation, and areas for further consideration and discussion, as outlined below:
• Lack of perceived expertise on the topic [barrier]
I only have high-level feedback on this effort – and not specifics like you are looking for – as I’ve not been an on-the-ground estuarine restoration practitioner for a while and my command of the literature is thus more desktop based. So, no scored matrix to help with your compilation.
• Insufficient time to complete task [barrier]
Thanks for checking in. I don’t have time to fill in the matrix. I’ve got a looming deadline and I am headed out of the country in a few weeks.
• Linked or shared indicators [opportunity]
We used the lens of fish, but also tried to think broadly and not be totally fish centric.
We thought water quality was very important, but only as part of a suite of indicators, not important solely on its own.
• More clear connection to specific outcomes [opportunity]
I’m sorry that I have not had time to sink into this. I know I provided some off-the-cuff thoughts during the call. One of which was focusing on functional and biological response. My overall sense was that I needed more time to really unpack and draw connections between the framework and the established outcomes.
• Conceptual framework development [opportunity]
For a given ecosystem, look to develop a conceptual ecological model, DPSIR, or other, then from that, explore which sets of valued ecosystem components = indicators are most likely to inform indicators of resilience. I would think that there could be an interesting academic exercise to identify a handful of existing conceptual models from a range of estuarine systems from which you could extract that kind of information, look at transferable commonalities, etc. that could be relevant to LCR, etc.
4 Discussion
4.1 General approach for ecological BUDM assessment
Habitat development is one of the primary goals for USACE BUDM projects (USACE, 2015) to promote more economically, socially, and environmentally sustainable dredged material management approaches. However, we must still view these projects holistically and champion approaches that can assess ecological outcomes more comprehensively (e.g., across a range of ecosystem functions through time and space). Even in systems like the LCR with a long history of BUDM projects, there are recurring questions about whether, how, and when benefits emerge. Thus, it is essential to identify and track appropriate indicators relative to stated project goals (i.e., Berkowitz et al., 2022a) and linking ecological benefits to ecosystem functions has proven to be especially useful (Berkowitz et al., 2022b; Walker et al., 2023).
In some instances, evaluating habitat outcomes through the lens of ecosystem services (Wigand et al., 2017; Hernandez et al., 2024; Piczak et al., 2024) has helped garner support during the planning phase and enabled users to translate benefits into quantifiable economic indicators (e.g., Foran et al., 2018). In terms of ecological outcomes, Berkowitz et al. (2022a) highlighted long-term trajectories of select ecological functions across six BUDM projects that were each more than 40 years old. That study showed that vegetation community and distribution, avian habitat utilization, and surficial soil characteristics were equivalent to or of higher quality than reference sites. Other accounts describe habitat outcomes at dredged material placement sites that were equivalent to natural floodplain wetlands, but information is lacking on exactly how long it took to achieve those outcomes (Borde et al., 2011) and there is no unifying approach for evaluating and reporting potential BUDM ecological benefits (Table 1).
Soliciting stakeholder feedback as part of the process to identify which ecosystem indicators to track is especially important because they will often be paramount to completing any subsequent monitoring or data gathering exercise (Walker et al., 2023). Hanna et al. (2017) found that most studies to establish riverine ecosystem services (71% of 86 studies reviewed) did not include stakeholder feedback on their evaluation protocols and, perhaps consequently, found an overall lack of clarity across studies on which ecosystem services to prioritize and how to measure them. We facilitated stakeholder participation through a series of workshops to identify priority ecological functions for BUDM applications in estuaries of the Pacific Northwest and large coastal rivers like the LCR and determine how to best measure those functions. Hanna et al. (2017) found that most studies to establish riverine ecosystem services (71% of 86 studies reviewed) did not include stakeholder feedback on their evaluation protocols and, perhaps consequently, found an overall lack of clarity across studies on which ecosystem services to prioritize and how to measure them. The same disconnect could happen with one or more ecosystem functions if different indicators are used to track their changes at different projects. Consider that water quality was a considered a relatively important indicator by our participants and, along with biodiversity, is an important indicator of functional processes in transitional ecosystems, like coastlines, estuaries, and rivers (Newton et al., 2023). Yet there are numerous ways to quantify water quality, which can give rise to tremendous variability across studies (Hanna et al., 2017). Although we explicitly requested input on priority functions, not services, stakeholder involvement in these decisions is prudent. Long-term BUDM assessment requires an investment in monitoring that will often require funds beyond the budget of the initial implementation. Pilot studies have yielded meaningful results (Table 1, Berkowitz et al., 2022a, 2022b), but support from state, federal, local, and Tribal partners will be integral to the success of any sustained monitoring initiatives.
Stakeholder feedback emphasized how the merits of BUDM might initially be conceptualized in the context of broad ecological functions (e.g., nursery habitat, primary production), but the absence of more empirical data to drive indicator selection could be a barrier to certain stakeholders that want greater certainty about the scope of potential BUDM effects on ecological functions upfront. Until more data is collected across BUDM sites, the matrix can still be a helpful tool for generating focused dialogue to identify quantifiable measures of BUDM habitat outcomes and a similar process could be emulated elsewhere. Operationalizing and achieving stated goals will likely require more engagement and collaboration for greater specificity about when and what to measure at a given location (Supplementary Material S3, S4), like the EMPA protocols. Nonetheless, adopting this matrix-based approach to build consensus around potential benefits at BUDM sites elsewhere and encouraging stakeholders to tailor matrix content based on their ecological priorities could serve as a valuable step toward understanding the degree to which preferred ecological functions and relevant indicators vary across spatial scales, both regionally and internationally. While we focused on BUDM applications in an estuarine setting, there is no reason the methodology could not be evaluated for potential utility in other ecological settings. From a practical standpoint, stakeholders recognize that many indicators are linked and additional matrices from a greater number of stakeholders could reduce the variability and help hone in on the most relevant indices (Supplementary Material S3, S4). There can be multiple ways to address success across ecological systems, thus, results highlight a step toward building consensus around the most important ecological functions and indicators to quantify their benefits.
4.2 Stakeholder engagement
Including multiple stakeholders in BUDM decisions increases transparency, helps identify current limitations and possible solutions (Russ et al., 2025), ensures better project design (Suedel et al., 2022), and informs and guides the monitoring and modeling efforts needed to measure project success (Herman et al., 2023). Numerous tools are available for incorporating stakeholder feedback when planning and scoping placement alternatives. As echoed by one workshop participant, conceptual models, such as the Drivers, Pressures, State, Impacts, and Response approach (e.g., Harwell et al., 2019), can help guide discussions on desired outcomes and the influential factors at play. More quantitative options, like multi-criteria decision analysis, can then be used to integrate stakeholder input as weighting factors for the lines of evidence supporting a particular course of action (Linkov et al., 2011; Collier et al., 2014; Scheffler et al., 2014). This general approach has been integrated into structured decision making (Neckles et al., 2015; Piczak et al., 2024) and decision-support tools (Arreola et al., 2022) have been developed with environmental criteria and other socioeconomic factors to account for a suite of potential benefits. However, conceptual models are simply tentative guides and decision support tools are only as good as the indicators used to monitor changes in agreed upon objectives.
This study leveraged an existing EMPA framework (Walker et al., 2023) to identify priority ecosystem functions in the LCR and estuaries along the Oregon coast that could also serve to inform BUDM actions by enhancing transparency and identifying candidate indicators that could apply across a broad suite of projects. It was important to cast a wide net when inviting stakeholders because, whether individuals elected to engage in the process or not, they were given the opportunity and made aware of the intent. This set the stage for transparency, opened communication, and established a desire for collaboration at the onset of the process, prior to making any decisions. Interactions with stakeholders required continued engagement to identify and prioritize ecosystem functions and indicators. Sharing the EMPA approach upfront helped ground discussions by giving stakeholders a concrete example for how building consensus around functions and indicators can ultimately inform site monitoring and adaptive management. Although we requested feedback for functions and indicators relevant to estuary BUDM applications, stakeholder needs and perspectives are subjective. Thus, while we solicited stakeholder opinions on the functions and indicators most relevant for evaluating BUDM environmental benefits, the input received may have been influenced by the regulatory history, institutional knowledge, and regional perceptions, among other things (Ulibarri et al., 2020). For example, multiple stakeholders mentioned the potential for BUDM to affect recreational services. Greater discussion about specific beneficiaries of interest and the ecological production functions supporting perceived human well-being (e.g., Harwell and Jackson, 2021; Littles et al., 2023; Jackson et al., 2024) were beyond the scope of this initial study, but this is an area of BUDM assessment that warrants further consideration. We did not seek direct feedback from all possible community organizations, local residents, or the broader public during this study aimed at identifying measurable ecological benefits. However, a holistic consideration of ecosystem services could employ a similar matrix approach to solicit public input in accounting for a wider array of concerns and priorities that may influence planning decisions. Presenting this framework upfront could, for example, help identify and synthesize public support for benefit-relevant indicators that explicitly account for ecosystem service provision (Olander et al., 2018). Engaging external parties in this way can help ensure that future monitoring reflects shared priorities and meets expectations in terms of what will ultimately be evaluated and quantified (Hernandez et al., 2024).
While many stakeholders were willing to share their thoughts on prioritizing ecosystem functions, others were hesitant to do so, as reflected by decreasing levels of participation at each step of engagement toward matrix development. This may have been due to a perceived need for caution by individuals that serve in a regulatory capacity and did not want their feedback interpreted as support for the overall BUDM concept by their respective organization. Additionally, some stakeholder comments during workshops indicated that individuals felt that there is too little evidence for how and when dredged material may support stated functions, leading to a general skepticism regarding whether any new habitat developed would replace functions that may be lost due to placement. While there was no resolution to the questions about potential habitat tradeoffs during this study, we emphasized that our objective was a stakeholder-driven approach to determine what indicators might best assess ecological benefits. However, we would argue that this is just the first step to identify a subset of indicators for more focused assessment. Subsequent data collection and monitoring could then help reveal the extent to which selected indicators reflect underlying ecological conditions and effects from BUDM placement. This, in turn, would help reduce uncertainty by informing which evidence to prioritize in any future BUDM application or data synthesis across sites.
Results from stakeholders who submitted matrices showed that four out of the five most important ecosystem functions involved an interconnected set of biological components: nekton habitat, nursery habitat, protected species support, and support vascular plants (Figure 1A). These stakeholders also indicated that monitoring one well-selected indicator may be sufficient to represent benefits with respect to multiple functions and across ecological gradients. For example, vegetation communities that support numerous coastal migratory bird species may be quite different than more developed forested areas supporting terrestrial species so evaluating the same or a similar vegetation indicator through different benefits lenses may be feasible. Monitoring methods, environmental, and resource constraints will also differ between systems, across agencies, and among practitioners. Monitoring can also be expensive and is usually limited to 5 years or less in many USACE applications, which means that it is critical to use indicators that can be applied across multiple locations (e.g., remote sensing), are accessible drivers (e.g., temperature or dissolved oxygen), or are leveraged from other sources (e.g., existing data).
While our stakeholder engagement efforts provided a set of desirable ecosystem functions and indicators, the results lacked a unifying framework and metric(s) that could guide future efforts to quantify ecological impacts across a portfolio of BUDM sites. Which metric(s) should be measured across projects? Physical drivers like water quality (e.g., temperature, dissolved oxygen, turbidity) or biological responses, like the vegetation, benthic, or fish communities? Many of the highly ranked functions identified by stakeholders were ensembles of biological responses. Biodiversity is a response metric that can address stakeholders’ interest in the biological community, while also being an important indicator of ecosystem functioning, e.g., primary productivity, nutrient cycling, resilience to perturbations (Loreau, 1998, 2001; Tilman et al., 2014). Schoolmaster et al. (2020) recently summarized the biodiversity-ecosystem function literature and proposed a causal model that distills the key processes at play. Ecosystem function is a broad term that encompasses a rich array of specific functions that are driven by a diversity of traits, which themselves arise from the community of individual species. In turn, species, traits, and ecosystem functions are all influenced by the environment. Schoolmaster et al.’s model provides a general causal framework into which the impact of our engineering actions on the environment can be causally linked to biodiversity.
Diversity, however, is a composite metric often measured using Shannon’s entropy equation (Heip et al., 1998), where diversity is measured as the entropy of the system and given by the expected log probabilities of the distribution of species or traits observed. In general, collecting data on biodiversity is economically and practically prohibitive and has led to a general data crisis in biodiversity (Daly et al., 2018; Kindsvater et al., 2018). However, there are empirical relationships between biodiversity (measured as species richness) and biomass (O’Connor et al., 2017; Daly et al., 2018) and estimating the latter can be more practical and economical than the former (e.g., remote sensing of changes in vegetation biomass). We discussed the potential merits of adopting biomass as a response metric for evaluating ecological changes at BUDM sites with our stakeholders during the last workshop. While biomass was not initially a high-ranking metric, stakeholders agreed that it could track both direct and indirect ecological changes across most, if not all, of the priority ecosystem functions identified. While further discussion would be needed to determine the feasibility and costs for measuring biomass, such accounting for native vs. invasive species or how to integrate mass across species, the notion of adopting the metric was deemed a promising idea that could advance efforts to develop more robust and consistent ecological benefits accounting. Biological productivity often begets increasing biomass and community complexity via a presumed trophic hierarchy and successional processes that underpin many facets of BUDM (e.g., Piesschaert et al., 2005; Munari and Mistri, 2014; van Riel et al., 2022). We introduced the notion of using biomass as a unifying indicator to facilitate cumulative quantitative assessment across habitat zones and trophic levels, but a true synthesis was beyond the scope of the current study thus further work is needed on that front.
5 Conclusions
The diversity of BUDM projects suggest that there is not a “one-size-fits-all” approach to BUDM evaluation, and there are multiple ecological and economic considerations. There is often a high degree of subjectivity in developing monitoring priorities and deciding which methodologies, technologies, and scales are most appropriate, even if there is general agreement on the priority functions and indicators. Thus, further collaboration among regional stakeholders could yield more explicit monitoring protocols and help leverage resources, similar to estuary health assessments in California (Walker et al., 2023).
There is wide interest in decreasing uncertainty surrounding habitat outcomes at sites incorporating BUDM and time, funding, and other resource constraints will continue to be limiting factors for data collection and monitoring. Thus, frameworks that facilitate meaningful stakeholder engagement to help identify priorities and build consensus are invaluable; and this study is a step towards more consistent and comprehensive BUDM assessment.
Data availability statement
The original contributions presented in the study are publicly available. The data and code needed to replicate the results of this article are archived in the Zenodo repository under doi: 10.5281/zenodo.17783387.
Author contributions
CJ: Conceptualization, Data curation, Formal Analysis, Funding acquisition, Investigation, Methodology, Writing – original draft, Writing – review & editing. ER: Data curation, Writing – original draft, Writing – review & editing. BL: Conceptualization, Data curation, Funding acquisition, Investigation, Methodology, Writing – review & editing. MS: Writing – review & editing. KT: Writing – review & editing. HM: Writing – review & editing. SC: Writing – review & editing.
Funding
The author(s) declared that financial support was received for this work and/or its publication. This work was funded and supported by the U.S. Army Corps of Engineers through the Coastal Resilience focus area of the Regional Sediment Management (RSM) Program.
Acknowledgments
The authors would like to acknowledge the U.S. Army Corps of Engineers RSM Program and staff for the continued support of this study as a phased approach to BUDM assessment. We also thank the USACE Portland District, Columbia Estuary Ecosystem Restoration Program, and all stakeholders that provided feedback throughout this process, including but not limited to the: Bonneville Power Administration, National Oceanic and Atmospheric Administration, U.S. Geological Survey, U.S. Fish and Wildlife Service, U.S. Environmental Protection Agency, Yakima Nation Fisheries, Oregon Department of Fish and Wildlife, Washington Department of Ecology, Columbia River Estuary Study Task Force, Lower Columbia Estuary Partnership, Tillamook Estuary Partnership, Pacific Northwest National Laboratories, and Columbia Land Trust. Sincere gratitude to Eric Stein and Jenna Walker of the Southern California Coastal Water Research Project for their input and guidance in adapting the EMPA protocol.
Conflict of interest
The author(s) declared that this work was conducted in the absence of any commercial or financial relationships that could be construed as a potential conflict of interest.
Generative AI statement
The author(s) declared that generative AI was not used in the creation of this manuscript.
Any alternative text (alt text) provided alongside figures in this article has been generated by Frontiers with the support of artificial intelligence and reasonable efforts have been made to ensure accuracy, including review by the authors wherever possible. If you identify any issues, please contact us.
Publisher’s note
All claims expressed in this article are solely those of the authors and do not necessarily represent those of their affiliated organizations, or those of the publisher, the editors and the reviewers. Any product that may be evaluated in this article, or claim that may be made by its manufacturer, is not guaranteed or endorsed by the publisher.
Supplementary material
The Supplementary Material for this article can be found online at: https://www.frontiersin.org/articles/10.3389/fevo.2025.1686792/full#supplementary-material
References
Arreola D., Hernandez J., Vesco V., and Reddy K. R. (2022). Dredged material decision tool (DMDT) for sustainable beneficial reuse applications. J. Mar. Sci. Eng. 10, 178. doi: 10.3390/jmse10020178
Bates M. E., Fox-Lent C., Seymour L., Wender B. A., and Linkov I. (2015). Life cycle assessment for dredged sediment placement strategies. Sci. Total Environ. 511, 309–318. doi: 10.1016/j.scitotenv.2014.11.003
Berkowitz J. F., Beane N. R., Hurst N. R., Jung J. F., and Philley K. D. (2022a). A multi-decadal assessment of dredged sediment beneficial use projects part 1: ecological outcomes. WEDA J. Dredging 20 (1), 50–71. Available online at: https://www.westerndredging.org/phocadownload/WEDA_Journal_of_Dredging_Vol_20_No_1.pdf.
Berkowitz J. F., Beane N. R., Hurst N. R., Philley K. D., and Jung J. F. (2022b). A multi-decadal assessment of dredged sediment beneficial use projects part 2: ecosystem functions, goods, and services. WEDA J. Dredging 20 (1), 72–88. Available online at: https://www.westerndredging.org/phocadownload/WEDA_Journal_of_Dredging_Vol_20_No_1.pdf.
Berkowitz J. F., Beane N. R., Philley K. D., Hurst N. R., and Jung J. F. (2021). “An assessment of long-term, multipurpose ecosystem functions and engineering benefits derived from historical dredged sediment beneficial use projects,” in ERDC/EL TR-21-4 (Vicksburg, MS: The US Army Engineer Research and Development Center (ERDC)). doi: 10.21079/11681/41382
Bolam S. G. and Rees H. L. (2003). Minimizing impacts of maintenance dredged material disposal in the coastal environment: a habitat approach. Environ. Manage. 32, 171–188. doi: 10.1007/s00267-003-2998-2
Borde A. B., Diefenderfer H. L., Cullinan V. I., Zimmerman S. A., and Thom R. M. (2020). Ecohydrology of wetland plant communities along an estuarine to tidal river gradient. Ecosphere 11 (9), e03185. doi: 10.1002/ecs2.3185
Borde A. B., Zimmerman S. A., Kaufmann R. M., Diefenderfer H. L., Sather N. K., and Thom R. M. (2011). “Lower Columbia River and estuary restoration reference site study 2010 Final report and site summaries,” in PNWD-4262. Prepared for the lower columbia river estuary partnership by battelle (Pacific Northwest Division, Richland, WA). Available online at: https://www.estuarypartnership.org/sites/default/files/resource_files/RSS_2010_Report_FINAL_submitted.pdf.
Chipps S. R., Bennett D. H., and Dresser J. T.J. (1997). Patterns of fish abundance associated with a dredge disposal island: implications for fish habitat enhancement in a large reservoir. North Am. J. Fisheries Manage. 17, 378–386. doi: 10.1577/1548-8675(1997)017<0378:POFAAW>2.3.CO;2
Collier Z. A., Bates M. E., Wood M. D., and Linkov I. (2014). Stakeholder engagement in dredged material management decisions. Sci. Total Environ. 496, 248–256. doi: 10.1016/j.scitotenv.2014.07.044
Costanza R., d’Arge R., De Groot R., Farber S., Grasso M., Hannon B., et al. (1997). The value of the world’s ecosystem services and natural capital. Nature 387, 253–260. doi: 10.1038/387253a0
Cura J. J., Bridges T. S., and McArdle M. E. (2004). Comparative risk assessment methods and their applicability to dredged material management decision-making. Hum. Ecol. Risk Assess. 10, 485–503. doi: 10.1080/10807030490452160
Daly A. J., Baetens J. M., and De Baets B. (2018). Ecological diversity: measuring the unmeasurable. Mathematics 6, 119. doi: 10.3390/math6070119
Dawe N. K., Bradfield G. E., Boyd W. S., Trethewey D. E. C., and Zolbrod A. N. (2000). Marsh creation in a northern Pacific estuary: Is thirteen years of monitoring vegetation dynamics enough? Conserv. Ecol. 4, 12. doi: 10.5751/ES-00214-040212
de Groot R. S., Wilson M. A., and Boumans R. M. (2002). A typology for the classification, description and valuation of ecosystem functions, goods and services. Ecol. Econ 41, 393–408. doi: 10.1016/S0921-8009(02)00089-7
DeWitt T. H., Berry W. J., Canfield T. J., Fulford R. S., Harwell M. C., Hoffman J. C., et al. (2020). ““The final ecosystem goods and services (FEGS) approach: A beneficiary centric method to support ecosystem-based management,”,” in Ecosystem-based management, ecosystem services and aquatic biodiversity: theory, tools and applications. Eds. O’Higgins T. G., Lago M., and Dewitt T. H. (SpringerOpen, Cham, Switzerland), 127–148. doi: 10.1007/978-3-030-45843-0
Diefenderfer H. L., Borde A. B., Cullinan V. I., Johnson L. L., and Roegner G. C. (2024). Effects of river infrastructure, dredged material placement, and altered hydrogeomorphic processes: The stress ecology of floodplain wetlands and associated fish communities. Sci. Total Environ. 957, 176799. doi: 10.1016/j.scitotenv.2024.176799
Fisher B., Turner R. K., and Morling P. (2009). Defining and classifying ecosystem services for decision making. Ecol. Econ 68, 643–653. doi: 10.1016/j.ecolecon.2008.09.014
Foran C. M., Burks-Copes K. A., Berkowitz J., Corbino J., and Suedel B. C. (2018). Quantifying wildlife and navigation benefits of a dredging beneficial-use project in the lower atchafalaya river: A demonstration of engineering with nature®. Integrated Environ. Assess. Manage. 14, 759–768. doi: 10.1002/ieam.4084
Hanna D. E. L., Tomscha S. A., Dallaire C. O., and Bennett E. M. (2017). A review of riverine ecosystem service quantification: Research gaps and recommendations. J. Appl. Ecol. 55, 1299–1311. doi: 10.1111/1365-2664.13045
Harwell M. A., Gentile J. H., McKinney L. D., Tunnell J. W. Jr, Dennison W. C., Kelsey R. H., et al. (2019). Conceptual framework for assessing ecosystem health. Integrated Environ. Assess. Manage. 15 (4), 544–564. doi: 10.1002/ieam.4152
Harwell M. C. and Jackson C. A. (2021). Synthesis of Two Decades of USEPA’s Ecosystem Services Research to Inform Environmental, Community, and Sustainability Decision Making. Sustainability. 13, 8249. doi: 10.3390/su13158249
Hood W. G., Blauvelt K., Bottom D. L., Castro J. M., Johnson G. E., Jones K. K., et al. (2022). Using landscape ecology principles to prioritize habitat restoration projects across the Columbia River Estuary. Restoration Ecology 30 (3), e13519. doi: 10.1111/rec.13519
Heip C. H., Herman P. M., and Soetaert K. (1998). Indices of diversity and evenness. Oceanis 24, 61–88.
Herman B. D., Whitfield P. E., Davis J., Tritinger A. S., Golden B. R., Dillon S. C., et al. (2023). “Swan Island resilience model development; phase I: conceptual model,” in ERDC TR-23-1 (Vicksburg, MS: The US Army Engineer Research and Development Center (ERDC)). doi: 10.21079/11681/46402
Hernandez C. L., Sharpe L. M., Jackson C. A., Harwell M. C., and DeWitt T. H. (2024). Connecting stakeholder priorities and desired environmental attributes for wetland restoration using ecosystem services and a heat map analysis for communication. Front. Ecol. Evol. 12. doi: 10.3389/fevo.2024.1290090
Hong G. H., Kim S. H., Suedel B. C., Clarke J. U., and Kim J. (2010). A decision-analysis approach for contaminated dredged material management in South Korea. Integrated Environ. Assess. Manage. 6, 72–82. doi: 10.1897/IEAM_2009-033.1
Jackson C. A., Hernandez C. L., Yee S. H., Nash M. S., Diefenderfer H. L., Borde A. B., et al. (2024). Identifying priority ecosystem services in tidal wetland restoration. Front. Ecol. Evol. 12. doi: 10.3389/fevo.2024.1260447
Janousek C. N., Thorne K. M., and Takekawa J. Y. (2019). Vertical zonation and niche breadth of tidal marsh plants along the northeast Pacific coast. Estuaries Coasts 42, 85–98. doi: 10.1007/s12237-018-0420-9
Keil G. K., Estes T. J., Kreitinger J. P., Lotufo G. R., Price R. A., Suedel B. C., et al. (2022). Environmental evaluation and management of dredged material for beneficial use: a regional beneficial use testing manual for the Great Lakes. (The US Army Engineer Research and Development Center (ERDC)), 295. doi: 10.21079/11681/45024
Kindsvater H. K., Dulvy N. K., Horswill C., Juan-Jordá M.-J., Mangel M., and Matthiopoulos J. (2018). Overcoming the data crisis in biodiversity conservation. Trends Ecol. Evol. 33, 676–688. doi: 10.1016/j.tree.2018.06.004
Krainyk A., Koczur L. M., and Ballard B. M. (2020). A spatial model for the beneficial use of dredge spoil deposition: Creation and management of breeding habitat for reddish egrets in Texas. J. Environ. Manage. 260, 110022. doi: 10.1016/j.jenvman.2019.110022
Lee Y. W., Bogardi I., and Stansbury J. (1991). Fuzzy decision making in dredged-material management. J. Environ. Eng. 117, 614–630. doi: 10.1061/(ASCE)0733-9372(1991)117:5(614
Linkov I., Welle P., Loney D., Tkachuk A., Canis L., Kim J. B., et al. (2011). Use of multicriteria decision analysis to support weight of evidence evaluation. Risk Analysis. 31, 1211–1225. doi: 10.1111/j.1539-6924.2011.01585.x
Littles C. J., Lewis N. S., DeWitt T. H., and Harwell M. C. (2023). Recreational beneficiaries and their landscape dependencies across national estuary program sites: Tillamook Bay (OR) and Tampa Bay (FL), USA. Ecosyst. People 19, 2276756. doi: 10.1080/26395916.2023.2276756
Littles C. J., Trachtenbarg D. A., Moritz H. R., Swanson D. C., Woolbright R. W., Herzog K. M., et al. (2024). “Site selection and conceptual designs for beneficial use of dredged material sites for habitat creation in the Lower Columbia River,” in ERDC/CHL TR-24-10, US army engineer research and development center(Vicksburg: The US Army Engineer Research and Development Center (ERDC)), 41. doi: 10.21079/11681/48550
Loreau M. (1998). Ecosystem development explained by competition within and between material cycles. Proc. R. Soc. London. Ser. B: Biol. Sci. 265, 33–38. doi: 10.1098/rspb.1998.0260
Loreau M. (2001). Microbial diversity, producer–decomposer interactions and ecosystem processes: a theoretical model. Proc. R. Soc. London. Ser. B: Biol. Sci. 268, 303–309. doi: 10.1098/rspb.2000.1366
Munari C. and Mistri M. (2014). Spatio-temporal pattern of community development in dredged material used for habitat enhancement: A study case in a brackish lagoon. Mar. pollut. Bull. 89, 340–347. doi: 10.1016/j.marpolbul.2014.09.039
Neckles H. A., Lyons J. E., Guntenspergen G. R., Shriver W. G., and Adamowicz S. C. (2015). Use of structured decision making to identify monitoring variables and management priorities for salt marsh ecosystems. Estuaries Coasts 38, 1215–1232. doi: 10.1007/s12237-014-9822-5
Newton A. Mistri M., Pérez-Ruzafa A., and Reizopoulou S. (2023). Ecosystem services, biodiversity, and water quality in transitional ecosystems. Front. Ecol. Evol. 11. doi: 10.3389/fevo.2023.1136750
O’Connor M. I., Gonzalez A., Byrnes J. E. K., Cardinale B. J., Duffy J. E., Gamfeldt L., et al. (2017). A general biodiversity–function relationship is mediated by trophic level. Oikos 126, 18–31. doi: 10.1111/oik.03652
Olander L. P., Johnston R. J., Tallis H., Kagan J., Maguire L. A., Polasky S., et al. (2018). Benefit relevant indicators: Ecosystem services measures that link ecological and social outcomes. Ecol. Indic. 85, 1262–1272. doi: 10.1016/j.ecolind.2017.12.001
Piczak M. L., Robichaud J. A., Morrison P., Rous A. M., Mulder I. M., Hill C. J., et al. (2024). Structured decision making remains underused in ecological restoration despite opportunities. Environ. Syst. Decisions. 44, 1–15. doi: 10.1007/s10669-023-09940-z
Piesschaert F., Mertens J., Huybrechts W., and De Rache P. (2005). Early vegetation succession and management options on a brackish sediment dike. Ecol. Eng. 25, 349–364. doi: 10.1016/j.ecoleng.2005.06.004
Rankin L. L., Jones S. F., Janousek C. N., Buffington K. J., Takekawa J. Y., and Thorne K. M. (2023). Stress gradients structure spatial variability in coastal tidal marsh plant composition and diversity in a major Pacific coast estuary. Front. Ecol. Evol. 11. doi: 10.3389/fevo.2023.1215964
Regional Sediment Management Program (RSMP) (2025). “RSM sediment placement data viewer: 2022-present.(U.S. Army Engineer Research and Development Center). Available online at: https://experience.arcgis.com/experience/448e41753a1f408e9dd2c98896e818c0/page/2022-Present (Accessed August 15, 2025).
Russ E. R., Yarnall A. H., Balazik M. T., Blanche J. T., Draper A. J., and Altman S. (2025). “Beneficial use of dredged material for submerged aquatic vegetation habitats: overcoming challenges and seeking new opportunities,” in ERDC/TN EWN-25-1 (US Army Engineer Research and Development Center, Vicksburg, MS).
Scheffler A., Roth T., and Ahlf W. (2014). Sustainable decision making under uncertainty: a case study in dredged material management. Environ. Sci. Europe 26, 7. doi: 10.1186/2190-4715-26-7
Schoolmaster D. R. Jr., Zirbel C. R., and Cronin J. P. (2020). A graphical causal model for resolving species identity effects and biodiversity–ecosystem function correlations. Ecology 101, e03070. doi: 10.1002/ecy.3070
Suedel B. C., McQueen A. D., Wilkens J. L., Saltus C. L., Bourne S. G., Gailani J. Z., et al. (2022). Beneficial use of dredged sediment as a sustainable practice for restoring coastal marsh habitat. Integrated Environ. Assess. Manage. 18, 1162–1173. doi: 10.1002/ieam.4501
Tilman D., Isbell F., and Cowles J. M. (2014). Biodiversity and ecosystem functioning. Annu. Rev. Ecology Evolution Systematics 45, 471–493. doi: 10.1146/annurev-ecolsys-120213-091917
Ulibarri N., Goodrich K. A., Wagle P., Brand M., Matthew R., Stein E. D., et al. (2020). Barriers and opportunities for beneficial reuse of sediment to support coastal resilience. Ocean Coast. Manage. 195, 105287. doi: 10.1016/j.ocecoaman.2020.105287
USACE (2015). Dredging and dredged material management. Engineering manual, EM 1110-2-5025 (Washington, DC). Available online at: https://www.publications.usace.army.mil/portals/76/publications/engineermanuals/em_1110-2-5025.pdf (Accessed July 15, 2025).
Van Riel M. C., Vonk J. A., Verdonschot R. C. M., Muñoz J. F., and Verdonschot P. F. M. (2022). Using dredged sediments to support wetland plant development in a constructed delta lake. Ecol. Eng. 178, 106568. doi: 10.1016/j.ecoleng.2022.106568
Walker J., Stein E. B., O’Connor K., Clark R., Whitcraft C., Garcia S., et al. (2023). “Estuary marine protected area monitoring protocol,” in A report prepared for the California Ocean Protection Council and the California Department of Fish and Wildlife US: Southern California Coastal Water Research Project, Costa Mesa, CA), 29. Available online at: https://ftp.sccwrp.org/pub/download/PROJECTS/EMPA/deliverables/monitoring_manual.pdf.
Keywords: dredged material disposal, beneficial use, stakeholder engagement, habitat benefits, ecosystem functions, habitat restoration
Citation: Littles CJ, Russ ER, Lemasson BH, Schultz MT, Tidwell KS, Moritz HR and Carroll ST (2025) Stakeholder feedback on ecological benefits at dredged material placement sites. Front. Ecol. Evol. 13:1686792. doi: 10.3389/fevo.2025.1686792
Received: 15 August 2025; Accepted: 21 November 2025; Revised: 18 November 2025;
Published: 12 December 2025.
Edited by:
Stephanie Dohner, Naval Research Laboratory, United StatesReviewed by:
Susan Harrell Yee, United States Environmental Protection Agency, United StatesKatrina Armstrong, University of Maine, United States
Copyright © 2025 Littles, Russ, Lemasson, Schultz, Tidwell, Moritz and Carroll. This is an open-access article distributed under the terms of the Creative Commons Attribution License (CC BY). The use, distribution or reproduction in other forums is permitted, provided the original author(s) and the copyright owner(s) are credited and that the original publication in this journal is cited, in accordance with accepted academic practice. No use, distribution or reproduction is permitted which does not comply with these terms.
*Correspondence: Chanda J. Littles, Y2hhbmRhLmoubGl0dGxlc0B1c2FjZS5hcm15Lm1pbA==
†ORCID: Chanda J. Littles, orcid.org/0000-0002-4208-9061
Emily R. Russ, orcid.org/0000-0001-7495-8316
Bertrand H. Lemasson, orcid.org/0000-0001-8022-110X
Martin T. Schultz, orcid.org/0000-0002-0760-0266
Kyle S. Tidwell, orcid.org/0000-0003-0178-9149