 Yotam Zait
 Amnon Schwartz
- The Robert H. Smith Institute of Plant Sciences and Genetics in Agriculture, Faculty of Agriculture, Food, and Environment, The Hebrew University of Jerusalem, Rehovot, Israel
Current climatic changes are subjecting plants to increasing amounts of abiotic stress and intensifying desertification in many regions. The identification of tree species that can survive extremely limited water conditions may assist in limiting regional desertification processes and mitigating the greenhouse effect. Ziziphus spina-christi is a thermophilic tree from Sudan that is highly tolerant of heat and drought. In recent years, this tree has become more abundant in the Mediterranean region. In order to predict how a warm and dry climate influences the successful establishment of this species, we compared the seasonal photosynthesis of Z. spina-christi trees growing in a Mediterranean climate and a semi-arid climate. At each site, we measured the seasonal changes in gas exchange, chlorophyll fluorescence, and stem water potential (Ψstem). We quantitatively compared the seasonality of factors that limit photosynthesis: stomatal conductance (gs), mesophyll conductance (gm), and maximal capacity for Rubisco carboxylation (Vcmax). Our results revealed differences in the seasonality of the trees' photosynthetic capacities, as well as different drought avoidance and tolerance strategies at the two different sites. Trees grown at the Mediterranean-climate site exhibited high photosynthetic activity during winter-spring and summer, but significantly less photosynthetic activity during the fall drought. During periods of drought, the overall limitation of photosynthesis was mostly due to strong stomatal regulation. Trees in the Mediterranean sites compensate for their lower gs with a larger gm and high Vcmax. In contrast, at the semi-arid site, peak photosynthesis was observed in the spring and fall. The reduced photosynthesis during the summer drought and the period of low temperatures during the winter were associated with greater reduction in gm, as compared to gs, and increased investment in photoprotective mechanisms (NPQ and photorespiration). Relatively low midday Ψstem was observed at both sites during the driest period (> −2.2 MPa), revealing that this species employs drought-avoidance strategies. Our results demonstrate how Z. spina-christi could be an attractive tree for afforestation programs in semi-arid areas and how climate change may give it an ecological advantage that may lead to its becoming more widely distributed across this region in future decades.
Introduction
Climate change can influence habitats in several ways, including extremely hot temperatures, reduced precipitation and increased soil salination, which, in turn, can influence biodiversity (Saxe et al., 2001; Walther et al., 2002). These changes may cause species to either expand or reduce their geographical distribution (Battisti et al., 2005; Fält-Nardmann et al., 2018). Such changes in the geographic distributions of different species might cause profound and possibly irreversible changes in plant community structures (Hoffmann and Sgró, 2011). Therefore, research, monitoring and mapping of species' vulnerability to climate change is crucial for both preservation and agroforestry (Bussotti and Pollastrini, 2017). Traditionally, climate change has been associated with negative effects on tree survival and establishment (Allen et al., 2010). Increasing temperatures lead to higher atmospheric evaporative demand, which intensifies drought periods and may lead to declines in forest productivity and tree dieback (Williams et al., 2013). Warming also suppresses photosynthesis by reducing Rubisco activity (Way and Sage, 2008). However, for thermophilic trees that are highly sensitive to low temperatures, an increase in temperature may have beneficial effects (Way and Oren, 2010).
Ziziphus spina-christi (Rhamnaceae) is a thermophilic tree that grows in northeastern Africa, the Arabian peninsula, the Eastern Mediterranean basin and tropical and subtropical areas of Asia (Saied et al., 2008). The tree originated in the arid, subtropical Sudanese climate, which is characterized by high temperatures throughout the year (temperatures that never drop below 17°C). Z. spina-christi is basically evergreen, but under conditions of low temperature in the winter and/or severe drought in the summer, the tree is deciduous or semi-deciduous (i.e., facultative deciduous; Liphschitz and Waisel, 1970). The geographical distribution of Z. spina-christi is not determined by the amount of precipitation, as it can successfully grow in areas with annual rainfall of less than 50 mm y−1, but by minimum winter temperatures (see Figure S1).
In recent years, this tree has become more abundant in the Eastern Mediterranean region (BioGIS, 2018). We presume that changing abiotic conditions, especially increasing regional winter temperatures, enhance growth and photosynthesis in this species (Zait et al., 2018).
As many semi-arid regions are seriously affected by desertification (Asner and Heidebrecht, 2005), finding tree species that can survive extremely limited water conditions may assist in limiting regional desertification processes. Trees play an important role in preventing soil erosion and improving the livelihood of human populations. However, very few species are suitable for use in afforestation programs in arid and semi-arid areas. In recent years, Z. spina-christi has been planted in many semi-arid and arid regions such as the Israeli Negev, Abu Dhabi, and Saudi Arabia (Adgaba et al., 2013; Al Yamani et al., 2018). Yet, the physiological properties that allow the tree to cope with extreme water-limiting conditions have not been studied as much as those of other forest trees.
One important adaptive feature that helps this tree to survive prolonged periods of drought is its ability to perform photosynthesis while limiting water loss (Zait et al., 2018). The decline in photosynthesis during drought periods is associated with stomatal and non-stomatal limitations (Jones, 1985). The stomata control both the diffusion of CO2 from the atmosphere to the leaf intercellular air space, and the diffusion of water from the leaf to the atmosphere (Raschke, 1975). Thus stomatal conductance is termed as the diffusion rate of water vapor (gsw) or CO2 (gsc), passing through the stomata pores (Farquhar and Sharkey, 1982).
The non-stomatal factors controlling the rate of photosynthesis include both the mesophyll conductance of CO2 and biochemical limitations. The mesophyll conductance of CO2 (gm) determines the rate at which CO2 diffuses from the leaf intercellular airspace into the site of carboxylation, located in the stroma of the chloroplasts (Gaastra, 1959). The biochemical efficiency of photosynthesis is determined mostly by the Rubisco carboxylation capacity (Vcmax; Farquhar et al., 1980). Hence, photosynthesis can be limited by a reduction in any one of these three factors: gsc, gm, or Vcmax (Grassi and Magnani, 2005). The ability of forest trees to acclimate to an environment can be predicted, if we understand the seasonal patterns of their photosynthesis-limiting factors (Zhou et al., 2014). It is well recognized that stomatal closure is the most immediate response to decreased water potential (Ψw) under drought (Chaves et al., 2002). However, it is not clear which processes become more limiting as drought progresses. For example, species with the ability to sustain higher values of gm and Vcamx, under unfavorable conditions, are known to be more tolerant (Cano et al., 2014; Théroux-rancourt et al., 2015).
While many studies have addressed different aspects of photosynthetic limitations during drought periods in Mediterranean climates (Grassi and Magnani, 2005; Limousin et al., 2010; Misson et al., 2010; Egea et al., 2011; Stpaul et al., 2012; Sperlich et al., 2016), there is still a lack of data on trees grown in arid and semi-arid regions.
This research examined the physiological properties of the Z. spina-christi tree in its natural habitat in a Mediterranean climate and in a planted forest in a semi-arid climate. We examined environmental influences throughout the year, emphasizing photosynthesis-limiting factors: stomatal, mesophyll, and biochemical. Our main goal was to evaluate the seasonal trends of photosynthesis, in order to assess the growth capacities of this species in Mediterranean and semi-arid regions. We aimed to quantify and characterize the drought tolerance of this species throughout the summer and fall drought, and in response to low temperatures during the winter.
Materials and Methods
Description of Experimental Sites
The study was conducted at two sites characterized by different climates. The first site, Neot Kedumim, is a nature preserve located near Modi'in, Israel) 31°56′52.3″N 34°58′23.1″E(. The park covers an area of 25 km2 and is characterized by a Mediterranean climate with annual precipitation of 520 mm y−1 and dry summer. At this site, we sampled four representative trees (12- to 15-years-old) which were growing on the northern slopes of hillsides. The second site was located in the Ambassadors Forest, which cover a total area of 15 km2 (north of Be'er Sheva, Israel (31°19′20.3″N 34°46′40.3″E) and is characterized by a semi-arid climate with hot and dry summers, mild winter temperatures and average annual precipitation of 229 mm y−1. At this site, we sampled six representative trees for the study. Those trees were planted in 2005 on earthen berms constructed as part of a project to dam a desert wadi and collect floodwater. Climatic data for the study period: maximum temperature, vapor pressure deficit, and mean precipitation obtained from automatic meteorological stations located near the study site (Rain Gage- TE525-L; (Campbell Scientific, Utah, USA) and Humidity and Temperature Meter HMT330 (Vaisala Inc., Vantaa, Finland)). The measurement campaigns were conducted on the following dates in the Mediterranean site (dd/mm/yy): 15/07/14, 13/08/14, 11/09/14, 28/10/14, 25/12/14, 17/03/15, 20/04/15, 21/05/15, 23/06/15, 29/07/15,18/08/15, 24/09/15, 23/12/15, 14/01/16, 18/02/16, 24/03/16, 23/05/16, 03/08/16, and 16/11/16 and in the semi-arid site: 12/06/14, 10/09/14, 26/10/14, 02/12/14, 29/01/15, 11/03/15, 21/04/15, 04/06/15, 09/07/15, 17/08/15, 29/09/15, 09/12/15, 28/01/16, 04/04/16, 01/08/16, and 21/09/16.
Gas-Exchange and Chlorophyll-Fluorescence Measurements
All measurements were performed in situ between 09:00 and 11:00 (solar time) only under clear sky conditions. All measurements were carried out on sun-exposed leaves from the upper and outer side of the tree crown. We used five technical measurements per tree. Gas-exchange measurements were conducted with the Li-6400 portable photosynthesis measurement system, equipped with a 2-cm2 fluorescence leaf chamber (6400-40 leaf-chamber fluorometer, LiCor Inc.; Lincoln, Nebraska, USA). Measurements were conducted at a saturated light intensity level of 1500 μmol photons m−2 s−1, with an air flow of 500 μmol air s−1, at ambient leaf temperature and RH.
CO2- and Light-Response Curves
Combined CO2-response curves for gas exchange and chlorophyll fluorescence were constructed as follows. The initial CO2 concentration was targeted to 400 μmol CO2 mol−1 air level and then reduced to 300, 200, 150, 100, 75, and 50 ppm. Then, the CO2 concentration was returned to 400 μmol CO2 mol−1 air and then increased to 600, 800,1000, 1200, 1600 μmol CO2 mol−1 air. The time interval between each CO2 level was set to 2 min. By the end of the series of measurements carried out to construct the first CO2-response curve, the inlet air was replaced with 2% O2 and the leaves were acclimated for 10 min to a fixed 400 μmol CO2 mol−1 air and an additional CO2-response curve was obtained. A/Ci curves were fitted using “Plantecophys” R Package for analyzing and modeling leaf gas exchange Data (Duursma, 2015).
Light-response curves with simultaneous measurements of chlorophyll fluorescence were constructed based on ambient (21% in air) and low O2 concentrations (2% in air). The measurement sequence involved light intensities of: 1500, 2000, 1500, 1200, 1000, 800, 600, 400, 300, 200, 100, and 50 μmol photons m2 s−1. The time interval between each light-intensity level was 1 min. The light-response curves were analyzed using a non-rectangular hyperbolic model (Marshall and Biscoe, 1980):
where An is the net photosynthesis rate, PPFD is the light intensity, Amax is the photosynthetic rate under saturated light conditions, α is the photosynthetic efficiency, θ is the convexity (−) and Rd is the leaf's dark respiration.
The total amount of photorespiration (F) was calculated as:
Where A2% and A21% are the observed net photosynthesis rate at O2 concentrations of 2% and 21%, respectively.
Estimation of Mesophyll Conductance
Mesophyll conductance (gm), was estimated using the variable J method (Harley et al., 1992):
where AN is the net rate of photosynthesis and Ci is the CO2 concentration inside leaf intercellular airspaces (both determined from gas exchange measurements). Cc is the CO2 concentration in the chloroplast stroma, estimated as:
where ETR is the electron-transport rate calculated based on chlorophyll fluorescence, calibrated by the gas-exchange data. Rd is the non-photorespiratory respiration in light and Γ* is the apparent photo-compensation point for Z. spina-christi, taken from Zait et al. (2018). To calculate the rate of ETR, we constructed CO2-response and light-response curves in the absence of photorespiration (2% O2 in air). The actual quantum efficiency of photosystem II (ΦPS2) was calculated according to Genty et al. (1989):
where Fm′ is the maximum fluorescence after a light-saturating pulse of ~8000 μmol photons m−2 s−1 and Fs is the steady-state fluorescence under continuous light.
The electron transport rate (ETR) was calculated as:
where α is the coefficient of leaf absorbance and β is the fraction of absorbed quanta that reach photosystem II.
The quantum yield of CO2 fixation (ΦCO2) was calculated from the gas-exchange data as:
Agreement between gas exchange and chlorophyll florescence was predicted on the assumption that under non-(photo)respiratory conditions, there is a linear relationship between ΦPS2 and ΦCO2, since CO2 fixation is the only sink for electrons (Valentini et al., 1995). The theoretical model and experimental observations were limited to the linear region of ΦCO2 < 0.05, and ΦPS2 < 0.5. The slope of the linear regression (k) and the y-axis intercept (b) were used to recalculate the (α*β) for the electron-transport rate (ETRcal) based on chlorophyll flourecence measured under ambient oxygen conditions (O2 = 21%) as:
The portion of electrons to carboxylation (ETRc) or oxygenation (ETRo) was estimated from Valentini et al. (1995):
Non-photochemical quenching (NPQ) was used to estimate the rate constant for heat loss from photosystem II and was calculated as:
where Fm is the maximal fluorescence following 30 min of dark adaptation.
Photosynthesis Model and Quantitative Limitations
The AN/Ci curves were converted into AN/Cc charts and analyzed using a fitting tool described by Sharkey et al. (2007). We later used the AN/Cc charts to calculate the absolute limitations of net photosynthesis, as described by Grassi and Magnani (2005). In brief, as described by Farquhar et al. (1980), light-saturated photosynthesis can be expressed as:
where Ac is the photosynthesis rate in the Rubisco carboxylation-limited stage, Vcmax is the maximum rate of Rubisco carboxylation, Cc is the CO2 partial pressure at the site of carboxylation, O is the O2 partial pressure at the site of carboxylation, Kc and Ko are Michaelis-Menten constants of Rubisco for carboxylation and oxygenation and Rd is the rate of respiration in the light.
The rate of photosynthesis can be limited either by substance availability (Cc) caused by diffusional restrictions (stomatal and mesophyll conductance) or by biochemical factors (changes in Vcmax). Therefore, the total photosynthetic limitation is divided into three components: stomatal limitation (Ls), mesophyll limitation (Lm), and biochemical limitations (Lb). Changes in light-saturated photosynthesis (ΔAc/Ac) can be expressed in terms parallel to the relative changes in gsc (gsw/1.6), gm, and Vcmax:
where gt is the total CO2 leaf conductance, calculated as:
and ∂AN/∂Cc is the first derivative of the A/Cc curves calculated as:
Where Km is the effective Michaelis-Menten constant for CO2. Total limitations on the rate of photosynthesis were calculated according to the maximum reference photosynthesis (Amax): ΔAN/AN = (Amax−AN)/AN.
Measurements of Leaf Water Potential
Seasonal midday monitoring of stem water potential- Ψstem was done using pressure chamber (ARIMAD 3000, MRC, Holon, Israel). Measurement were taken on leaves entered into a plastic bag covered with opaque silver bag about an hour before detached to enable equilibrium between leaf and stem water potentials (Naor, 2000). After an equilibrating period, the leaves were detached from the shoot, and Ψstem was determined immediately with a pressure chamber. All measurements were taken between 9:30 and 11:30.
Measurements of Leaf Area
Leaf area was estimated using a nondestructive SunScan canopy analysis system (model SS1- R3-BF3, Delta-T Devices; Cambridge, UK). Leaf area index (LAI) was calculated as the ratio of total green surfaces, including leaves, shoots, and fruit (when present) to a unit of land area allocated for each tree (m2 m−2). The total leaf area for one tree was then calculated as the LAI * measurement square land area (16 m2). As for the winter, there are limitations to using the SunScan meter because in winter sunlight zenith angles are too flat (lower than 30°-degree threshold) so radiation under the plastic is scattered. For this reason, we did not measure LAI in the winter.
Osmotic Adjustment Analysis
Six leaves from each tree were collected at midday (11:00–12:00) and each inserted into a tube filled with water and rehydrated for 12 h. The leaves were then transferred into liquid nitrogen. Leaves were transferred into 0.5-ml Eppendorf tubes and centrifuged to extract the tissue sap. The osmotic potential (Ψs) of the extracted sap was determined using a vapor pressure osmometer (Model 5600, ELITech Group; Puteaux, France).
Analysis of Leaf Starch and Soluble Sugars
Starch and soluble sugars were quantified using spectrophotometry. All leaves were sampled during middle of the day (11:00–12:00). Sampled leaves were dried at 70°C for 48 h and then ground to fine powder. One hundred mg of fine powder were extracted three times in 80°C Ethanol (80%). Total soluble sugar content was determined using the Anthrone reagent method (Dubois et al., 1956). To determine starch content, the dried residue was analyzed following Amyloglucosidase digestion according to (Vishnevetsky et al., 2000). Detection of reaction products was recorded by absorption of light at 620 nm wavelength with a spectrometer (Hitachi U-3900, Tokyo, Japan). The final concentration was determined by calibration curves of known amounts of Starch and Glucose.
Statistical Analysis
Analysis of variance (ANOVA) was used (JMP 14 software, SAS Institute Inc., Cary, NC, USA) to identify any statistical variance between seasons at each site. The Tukey-Kramer post hoc test was used to compare the results. Data-fitting was carried out using MATLAB software (MathWorks Inc.; Natick, MA, USA).
Results
Meteorological Data and Stem Water Potential
During the study period, conditions at the semi-arid (SA) site were warmer and drier than those at the Mediterranean-climate (Med) site (Figure 1, Appendix). The Med site was characterized by a prolonged summer-fall drought period, from the end of April to October, with an average maximal temperature of 29°C and average max. VPD of 3.5 kPa (Figures 1A,B). The summer-fall drought period was followed by a winter period with a mean precipitation of 512 mm y−1 (Figure 1C), average max temperature of 16°C and an average maximum VPD of 1.8 kPa. The SA site was characterized by a prolonged summer drought period from April to October with an average high temperature of 32°C and average max. VPD of 4 kPa. At the SA site, the winter was more mild than at the Med site, with an average participation of 283 mm y−1, average max. temperature of 19°C and average max. VPD of 1.8 kPa. At both sites, drought continued from May until October, without any significant rain events during that period.
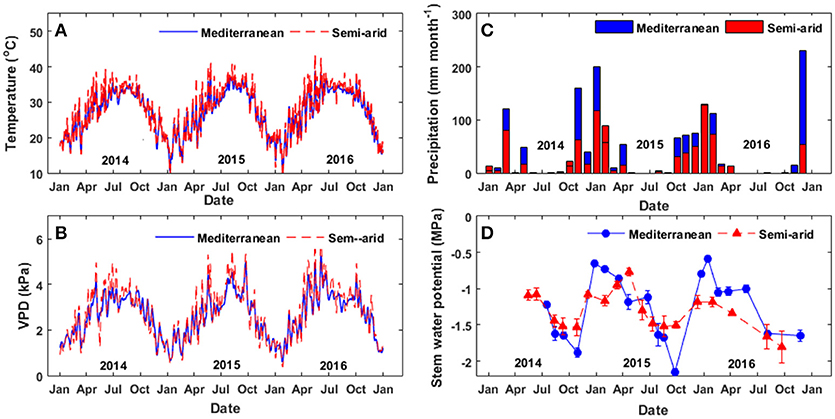
Figure 1. Metrological data from the two study sites. (A) Daily maximum temperature, (B) daily maximum vapor pressure, (C) monthly deficit precipitation and (D) midday stem water potential over the study period (2014–2016).
Seasonal midday stem water potential (Ψstem) at the Med site ranged from −0.8 to −1.2 MPa during the wet period (November to April) and from −1.4 to −1.6 MPa during the dry period (May to October; Figure 1D). Ψstem was higher at the Med site (−0.5 > Ψstem > −0.9 MPa) than at the SA site (−1.1 > Ψstem > −1.2 MPa) during the wet season, but declined at the end of the summer (−1.8 > Ψstem > −2.2 MPa). At the SA site, higher midday Ψstem values were measured during the spring (March-April; −0.8 > Ψstem > −1.1 MPa) and minimal values of ~−1.5 MPa were measured during the summer (July-September).
Seasonality of Gas-Exchange Parameters
In general, the trees at the Med site exhibited better physiological performance during the winter, summer and spring, as compared to the trees at the SA site. However, in the fall, the trees at the SA site performed better physiologically. The rate of photosynthesis at the Med site held steady at ~14–16 μmol CO2 m−2 s−1 during the winter months and increased to maximum values of ~19–24 μmol CO2 m−2 s−1 during the spring and summer (Figure 2).
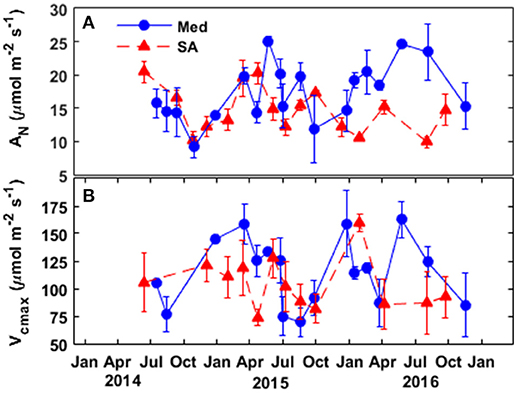
Figure 2. Seasonal patterns of (A) the rate of photosynthesis and (B) the maximal capacity for Rubisco carboxylation at the two study sites, Mediterranean (blue circles) and semi-arid (red triangles), over the study period (2014–2016).
During the fall drought of 2014 and 2015, photosynthesis declined by 25–50% (relative to the summer-spring average) to 11–15 μmol CO2 m−2 s−1. The photosynthesis rate reached its maximum level during the spring (~20 μmol CO2 m−2 s−1), declined during the summer to 10–14 μmol CO2 m−2 s−1, slightly improved to 14–17 μmol CO2 m−2 s−1 during the fall, and then dropped again to ~10–12 μmol CO2 m−2 s−1 during the winter. The maximum capacity for Rubisco carboxylation (Vcmax) based on the estimation of the chloroplastic CO2 concentration (Cc) was ~15–20% higher at the Med site than at the SA site throughout the wet season (winter-spring). At the Med site, Vcmax peaked over the January-April season at ~125–160 μmol CO2 m−2 s−1 and then declined to ~75 μmol CO2 m−2 s−1 during the fall drought. At the SA site, Vcmax values were in the range of ~80–120 μmol CO2 m−2 s−1 without any clear seasonal pattern.
The seasonal variations in stomatal conductance of CO2 (gsc) and mesophyll conductance (gm) between 2014 and 2016 are presented in Figure 3. At the Med site, gm was always 15-85% higher than gsc. In contrast, at the SA site, gsc was 10–45% higher than gm. At the Med site, the general seasonal pattern for stomatal conductance of CO2 showed relatively low values during winter (~0.1 mol m−2 s−1) and maximum values during the spring and summer (~0.15–0.17 mol m−2 s−1), with a gradual decrease in the fall (~0.09 mol m−2 s−1). gm was low throughout the fall and winter (~0.1 mol m−2 s−1) and peaked from late winter through the end of the summer (~0.2 and ~0.25 during 2015 and 2016, respectively).
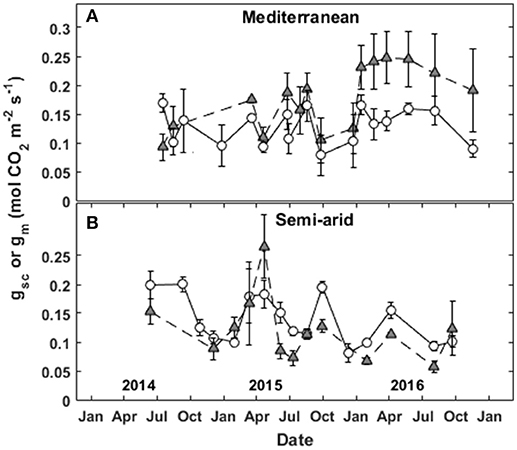
Figure 3. Seasonal patterns of stomatal conductance to CO2 (gsc; circles) and mesophyll conductance of CO2 (gm; triangles) at the (A) Mediterranean and (B) semi-arid sites over the study period (2014–2016).
At the SA site, gsc was lower throughout the winter (~0.07–0.1 mol m−2 s−1), peaked in the spring (~0.2 mol m−2 s−1), dropped over the summer (~0.1–0.12 mol m−2 s−1), and recovered during the fall (~0.12–0.19 mol m−2 s−1). gm was low during the winter (0.07–0.1 mol m−2 s−1), peaked in the spring (~0.13–0.26 mol m−2 s−1 in 2015 and 2016, respectively), was low during the summer (~0.06–0.1 mol m−2 s−1) and recovered slightly during the fall (~0.12 mol m−2 s−1).
The relationship between gsw and midday Ψstem varied during the different seasons (Figure 4). There were no correlations between gsw and midday Ψstem, or gm and midday Ψstem, during winter or spring at either site. (For the years 2014–2016, all winter data were collected from December through February and spring data were collected from March through May). Some correlation between gsw and midday Ψstem was found during the summer period (all data collected during June-August, for the years 2014–2016; R2 = 0.27, P = 0.0053 for Med and R2 = 0.39, P < 0.001 for SA; Figure 4E). A correlation was also found during the fall (all data from September-November for the years 2014-2016: R2 = 0. 55, P = 0.0017 for Med and R2 = 0.5, P = 0.0012 for SA; Figure 4G). No correlation was found between gm and midday Ψstem at the Med site (Figures 4B,D,F,H). In contrast, at the SA site, a correlation was observed, but only during the summer (R2 = 0.22, P = 0.0067; Figure 4F).
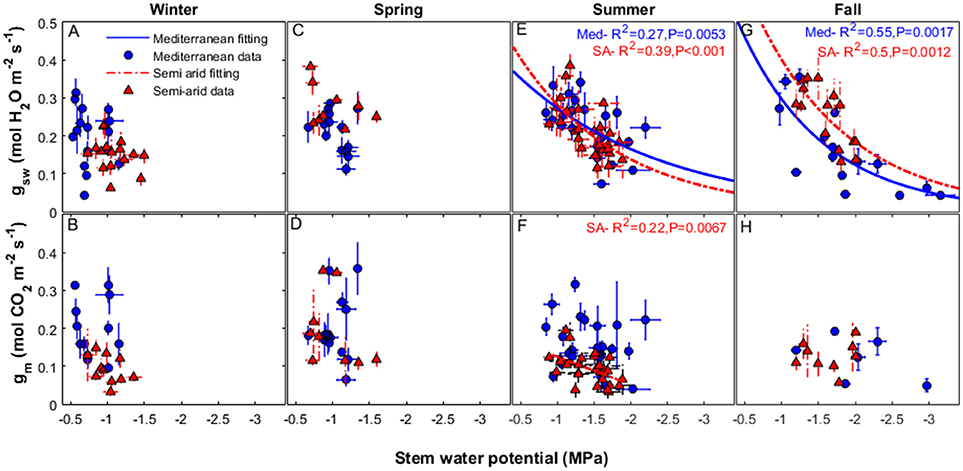
Figure 4. Relationships between stomatal conductance of water vapor (gsw) (upper panels) and mesophyll conductance (lower panels), to the midday stem water potential, over the study period (2014–2016) at the two study sites, Mediterranean (blue circles), and semi-arid (red triangles), during the winter (A, B), spring (C, D), summer (E, F), and fall (G, H). The continuous line represents the exponential decay fit for the data from the Mediterranean-climate site and the dashed line represents the exponential decay fit for the data from the semi-arid site. Each season refers to data that were collected in the following months: winter (December-February), spring (March-May), summer (June-August), and fall (September-November).
Representative AN/Ci curves (from 2015) and AN/PPFD curves (from 2016) for the different seasons are presented in Figure 5. Vcmax values (based on Ci and normalized to 25°C) were: 114 μmol m−2 s−1 at the Med site as compared to 62 μmol m−2 s−1 in SA during the winter; 84 μmol m−2 s−1 at the Med site as compared to 57 μmol m−2 s−1 at the SA site during the spring; 104 μmol m−2 s−1 at the Med site as compared to 65 μmol m−2 s−1 at the SA site during the summer; and 31 μmol m−2 s−1 at the Med site as compared to 65 μmol m−2 s−1 at the SA site during the fall. Note that all of the values presented in Figure 5 were calculated for Ci (without taking gm into consideration) and not for Cc, as presented in Figure 2.
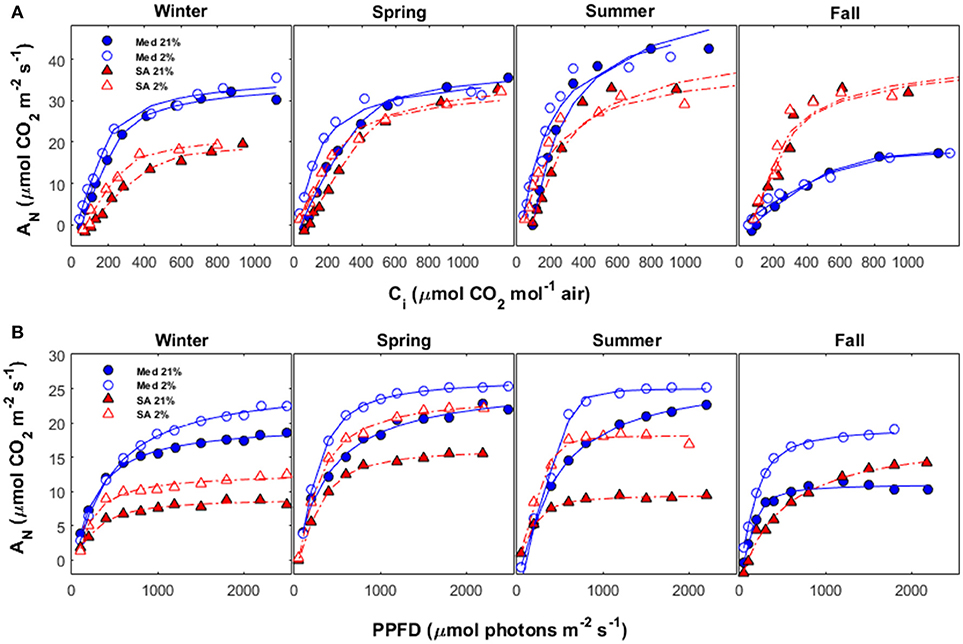
Figure 5. (A) AN vs. Ci and (B) AN vs. PPFD during different seasons (winter, spring, summer and fall) at the Mediterranean-climate site (blue circles) and the semi-arid site (red triangles). For each season, measurements were performed twice: once with ambient O2 (21% of air) and once under conditions unfavorable for photorespiration (2% of air). Data for each season were collected during the following months: winter (December-February), spring (March-May), summer (June-August), and fall (September-November).
The light-response curves showed that light-use efficiency (the initial slope of the light-response curve) was better at the Med site, as compared to the SA site, for all seasons (Figure 5B). No photoinhibition (reduction in the rate of photosynthesis at high light intensity) was observed in any of the light-response measurements taken at either site. The total amount of photorespiration at the Med site was relatively constant during the winter, spring, and summer (~15%), but increased dramatically during the fall drought (~43%). The total amount of photorespiration at the SA site was ~25% during the winter, declined to ~12% during the spring and then increased dramatically to ~50% during summer.
Seasonal variation in AN was closely coupled with gm (R2 = 0.66, P < 0.0001) and gsc (R2 = 0.64, P < 0.0001) at the Med site (Figure 6); at that site, there was an asymptotic exponential relationship between those variables. At the SA site, there was a stronger correlation between photosynthesis and gm (R2 = 0.68, P < 0.0001) than between photosynthesis and gsc.
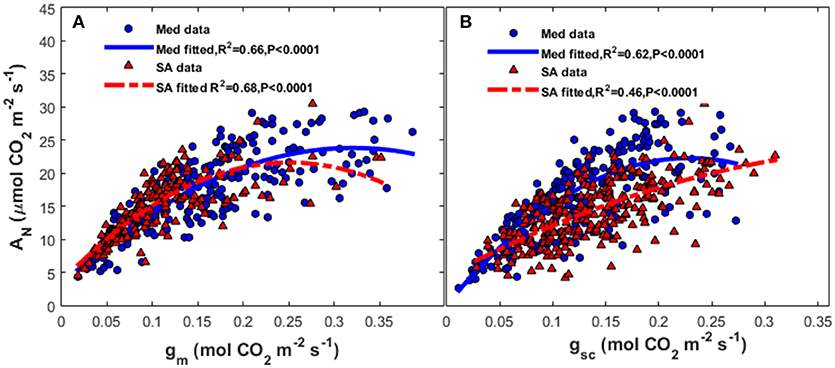
Figure 6. Relationships between (A) mesophyll conductance of CO2 (gm) and (B) stomatal conductance to CO2 (gsc) and the rate of photosynthesis (AN) at the Mediterranean-climate site (blue circles) and the semi-arid site (red triangles). The continuous line represents the polynomial fit for the Mediterranean data and the dashed line represents the polynomial fit for the semi-arid data.
At the Med site, the most severe limitation of maximum photosynthesis was found during the fall drought (46.8–56%); whereas at the SA site, severe limitations were observed during both the summer (41–57%) and winter (39–50%; Table 2). The contribution of the photosynthesis-limiting factors (gsc, gm and biochemical limitation caused by Vcmax) varied strongly with the season. The photosynthesis limitation during the fall drought at the Med site was dominated mostly by the stomata (22–24%), with lower levels of mesophyll (8.5–21%) and biochemical (10–16%) limitation. Conversely, at the SA site, the photosynthesis limitation during the summer drought was dominated by the mesophyll (23.1–32%) and stomatal (10.3–15%) and biochemical (4.4–15.7%) limitation were less important. Similar to the situation during the summer, the limitation throughout the winter period was also largely due to mesophyll limitation (17.4–32.2%). At both sites, throughout the study period, the biochemical factor made less of a contribution to the rate of photosynthesis (5–17.5%) than the diffusion limitation imposed by gm and gsc. The ratio between mesophyll conductance and stomatal conductance (gm:gs) was found to play an important role in the determination of the leaf intrinsic water-use efficiency (iWUE; Figure 7). Plotting iWUE against gm:gs revealed a strong correlation between those parameters at both sites (R2 = 0.73, P < 0.0001 for both).
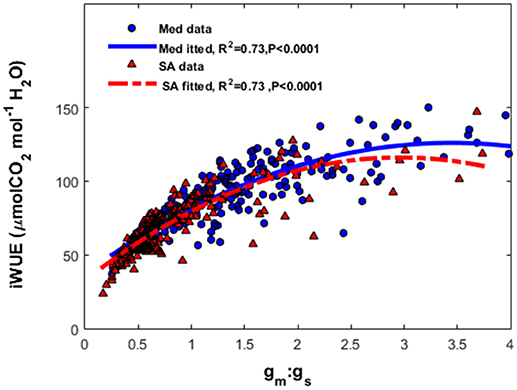
Figure 7. The relationship between the ratio of mesophyll conductance to stomatal conductance of CO2 (gm:gsc) and intrinsic water-use efficiency (iWUE) at the Mediterranean-climate site (blue squares) and semi-arid site (red triangles). The continuous line represents the polynomial fit for the Mediterranean data and the dashed line represents the polynomial fit for the semi-arid data.
Seasonal Changes in Leaf Area, Leaf Metabolites, and Osmotic Adjustment
At the Med site, the foliage starch content remained constant throughout winter, spring, and summer (32.6–33.1 mg g−1) and significantly decreased during the fall drought (21.1 mg g−1) (Table 1). The soluble carbohydrate (SC) content did not change significantly over the course of the year. Clear osmotic adjustment was observed during the fall drought (changes of 0.7 MPa relative to the osmotic potential at full turgor during the summer). Total leaf area was high in the spring (30.8 m2 tree−1), increased slightly during the summer (31.8 m2 tree−1) and declined during fall (26.5 m2 tree−1). At the SA site, the largest amounts of starch were observed in the summer (55.8 mg g−1) and those levels decreased gradually during the winter (32–25.6 mg g−1). SC values were also high during summer (38 mg g−1) and significantly lower during the fall (15.2 mg g−1) and winter (25.3 mg g−1). No clear osmotic adjustment associated with drought was observed at the SA site. Total leaf area was highest in the spring (28 m2 tree−1) and decreased throughout the summer (26.4 m2 tree−1) and fall (25.6 m2 tree−1).
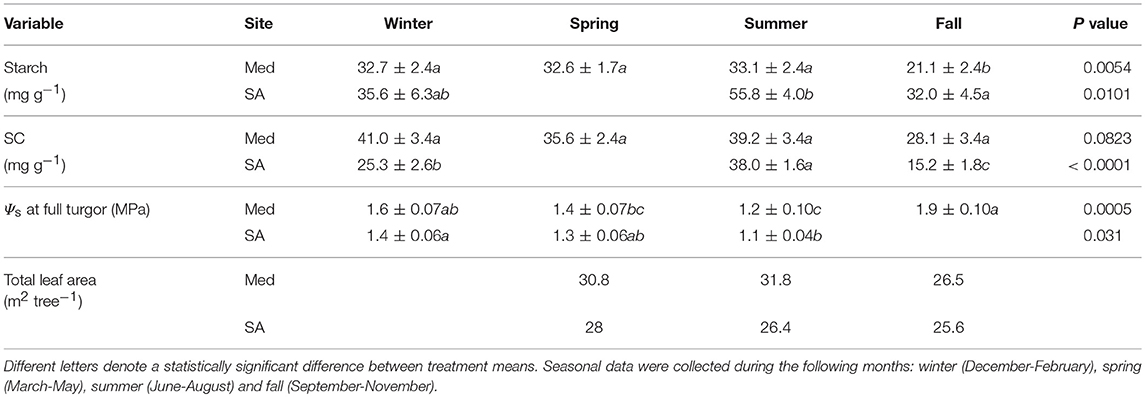
Table 1. Means (±standard errors) of foliar traits: total starch content, total soluble carbohydrate (SC) content, osmotic potential (Ψs) at full turgor and leaf area for Zizphus spina-christi at the Mediterranean-climate site (Med) and the semi-arid site (SA) over the different seasons of 2016 (n = 5–8).
Seasonal Effects on Photochemical Parameters
In general, the trees at the SA site exhibited more non-photochemical quenching (NPQ) than the trees at the Med site (Figure 8A). At the Med site, NPQ was relatively low (~0.5–0.8) during the spring and summer and then peaked at ~1.4 during the fall and winter periods. At the SA site, NPQ was low during the spring and fall (~1–1.4) and peaked during the summer drought, and as a result of low temperatures in the winter (~1.6–2.5). It is important to note that the extreme NPQ value (~4) observed in January 2015 at the SA site was observed after very cold night (Tmin = 3°C).
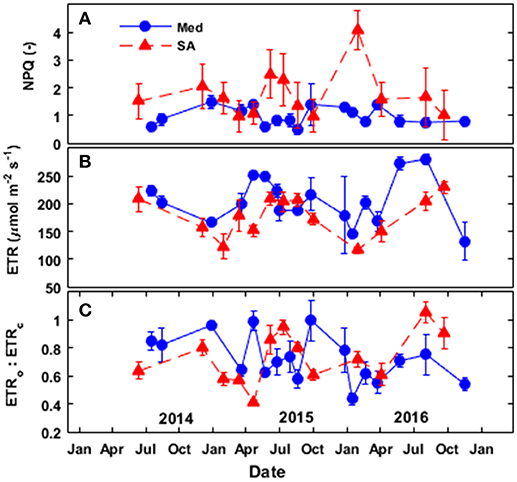
Figure 8. Seasonal patterns of (A) non-photochemical quenching (NPQ), (B) the calculated electron-transport rate (ETR), and (C) the ratio between the electron transport directed toward oxygenation and the electron transport directed toward carboxylation (ETRo:ETRc) at the Mediterranean-climate site (blue squares) and the semi-arid site (red triangles) over the study period (2014–2016).
The rate of electron transport at the Med site (seasonal average) was 15% greater than that observed at the SA site (Figure 8B). At both sites, the electron-transport rate (ETR) was high during the spring, summer and fall (~200–280 μmol e− m−2 s−1 at the Med site and ~150–230 μmol e− m−2 s−1 at the SA) and largely depressed during the winter (~130–185 μmol e− m−2 s−1 at the Med site and 110–120 μmole- m−2 s−1 at the SA site). Analysis of the portion of electrons to oxygenation (ETRo) or carboxylation (ETRc) revealed higher ETRo:ETRc at the SA site (~0.7–1.2) as compared to the Med site (0.5–0.7) during the summer (Figure 8C). However, during the fall of 2015, we observed the opposite pattern: higher ETRo:ETRc at the Med site (~1.1) than at the SA site (~0.6).
Discussion
Effects of Climatic Conditions on the Seasonality of Photosynthesis
In the present study, we examined seasonal variation in the photosynthesis of Z. spina-christi, one of the flagship species in the savanna-like vegetation of the Eastern Mediterranean region (Danin, 1988), under two different sets of climatic conditions. Although the distance between the two study sites is only 75 km, there were large differences between precipitation, temperature and drought duration and intensity at the two sites. To our knowledge, this is the first report regarding the seasonality of photosynthesis in Z. spina-christi. Our results show that Z. spina-christi is optimally adapted for Mediterranean and semi-arid climates. The period of peak photosynthetic activity at the SA site was 2 months shorter than at the Med site (April-June vs. April to August, respectively) as the decline in photosynthesis due to the limited availability of water started during early summer (June) at the SA site, and only during the fall (September) at the Med site.
Remarkably, relatively high average values of photosynthesis were observed at both sites during the driest period (~10–18 μmol CO2 m−2 s−1) with relatively large leaf areas (25.6–26.4 m2 tree−1 at the SA site and 26.5–31.8 m2 tree−1 at the Med site). These findings suggest a strong potential of Z. spina-christi to contribute to ecosystem carbon sequestration in warming and drying climates. Nevertheless, while this tree could help reduce desertification, it could also become an invasive species in some parts of the world (https://www.legislation.qld.gov.au/view/html/inforce/current/act-2014-007). Therefore, when considering large-scale plantings of Z. spina-christi in habitats outside of its natural distribution, precautions should be taken. It is also important to note that drought conditions can cause differences in the phenology and annual rhythms of cambial activity of Z. spina-christi (Liphschitz and Waisel, 1970). For example, in moist habitats, intensive growth and prolonged periods of cambial activity of Z. spina-christi occur twice annually (April-May and June-October), but under less favorable conditions, only one short period cambial activity was observed (April-May), regardless of the relatively high rates of photosynthesis.
It is interesting to compare the seasonal patterns of photosynthesis observed in this study with those reported in an earlier study conducted on Aleppo pine (Pinus halepensis Mill.) in the Yatir Forest, which is located 25 km from our SA site and has similar climatic conditions to our SA site (Grünzweig et al., 2003; Maseyk et al., 2008). The peak photosynthesis of the Aleppo pine was observed during February and March (~15 μmol CO2 m−2 s−1); whereas from June through January, the net photosynthesis reached zero, indicating very low ecosystem productivity during the long dry season (Rotenberg and Yakir, 2010). The seasonal patterns in the physiology of Z. spina-christi at the SA site were clearly different from the findings for Aleppo pine that were presented in Grünzweig et al. (2003) and Maseyk et al. (2008). Our results show that Z. spina-christi not only survives, but can also be highly productive under such extreme conditions. This can be explained by the difference in the assumed thermal optimum for photosynthesis of each of the two species; optimal temperatures for Z. spina-christi are much higher than those for Aleppo pine (Zait et al., 2018). Those high temperatures are usually accompanied by additional stresses that reduce photosynthesis, such as moderate irradiance in winter and excessive radiation with water shortage during summer (Flexas et al., 2014) and, therefore, are hard to predict. In a previous study, we showed that the thermal optimum for photosynthesis for Ziziphus spina-christi grown in a controlled environment was 30–34°C, with a 50% reduction in photosynthesis observed at a leaf temperature of 25°C (Zait et al., 2018). This can also explain the strong limitation of photosynthesis associated with the low temperatures observed during the winter (30–50%).
The Roles of Stomatal and Mesophyll Conductance in Limiting Photosynthesis
At both sites, photosynthesis was limited mostly by the CO2 diffusional factors (gsc and gm), while biochemical limitations played a relatively minor role (Figures 1,2; Table 2). At the Med site, the limitation of photosynthesis during drought periods was dominated by strong stomatal limitation (22.2–24.8% of a total limitation of 46.8–56.1%). At the SA site, photosynthesis was mostly limited by mesophyll (23.1–32.7% of a total limitation of 41.4–57.6%). The classic stomatal-conductance response to the reduction in Ψstem observed at the two sites indicates that no unique stomatal behavior has evolved during the tree's adaptation to the SA site. However, the drought sensitivity of gm was stronger at the SA site (Figure 4). This is consistent with an earlier report suggesting that the bulk gm limits photosynthesis more in drought-stressed regions than in mesic regions (Keenan et al., 2010). The fact that there was a weak correlation between gm and Ψstem during the dry seasons indicates that other environmental and internal stimuli are involved in the impairment of gm during drought. We suggest that greater mesophyll limitation, as observed at the SA site, can contribute to the interactive effect of drought with higher atmospheric VPD and radiation conditions (Perez-Martin et al., 2009). These conditions may accelerate leaf phenology, especially in facultative-deciduous species as the Z. spina-christi. Intensified drought can accelerate leaf senescence, causing strong declines in chlorophyll and nitrogen content per unit dry mass, which could explain low gm values (Niinemets et al., 2004). In Mediterranean oaks from different environments, variations in gm were shown to result mainly from the specific internal anatomical adaptation of the mesophyll and chloroplast positioning (Peguero-Pina et al., 2017).
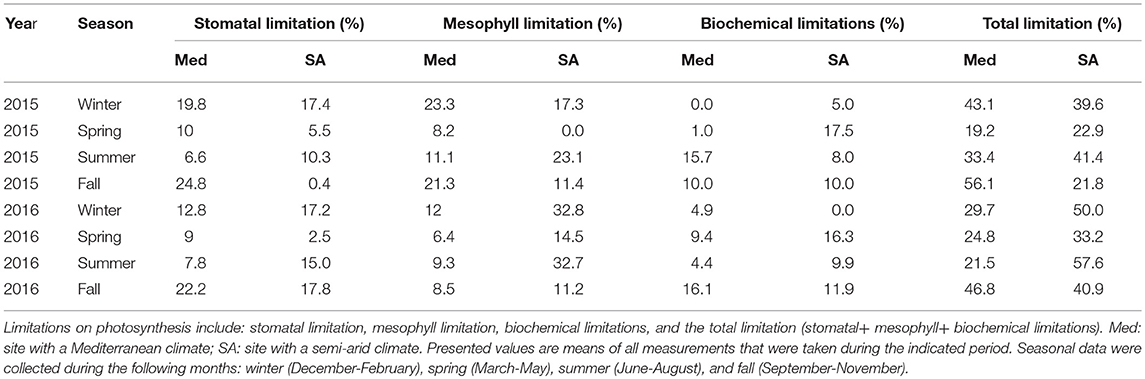
Table 2. Quantitative-limitation analysis of maximal photosynthesis at the two field sites during 2015 and 2016.
The ability of the tree to sustain high gm during drought is an important strategy for tolerating a stressful environment, as recently shown in Eucalyptus dumosa (Cano et al., 2014) and Populus balsamifera L. (Théroux-rancourt et al., 2015). Maintaining high or constant gm while gsw is decreasing leads to a high gm:gsw ratio, which is positively correlated with iWUE (Figure 7). High gm allows for less depletion of the CO2 between intercellular air spaces and chloroplast (Ci-Cc) without affecting the rate of transpiration (Barbour et al., 2010). Therefore, it enables higher rates of photosynthesis at a lower “water-loss price.” However, during all seasons, the gm:gs ratio of the trees growing at the Med site was significantly higher than that observed at the SA site (Figure 3). This led to a higher iWUE at the Med site, as compared to the SA site (Figure 7). Still, the absolute average values of area-based gm (~0.15 mol CO2 m−2 s−1 at the SA site and ~0.25 mol CO2 m−2 s-1 at the Med site) are relatively high, in comparison with other tree species (Manter and Kerrigan, 2004; Niinemets et al., 2009; Peguero-Pina et al., 2017). High gm is commonly related to many self-governing leaf biochemical and structural traits (Flexas et al., 2008). Low leaf dry mass per unit area (LMA ~90 g m−2) and an isolateral mesophyll arrangement (palsied mesophyll on both side of the leaf), which increases the surface area of the mesophyll cells, may explain the high area-based gm observed in Z. spina-christi (Zait et al., 2018).
Drought-Resistance Strategies at the Two Sites
We showed that midday Ψstem was surprisingly higher at the SA site than at the Med site during the driest period (October-November), indicating that the trees successfully avoid severe water shortage (Figure 1). The relatively high average midday Ψstem values observed at both sites during the driest period (>−2.2 MPa) indicate that Ziziphus trees employ drought-avoidance strategies. One important role of stomatal regulation is the balancing of the rate of transpiration with soil water availability (Buckley, 2005). At both sites, gsw was reduced by 50% compared to gsw at the highest Ψstem measured, at relatively high water potential values (between −1.2 and −1.4 MPa) (Figure 4). This indicates that Z. spina-christi is more conservative in its water-relations management than other woody species (Klein, 2014). The phenomenon of maintaining relatively high water potential has also been found in other savannah trees such as Acacia (Eamus and Cole, 1997), as well as in other Ziziphus species (Z. mauritiana: Kulkarni et al., 2010; Z. rotundifolia: Arndt et al., 2001).
Reducing gsw at higher water potential helps trees to operate with a wide hydraulic safety margin and avoid breaks in the water column continuum (embolism; Brodribb and Holbrook, 2004). However, more than one process may be involved in allowing low midday Ψstem. An alternative explanation for the avoidance of low midday Ψstem in the SA site involves the lower leaf area (Table 1, Figure S2) reducing the total loss of water in transpiration. It is important to note that in hyper-arid areas such as Abu Dhabi or during very dry seasons in east African savannas, Z. spina-christi sheds its leaves in early summer (Danin, 1988; Al Yamani et al., 2018). At both of our experimental sites trees experienced partial defoliation over the study period, while the canopy remained relatively green (Table 1, Figure S3). Hence, it is possible that water potential threshold for summer defoliation occurs at values of around −2.2 MPa. In addition, PLC (percentage loss of conductivity) measurements conducted recently on Z. spina -christi revealed P50 (The water potential at which 50% loss of conductivity occurs) of −5 MPa (Shabtai Cohen, unpublished data). All of the above reinforce the claim that Z.spina-christi is not a “risk taker” and operates within wide hydraulic safety margins.
We also showed that Z. spina-christi possesses a great capacity for osmotic adjustment, particularly during the fall at the Med site (Table 1, Table S1). This capacity may also help plants to continue functioning despite soil water shortages. Osmotic adjustment, changes in the elastic properties of cell walls and changes in xylem hydraulic architecture and conductivity have previously been shown to contribute to drought tolerance in Ziziphus mauritiana, a wild relative of Z. spina-christi (Clifford et al., 1998; Kulkarni et al., 2010).
Another adaptive feature that helps the tree to survive in dry areas is its ability to protect its photosynthetic machinery from photoinhibition damage. We showed that the electron transport rate (ETR) was lower at the SA site during the summer drought and during the winter, as compared to the Med site (Figure 8), indicating a reduction in photochemical capacity. Also, the trees at the SA site had higher NPQs and higher rates of photorespiration than the trees at the Med site (Figures 5, 8A,C). The relatively low NPQ values observed at the Med site indicate that photosystem II did not experience any photochemical stress over the course of the study period. On the other hand, the high NPQ values and photorespiration rates at the SA site, throughout the winter and summer, reveal strong photoprotection against extreme radiation conditions. Previous work has demonstrated that reductions in photosynthesis caused by stomatal closure as a result of drought could increase the need for photosystem II protection (Cornic and Fresneau, 2002). Both increases in NPQ and increased rates of photorespiration have been found to function as a photoprotective mechanism under extreme radiation conditions (Badger et al., 2000; Maxwell and Johnson, 2000; Sperling et al., 2014). Greater investment in photoprotective mechanisms can explain the reduction in photosynthetic capacity observed at the SA site, which was associated with both low temperatures in winter and summer drought. This can also explain the surprising photosynthetic recovery in the fall, which was observed only at the SA site and before any rain event. Reduced radiation and temperatures during the fall reduced the investment in photoprotection and enabled higher rates of photosynthesis.
Conclusions
Growth and successful establishment in semi-arid arid regions are governed by a complex series of interactions between physiological and environmental factors. The ecological requirements of Z. spina-christi for survival in semi-arid regions depend mainly on the combination of drought intensity and winter temperatures (mainly the number of cold days). With ongoing climate change, the Mediterranean regions are predicted to experience an increase in temperature accompanied by water shortage (Alpert et al., 2008). Z. spina-christi will benefit from these changing temperatures (both summer and winter temperatures) and also possesses essential mechanisms that allow it to survive long drought periods. This may lead to more shifts in the abundancy and distribution of Z. spina-christi, as it manages to survive winters at higher latitudes and altitudes. Consequently, Z. spina-christi may be a good candidate species for use in future large-scale plantings in semi-arid areas, a practice that was recently proposed as a useful tool for climate-mitigation efforts (Yosef et al., 2018).
Author Contributions
YZ planning and performing the experiments, data analysis, and writing. AS planning the experiments and writing.
Funding
This project was supported by a grant (No. 10-01-005-13) from the Jewish National Fund (JNF) for the study of the ecophysiology of Z. spina-christi under changing climate conditions.
Conflict of Interest Statement
The authors declare that the research was conducted in the absence of any commercial or financial relationships that could be construed as a potential conflict of interest.
Acknowledgments
The authors wish to thank Mr. Ytzhak Moshe and the JNF for cooperation and logistics at the SA site and to Mr. Shlomo Teitelbaum at the Med site. We also like to thank Noga Kosto, Alon Horesh, Yotam Bernhardt, Moni Shitrit, and Sharon Kolikovski for their massive help in collecting the data in the field.
Supplementary Material
The Supplementary Material for this article can be found online at: https://www.frontiersin.org/articles/10.3389/ffgc.2018.00003/full#supplementary-material
References
Adgaba, N., Alghamdi, A., Shenkute, A., Sammoudr, R., Hegazy, S., Ansari, M. J., et al. (2013). Age structure, regeneration-gap of Ziziphus spina-christi populations and implications for its conservation. J Food, Agric Environ. 11, 2220–6.
Al Yamani, W., Green, S., Pangilinan, R., Dixon, S., Shahid, S. A., Kemp, P., et al. (2018). Water use of Al Ghaf (Prosopis cineraria) and Al Sidr (Ziziphus spina-christi) forests irrigated with saline groundwater in the hyper-arid deserts of Abu Dhabi. Agric Water Manag. 203, 105–14. doi: 10.1016/j.agwat.2018.03.006
Allen, C. D., Macalady, A. K., Chenchouni, H., Bachelet, D., McDowell, N., Vennetier, M., et al. (2010). A global overview of drought and heat-induced tree mortality reveals emerging climate change risks for forests. For. Ecol. Manage. 259, 660–84. doi: 10.1016/j.foreco.2009.09.001
Alpert, P., Krichak, S. O., Shafir, H., Haim, D., and Osetinsky, I. (2008). Climatic trends to extremes employing regional modeling and statistical interpretation over the E. Mediterranean Glob Planet Change. 63, 163–70. doi: 10.1016/j.gloplacha.2008.03.003
Arndt, S. K., Clifford, S. C., Wanek, W., Jones, H. G., and Popp, M. (2001). Physiological and morphological adaptations of the fruit tree Ziziphus rotundifolia in response to progressive drought stress. Tree Physiol. 21, 705–15. doi: 10.1093/treephys/21.11.705
Asner, G. P., and Heidebrecht, K. B. (2005). Desertification alters regional ecosystem – climate interactions. Glob Chang Biol. 11, 182–94. doi: 10.1111/j.1365-2486.2004.00880.x
Badger, M. R., von Caemmerer, S., Ruuska, S., Nakano, H., Laisk, A., Allen, J. F., et al. (2000). Electron flow to oxygen in higher plants and algae: rates and control of direct photoreduction (Mehler reaction) and rubisco oxygenase. Philos. Trans. R. Soc. B Biol. Sci. 355, 1433–46. doi: 10.1098/rstb.2000.0704
Barbour, M. M., Warren, C. R., Farquhar, G. D., Forrester, G., and Brown, H. (2010). Variability in mesophyll conductance between barley genotypes, and effects on transpiration efficiency and carbon isotope discrimination. Plant, Cell Environ. 33, 1176–85. doi: 10.1111/j.1365-3040.2010.02138.x
Battisti, A., Stastny, M., Netherer, S., Robinet, C., Schopf, A., Roques, A., et al. (2005). Expansion of geographic range in the pine processionary moth caused by increased winter temperatures. Ecolgical. Appl. 15, 2084–96. doi: 10.1890/04-1903
BioGIS (2018). Israel Biodiversity Information System. Available online at: http://www.biogis.huji.ac.il
Brodribb, T. J., and Holbrook, N. M. (2004). Diurnal depression of leaf hydraulic conductance in a tropical tree species. Plant, Cell Environ. 27, 820–7. doi: 10.1111/j.1365-3040.2004.01188.x
Buckley, T. N. (2005). The control of stomata by water balance. New Phytol. 168, 275–92. doi: 10.1111/j.1469-8137.2005.01543.x
Bussotti, F., and Pollastrini, M. (2017). Observing climate change impacts on european forests: what works and what does not in ongoing long-term monitoring networks. Front Plant Sci. 8:629. doi: 10.3389/fpls.2017.00629
Cano, F. J., López, R., and Warren, C. R. (2014). Implications of the mesophyll conductance to CO2 for photosynthesis and water-use efficiency during long-term water stress and recovery in two contrasting Eucalyptus species. Plant Cell Environ. 37, 2470–90. doi: 10.1111/pce.12325
Chaves, M. M., Pereira, J. S., Maroco, J., Rodrigues, M. L., Ricardo, C. P. P., Osório, M. L., et al. (2002). How plants cope with water stress in the field. Photosynthesis and growth. Ann. Bot. 89, 907–916. doi: 10.1093/aob/mcf105
Clifford, S. C., Arndt, S. K., Corlett, J. E., Joshi, S., Sankhla, N., Popp, M., et al. (1998). The role of solute accumulation, osmotic adjustment and changes in cell wall elasticity in drought tolerance in Ziziphus mauritiana (Lamk.). J Exp Bot. 49, 967–977. doi: 10.1093/jxb/49.323.967
Cornic, G., and Fresneau, C. (2002). Photosynthetic carbon reduction and carbon oxidation cycles are the main electron sinks for photosystem II activity during a mild drought. Ann. Bot. 89, 887–94. doi: 10.1093/aob/mcf064
Danin, A. (1988). “Flora and vegetation of Israel and adjacent areas,” in The Zoogeography of Israel, eds Y. Yom-Tov and E. Tchernov (Dordrecht: Dr. W. Junk Publishers), 18–42. Available online at: http://www.herbmedit.org/bocconea/3-018.pdf
Dubois, M., Gilles, K. A., Hamilton, J. K., Rebers, P. A., and Smith, F. (1956). Colorimetric method for determination of sugars and related substances. Anal. Chem. 28, 350–6. doi: 10.1021/ac60111a017
Duursma, R. A. (2015). Plantecophys - an r package for analysing and modelling leaf gas exchange data. PLoS ONE. 10:e0143346. doi: 10.1371/journal.pone.0143346
Eamus, D., and Cole, S. (1997). Diurnal and seasonal comparisons of assimilation, phyllode conductance and water potential of three Acacia and one Eucalyptus species in the wet-dry tropics of Australia. Aust. J. Bot. 45, 275–90. doi: 10.1071/BT96020
Egea, G., González-Real, M. M., Baille, A., Nortes, P. A., and Diaz-Espejo, A. (2011). Disentangling the contributions of ontogeny and water stress to photosynthetic limitations in almond trees. Plant Cell Environ. 34, 962–79. doi: 10.1111/j.1365-3040.2011.02297.x
Fält-Nardmann, J. J. J., Tikkanen, O. P., Ruohomäki, K., Otto, L. F., Leinonen, R., Pöyry, J., et al. (2018). The recent northward expansion of Lymantria monacha in relation to realised changes in temperatures of different seasons. For. Ecol. Manage 427, 96–105. doi: 10.1016/j.foreco.2018.05.053
Farquhar, G. D., and Sharkey, T. D. (1982). Stomatal conductance and photosynthesis. Annu. Rev. Plant Physiol. 33, 317–45. doi: 10.1146/annurev.pp.33.060182.001533
Farquhar, G. D., von Caemmerer, S., and Berry, J. A. (1980). A biochemical model of photosynthetic CO2 assimilation in leaves of C3 species. Planta 149, 78–90. doi: 10.1007/BF00386231
Flexas, J., Diaz-Espejo, A., Gago, J., Gallé, A., Galmés, J., Gulías, J., et al. (2014). Photosynthetic limitations in Mediterranean plants: a review. Environ. Exp. Bot. 103, 12–23. doi: 10.1016/j.envexpbot.2013.09.002
Flexas, J., Ribas-Carbó, M., Diaz-Espejo, A., Galmés, J., and Medrano, H. (2008). Mesophyll conductance to CO2: Current knowledge and future prospects. Plant, Cell Environ. 31, 602–21. doi: 10.1111/j.1365-3040.2007.01757.x
Gaastra, P. (1959). Photosynthesis of crop plants as influenced by light, carbon dioxide, temperature, and stomatal diffusion resistance. Meded. Landbouwhogesch. Wageningen 59, 1–68.
Genty, B., Briantais, J. M., and Baker, N. R. (1989). The relationship between the quantum yield of photosynthetic electron transport and quenching of chlorophyll fluorescence. Biochim. Biophys. Acta. 990, 87–92. doi: 10.1016/S0304-4165(89)80016-9
Grassi, G., and Magnani, F. (2005). Stomatal, mesophyll conductance and biochemical limitations to photosynthesis as affected by drought and leaf ontogeny in ash and oak trees. Plant Cell Environ. 28, 834–49. doi: 10.1111/j.1365-3040.2005.01333.x
Grünzweig, J. M., Lin, T., Rotenberg, E., Schwartz, A., and Yakir, D. (2003). Carbon sequestration in arid-land forest. Glob. Chang. Biol. 9, 791–9. doi: 10.1046/j.1365-2486.2003.00612.x
Harley, P. C., Loreto, F., Di Marco, G., and Sharkey, T. D. (1992). Theoretical considerations when estimating the mesophyll conductance to CO2 flux by analysis of the response of photosynthesis to CO2. Plant Physiol. 98:1429–36.
Hoffmann, A. A., and Sgró, C. M. (2011). Climate change and evolutionary adaptation. Nature 470, 479–85. doi: 10.1038/nature09670
Jones, H. G. (1985). Partitioning stomatal and non-stomatal limitations to photosynthesis. Plant Cell Environ. 8, 95–104. doi: 10.1111/j.1365-3040.1985.tb01227.x
Keenan, T., Sabate, S., and Gracia, C. (2010). The importance of mesophyll conductance in regulating forest ecosystem productivity during drought periods. Glob. Chang. Biol. 16, 1019–34. doi: 10.1111/j.1365-2486.2009.02017.x
Klein, T. (2014). The variability of stomatal sensitivity to leaf water potential across tree species indicates a continuum between isohydric and anisohydric behaviours. Funct. Ecol. 28, 1313–20. doi: 10.1111/1365-2435.12289
Kulkarni, M., Schneider, B., Raveh, E., and Tel-Zur, N. (2010). Leaf anatomical characteristics and physiological responses to short-term drought in Ziziphus mauritiana (Lamk.). Sci. Hortic. 124, 316–22. doi: 10.1016/j.scienta.2010.01.005
Limousin, J. M., Misson, L., Lavoir, A. V., Martin, N. K., and Rambal, S. (2010). Do photosynthetic limitations of evergreen Quercus ilex leaves change with long-term increased drought severity? Plant Cell Environ. 33, 863–75. doi: 10.1111/j.1365-3040.2009.02112.x
Liphschitz, N., and Waisel, Y. (1970). Environmental effects on wood production in Ziziphus spina christi (L.) Willd. Isr. J. Bot. 19, 592–8.
Manter, D. K., and Kerrigan, J. (2004). A/Ci curve analysis across a range of woody plant species: Influence of regression analysis parameters and mesophyll conductance. J. Exp. Bot. 55, 2581–8. doi: 10.1093/jxb/erh260
Marshall, B., and Biscoe, P. V. (1980). A Model for C3 Leaves Describing the Dependence of Net Photosynthesis on Irradiance. J. Exp. Bot. 31, 29–39. doi: 10.1093/jxb/31.1.29
Maseyk, K. S., Lin, T., Rotenberg, E., Grünzweig, J. M., Schwartz, A., and Yakir, D. (2008). Physiology-phenology interactions in a productive semi-arid pine forest. New Phytol. 178, 603–16. doi: 10.1111/j.1469-8137.2008.02391.x
Maxwell, K., and Johnson, G. N. (2000). Chlorophyll fluorescence–a practical guide. J. Exp. Bot. 51, 659–68. doi: 10.1093/jexbot/51.345.659
Misson, L., Limousin, J. M., Rodriguez, R., and Letts, M. G. (2010). Leaf physiological responses to extreme droughts in Mediterranean Quercus ilex forest. Plant, Cell Environ. 33, 1898–910. doi: 10.1111/j.1365-3040.2010.02193.x
Naor, A. (2000). Midday stem water potential as a plant water stress indicator for irrigation scheduling in fruit trees. Acta Hortic. 537, 447–454. doi: 10.17660/ActaHortic.2000.537.52
Niinemets, Ü., Tenhunen, J. D., and Beyschlag, W. (2004). Spatial and age-dependent modifications of photosynthetic capacity in four Mediterranean oak species. Funct. Plant Biol. 31, 1179–93. doi: 10.1071/FP04128
Niinemets, U., Wright, I. J., and Evans, J. R. (2009). Leaf mesophyll diffusion conductance in 35 Australian sclerophylls covering a broad range of foliage structural and physiological variation. J. Exp. Bot. 60, 2433–49. doi: 10.1093/jxb/erp045
Peguero-Pina, J. J., Sisó, S., Flexas, J., Galmés, J., García-Nogales, A., Niinemets, Ü., et al. (2017). Cell-level anatomical characteristics explain high mesophyll conductance and photosynthetic capacity in sclerophyllous Mediterranean oaks. New Phytol. 214, 585–96. doi: 10.1111/nph.14406
Perez-Martin, A., Flexas, J., Ribas-Carbó, M., Bota, J., Tomás, M., Infante, J. M., et al. (2009). Interactive effects of soil water deficit and air vapour pressure deficit on mesophyll conductance to CO2 in Vitis vinifera and Olea europaea. J. Exp. Bot. 60, 2391–405. doi: 10.1093/jxb/erp145
Raschke, K. (1975). Stomatal Action. Annu. Rev. Plant. Physiol. 26, 309–40. doi: 10.1146/annurev.pp.26.060175.001521
Rotenberg, E., and Yakir, D. (2010). Contributions of semi-arid forests to the climate system. Science 327, 451–4. doi: 10.1126/science.1179998
Saied, A. S., Gebauer, J., Hammer, K., and Buerkert, A. (2008). Ziziphus spina-christi (L.) willd.: a multipurpose fruit tree. Genet. Resour. Crop Evol. 55, 929–937. doi: 10.1007/s10722-007-9299-1
Saxe, H., Cannell, M. G. R., Johnsen, Ø., Ryan, M. G., and Vourlitis, G. (2001). Tree and forest functioning in response to global warming. New Phytol. 149, 369–400. doi: 10.1046/j.1469-8137.2001.00057.x
Sharkey, T. D., Bernacchi, C. J., Farquhar, G. D., and Singsaas, E. L. (2007). Fitting photosynthetic carbon dioxide response curves for C3 leaves. Plant Cell Environ. 30, 1035–40. doi: 10.1111/j.1365-3040.2007.01710.x
Sperlich, D., Barbeta, A., Ogaya, R., Sabaté, S., and Peñuelas, J. (2016). Balance between carbon gain and loss under long-term drought: impacts on foliar respiration and photosynthesis in Quercus ilex L. J. Exp. Bot. 67, 821–33. doi: 10.1093/jxb/erv492
Sperling, O., Lazarovitch, N., Schwartz, A., and Shapira, O. (2014). Effects of high salinity irrigation on growth, gas-exchange, and photoprotection in date palms (Phoenix dactylifera L., cv. Medjool). Environ. Exp. Bot. 99:100–9. doi: 10.1016/j.envexpbot.2013.10.014
Stpaul, N. K. M., Limousin, J. M., Rodrígesuez-Calcerrada, J., Ruffault, J., Rambal, S., Letts, M. G., et al. (2012). Photosynthetic sensitivity to drought varies among populations of Quercus ilex along a rainfall gradient. Funct. Plant Biol. 39, 25–37. doi: 10.1071/FP11090
Théroux-rancourt, G., Éthier, G., and Pepin, S. (2015). Greater efficiency of water use in poplar clones having a delayed response of mesophyll conductance to drought. Tree Physiol. 35, 172–84. doi: 10.1093/treephys/tpv006
Valentini, R., Epron, D., Deangelis, P., Matteucci, G., and Dreyer, E. (1995). In-situ estimation of net Co2 assimilation, photosynthetic electron flow and photorespiration in Turkey Oak (Q-Cerris L) leaves - diurnal cycles under different levels of water-supply. Plant Cell Environ. 18, 631–40. doi: 10.1111/j.1365-3040.1995.tb00564.x
Vishnevetsky, J., Zamski, E., and Ziv, M. (2000). Carbohydrate metabolism in Nerine sarniensis bulbs developing in liquid culture. Physiol. Plant. 108, 361–9. doi: 10.1034/j.1399-3054.2000.108004361.x
Walther, G. R., Post, E., Convey, P., Menzel, A., Parmesan, C., Beebee, T. J. C., et al. (2002). ecological responses to recent climate change. Nature. 416, 389–95. doi: 10.1038/416389a
Way, D. A., and Oren, R. A. (2010). Differential responses to changes in growth temperature between trees from different functional groups and biomes : a review and synthesis of data. Tree Physiol. 30, 669–88. doi: 10.1093/treephys/tpq015
Way, D. A., and Sage, R. F. (2008). Thermal acclimation of photosynthesis in black spruce [Picea mariana (Mill.) B.S.P.]. Plant Cell Environ. 31, 1250–1262. doi: 10.1111/j.1365-3040.2008.01842.x
Williams, A. P., Allen, C. D., Macalady, A. K., Griffin, D., Woodhouse, C. A., Meko, D. M., et al. (2013). Temperature as a potent driver of regional forest drought stress and tree mortality. Nat. Clim. Chang. 3, 292–7. doi: 10.1038/nclimate1693
Yosef, G., Walko, R., Avisar, R., Tatarinov, F., Rotenberg, E., and Yakir, D. (2018). Large-scale semi-arid afforestation can enhance precipitation and carbon sequestration potential. Sci Rep. 8, 1–11. doi: 10.1038/s41598-018-19265-6
Zait, Y., Shtein, I., and Schwartz, A. (2018). Long-term acclimation to different stress types: revealing tradeoffs between mesophyll and stomatal conductance. bioRxiv [pre-print]. doi: 10.1128/AAC.04078-14
Zhou, S., Medlyn, B., Sabaté, S., Sperlich, D., and Prentice, I. C. (2014). Short-term water stress impacts on stomatal, mesophyll and biochemical limitations to photosynthesis differ consistently among tree species from contrasting climates. Tree Physiolx. 34, 1035–1046. doi: 10.1093/treephys/tpu072
Appendix
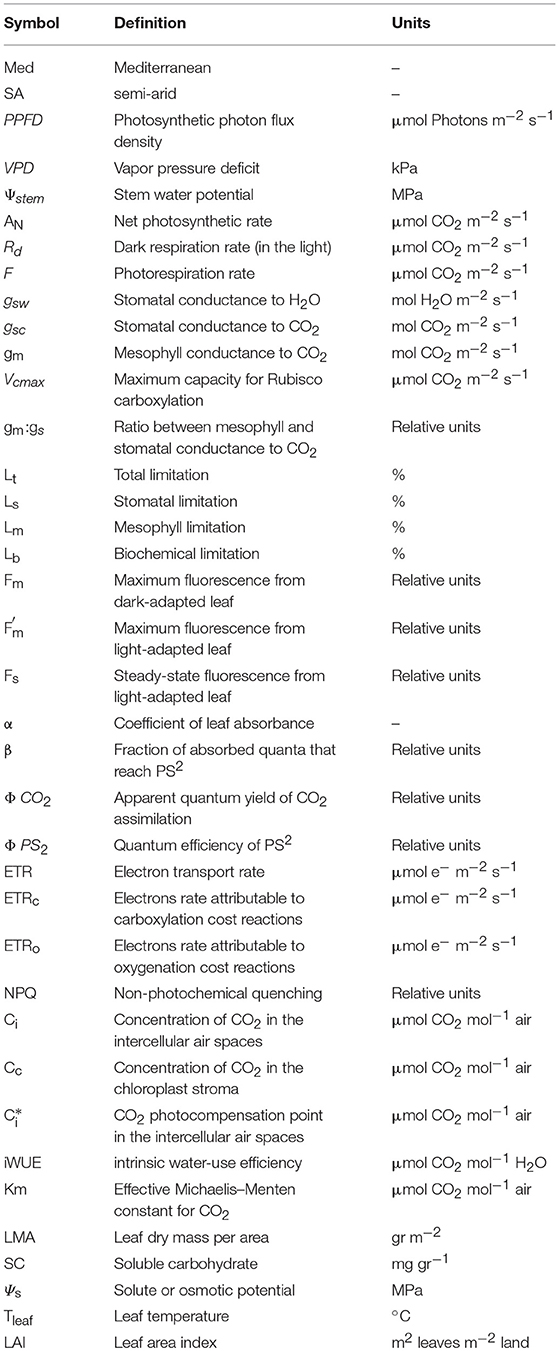
Table A1. List of abbreviations and definitions of key symbols.
Keywords: Ziziphus, photosynthesis, drought, Mediterranean, semi-arid, stomatal conductance, mesophyll conductance
Citation: Zait Y and Schwartz A (2018) Climate-Related Limitations on Photosynthesis and Drought-Resistance Strategies of Ziziphus spina-christi. Front. For. Glob. Change 1:3. doi: 10.3389/ffgc.2018.00003
Received: 22 July 2018; Accepted: 06 September 2018;
Published: 28 September 2018.
Edited by:
Nick Smith, Texas Tech University, United StatesReviewed by:
Teresa E. Gimeno, Basque Centre for Climate Change, SpainCate Macinnis-Ng, University of Auckland, New Zealand
Copyright © 2018 Zait and Schwartz. This is an open-access article distributed under the terms of the Creative Commons Attribution License (CC BY). The use, distribution or reproduction in other forums is permitted, provided the original author(s) and the copyright owner(s) are credited and that the original publication in this journal is cited, in accordance with accepted academic practice. No use, distribution or reproduction is permitted which does not comply with these terms.
*Correspondence: Amnon Schwartz, c2Nod2FydHpAYWdyaS5odWppLmFjLmls