 Anabelle W. Cardoso1*
 Imma Oliveras1
 Katharine A. Abernethy2,3
 Kathryn J. Jeffery2,3,4David Lehmann2Josué Edzang Ndong4Ian McGregor1
 Claire M. Belcher5
 William J. Bond6
 Yadvinder S. Malhi1
- 1School of Geography and the Environment, University of Oxford, Oxford, United Kingdom
- 2Biological and Environmental Sciences, Faculty of Natural Sciences, University of Stirling, Stirling, United Kingdom
- 3Institut de Recherche en Ecologie Tropicale, CENAREST, Libreville, Gabon
- 4Agence Nationale des Parcs Nationaux, Libreville, Gabon
- 5wildFIRE Lab, Hatherly Laboratories, University of Exeter, Exeter, United Kingdom
- 6Biological Sciences Department, University of Cape Town, Cape Town, South Africa
Forest-savanna mosaics are maintained by fire-mediated positive feedbacks; whereby forest is fire suppressive and savanna is fire promoting. Forest-savanna transitions therefore represent the interface of opposing fire regimes. Within the transition there is a threshold point at which tree canopy cover becomes sufficiently dense to shade out grasses and thus suppress fire. Prior to reaching this threshold, changes in fire behavior may already be occurring within the savanna. Such changes are neither empirically described nor their drivers understood. Fire behavior is largely driven by fuel flammability. Flammability can vary significantly between grass species and grass species composition can change near forest-savanna transitions. This study measured fire behavior changes at eighteen forest-savanna transition sites in a vegetation mosaic in Lopé National Park in Gabon, central Africa. The extent to which these changes could be attributed to changes in grass flammability was determined using species-specific flammability traits. Results showed simultaneous suppression of fire and grass biomass when tree canopy leaf area index (LAI) reached a value of 3, indicating that a fire suppression threshold existed within the forest-savanna transition. Fires became less intense and less hot prior to reaching this fire suppression threshold. These changes were associated with higher LAI values, which induced a change in the grass community, from one dominated by the highly flammable Anadelphia afzeliana to one dominated by the less flammable Hyparrhenia diplandra. Changes in fire behavior were not associated with changes in total grass biomass. This study demonstrated not only the presence of a fire suppression threshold but the mechanism of its action. Grass composition mediated fire-behavior within the savanna prior to reaching the suppression threshold, and grass species composition was mediated by tree canopy cover which was in turn mediated by fire-behavior. These findings highlight how biotic and abiotic controls interact and amplify each other in this mosaicked landscape to facilitate forest and savanna co-existence.
Introduction
Forest and savanna distribution can largely be predicted by mean annual precipitation (MAP), which is a key determinant of total tree cover (Sankaran et al., 2005). Landscapes where MAP is higher are deterministically closed canopy forests, and landscapes where MAP is lower are deterministically open canopy savannas (Staver et al., 2011b). However, this predictability falls away in locations where MAP is intermediate (1000–2000 mm p.a.). In these places, whether the system is forest or savanna is not deterministic, and either of these states may be observed (Staver et al., 2011b). Landscapes that are not deterministically forest or savanna are common (Staver et al., 2011b), and as a result forest and savanna co-occur so frequently that the forest-savanna transition is the most widespread ecotone in the tropics (Torello-Raventos et al., 2013). Forest-savanna transitions are especially common in forest-savanna mosaics, where patches of pyrophilic savanna interlock with patches of pyrophobic forest. The opposing fire regimes of forest and savanna meet at the forest-savanna transition, with fire behavior able to determine the transition's location and dynamics (Oliveras and Malhi, 2016). This makes fire a key determinant of vegetation distribution in mesic tropical landscapes (Hirota et al., 2011; Staver et al., 2011b; Hoffmann et al., 2012a; Dantas Vde et al., 2016), and yet changes in fire behavior at the forest-savanna transition and the biotic and abiotic drivers of this are not well understood.
Within the forest-savanna transition exists the fire suppression threshold (Hoffmann et al., 2012a). This is the point at which tree canopy cover becomes sufficient to exclude heliophilic C4 grasses and create a moist and less windy micro-climate, thus eliminating fire from the understorey (Hoffmann et al., 2012a). Above this threshold of canopy cover, fire-sensitive forest tree species succeed while savanna tree species are competitively excluded by the lack of light, and so a forest state persists (Hoffmann et al., 2003; Gignoux et al., 2016). Below this threshold, C4 grasses flourish and seasonally become dry and burn (Bond and Van Wilgen, 1996), killing trees caught in the flame zone, or removing their aerial biomass and forcing them to resprout repeatedly, thus maintaining the open canopy of the savanna (Grady and Hoffmann, 2012). While the fire suppression threshold has been demonstrated at certain sites (Hoffmann et al., 2012a; Dantas Vde et al., 2013; Ibanez et al., 2013a; Charles-Dominique et al., 2018), its existence more broadly, as well as the role that fire plays in maintaining forest-savanna mosaics, has been questioned (Lloyd and Veenendaal, 2016).
The fire suppression threshold does, to some extent, consider fire to be a binary variable within the ecosystem: either present below the threshold, as in savanna, or absent above the threshold, as in forest. However, the probability that fire top-kills trees is not binary, and varies with changes in fire behavior (Higgins et al., 2000). Fire behavior is determined by the properties of the fuels (i.e., their flammability), and is further altered by the prevailing weather conditions (e.g., high wind speeds and temperatures can cause extreme fire-storms, Bradstock et al., 2010). Flammability is the ability of fuel to burn, or “to start and sustain a flame” and is driven not by a single plant trait, but by group of traits that determine the probability and behavior of fire (Pausas et al., 2017). These traits dictate the fuel's ignitability, or ability to start a fire, its combustibility, or how well it burns, and its sustainability, or how long it burns for (Gill and Zylstra, 2005). Broadly, flammability traits are those relating to the fuel's load (biomass quantity), its intrinsic properties (biomass quality), how wet it is (fuel moisture), and how it arranges spatially (biomass connectivity and aeration) (Gill and Zylstra, 2005; Simpson et al., 2016).
The flammability of the grasses that fuel savanna fires can vary significantly between species (Simpson et al., 2016). Some previous studies have investigated species-level grass flammability traits in a laboratory (Simpson et al., 2016) using models (cf. field experiments) to make inferences about landscape-scale fire behavior. Conversely, other studies investigated savanna landscape-scale fire behavior in detail (Wragg et al., 2018), but did not address species-level flammability traits to explain the observed patterns. Studies that investigate fire behavior and flammability at forest-savanna transitions tend to consider all savanna grassy fuel as equally flammable at a given biomass and moisture content (Hennenberg et al., 2006; Balch et al., 2008; Hoffmann et al., 2012b), and don't examine variation in flammability between grass species. Studies that show that grass species composition does change at the transition acknowledge that such changes will likely affect fire behavior (Charles-Dominique et al., 2018), but do not empirically measure grass species flammability traits.
Grass species composition can vary across the savanna, specifically approaching the forest-savanna transition and the fire suppression threshold (Charles-Dominique et al., 2018). These changes are likely to be affecting fire behavior and may be playing a crucial role in maintaining the forest-savanna mosaic via their interaction with the fire suppression threshold. To the best of our knowledge however, no study has yet empirically linked grass species-specific flammability traits with grass community composition changes and fire behavior changes at the forest-savanna transition.
The objective of this study was to empirically describe the fire suppression threshold and the interactive abiotic and biotic controls on it. We did this at 18 forest-savanna transition sites in a mosaic landscape in Lopé National Park in Gabon, central Africa. Specifically, we posed the following research questions:
(Q1) Is there evidence for a fire suppression threshold within the forest-savanna transition?
(Q2) Does fire behavior change within the savanna before reaching the threshold in (Q1)?
(Q3) To what extent are any fire behavior changes in (Q2) a function of shifts in biotic factors, like grass, and/or abiotic factors, like shading?
Materials and Methods
Study Site
Lopé National Park (LNP), Gabon, is a mosaic of Middle Ogooué savannas (van de Weghe, 2011) and continuous Lower Guineo-Congolian rainforest (White, 1983). The landscape is characterized by sharp transitions between vegetation types and there is almost always a forest elephant path running along the edge of the savanna, parallel to the edge of the forest. Mean annual rainfall is 1442 mm (1984–2016), mean annual temperature is 24°C (2003–2016), and mean annual humidity is 81% (2003–2016) (Tutin et al., 2016). LNP has a short (mid-December to mid-February) and a long (mid-June to mid-September) dry season, with prescribed burning occurring in the latter. Prescribed fires have been used since 1993 as a way to maintain the savanna component of the mosaic, which is at risk of being lost to encroaching forest (Jeffery et al., 2014). Both the savanna and fire are ancient features of the landscape (White, 2001; Peyrot et al., 2003).
The study was performed at eighteen forest-savanna transition transects across the mosaic (Figure 1). Transects covered forest and savanna patches that were at least 50 m wide. Transects were selected randomly and were at least 100 m from one another and 50 m from a road or river. Transects covered 25 m of savanna and 10 m of forest as well as the width of the transition vegetation belt between the two. Transects were 2 m wide but of variable length (37–44 m), as the width of the transition varied between sites. Delineation of these vegetation types was done on a physiognomic basis. Savanna was defined as where grass cover was continuous, woody canopy cover discontinuous, and visibility at eye level (1.6 m) >5 m. The transition was then defined to start where grass cover became discontinuous, woody canopy cover became continuous, the tree canopy layer was vertically continuous with the understorey layers, and visibility was <5 m. The transition was defined to end and the forest begin where tree canopy layer became vertically discontinuous with the understorey again, and visibility increased to >5 m. Transects were sampled in adjacent 1 m increments (1 m × 2 m block) with positive distances indicating blocks into the savanna, negative distances indicating blocks toward the forest, and zero distances denoting blocks at the edge of the savanna. At each site, an elephant path divided the savanna from the transition (i.e., the path had continuous grass on one side and none, or very discontinuous, grass on the other).
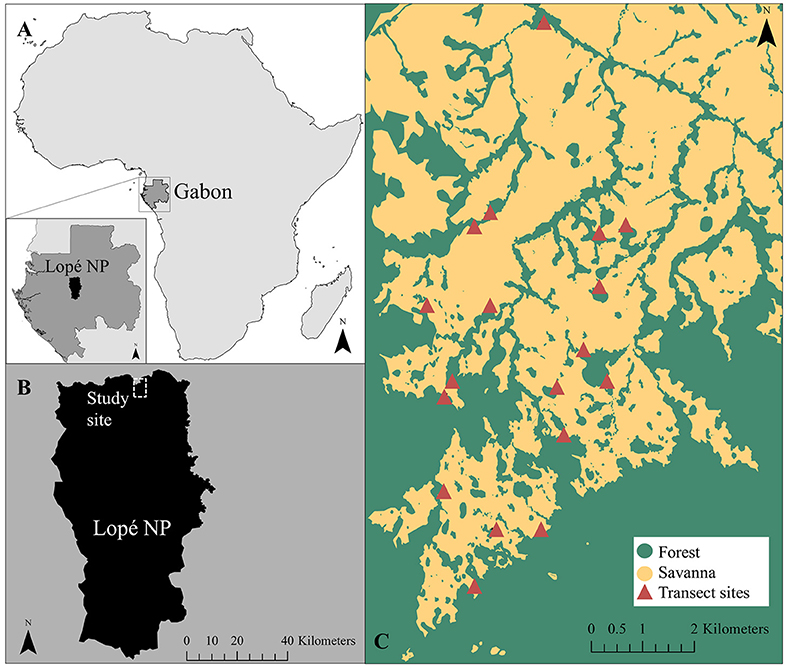
Figure 1. Map showing the location of (a) Lopé National Park in Gabon, (b) the study area within the park, and (c) the eighteen forest-savanna transition transect sites (Agence Nationale des Parcs Nationaux, 2006).
The Fire Suppression Threshold
This study considered a fire suppression threshold to exist at the forest-savanna transition if: (i) fire could be empirically demonstrated to be suppressed and (ii) the point of fire suppression coincided with a threshold level of canopy leaf area index (LAI) [previously estimated to occur at 3 (Hoffmann et al., 2012a) or 1.5 (Charles-Dominique et al., 2018)] at which grass biomass becomes eliminated from the understorey.
The location of fire suppression relative to the edge of the savanna was assessed visually via burn scars on the day of burning. All transects were burned in the middle of the day during the dry season between 16 July and 2 September 2016. All fires were lit with matches between the late morning and afternoon from multiple point sources arranged in a line at least 100 m from the transect, and each fire progressed as a continuous fire front. The direction of wind during burning was consistent (North-West origin), therefore whether the transect faced windward or leeward dictated whether the fire arrived as a head or flank fire.
Canopy leaf area index (LAI) (leaf area.ground area−1) is the ratio of ground area covered by canopy and is a proxy for understorey shading. It was calculated from hemispherical photographs taken at 1 m above ground level every 5 m in the savanna and forest and every 1 m in transition (Nikkor fish-eye lens 10.5 mm F2.8G AF DX IF ED) (Marthews et al., 2014). Photographs were converted into LAI estimates using post hoc image analysis in Hemisfer (v2.16, Schleppi et al., 2007; Thimonier et al., 2010).
Grass biomass was measured every 1 m along the transect using a disk pasture meter (DPM) calibrated for the site (Figure S1).
Border-and-Ecotone Detection Analysis (BEDA) (Hennenberg et al., 2008) was applied to the resulting LAI and grass biomass data locate and characterize their borders and ecotones. A border is a boundary between two environments, in this case forest and savanna, at which the magnitude of change in a measured variable, in this case LAI and grass biomass, is the greatest. The width of the detected border, or its ecotone, represents the intermediate environments where the conditions on either side of border exert an influence on one another (also known as “depth of edge influence”; Hennenberg et al., 2008). If a measured variable has a threshold response then its ecotone will be narrow as the self-reinforcing feedbacks either side of the ecotone make the adjacent environments comparatively more stable spaces to occupy than the intermediate ecotone (Beisner et al., 2003). BEDA fits a sigmoidal non-linear function with four-parameters using the formula:
where a and c are the upper and lower asymtotes (mean environmental conditions either side of the border), b is the inflection point where the change in the variable is strongest (location of the border), d is the steepness of change in the variable between the asymtotes, with b+2d and b−2d representing the width of the ecotonal area (Hennenberg et al., 2008). BEDA was performed in R using the command drm in package drc (Ritz et al., 2015). If a fire suppression threshold exists, we expect the detected border in LAI and grass biomass to be co-located with the point of fire suppression. We also expect the associated ecotones to be narrow (a few meters wide), indicating a threshold response.
Fire Behavior
Fire behavior changes from the interior toward the edge of the savanna were assessed as (i) fire intensity changes and (ii) changes in fire temperature metrics. The weather during burning was also measured so that its effects could be accounted for.
Fire Intensity
We estimated fire intensity using Byram's (1959) equation:
where I is the fire-line intensity in kW.m−1, H is the heat yield of the fuel (kJ.g−1), w is the mass of fuel combusted (g.m−2) and r is the rate of spread of the fire front (m.sec−1). Heat yield of fuel was assumed to be constant at 16.89 kJ.g−1 (Trollope, 1998). The mass of fuel combusted was the difference between pre-fire grass biomass (as determined by DPM) and post-fire grass biomass, which was the dry biomass of a 1 m2 clipped area after fire. Rate of spread, the biggest determinant of fire intensity, was measured using thermocouples. Type-K thermocouples and Hobo Onset data loggers (model UX100-014M) logged temperature at 30 cm above the ground (estimated minimum flame height based on the minimum grass height) at 1 s intervals. At each site either five (at 9 transects) or nine (at 9 transects) thermocouples were set up in the savanna in a 20 m × 20 m square, with one edge of the square running along the edge of the savanna. A thermocouple was always placed at each corner and in the center of the square, and, when using 9 thermocouples, also at the midpoints of the four sides. Each thermocouple was therefore at a known distance into the savanna (0, 10, or 20 m) and from other thermocouples. Rate of spread was then the time taken for the fire front to pass between thermocouples, where the point at which a fire front passed a thermocouple was the peak temperature recorded by that thermocouple (Figure S2).
Fire intensity was then assessed as a function of distance into the savanna using a generalized linear model (glmer in package lme4), using a gamma distribution and a log link, where transect was included as a random effect.
Fire Temperature Metrics
Fire temperature metrics calculated were (i) maximum temperature (°C), (ii) time spent above a temperature threshold (s), and (iii) total thermal dose above this threshold (°C).
Maximum temperature was the highest value recorded by the thermocouple during burning. Time spent above a temperature threshold was the cumulative time (s) a thermocouple recorded temperatures hotter than a threshold temperature. Total thermal dose above a temperature threshold was the area under the curve that resulted from plotting temperature as a function of time (T), where T0 was the point at which the temperature first exceeded the threshold. Area under the curve was calculated by summing all temperatures recorded above the threshold (since temperatures were recorded at 1 s intervals) (Kennard et al., 2005).
Fire temperature metrics were assessed at two temperature thresholds: 60 and 150°C. 60°C is the lethal temperature for plant cells (Alexandrov, 1964), and 150°C is useful for inter-study comparison as time spent above 150°C is associated with fire severity and corresponds with calorimeter measurements (Pérez and Moreno, 1998), while total thermal dose above 150°C corresponds with pyrometer measurements (Kennard et al., 2005).
Temperature metrics were calculated for each thermocouple, therefore at 0, 10, and 20 m in to the savanna, away from the savanna edge. Thermocouples were positioned on the savanna side of the elephant path, so as to measure fire behavior before the fire front reached the discontinuity in grass created by the path.
Fire Weather
In order to account for the effect of weather on fire behavior, air temperature (°C), relative humidity (%), wind speed (km.hr−1), and wind direction (°) were recorded using a portable weather station (Kestrel 5500L). From this, vapor pressure deficit (VPD) was calculated using the formula (Monteith, 2013):
We also calculated the fire danger index (FDI) (Meikel et al., 2012) which incorporates both meteorological (air temperature, relative humidity, wind speed) and fuel moisture variables (amount of and days since last rainfall event). FDIs vary between 0 and 100 and were categorized into danger classes following Meikel et al. (2012). Immediately before each burn, a grass sample was collected in the savanna section of the transect and its fuel moisture level subsequently assessed on a dry mass basis using the formula:
Relationships between each of these weather variables and each measured fire behavior variable were assessed using linear models.
Grass Flammability
Grass species composition was assessed along the transect by visually estimating the % cover of each grass species representing >1% total cover in 5 m × 2 m blocks. % ground cover estimates were then proportionally transformed into biomass estimates for each species using the total biomass estimates from the DPM. Biomass changes for each species were then plotted as a function of distance into the savanna (from savanna edge) and significance of observed changes assessed at p < 0.05 using Kruskal-Wallis tests. Although woody species were present in the transect, these were not considered in this study as savannas have a surface fire regime mostly fueled by grasses.
Species-specific flammability traits were measured on the three most abundant grass species, Hyparrhenia diplandra, Anadelphia afzeliana, and Imperata cylindrica, which together accounted for more than 80% of the total grass biomass in the transects. Flammability traits were categorized as (i) combustion-, (ii) moisture-, or (iii) biomass- related traits, but these are inextricably linked and should be interpreted as such. Fully mature and sunlit individuals for flammability trait sampling were collected outside the transects, within a 300 m radius of one another, on the same day at the beginning of the dry season (beginning of their natural curing season). Flammability traits were measured at two scales: whole plant (representing a field-based measure) and plant parts in a calorimeter (representing a laboratory-based measure). Differences between flammability traits of each species were assessed using Kruskal-Wallis tests, where significance was noted at p < 0.05.
Combustion-Related Traits
Maximum combustion rate (g.s−1) is the maximum mass loss rate a plant or plant material exhibits during burning (aka peak mass loss rate). The field-based measure of this trait was based on the protocol of (Simpson et al., 2016) and measured on ten plants per species. A plant was supported on a scale before igniting at the base by two matches (Figure S3). During combustion, sample weight was recorded every 0.2 s via post hoc analysis of a video of the scale's display screen during combustion. Weight was then plotted as a function of time and the resulting sigmoidal curve fitted using command drm in package drc (Ritz et al., 2015). The inflection point of the curve represents the point where mass was being lost most quickly. Three seconds of data either side of this point were fitted with a linear model, the slope of which represents the whole plant maximum combustion rate (Simpson et al., 2016). Prior to ignition, plants were clipped to 10 g (9.95–10.05 g) to enable inter-specific comparison since maximum combustion rate is strongly biomass dependant (Simpson et al., 2016). Two of the three species were not ignitable under field conditions so we dried all samples in a field oven at approximately 50°C for 3 days before testing. All but one sample ignited successfully. Three samples were excluded due to large pieces of biomass having fallen off the scale during burning.
To calculate the laboratory-based measure of maximum combustion rate we burnt three dried samples for each species using a cone calorimeter (following ASTM standard E1354). Ten to Forty grams of cut up grass material was placed in a mesh basket 15 cm wide and 368 cm3 such that an equal volume of fuel was compared between each burn. Samples were subjected to a constant heat radiation of 35 kW.m−2 and their maximum combustion rate measured. Heat of combustion (kJ.g−1) (how much heat energy is released during burning); peak heat release rate (kW.m−2) (analogous to maximum fire intensity); and time to ignition (s) (how long it takes for a sample to ignite) were also measured.
Moisture-Related Traits
These were all field-based measurements and were assessed using a novel experimental process to give insight into the curing process of whole plants during the dry season. Twenty-six plants of each species were clipped to constant biomass for each species and air dried in a ventilated room. Ambient air temperature and relative humidity during drying showed little variation (mean temperature (± standard error): 25.3°C (±0.1), mean humidity (± standard error): 89 % (±0.3). The samples were weighed every day until constant weight, and then were oven dried and moisture content determined on a dry mass basis. Moisture content at harvest (% dry biomass), number of days air drying before reaching constant weight, and the moisture content when at constant weight (% dry biomass) were recorded. Moisture content at the point when half of samples becomes ignitable (% dry biomass) was determined by holding a lit match to the base of a subset of the samples (between three and ten samples per day), and noting on which day, and therefore which moisture content, half of this subset ignited and combusted.
Biomass-Related Traits
These were field based measurements. Dry biomass per plant (g) was the mean biomass of five large, mature, sunlit plants per species after they had been oven dried to constant weight. Biomass density (g.cm−1) was measured on the same five plants and gives a measure of the vertical distribution of biomass (Simpson et al., 2016). Each plant was cut into five or more equal length sections (15 to 40 cm depending on plant height), each of which were weighed both fresh and after oven drying to constant weight. Biomass density was then the slope of the linear model fitted to log transformed cumulative dry biomass as a function of log transformed cumulative vertical height. Slopes equalling 1 indicate that biomass is equally distributed along the length of the plant, while slopes <1 and >1 indicate biomass is concentrated toward the top or the bottom of the plant respectively. Leaf surface area to volume (SA/V) ratio was calculated using five leaves from each of three plants per species. Leaf surface area was determined via post-hoc analysis of flatbed scanner images (Pérez-Harguindeguy et al., 2013), leaf volume was determined using calipers to measure leaf thickness at three locations per leaf and multiplying this by the surface area (Simpson et al., 2016).
Results
Evidence for a Fire Suppression Threshold (Q1)
Fire was empirically demonstrated to be suppressed. The majority of fires self-extinguished within 1 m of leaving the savanna (median point of fire extinction (± inter-quartile range) = −1 (±1.8) m from savanna edge) (Figure 2).
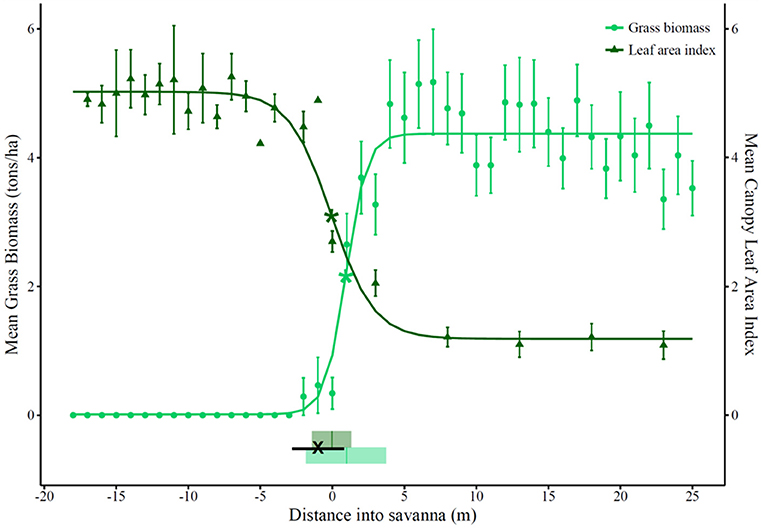
Figure 2. Mean canopy leaf area index (LAI) and mean grass biomass (tons.ha−1) across forest-savanna transitions in 18 regularly burnt transects. The median point (and interquartile range) of fire extinction is shown by “X” (and a solid black line). The zero point on the x-axis represents the edge of the savanna. Positive distances on the x-axis are in the savanna and toward its interior, while negative distances are across the transition and toward the forest interior. Points and error bars show the mean and its standard error. The fitted curves show the results of Border-and-Ecotone Detection Analysis (BEDA) (Hennenberg et al., 2008). The detected border for LAI was 0 m into the savanna (at the savanna edge), where LAI = 3.1 (shown as dark green * on the figure). The ecotonal area for LAI was between −1.4 m and 1.3 m into the savanna (2.7 m wide, shown by dark green shaded rectangle). The border for grass biomass was 1 m into the savanna, where grass biomass = 2.2 (shown as light green * on the figure). The ecotonal area for grass biomass is between −1.8 m and 3.7 m into the savanna (5.6 m wide, shown by light green shaded rectangle).
The point of fire suppression coincided with a threshold in canopy leaf area index (LAI) at which grass biomass became eliminated from the understorey. The detected border in tree canopy LAI (1 m from the field-defined savanna edge, at LAI = 3.1) was co-located with the border in grass biomass (0 m from the savanna edge at grass biomass = 2.2 tons.ha−1), both of which occurred near simultaneously with the median point of fire suppression (−1 m from the savanna edge) (Figure 2). The ecotonal areas of both tree canopy LAI and grass biomass were narrow, spanning 2.7 m and 5.6 m respectively (Figure 2).
Changes in Fire Behavior (Q2)
Fire intensity decreased as it reached the edge of the savanna (Figure 3). This decrease, although significant, was not of great magnitude, due to the high variability in fire intensity.
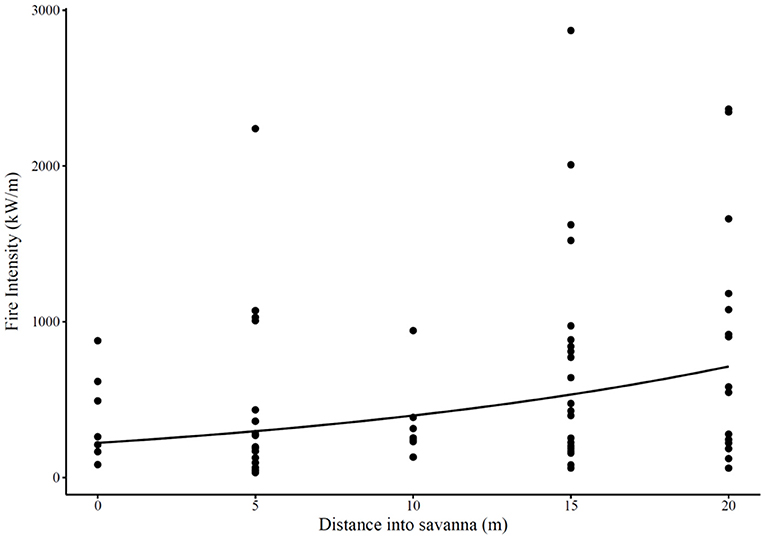
Figure 3. Fire intensity (kW.m−1) at different distances into the savanna (m) as measured in 18 burnt transects across forest-savanna transitions. Points represent measured intensities, and the line represents the generalized linear model fitted to these points (model fitted with the gamma distribution and a log link, with transect included as a random effect: df = 68, intercept = 5.4 (p < 0.0001), slope = 0.06 (p < 0.0001), marginal R2 using the trigamma estimate = 0.11). Positive distances on the x-axis are toward the savanna interior, negative distances (across the transition and toward the forest interior) were not measured in the experimental set-up.
Of greater magnitude were the decreases in fire temperature metrics closer to the edge of the savanna. Maximum recorded flame temperatures at the edge of the savanna were significantly lower at the savanna edge than those recorded in the savanna interior (Kruskal-Wallis, χ2 = 15.7, df = 2, p < 0.001; mean (±standard error) maximum temperature at different distances into the savanna: 0 m = 358 (±26)°C, 10 m = 444 (±32)°C, and 20 m = 511 (±20)°C). Additionally, thermal dose at a threshold of 150°C was lower at the edge of the savanna than in the savanna interior as was time spent above this threshold (area under the curve at different distances into the savanna: 0 m = 16456°C, 10 m = 19911°C, 20 m = 20908°C; time above 150°C at different distances into the savanna: 0 m = 65 s, 10 m = 70 s, 20 m = 79 s; Figure 4A). We observed the reverse for a 60°C threshold, where thermal dose and time spent above this threshold temperature were greater at the edge of the savanna than toward the savanna interior (area under the curve at different distances into the savanna: 0 m = 25030°C, 10 m = 25043°C, 20 m = 22601°C; time above 60°C at different distances into the savanna: 0 m = 223 s, 10 m = 202 s, 20 m = 166 s; Figure 4B).
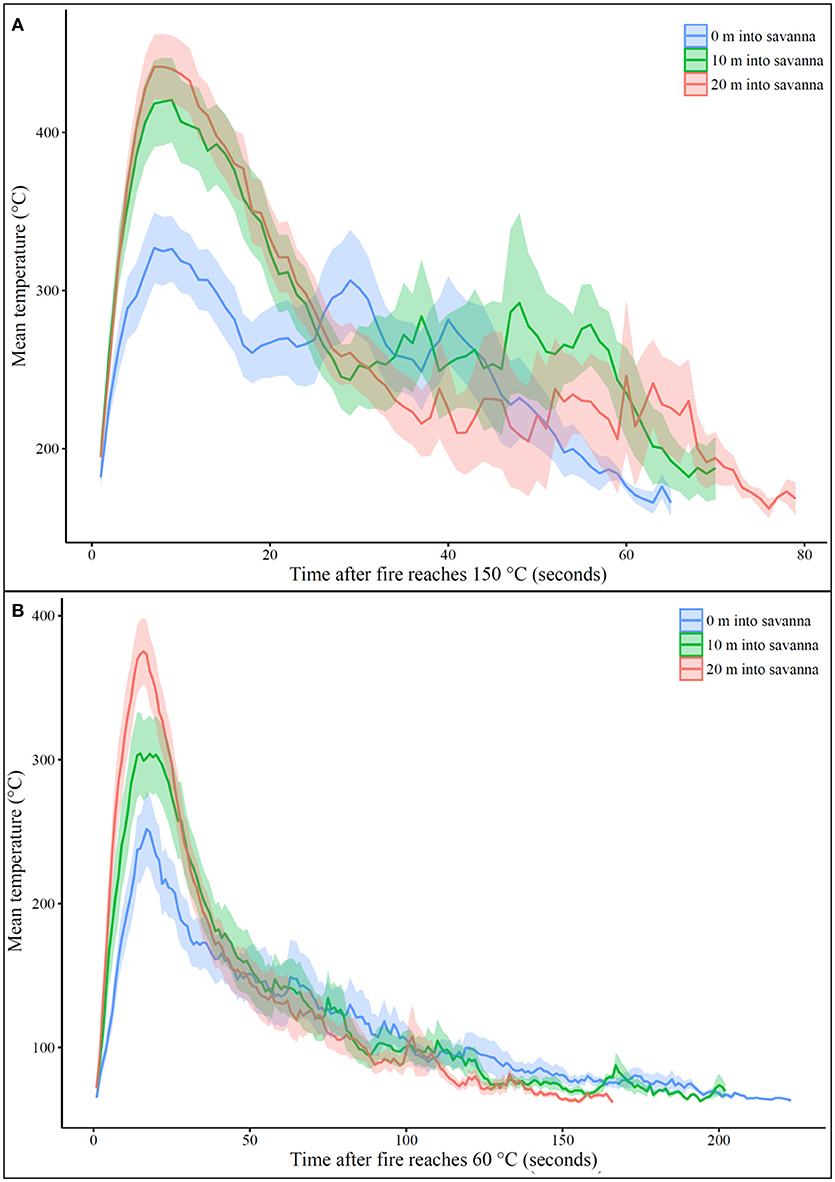
Figure 4. Mean recorded temperatures (°C) after temperature first crossed a threshold of (A) 150°C or (B) 60°C for thermocouples placed at 0 m, 10 m, or 20 m into the savanna. Time 0 was the point at which the temperature first exceeded the threshold. Shaded ribbon shows standard error around the mean. The area under each curve represents the total thermal dose (150°C threshold: 0 m = 16456°C, 10 m = 19911°C, 20 m = 20908°C; 60°C threshold: 0 m = 25030°C, 10 m = 25043°C, 20 m = 22601°C). Time spent above each threshold was the distance between first and last recording of the threshold temperature (150°C threshold: 0 m = 65 s, 10 m = 70 s, 20 m = 79 s; 60°C threshold: 0 m = 223 s, 10 m = 202 s, 20 m = 166 s).
Climate-related metrics measured during the burns showed relatively little variability and were not generally found to be significantly affecting fire behavior (Tables S1, S2).
Grass Community Composition and Flammability (Q3)
Changes in fire behavior were accompanied by significant changes in grass community composition, but not by changes in total grass biomass (Figure 5A). Hyparrhenia diplandra had the highest biomass at almost all distances into the savanna, and showed significant increases in biomass approaching the edge. The second most dominant species, Anadelphia afzeliana, significantly decreased in biomass closer to the savanna edge. The least dominant species, Imperata cylindrica, showed no significant changes in biomass. Changes in grass species composition were accompanied by significant changes in tree canopy LAI (Figure 5B). The increase in tree canopy LAI corresponded with an increase in H. diplandra and a decrease in A. afzeliana.
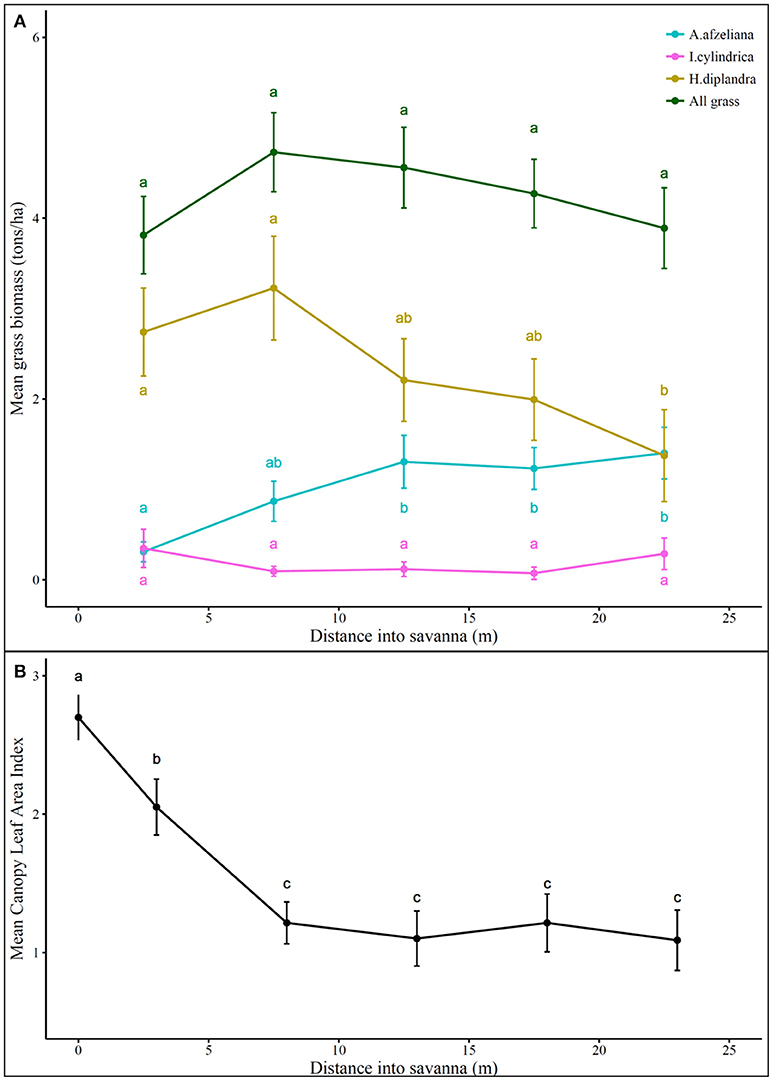
Figure 5. (A) Total and per species grass biomass (tons.ha−1) and (B) tree canopy leaf area index across 18 regularly burnt forest-savanna transition transects. The zero point on the x-axis represents the edge of the savanna, while positive distances are toward the savanna interior. Points and error bars show the mean and its standard error. Different letters indicate significant differences in the variable at different distances into the savanna as determined by Kruskal-Wallis tests (significance noted at p < 0.05).
Field- and laboratory-based measurements of combustion-related traits showed H. diplandra to be the least flammable species, with A. afzeliana and I. cylindrica showing similar flammability traits to one another (Table 1). In field-based measurements H. diplandra maximally combusted less than a third as much weight per second of burning than the other two species (Table 1, Figure 6A). Laboratory-based measurements revealed H. diplandra to also have a significantly lower heat of combustion than the other two species. Conversely, for laboratory-based measurements, A. afzeliana was found to have the lowest and I. cylindrica the highest maximum combustion rates respectively. Laboratory-based measurements also showed that I. cylindrica had the highest peak heat release rate, while A. afzeliana had the lowest. These same measurements showed A. afzeliana and H. diplandra to have significantly faster ignition times, nearly half those of I. cylindrica.
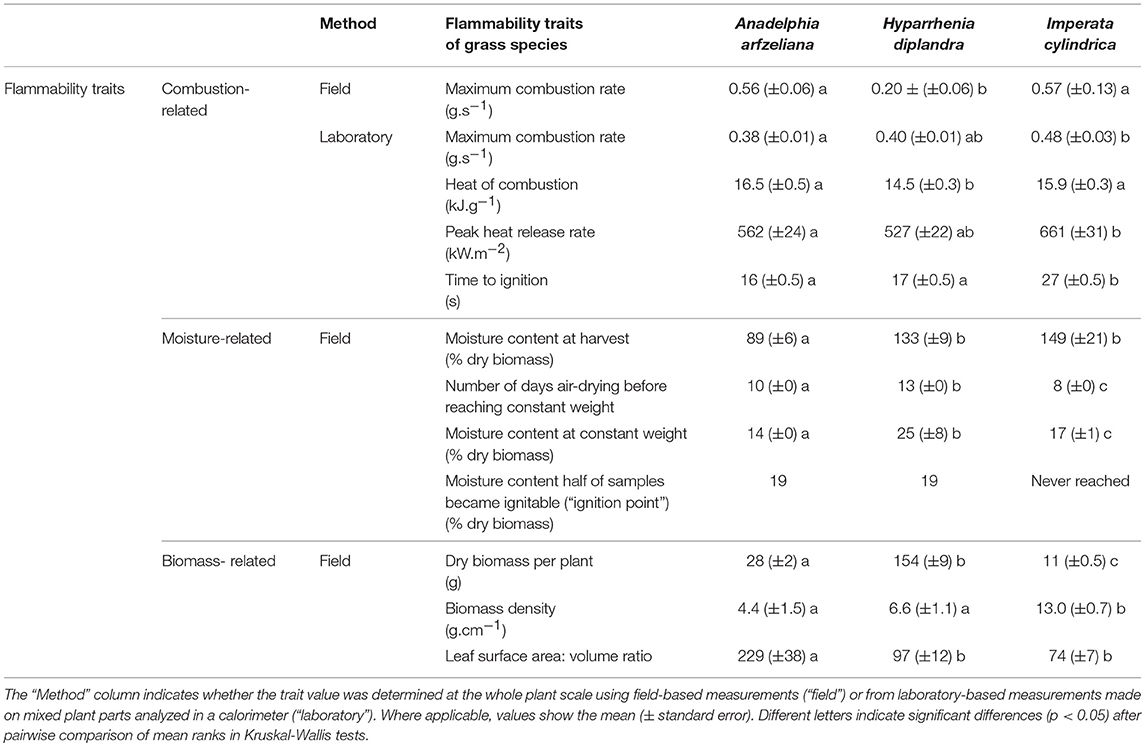
Table 1. Flammability traits for the three dominant grass species: Anadelphia afzeliana, Hyparrhenia diplandra, and Imperata cylindrica.
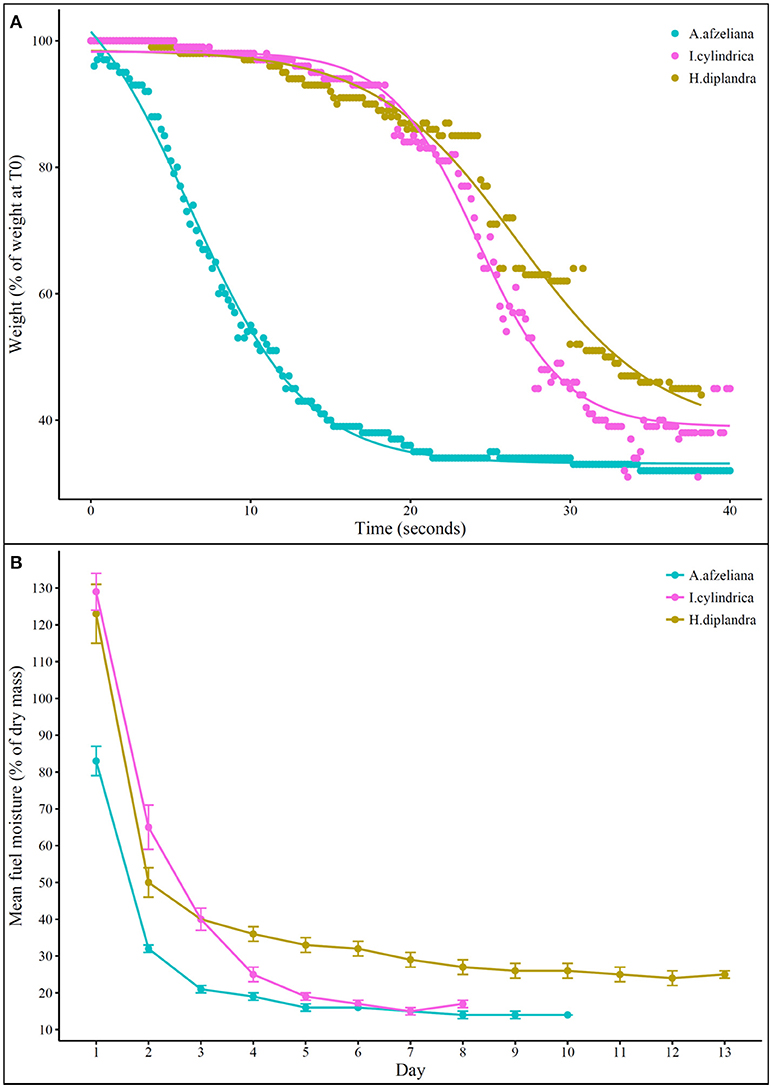
Figure 6. (A) Mean weight loss (% initial weight) over time during combustion and (B) mean fuel moisture content over time during ambient air drying of the three dominant grass species: Anadelphia afzeliana, Hyparrhenia diplandra, and Imperata cylindrica. In (A), the solid line shows the fitted Boltzmann curve for each species (A. afzeliana: p < 0.01, df = 212; H.diplandra: p < 0.01, df = 185; I.cylindrica: p < 0.01, df = 208). In (B), points and error bars show the mean and its standard error; constant moisture content was reached after 8 days for I. cylindrica (at 17%), after 10 days for A. afzeliana (at 14%), and after 13 days for H. diplandra (at 25%); ignition point was reached at 19% moisture content for both A. afzeliana (after 4 days) and I. cylindrica (after 5 days), and never reached for H. diplandra.
Field-based measurement of moisture-related flammability traits revealed A. afzeliana to be the most flammable of the three species. A. afzeliana had a significantly lower in situ moisture content (89%) than H. diplandra (133%) or I. cylindrica (149%) (Table 1, Figure 6B). A. afzeliana also reached an equilibrium moisture content after fewer days of air drying (10 days) than H. diplandra (13 days), and this equilibrium moisture content was significantly lower in A. afzeliana (14 %) than H. diplandra (25%) or I. cylindrica (17%). Both A. afzeliana and I. cylindrica reached ignition point at 19 % moisture content (after 4 and 5 days respectively), while H. diplandra reached neither ignition point nor 19% moisture content during air drying.
Based on combustion-related flammability traits, A. afzeliana and I. cylindrica have a similar flammability to one another and are significantly more flammable than H. diplandra. However, when also considering moisture-related flammability traits, A. afzeliana is the most and H. diplandra the least flammable of the three dominant grass species.
Field-based measurement of biomass-related flammability traits did not conclusively point to one species being more flammable than the rest, with all species more flammable in certain ways and less flammable in others. H. diplandra plants were the biggest (Table 1), with a six- to fourteen- fold higher biomass per plant compared to the other two species. Both H. diplandra and A. afzeliana had lower biomass densities than I. cylindrica. A. afzeliana leaves had significantly higher surface-area to volume ratios than the other two species by more than two-fold.
Discussion
This study demonstrated not only the existence of a fire suppression threshold in this system, but also that its mode of action was mediated by grass community composition which was in turn mediated by the degree of tree canopy cover. This provides support for the hypothesis that forest and savanna are alternative stable states (Sankaran et al., 2005; Hirota et al., 2011; Staver et al., 2011a,b), and highlights the important role of grasses play in the positive feedback loops allowing both states to co-exist in forest-savanna mosaicked landscapes.
A Fire Suppression Threshold Existed Within the Forest-Savanna Transition (Q1)
We determined the fire suppression threshold to be where tree LAI reached a value of 3. At this point, fires self-extinguished and grass biomass was eliminated from the understorey. Our results support previous findings from South American savannas, where the fire suppression threshold was also proposed to occur when tree LAI reached a value of 3 (Hoffmann et al., 2012a). In Southern African savannas, estimates of the fire suppression threshold were where tree canopy cover reached 40% (Archibald et al., 2009) or where tree LAI reached a value of 1.5 (Charles-Dominique et al., 2018), with discrepancies between the latter estimate and the South American estimate attributed to methodological differences or differences in leaf angle and tree architecture.
The presence of narrow ecotones in both tree cover and grass biomass support the hypothesis that fire-mediated positive feedback loops are maintaining both forest and savanna as alternative stable states of a single mosaicked landscape (Staver et al., 2011a,b; Hoffmann et al., 2012a; Staver and Levin, 2012). Any intermediate ecotonal conditions at the forest-savanna transition quickly equilibrated with the more stable conditions of one or the other adjacent environments.
Fires Became Less Intense and Less Hot Prior to Reaching the Fire Suppression Threshold (Q2)
Fire behavior showed significant changes near the edge of the savanna prior to reaching the fire suppression threshold, becoming less intense, reaching lower maximum temperatures, and delivering a lower thermal dose. Although such changes are not entirely unexpected, this is the first empirical exploration of the physical width over which the fire suppression threshold acts. These findings also emphasize the need for fire studies to consider fire as a continuous rather than a binary variable, especially at the forest-savanna transition.
Decreases in fire intensity and heat at the forest-savanna transition have important implications for forest encroachment. Forest encroachment is the process whereby savanna is lost due to expanding forest. It can be mitigated to some extent by intense fires that kill encroaching saplings (van Wilgen et al., 1990; Smit et al., 2010). As this study demonstrated, fires of the critical intensity needed to kill the majority of tree saplings (>3,000 kW.m−1, van Wilgen et al., 1990) are distinctly lacking from the forest-savanna transition. This poses management challenges as the forest-savanna transition is exceptionally vulnerable to forest encroachment (Favier et al., 2004), and there is thus potential for savanna habitat to be lost here. Such losses have already been observed in the less frequently burnt parts of the landscape (Jeffery et al., 2014).
Although some heat metrics (those at the 60°C threshold) did increase closer to the transition, this is unlikely to be sufficient to kill anything but the very smallest tree seedlings. Plant cell death does occur above 60°C, however thermocouples did not measure temperatures inside the relevant plant tissue. Plant tissue is protected from lethal temperatures by bark and other surrounding tissue (Midgley et al., 2011) while the canopy leaf cells are unlikely to have experienced lethal heat plumes as there was an absence of flame-associated temperatures (>300°C) closer to the edge (Wotton et al., 2012).
Changes in Fire Behavior Were Mediated by Changes in Grass Species Composition and Flammability, Which Was Mediated by Tree Canopy Cover (Q3)
We showed fire to decrease in intensity and temperature while total grass biomass remained high. These changes in fire behavior showed strong links with grass species dominance patterns and the associated species-level flammability traits. This study provides the first empirical demonstration of such patterns, and confirms the combined inferences made by previous studies (Simpson et al., 2016; Charles-Dominique et al., 2018; Wragg et al., 2018).
Whole-plant moisture-related flammability traits were especially important in determining landscape-scale fire behavior changes, confirming the importance of including fuel moisture metrics in fire-behavior models (Rothermel, 1972; Scott and Burgan, 2005). For example, although Anadelphia afzeliana and Imperata cylindrica are approximately equally combustible, curing simulations showed that A. afzeliana would be drier and therefore faster combusting than I. cylindrica at any given point in the burning season. Similarly, curing simulations showed that Hyparrhenia diplandra is unlikely to ever cure sufficiently in situ to become flammable, likely due to the high ambient relative humidity levels, and will therefore act to reduce fire intensity and temperature. Both of these inferences were confirmed by field measurements of fire behavior. The low in situ flammability of H. diplandra was further confirmed by post-burn field observations of its leaves resprouting vigorously from the nodes all the way up the scorched-black culms. This indicates that this species' low flammability traits decreased fire intensity sufficiently to protect dormant buds in the canopy.
The importance of moisture-related flammability traits is confirmed by there being key differences between laboratory-based and field-based flammability traits of the three dominant grass species. When equal volumes of dry samples were assessed using a calorimeter, no clear pattern of which species was the most flammable emerged, with each more flammable in one metric while less flammable in another. However, when whole plants were burnt, A. afzeliana, and to a lesser extent I. cylindrica, were shown to be the most flammable, and H. diplandra the least, a finding that correlated with observed landscape-level fire behavior patterns. The discrepancy between the two approaches is due to the combustion of oven-dried samples in the calorimeter, and thus an inability to account for differences in moisture-related flammability traits. Since field-based flammability measurements were key for determining landscape-scale fire behavior, we recommend that future research mimics field moisture conditions within calorimeter-based measurements otherwise incorrect conclusions may be drawn.
Changes in grass species composition occurred simultaneously with an increase in tree canopy cover (LAI). Tree LAI alters understorey habitat both directly, by decreasing the amount of light reaching the understorey, and indirectly, by creation of a cooler, more humid, more fertile environment (Scholes and Archer, 1997). Although the micro-climate of the understorey was not measured in this study, the point at which tree LAI started to significant increase corresponded closely with previous estimates of how far into the savanna the forest's micro-climatic envelope extends (Ibanez et al., 2013b). This indicates that, in addition to the direct effect of light reduction, increasing tree LAI alters grass species composition approaching the edge of the savanna indirectly via changes to the micro-climate. In addition to this indirect effect tree LAI is having on fire behavior, the inextricable direct effect that a cooler and more moist micro-climate might have on fire behavior should not be overlooked, although a thorough investigation of this was beyond the scope of this study.
Conclusion
This study showed that the fire suppression threshold at forest-savanna transitions was not a simple on-off switch, but a mechanism mediated by interacting biotic and abiotic factors that cause fire behavior to change before the threshold is reached. We demonstrated here how the more shade-tolerant grasses are also less flammable, largely as a result of their moister culms. Although not previously described, we suspect that such a phenomenon is widespread, and it would be fascinating to explore whether similar patterns occur at other tropical forest-savanna transitions.
Author Contributions
AC, IO, YM, WB, KA developed ideas, hypotheses, and the experimental setup. AC lead the data collection and analysis and IM, KJ, DL, JE assisted with fieldwork and provided substantial feedback on methodology. CB and IM processed and analyzed grass samples using an iCone calorimeter at University of Exeter, AC lead the writing, and IO, WB, KA, and YM made significant contributions to the writing; all authors provided constructive comments on the draft.
Funding
Project research expenses and AC were supported by the University of Oxford's Hertford Mortimer-May scholarship. AC was also supported by the Commonwealth Scholarship Commission and the Oppenheimer Fund. KA, KJ, and DL were supported by the University of Stirling. KJ and JE by ANPN; IM by University of Oxford's ECI and Kellogg College. CB and YM were supported by ERC grants ERC-2013-StG-335891-ECOFLAM and ERC-2013-AdG-321131-GEMTRAITS, and YM also by the Jackson Foundation.
Conflict of Interest Statement
The authors declare that the research was conducted in the absence of any commercial or financial relationships that could be construed as a potential conflict of interest.
Acknowledgments
We thank the Agence Nationale des Parcs Nationaux (ANPN), their Director of Science, Dr. A. F. Koumba Pambo, and field assistants G. A. Kamba, J. Dibakou, E. Dimoto, A. D. Bousseba, N. E. Milamizokou, P. A. Dimbonda, M. C. Koumba, B. Moussavou, and S. Nzoma. E. Pastor and K. Simpson for valuable discussion. S. Archibald, E. Berenguer, S.Rifai, and reviewers for helpful comments on the manuscript.
Supplementary Material
The Supplementary Material for this article can be found online at: https://www.frontiersin.org/articles/10.3389/ffgc.2018.00006/full#supplementary-material
References
Agence Nationale des Parcs Nationaux (2006). Forest-Savanna Cover Derived From 30m AVHRR Radar Imagery, INTerra 1998 Updated With Ground Measurement 2006. SEGC Map Database.
Alexandrov, V. Y. (1964). Cytophysical and cytological investigations of heat resistance of plant cells toward the action of high and low temperature. Q. Rev. Biol. 39, 35–77. doi: 10.1086/404089
Archibald, S., Roy, D. P., van Wilgen, B. W., and Scholes, R. J. (2009). What limits fire? An examination of drivers of burnt area in Southern Africa. Glob. Chang. Biol. 15, 613–630. doi: 10.1111/j.1365-2486.2008.01754.x
Balch, J. R. K., Nepstad, D. C., Brando, P. M., Curran, L. M., Portela, O., de Carvalho, O., et al. (2008). Negative fire feedback in a transitional forest of southeastern Amazonia. Glob. Chang. Biol. 14, 2276–2287. doi: 10.1111/j.1365-2486.2008.01655.x
Beisner, B. E., Haydon, D. T., and Cuddington, K. (2003). Alternative stable states in ecology. Front. Ecol. Environ. 1, 376–382. doi: 10.1890/1540-9295(2003)001[0376:ASSIE]2.0.CO;2
Bond, W. J., and Van Wilgen, B. (1996). “Fire and Plants,” in Population and Community Biology Series 14 (London: Chapman and Hall), 1–227.
Bradstock, R. A., Hammill, K. A., Collins, L., and Price, O. (2010). Effects of weather, fuel and terrain on fire severity in topographically diverse landscapes of south-eastern Australia. Landsc. Ecol. 25, 607–619. doi: 10.1007/s10980-009-9443-8
Byram, G. M. (1959). “Combustion of forest fuels,” in Forest Fire: Control and Use, ed K. P. Davis (New York, NY: McGraw-Hill), 61–89.
Charles-Dominique, T., Midgley, G. F., Tomlinson, K. W., and Bond, W. J. (2018). Steal the light: shade vs. fire adapted vegetation in forest-savanna mosaics. New Phytol. 218, 1419–1429. doi: 10.1111/nph.15117
Dantas Vde, L., Batalha, M. A., and Pausas, J. G. (2013). Fire drives functional thresholds on the savanna – forest transition. Ecology 94, 2454–2463. doi: 10.1890/12-1629.1
Dantas Vde, L., Hirota, M., Oliveira, R. S., and Pausas, J. G. (2016). Disturbance maintains alternative biome states. Ecol. Lett. 19, 12–19. doi: 10.1111/ele.12537
Favier, C., De Namur, C., and Dubois, M. A. (2004). Forest progression modes in littoral Congo, Central Atlantic Africa. J. Biogeogr. 31, 1445–1461. doi: 10.1111/j.1365-2699.2004.01094.x
Gignoux, J., Konaté, S., Lahoreau, G., Le Roux, X., and Simioni, G. (2016). Allocation strategies of savanna and forest tree seedlings in response to fire and shading: outcomes of a field experiment. Sci. Rep. 6, 1–15. doi: 10.1038/srep38838
Gill, A. M., and Zylstra, P. (2005). Flammability of Australian forests. Aust. For. 68, 87–93. doi: 10.1080/00049158.2005.10674951
Grady, J. M., and Hoffmann, W. A. (2012). Caught in a fire trap: recurring fire creates stable size equilibria in woody resprouters. Ecology 93, 2052–2060. doi: 10.1890/12-0354.1
Hennenberg, K. J., Fischer, F., Kouadio, K., Goetze, D., Orthmann, B., Linsenmair, K. E., et al. (2006). Phytomass and fire occurrence along forest–savanna transects in the Comoé National Park, Ivory Coast. J. Trop. Ecol. 22, 303–311. doi: 10.1017/S0266467405003007
Hennenberg, K. J., Goetze, D., Szarzynski, J., Orthmann, B., Reineking, B., Steinke, I., et al. (2008). Detection of seasonal variability in microclimatic borders and ecotones between forest and savanna. Basic Appl. Ecol. 9, 275–285. doi: 10.1016/j.baae.2007.02.004
Higgins, S. I., Bond, W. J., and Trollope, W. S. W. (2000). Fire, resprouting and variability: a recipe for grass-tree coexistence in savanna. J. Ecol. 88, 213–229. doi: 10.1046/j.1365-2745.2000.00435.x
Hirota, M., Holmgren, M., Van Nes, E. H., and Scheffer, M. (2011). Global resilience of tropical forest and savanna to critical transitions. Science 334, 232–235. doi: 10.1126/science.1210657
Hoffmann, W. A., Geiger, E. L., Gotsch, S. G., Rossatto, D. R., Silva, L. C. R., Lau, O. L., et al. (2012a). Ecological thresholds at the savanna-forest boundary: how plant traits, resources and fire govern the distribution of tropical biomes. Ecol. Lett. 15, 759–768. doi: 10.1111/j.1461-0248.2012.01789.x
Hoffmann, W. A., Jaconis, S. Y., Mckinley, K. L., Geiger, E. L., Gotsch, S. G., and Franco, A. C. (2012b). Fuels or microclimate? Understanding the drivers of fire feedbacks at savanna-forest boundaries. Austral Ecol. 37, 634–643. doi: 10.1111/j.1442-9993.2011.02324.x
Hoffmann, W. A., Orthen, B., and Vargas Do Nascimento, P. K. (2003). Comparative fire ecology of tropical savanna and forest trees. Funct. Ecol. 17, 720–726. doi: 10.1111/j.1365-2435.2003.00796.x
Ibanez, T., Borgniet, L., Mangeas, M., Gaucherel, C., Géraux, H., and Hély, C. (2013a). Rainforest and savanna landscape dynamics in New Caledonia: towards a mosaic of stable rainforest and savanna states? Austral Ecol. 38, 33–45. doi: 10.1111/j.1442-9993.2012.02369.x
Ibanez, T., Hély, C., and Gaucherel, C. (2013b). Sharp transitions in microclimatic conditions between savanna and forest in New Caledonia: insights into the vulnerability of forest edges to fire. Austral Ecol. 38, 680–687. doi: 10.1111/aec.12015
Jeffery, K. J., Korte, L., Palla, F., White, L. J. T., and Abernethy, K. A. (2014). Fire management in a changing landscape : a case study from Lopé National Park. Parks 20, 35–48. doi: 10.2305/IUCN.CH.2014.PARKS-20-1.KJJ.en
Kennard, D. K., Outcalt, K. W., Jones, D., and O'Brien, J. J. (2005). Comparing techniques for estimating flame temperature of prescribed fires. Fire Ecol. 1, 75–84. doi: 10.4996/fireecology.0101075
Lloyd, J., and Veenendaal, E. M. (2016). Are fire mediated feedbacks burning out of control? Biogeosciences Discuss. 1–20. doi: 10.5194/bg-2015-660
Marthews, T., Riutta, T., Oliveras Menor, I., R, Urrutia., Moore, S., Metcalfe, D., et al. (2014). Measuring Tropical Forest Carbon Allocation and Cycling: A RAINFOR-GEM Field Manual for Intensive Census Plots (v3.0). Available online at: http://scholar.google.com/scholar?hl=en&btnG=Search&q=intitle:Measuring+Tropical+Forest+Carbon+Allocation+and+Cycling:+A+RAINFOR-GEM+Field+Manual+for+Intensive+Census+Plots#0%5Cn; http://scholar.google.com/scholar?hl=en&btnG=Search&q=intitle:Measuring+tropica
Meikel, S., Trollope, W. S. W., Heine, J., and Heine, L. (2012). Fire Danger Rating System for Controlled Burning. Nelspruit.
Midgley, J. J., Kruger, L. M., and Skelton, R. (2011). How do fires kill plants? The hydraulic death hypothesis and Cape Proteaceae “fire-resisters.” South African J. Bot. 77, 381–386. doi: 10.1016/j.sajb.2010.10.001
Oliveras, I., and Malhi, Y. (2016). Many shades of green: the dynamic tropical forest–savannah transition zones. Philos. Trans. R. Soc. B Biol. Sci. 371:20150308. doi: 10.1098/rstb.2015.0308
Pausas, J. G., Keeley, J. E., and Schwilk, D. W. (2017). Flammability as an ecological and evolutionary driver. J. Ecol. 105, 289–297. doi: 10.1111/1365-2745.12691
Pérez, B., and Moreno, J. M. (1998). Methods for quantifying fire severity in shrubland-fires. Plant Ecol. 139, 91–101. doi: 10.1023/A:1009702520958
Pérez-Harguindeguy, N., Díaz, S., Lavorel, S., Poorter, H., Jaureguiberry, P., Bret-Harte, M. S., et al. (2013). New Handbook for standardized measurment of plant functional traits worldwide. Aust. J. Bot. 23, 167–234. doi: 10.1071/BT12225
Peyrot, B., Oslisly, R., Abdessadok, S., Fontugne, M., Hatte, C., and White, L. J. T. (2003). Paleoenvironments of the late Pleistocene and Holocene in the Lopé reserve (Gabon); Approach by geomorphologic, sedimentologic, phytologic, geochimic, and anthropogenic indicators of the environments recording the Lopé depression. Anthropologie 107, 291–307. doi: 10.1016/S0003-5521(03)00011-6
Ritz, C., Baty, F., Streibig, J. C., and Gerhard, D. (2015). Dose-response analysis using R. PLoS ONE 10:e0146021. doi: 10.1371/journal.pone.0146021
Rothermel, R. C. (1972). A mathematical model for predicting fire spread in wildland fuels. USDA For. Serv. Res. Pap. INT USA, 1–49.
Sankaran, M., Hanan, N. P., Scholes, R. J., Ratnam, J., Augustine, D. J., Cade, B. S., et al. (2005). Determinants of woody cover in African savannas. Nature 438, 846–849. doi: 10.1038/nature04070
Schleppi, P., Conedera, M., Sedivy, I., and Thimonier, A. (2007). Correcting non-linearity and slope effects in the estimation of the leaf area index of forests from hemispherical photographs. Agric. For. Meteorol. 144, 236–242. doi: 10.1016/j.agrformet.2007.02.004
Scholes, R. J., and Archer, S. R. (1997). Tree-grass interactions in Savannas. Annu. Rev. Ecol. Syst. 28, 517–544. doi: 10.1146/annurev.ecolsys.28.1.517
Scott, J. H., and Burgan, R. E. (2005). Standard fire behavior fuel models : a comprehensive set for use with Rothermel' s surface fire spread model. Gen. Tech. Rep. RMRS-GTR-153, 1–80. doi: 10.2737/RMRS-GTR-153
Simpson, K. J., Ripley, B. S., Christin, P., Belcher, C. M., Lehmann, C. E. R., Thomas, G. H., et al. (2016). Determinants of flammability in savanna grass species. J. Ecol. 104, 138–148. doi: 10.1111/1365-2745.12503
Smit, I. P. J., Asner, G. P., Govender, N., Kennedy-Bowdoin, T., Knapp, D. E., and Jacobson, J. (2010). Effects of fire on woody vegetation structure in African savanna. Ecol. Appl. 20, 1865–1875. doi: 10.1890/09-0929.1
Staver, A. C., Archibald, S., and Levin, S. (2011a). Tree cover in sub-Saharan Africa: rainfall and fire constrain forest and savanna as alternative stable states. Ecology 92, 1063–1072. doi: 10.1890/10-1684.1
Staver, A. C., Archibald, S., and Levin, S. A. (2011b). The global extent and determinants of Savanna and forest as alternative biome states. Science 334, 230–232. doi: 10.1126/science.1210465
Staver, A. C., and Levin, S. A. (2012). Integrating theoretical climate and fire effects on Savanna and forest systems. Am. Nat. 180, 211–224. doi: 10.1086/666648
Thimonier, A., Sedivy, I., and Schleppi, P. (2010). Estimating leaf area index in different types of mature forest stands in Switzerland: a comparison of methods. Eur. J. For. Res. 129, 543–562. doi: 10.1007/s10342-009-0353-8
Torello-Raventos, M., Feldpausch, T. R., Veenendaal, E., Schrodt, F., Saiz, G., Domingues, T. F., et al. (2013). On the delineation of tropical vegetation types with an emphasis on forest/savanna transitions. Plant Ecol. Divers. 6, 101–137. doi: 10.1080/17550874.2012.762812
Trollope, W. S. W. (1998). Effect and Use of Fire in the Savanna Areas of Southern Africa. Fort hare.
Tutin, C., Abernethy, K., Jeffery, K., Moussavou, G., Mihindou, V., Lehmann, D., et al. (2016). Long-Term Climatic Data-Sets, SEGC, Lopé NP, Gabon. Libreville.
van de Weghe, J. P. (2011). Les Parcs Nationaux du Gabon: Lopé, Waka et Monts Birougou. Libreville: ANPN and WCS Gabon.
van Wilgen, B. W., Everson, C. S., and Trollope, W. S. W. (1990). “Fire management in southern Africa: some examples of current objectives, practices and problems,” in Fire in the Tropical Biota: Ecosystem Processes and Global Challenges, ed G. J. Goldammer (Berlin: Springer-verlag), 179–209.
White, F. (1983). The Vegetation of Africa: A Descriptive Memoir to Accompany the Vegetation Map of Africa. Paris: UNESCO.
White, L. T. J. (2001). “Forest–savanna dynamics and the origins of ‘Marantaceae Forest' in the Lope’ Reserve, Gabon,” in African Rain Forest Ecology and Conservation, eds B. Weber, L. White, A. Vedder, and L. Naugthon-Treves (New Haven, CT: Yale University Press), 165–182.
Wotton, B. M., Gould, J. S., McCaw, W. L., Cheney, N. P., and Taylor, S. W. (2012). Flame temperature and residence time of fires in dry eucalypt forest. Int. J. Wildl. Fire 21, 270–281. doi: 10.1071/WF10127
Keywords: forest-savanna mosaic, transition, ecotones, fire behavior, edge effects, flammability, alternative stable states, grass functional traits
Citation: Cardoso AW, Oliveras I, Abernethy KA, Jeffery KJ, Lehmann D, Edzang Ndong J, McGregor I, Belcher CM, Bond WJ and Malhi YS (2018) Grass Species Flammability, Not Biomass, Drives Changes in Fire Behavior at Tropical Forest-Savanna Transitions. Front. For. Glob. Change 1:6. doi: 10.3389/ffgc.2018.00006
Received: 07 September 2018; Accepted: 15 October 2018;
Published: 09 November 2018.
Edited by:
Thomas Curt, Institut National de Recherche en Sciences et Technologies pour l'Environnement et l'Agriculture (IRSTEA), FranceReviewed by:
Panayiotis G. Dimitrakopoulos, University of the Aegean, GreeceMelisa Blackhall, Laboratorio Ecotono, Universidad Nacional del Comahue, Argentina
Copyright © 2018 Cardoso, Oliveras, Abernethy, Jeffery, Lehmann, Edzang Ndong, McGregor, Belcher, Bond and Malhi. This is an open-access article distributed under the terms of the Creative Commons Attribution License (CC BY). The use, distribution or reproduction in other forums is permitted, provided the original author(s) and the copyright owner(s) are credited and that the original publication in this journal is cited, in accordance with accepted academic practice. No use, distribution or reproduction is permitted which does not comply with these terms.
*Correspondence: Anabelle W. Cardoso, YW5hYmVsbGVjYXJkb3NvQGdtYWlsLmNvbQ==