 Eva Y. Pfannerstill1*
 Anke C. Nölscher1†
 Ana M. Yáñez-Serrano1†
 Efstratios Bourtsoukidis1
 Stephan Keßel1
 Ruud H. H. Janssen2Anywhere Tsokankunku1Stefan Wolff1Matthias Sörgel1
 Marta O. Sá3Alessandro Araújo4David Walter1
 Jošt Lavrič5Cléo Q. Dias-Júnior6Jürgen Kesselmeier1
 Jonathan Williams1
- 1Atmospheric Chemistry, Biogeochemistry, and Multiphase Chemistry Departments, Max Planck Institute for Chemistry, Mainz, Germany
- 2Department of Civil and Environmental Engineering, Massachusetts Institute of Technology, Cambridge, MA, United States
- 3Large-Scale Biosphere-Atmosphere Experiment in Amazonia (LBA), Instituto Nacional de Pesquisas da Amazônia, Manaus, Brazil
- 4Empresa Brasileira de Pesquisa Agropecuária Amazonia Oriental, Belém, Brazil
- 5Biogeochemical Systems Department, Max Planck Institute for Biogeochemistry, Jena, Germany
- 6Department of Physics, Federal Institute of Education, Science and Technology (IFPA), Belem, Brazil
The 2015/16 El Niño event caused unprecedented drought and warming in the Amazon basin. How tropical forests react to such extreme events in terms of volatile organic compound (VOC) emissions is of interest as the frequency of these events is predicted to increase through climate change. The diverse VOCs emitted can be significant for plants' carbon budgets, influence ozone and particle production, and through their reactivity impact OH concentrations. Total OH reactivity is a directly measureable quantity that gives the reaction frequency of OH radicals with all reactive species in the atmosphere in s−1. Here we present a comparison of the OH reactivity diel cycle from November 2015, i.e., extreme drought and elevated temperatures associated with strong El Niño conditions, with November 2012, a “normal” El Niño Southern Oscillation (ENSO)-neutral period. Interestingly, the diel maximum of OH reactivity during the El Niño event occurred at sunset instead of, under normal conditions, early afternoon. The absolute total diel OH reactivity, however, did not change significantly. Daytime OH reactivity averages were 24.3 ± 14.5 s−1 in 2012 and 24.6 ± 11.9 s−1 in 2015, respectively. Our findings suggest that a combination of stronger turbulent transport above the canopy with stress-related monoterpene and, possibly, other biogenic volatile organic compound (BVOC) emissions were responsible for the increased reactivity at sunset.
Introduction
Amazonia contains more than half of the world's tropical forests (Morley, 2000), 25% of the Earth's biodiversity (Dirzo and Raven, 2003), and nearly 15% of terrestrial biomass (Houghton et al., 2001; Bar-On et al., 2018). As such the Amazon rainforest is an ecosystem of global relevance for water, energy, and carbon cycles (Malhi, 2002; Werth, 2002; Aragão et al., 2014). Its biosphere-atmosphere interface is of utmost significance for a complete understanding of global biogeochemical cycles.
How the Amazon biosphere and the overlying atmosphere will react to future climate change is therefore an important question. Most near- and long-term IPCC models predict warming, combined with decreasing precipitation and soil moisture in Amazonia (Intergovernmental Panel on Climate Change, 2014). Drought and increasingly elevated temperatures are already being observed (Li et al., 2008; Marengo et al., 2011; Feldpausch et al., 2016; Jiménez-Muñoz et al., 2016; Marengo and Espinoza, 2016; Erfanian et al., 2017; Aragão et al., 2018; Yang et al., 2018) and are predicted to occur more often there in the future. Tropical forests are vulnerable to climate change variables such as precipitation decrease and warming. These can lead to increased tree mortality and reduced net primary productivity, with the result that the forest is no longer a sink, but a source of atmospheric carbon (Metcalfe et al., 2010; Brienen et al., 2015; van der Laan-Luijkx et al., 2015; Feldpausch et al., 2016; McDowell et al., 2018). The frequency of El Niño events is predicted to increase (Timmermann et al., 1999; Cai et al., 2015), as well as anthropogenic land use change (i.e., forest loss), which exacerbates water deficits and elevated temperatures in Amazonia (Zeng et al., 1996; Baidya Roy, 2002; Swann et al., 2015; Alkama and Cescatti, 2016; Zemp et al., 2017).
A highly relevant factor in atmospheric chemistry, which is expected to alter in response to climate change (Monson et al., 2007), is the emission of biogenic volatile organic compounds (BVOCs) by plants. Tropical forests represent the main source for BVOCs on Earth (Guenther et al., 2012). These relatively short-lived (minutes to days) atmospheric species are important as they can influence local tropospheric ozone and particle formation. Some plant BVOCs, e.g., isoprene and monoterpenes, are thought to act as antioxidants against stress-induced reactive oxygen species or help plants cope with abiotic stress by changing membrane properties (Sharkey et al., 2008; Vickers et al., 2009; Karl et al., 2010; Jardine et al., 2013; Sharkey and Monson, 2017). Once released to the atmosphere, the BVOCs mainly react with OH radicals formed from the ozone photoproduct O1D and water. This oxidation pathway has important implications for secondary organic aerosol formation and, in turn, for cloud formation, and climate (Pöschl et al., 2010; Ehn et al., 2014; Palm et al., 2018); as well as for the modulation of greenhouse gas and pollutant concentrations (e.g., methane and CO; Arneth et al., 2010; Peñuelas and Staudt, 2010). For carbon cycle closure, BVOCs represent a challenge: without stress, 1–2% of net primary production (NPP) by land plants is emitted as monoterpenes and isoprene (Sharkey and Loreto, 1993; Kesselmeier et al., 2002; Harrison et al., 2013). These numbers may be regarded as small related to NPP and gross primary production (GPP), but the amount of carbon lost as VOC emissions can be highly significant relative to net ecosystem productivity (Kesselmeier et al., 2002). Furthermore, if multiple abiotic stress factors such as heat, drought, or high irradiance are applied, up to 10% (Peñuelas, 2003) or even in extreme cases 67% (Sharkey and Loreto, 1993) of plant carbon can be allocated to BVOCs.
Studies of BVOCs in tropical forests tend to be, for technical reasons, limited to a modest number of abundant compounds such as isoprenoids, and some oxygenated species (e.g., Kesselmeier et al., 2000; Rinne et al., 2002; Kuhn et al., 2004, 2007; Rottenberger et al., 2004; Rizzo et al., 2010; Jardine et al., 2015; Yáñez-Serrano et al., 2015, 2018). This is despite the fact that plants are known to release more than 30,000 different VOCs (e.g., Harley, 2013). A measure for the combined effect of all VOCs and other OH reactive species in ambient air, i.e., the total OH sink, is termed the total OH reactivity. Total OH reactivity in Amazonia is thought to be dominated by isoprene and other reactive BVOCs (Nölscher et al., 2016) that are emitted as a function of temperature and light (e.g., Rinne et al., 2002). These emissions are higher in the dry season than in the wet season. However, especially in the dry season a significant part of OH reactivity remains unexplained by individually measured trace gases, the so-called “missing reactivity” (Nölscher et al., 2016; Williams et al., 2016).
Here we compare OH reactivity measurements at a central Amazonian site under two contrasting regimes which are due to the influence of El Niño Southern Oscillation (ENSO): (1) ENSO-neutral conditions (November 2012) and (2) strong El Niño conditions with record-breaking precipitation deficit and heat (November 2015). The 2015/16 drought and warming event is unprecedented in records since 1900 and is attributed to an unusually strong El Niño period (Jiménez-Muñoz et al., 2016; Varotsos et al., 2016; Erfanian et al., 2017; Paek et al., 2017; Wang and Hendon, 2017; Yang et al., 2018). Satellite data of 2015/16 show a regional land surface temperature anomaly of up to + 4°C for October through December 2015 in the Amazon basin (Jiménez-Muñoz et al., 2016) and that 43% of the Amazon biome encountered a significant negative maximum climatological water deficit (Aragão et al., 2018). Due to these extreme conditions, stress-related plant emissions may occur. Therefore, by extension we may hypothesize that compared to ENSO-neutral conditions, El Niño conditions would lead to increased total OH reactivity as a result of elevated, stress-induced emissions. In this study we examine the OH reactivity behavior in data collected in these two contrasting regimes, both in absolute terms, and as a function of time of the day.
Materials and Methods
Sampling Site
The Amazonian Tall Tower Observatory (ATTO) site (Andreae et al., 2015) is located in a dense, non-flooded terra firme forest 150 km northeast of Manaus, Brazil, at 120 m above sea level (Figure 1). The main wind direction at the site, as in the whole trade wind influenced region, is northeast (MacGregor and Nieuwolt, 1998; Pöhlker et al., in review; Figure 2). This means that it is mainly influenced by air masses that have passed over several hundred km of undisturbed old-grown rainforest (Supplementary Figure 1). The walk-up tower (Instant UpRight, Dublin, Ireland) is located at S 02°08′38.6″, W 58°59′59.9″ (height above ground level: 80 m). It has been in operation since 2012, and is equipped with instrumentation for continuous measurements such as meteorology, micrometeorology, greenhouse gases, phenology, inorganic trace gases, and aerosol particles. During intensive observation periods, these are complemented by, amongst others, VOC, and total OH reactivity measurements. The maximum canopy top height in the footprint area of the tower is ~35 m and more than 400 tree species have been identified there (Andreae et al., 2015). The average tree height did not change significantly over time because this forest consists of trees in all stages of life and the timespan between the two measurement periods was relatively short in comparison with the lifetime of a tree. The zero-plane displacement height (0.9 h, where h is canopy height) is 31.5 m. Supplementary Figures 2, 3 show the footprint and the origin of up to 80% of the flux for this displacement height.
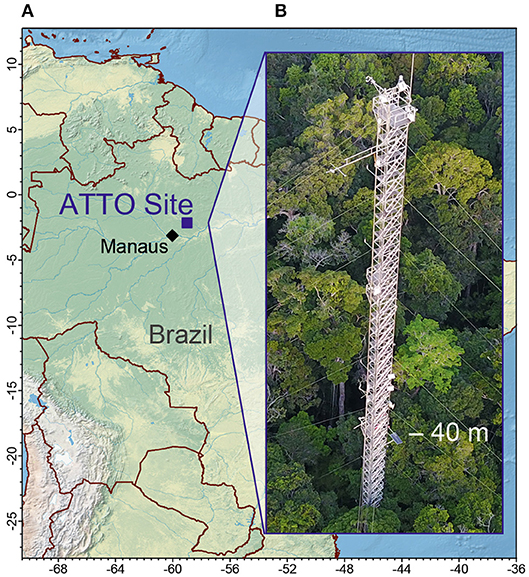
Figure 1. (A) Location of the ATTO site. (B) 80 m walk-up tower with inlet at 41 m height above ground level.

Figure 2. Frequency distribution of wind directions and wind speed in m s−1 measured (A) at 36 m above ground level from November 01 to 28, 2012 and (B) at 41 m above ground level from November 11 to 23, 2015.
Measurement Periods
The intensive measurement campaign in 2015 was set at the end of the dry season (June–October). During this season, cumulative precipitation generally does not exceed 120 mm per month (Restrepo-Coupe et al., 2013). Sampling took place continuously from November 11 until November 23, 2015. This period fell into the extreme 2015/16 El Niño event (Jiménez-Muñoz et al., 2016; Erfanian et al., 2017; Wang and Hendon, 2017; Yang et al., 2018). There was no rainfall during the measurement period—the last rain event before the campaign took place on November 9, the next one on November 27, 2015.
The data used to compare this period with an ENSO-neutral November were collected in 2012 (10 full days between November 1 and 28). The sampling details for this campaign are described elsewhere (Nölscher et al., 2016 and Yáñez-Serrano et al., 2015). During the 2012 campaign, inlets were situated at several heights on the 80 m walk-up tower, however, for this comparison we only considered OH reactivity and VOC data measured at the 38 m inlet, which was closest to the 41 m inlets used in 2015. Ozone, NO2, NO, CO, and CH4 were monitored at 38 m during both campaigns. The vertical distance from the 38 m inlet to the tallest trees directly adjacent to the tower was 10 m (Figure 1 in Chor et al., 2017).
OH Reactivity and Trace Gas Measurements
During the two campaigns, total OH reactivity was determined using the Comparative Reactivity Method (CRM, Sinha et al., 2008). It is based on the competitive reaction between pyrrole (Westfalen AG, Münster, Germany) and reactive compounds from ambient air inside a glass reactor. OH radicals are created by flushing humidified nitrogen (6.0 grade, Westfalen AG, Münster, Germany) over a Hg/Ar UV lamp (LOT Quantum Design, Darmstadt, Germany). The different modes used in CRM−C1 (dry pyrrole + UV light), C2 (OH + pyrrole), and C3 level (ambient air + pyrrole + OH)—are described in detail in Sinha et al. (2008). In our study, the C3 level was measured for 48 min starting at the full hour and the C2 level for 12 min at the end of the hour. The C1 level was determined at least every 2 days, and calibrations with a pyrrole gas standard (Westfalen AG, Münster, Germany) were performed every 3–6 days. Changes in pyrrole mixing ratio were monitored by a Quadrupole Proton Transfer Reaction-Mass Spectrometer [PTRMS, Ionicon Analytik, Innsbruck, Austria (Lindinger et al., 1998)] at m/z = 68 (dwell time: 5 s). Measurement intervals were 7 s. The PTRMS was operated at 50°C drift temperature, 2.2 mbar drift pressure, 600 V drift voltage, and 127 Td. In parallel, another Quadrupole PTRMS, calibrated regularly with a multicomponent pressurized gas VOC standard (Apel-Riemer Environmental Inc., Colorado, USA), was deployed to monitor two important contributors to OH reactivity (Nölscher et al., 2016): Isoprene (detected as m/z 69) and the sum of isoprene oxidation products [m/z 71, methyl vinyl ketone (MVK), methacrolein (MACR), and isoprene hydroperoxide (ISOPOOH)]. Their mixing ratios were measured with fast response (1 Hz) in 2015. Eleven more masses were monitored additionally in 2012 (see Yáñez-Serrano et al., 2015 and Nölscher et al., 2016).
Sampling
A heated and insulated polytetrafluoroethylene (PTFE) inlet tube (1/2″ = 1.27 cm outer diameter), topped with a routinely changed PTFE filter (pore size: 5 μm) to avoid contamination by insects or particles, was positioned at ca. 41 m height above ground level on the tower. Air samples were continuously drawn at a flow rate of ≈ 30 slpm into an air-conditioned laboratory container located below the tower. In order to avoid underpressure in the CRM reactor, the sampled air passed through a chemically inert pump with a Teflon membrane (Neuberger KNF, Freiburg, Germany) at ca. 500 sccm before entering the CRM instrument. The inlet residence time determined by spiking with methanol was 19 s.
Flux Calculations
Isoprene was measured with the above described PTRMS at a time resolution of 1 s. It was sampled from a separate 3/8″ inlet at 41 m above ground level at a flow rate of about 10 L min−1. The delay time of the PTRMS signal was corrected by maximizing the covariance between the water cluster signal of the PTRMS with the signal of an open path water analyzer (Li-COR 7500, LI-COR Inc., Lincoln, USA). A CSAT3 sonic anemometer (Campbell Scientific Inc., Logan, USA), situated at a distance of 0.5 m to the isoprene inlet, was used for high frequency three-dimensional measurement of the wind speed. The software package EddyPro® (LI-COR Inc., Lincoln, USA) was applied to calculate eddy covariance fluxes of CO2, water and isoprene by correlating fluctuations of the vertical wind vector to the fluctuations of the CO2, water, and isoprene concentrations. The method of Vickers and Mahrt (1997) was employed for de-spiking and raw data statistical screening. Half-hourly averaged fluxes were flagged according to the data quality control method of Mauder and Foken (2004). Only data with highest quality (flags 0 and 1) was kept for further analyses. High frequency losses for sampling frequencies between 0.1 and 0.8 Hz have been found to be below 10% (Guenther and Hills, 1998; Spirig et al., 2005; Holst et al., 2010; Jensen et al., 2018). We calculated footprints according to the two-dimensional model of Kljun et al. (2015) for a geographic domain of 2 × 2 km centered at the tower. We used the Tovi Footprint Analysis Toolbox (LI-COR Inc., Lincoln, USA) to calculate half-hourly footprints and aggregated them for the measurement period.
Total OH Reactivity Data Analysis
The PTRMS signal at m/z = 68 (protonated mass of pyrrole) was used for calculating pyrrole mixing ratios. Pyrrole PTRMS data were corrected for high O concentration in the ion source of up to 12%, which ionized isoprene as m/z = 68. This artifact caused by ambient isoprene (slightly higher signal on m/z = 68) was corrected for using the isoprene mixing ratios collected by the VOC-PTRMS measuring from a parallel inlet at the same height, and an experimentally derived yield of isoprene after the reactions in the CRM reactor have taken place. This correction was below the total uncertainty of the measurements [on average 0.28 ± 0.18 (standard deviation) ppbv of pyrrole, which corresponds to an OH reactivity of ca. 1.6 s−1].
CRM data analysis was conducted following the general procedures described in Keßel (2016). During C2 (background) measurements, ambient air passed through a catalytic converter that removes all VOCs. Humidity can differ between C2 level and C3 level (ambient air), especially as the C2 level is measured only once per hour and ambient humidity is subject to change in the meantime. This difference has to be accounted for because the amount of OH radicals generated in the reactor depends on humidity. C2 data therefore were corrected using a relationship derived from an empirical test as recommended in Michoud et al. (2015). The C2 correction applied to match C3 level humidity amounted on average 0.92 ± 0.31 ppbv of pyrrole, which equals ca. 5.3 s−1 of OH reactivity.
The CRM method is sensitive to NO and NO2 due to OH recycling caused by HO2, which is formed in the reactor simultaneously with OH (Sinha et al., 2008; Michoud et al., 2015). However, NO and NO2 mixing ratios at the ATTO site were at all times below 3 ppbv, which is the threshold over which a significant effect is visible in the CRM instrument (maximum observed NO: 0.91 ppbv; maximum NO2: 1.38 ppbv). Therefore, no interference from NOx was expected.
An ozone interference for CRM was discovered recently (Fuchs et al., 2017). The interference for this instrument was characterized using an ozone generator (Dynamic Gas Calibrator 146C, Thermo Environmental Instruments LLC, Franklin, USA). The resulting correction was ca. 0.018 ppbv of pyrrole per ppbv of ozone, which corresponds to ca. 0.1 s−1 per ppbv of ozone. This correction increased OH reactivity values by up to 1%.
The calculation of total OH reactivity based on three modes (C1, C2, and C3 levels) assumes pseudo 1st order conditions [i.e., [pyrrole] >> [OH]]. As the experiments are conducted at pyrrole/OH ratios of 1.2 to 2 in order to provide detectable differences between the CRM modes, a correction needs to be applied. A chemical model (Facsimile) was used to derive a relationship between true total reactivity and calculated reactivity from the CRM equation. This correction reduced the OH reactivity value by maximum 6%.
Finally, a dilution factor of 1.28 was applied to account for the humidified nitrogen mixed with the ambient air in the reactor.
The detection limit (LOD) was 4.2 s−1 (derived from 2σ standard deviation on C2 levels). Accuracy of the measurements was ca. 30%, with a precision of 10–20% depending on the quantity of reactivity (for total uncertainty, dependent on the amount of OH reactivity: see Supplementary Figure 4).
Total OH reactivity expected from individually measured compounds is the sum of the OH reactivities of the respective compounds:
Contributions of measured trace gases (X, where [X] is their respective concentration in molecules cm−3) to total OH reactivity (Rtotal in s−1) were calculated using the reaction rate constants (kX+OH in cm3 molecule−1 s−1) of trace gases (X) with the OH radical as shown in Supplementary Table 1 for November 2015. For the purpose of this calculation, it is assumed that the different inlets of trace gas measurements and OH reactivity were co-located. The difference between measured total OH reactivity and the sum of individual trace gas contributions to OH reactivity is termed “unexplained” or “missing” OH reactivity.
All data analysis was conducted using IGOR Pro 6.37.
Canopy Stomatal Conductance Calculation
Stomatal conductance is generally estimated using an approach described by Ball (1987). It is derived from the ratio of measured water flux and estimated release capacity based on the water vapor gradient between leaf and atmosphere at ambient temperatures measured inside the canopy [assuming a water vapor saturation of 100% inside the leaf. We note that this assumption has been recently challenged for conifer leaves, where humidity was below 100% (Cernusak et al., 2018)]. As a general rough approximation, we considered the whole canopy as a single large leaf and relative humidity inside the canopy (26 m) as the driving force of the water vapor gradient.
Analysis of Turbulent Transport
Turbulence drives the transport of reactive species out of the canopy from below and from the boundary layer aloft to the height at which OH reactivity is measured. Therefore, it is useful to assess the strength of turbulent transport and whether it was different between the 2 years.
The Richardson number is an indicator for atmospheric stability and the occurrence of turbulence. It expresses the ratio of buoyant consumption vs. mechanical (shear) production of turbulence (Stull, 1988). The gradient Richardson number (Rig) was calculated from average diel wind and temperature data for both observation periods. Observations at various measurement heights were interpolated with a logarithmic function to obtain continuous gradients (measurement heights above ground level were in 2012: 4, 36, 46, 81 m for wind data and 0.4, 1.5, 4.4, 12, 26, 36, 55, 73 m for temperature data; in 2015: 14, 22, 40, 55, 81 m for wind data and 0.51, 1.67, 4.4, 26, 36, 40, 73 m for temperature data). Rig was then calculated for each hour of the day in 1 m height resolution from 20 m up to 80 m using the following equation (e.g., Stull, 1988):
where g is the acceleration due to gravity (9.81 m s−2), θv is the virtual potential temperature (K), z the height above ground level (m), and u and v the wind vectors (m s−1) in the x and y direction, respectively.
A second variable of interest is the atmospheric boundary layer (ABL) height, since this determines the depth over which emitted species will be mixed. To assess the potential impact of ABL dynamics, the MXL/MESSy model (Janssen and Pozzer, 2015) was used to investigate two case study days (November 22, 2015 and November 10, 2012). The MXL model has been shown before to reproduce tropical boundary layer dynamics well in comparison with a turbulence resolving large eddy simulation (Vilà-Guerau de Arellano et al., 2011) and in comparison with ABL height as observed by Lidar (Janssen et al., 2013). Observations of surface sensible and latent heat fluxes, potential temperature and specific moisture were used to constrain the simulated boundary layer development. Additionally, ABL height observations were available for 2015. For both years, a subsidence rate of 3·10−5 s−1 was applied to account for large-scale downward vertical motions.
Results and Discussion
OH Reactivity During El Niño Compared to an ENSO-Neutral Period
A comparison of diel (24 h) temperature and humidity cycles between a November under strong El Niño influence (2015) and an ENSO-neutral November (2012) is shown in Figure 3A. The El Niño period was hotter and less humid than a “usual” dry season. Maximum temperatures of the day (from 1 min diel medians of the 2015 measurement period) reached up to 34.4°C, compared to 32.2 °C in 2012. The lowest median relative humidity of the day (from 1 min medians) during the 2015 measurement period was 47.8% (2012: 62.4%). This corresponds to a difference in average absolute humidity of 17% (21.4 g m−3 in 2012, 18.3 g m−3 in 2015). The El-Niño-attributed extreme drought was also reflected in soil water content, which was reduced by 20–25% with 0.149 ± 0.003 m3 m−3 (average ± standard deviation for November 2015) compared to 0.184 ± 0.008 m3 m−3 in ENSO-neutral November 2014 (used here because of data unavailability for 2012). The unusually dry and hot conditions at the ATTO site reflect general observations of the Amazon basin and the whole of South America for the 2015/16 El Niño (Jiménez-Muñoz et al., 2016; Erfanian et al., 2017; Yang et al., 2018).
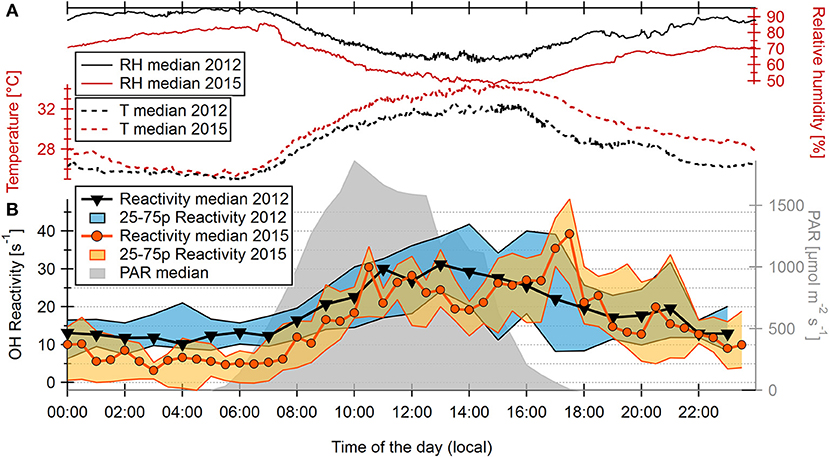
Figure 3. (A) Median diel cycles of relative humidity and temperature for measurement periods in November 2012 and November 2015. (B) Diel medians of OH reactivity for Nov 2012 (hourly) and Nov 2015 (half-hourly), and photosynthetic active radiation (PAR) for Nov 2015 measured at 41 m height above ground level. The shaded areas depict 25–75th percentiles of OH reactivity.
Diel cycles of OH reactivity measured above the forest canopy (at 41 m height above ground level) were compared between November 2012 and November 2015 (Figure 3B). Photosynthetic active radiation (PAR) measurements show that sunrise and sunset occurred at ca. 5:30 and 18:00 LT (local time, i.e., UTC-4), respectively. For most of the day, the OH reactivity pattern in the respective measurement periods was very similar. Nighttime OH reactivity was low, often close to the detection limit of 4.2 s−1. Due to the larger uncertainty of low reactivity values (see Supplementary Figure 4), nighttime and early morning differences between the 2012 and 2015 diel cycles can be considered as insignificant. Both cycles showed a maximum at noon of on average 27.0 ± 14.2 s−1 (2015) and 36.4 ± 22.1 s−1 (2012) with very similar respective medians of 28.1 s−1 (2015) and 26.8 s−1 (2012). A striking difference, however, was that the averages and medians of 13 days of OH reactivity in 2015 showed a second, and higher, maximum around the time of sunset (35.2 ± 14.5 s−1, compared to 27.4 ± 18.8 s−1 in 2012 / medians: 36.5 s−1 (2015) and 22.0 s−1 in 2012 at 17:00 LT). A less distinct sunset increase is also indicated in the 75th percentile of the 2012 data, but for that year the median was decreasing as one would expect when night falls and photosynthetic activity of the plants declines. In contrast to the diel pattern, the absolute daytime OH reactivity did not differ significantly between both observation periods: Average OH reactivity values above the LOD of 10 days between 6:00 and 19:00 LT were 24.3 ± 14.5 s−1 in 2012, compared to 24.6 ± 11.9 s−1 in 2015. The hour from 18:00 till 19:00 was included here into “daytime” values, because the evening OH reactivity maximum under El Niño influence sometimes remained until 18:30.
Only a few VOC species were measured in 2015 because the campaign was focused on fast response measurements of isoprene. Therefore, total OH reactivity can only be compared with the reactivity of isoprene, the sum of three isoprene oxidation products (MVK/MACR/ISOPOOH, m/z = 71), NOx, and CO (Figure 4), methane, and ozone (not displayed due to insignificant contribution to OH reactivity, see Supplementary Table 1). Isoprene and isoprene oxidation products have been reported to be the main known contributors to OH reactivity at the ATTO site, however with average unexplained fractions of 49% in the wet season and 79% in the dry season (Nölscher et al., 2016). In 2015, isoprene levels were similar as reported previously by Nölscher et al. (2016, for 2012) and Yáñez-Serrano et al. (2015). Although NOx did not contribute significant amounts of OH reactivity at any time (maximum: 0.48 s−1), a higher number of forest fires during the El Niño influenced period compared to other dry seasons (Aragão et al., 2018) was visible in NO mixing ratios. Indeed they were four times as high as in an ENSO neutral November (here: 2013 due to data unavailability in 2012) with an average of 0.061 ± 0.068 ppbv in November 2015 and of 0.014 ± 0.078 ppbv in November 2013. Long-term measurements of NOx at the site until 2015 never exceeded 2 ppb, with median values consistently below 250 ppt (Wolff, 2015). The high NOx values observed in November 2015 with peak values of 2.1 ppb demonstrate the exceptional conditions caused by the strong El Niño event.
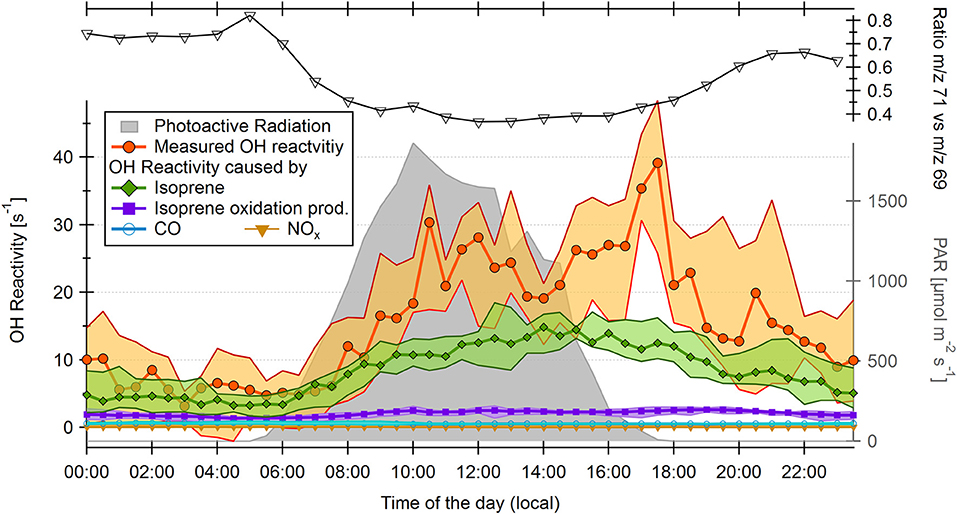
Figure 4. Diel half-hourly medians over 13 days of measurements in November 2015 for calculated OH reactivity of isoprene, isoprene oxidation products, NOx and CO, diel medians of measured OH reactivity; and hourly medians of the isoprene oxidation product vs. isoprene ratio. Filled areas represent the 25–75th percentiles of data. Not depicted: contributions of ozone (max. 0.05 s−1), and methane (max. 0.22 s−1). Photosynthetic active radiation (PAR) is displayed on the right axis (half-hourly medians).
The total OH reactivity time series (Supplementary Figure 5) shows that except for 2 days within the measurement period, the daily reactivity maximum in 2015 was observed during or shortly after sunset. The 2 days where this effect was not visible were each preceded by a day with ambient relative humidity above 95%. During the rest of the El Niño influenced observation period, relative humidity always remained below 95%, which indicates that the evening OH reactivity maximum may be related to dry conditions. From the data collected by the VOC-PTRMS running in parallel, it is possible to calculate the theoretical OH reactivity contributed to measured total OH reactivity by isoprene and its oxidation products (Figure 4). Isoprene accounted for most of the OH reactivity during most of the day (e.g., 78% on average at 14:00 LT), but on average only for 33% during the unusual increase at sunset (17:00 LT). Isoprene oxidation products accounted for up to 20% (19:30 LT), CO for up to 11% (5:00 LT) of OH reactivity (Figure 4). The unexplained (“missing”) fraction of total OH reactivity was largest at 17:30 LT (60% on average). The isoprene flux (Figure 5) followed PAR and temperature, as expected. However, it persisted, albeit weakly, until 18:30 LT. As plants continued to emit isoprene, other biogenic emissions might as well have continued during sunset and contributed to unexplained OH reactivity.
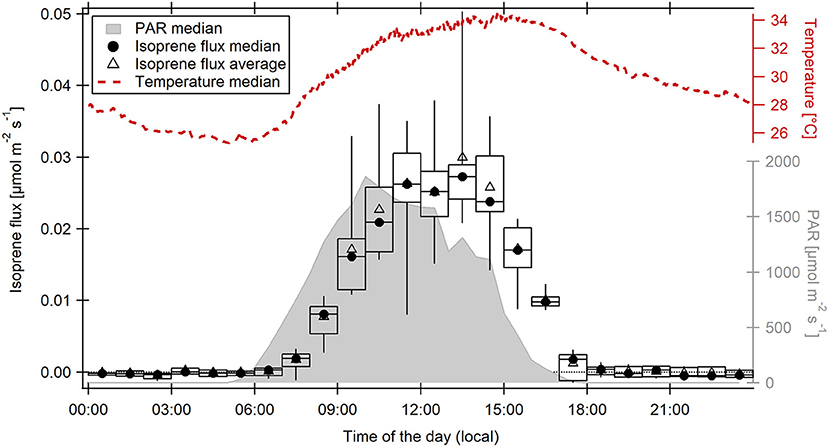
Figure 5. Diel hourly averages and medians of isoprene fluxes measured at 41 m above ground level at the ATTO site between November 11 and 23, 2015. Boxes and whiskers represent the 25–75th and 5–95th percentiles, respectively. The diel medians of photosynthetic active radiation (PAR) and ambient temperature measured at the same height are displayed on the right axes.
The isoprene oxidation product-to-isoprene ratio is generally higher in the dry season than in the wet season, but in November 2015 (ca. 0.4 at 12–15:00 LT, Figure 4) it was higher than reported for the dry seasons in 2013 (Yáñez-Serrano et al., 2015) or in 2001 (Kuhn et al., 2007), with values below 0.4 in both cases. This means that the even drier conditions during the strong El Niño period could have caused a higher oxidative efficiency than during average dry seasons. Part of the unexplained evening reactivity might stem from elevated values of oxidized VOCs other than MVK/ methacrolein/ ISOPOOH.
Possible Influence of Turbulent Transport
Another potential reason for the shift of the diel OH reactivity maximum could be a change in turbulent transport of reactive species from the canopy below or from the boundary layer above the point of observation. Especially below the canopy, soil, and underwood emissions could contain highly reactive species (Nölscher et al., 2016). Indeed it has been recently reported that strong emissions of sesquiterpenes from the forest floor occur under drier conditions (Bourtsoukidis et al., 2018).
To assess the stability of the canopy and surface layer, the potential temperature profiles of November 2012 and 2015 were compared (Figure 6). Overall, the structure of both profiles is similar; with the El Niño influenced profile shifted to higher temperatures and with less pronounced gradients. However, in 2012 an inversion is present during the daytime hours at a height of 1.5 m, which caps a stably stratified layer just above the forest floor. These stable conditions close to the ground surface suggest that emissions of reactive species from the soil may not have been transported upwards through and out of the canopy. Such thermal stratification of the lower canopy has been observed in Amazonian forests before and could be related to absorption of radiation by the upper canopy (Kruijt et al., 2000; Andreae et al., 2015; Gerken et al., 2017; Santana et al., 2018). In 2015, net radiation measured at the ATTO site was on average ≈100 W m−2 higher than in 2012, which may have facilitated penetration of radiation further into the canopy and hence the break-up of the inversion (Figure 6). In addition, wind shear in the canopy was higher in 2015 than in 2012 (Supplementary Figure 6), which could also have contributed to the generation of turbulence and transport away from the forest floor (Santana et al., 2018). As a result, a larger part of unexplained daytime OH reactivity during the El Nino event might stem from soil emissions than in 2012.
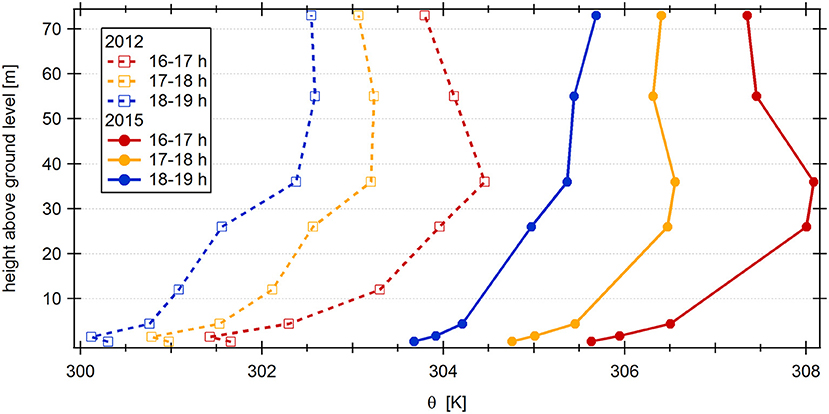
Figure 6. Vertical potential temperature profiles between forest floor and 73 m height above ground level for November 2012 and November 2015. Three different profiles represent temporal variation for the evening hours (local time).
Average diel gradient Richardson number patterns derived from meteorological measurements are displayed for November 2015 and November 2012 in Figure 7. It is visible that turbulent conditions above and inside the canopy (Rig < 0.25) persisted longer in the evening in 2015. Between 17:00 and 18:00 LT, the conditions for vertical transport were far less favorable in 2012 than in 2015, when canopy emissions were likely transported up to 41 m. Consequently, the observed sunset increase in OH reactivity might be related to this turbulent transport. However, the peak OH reactivity being not reflected in isoprene mixing ratios, additional change in biogenic emissions has to be considered.
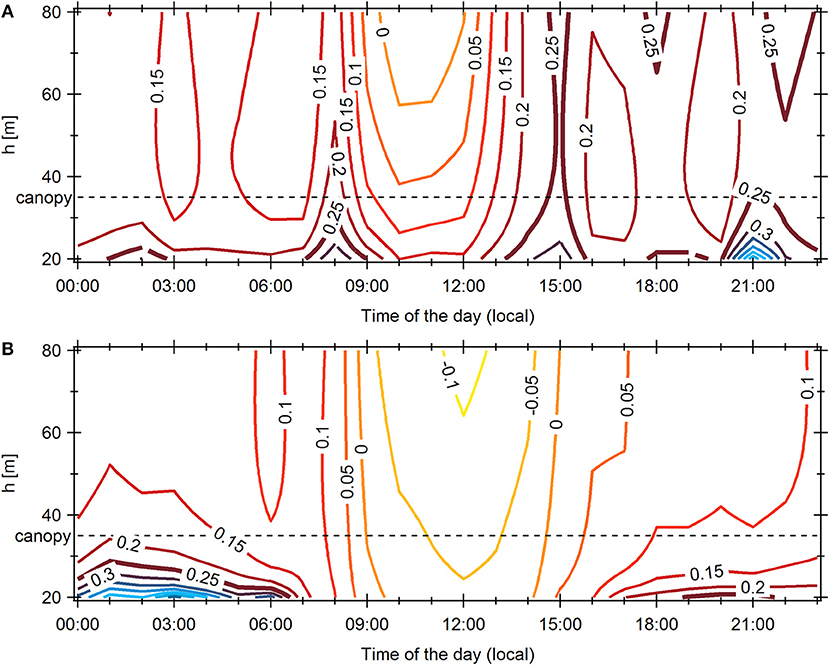
Figure 7. Diel patterns of gradient Richardson numbers from 20 to 80 m height above ground level for (A) November 2012 and (B) November 2015. The critical Richardson number (0.25) is indicated with a thicker line. The dashed line represents canopy top (35 m).
For a closer investigation of the boundary layer dynamics, the MXL/MESSy boundary layer model was run for two case study days (November 22, 2015 and November 10, 2012, Supplementary Figures 7, 8; note that the boundary layer model is not suitable for representing the nocturnal boundary layer and therefore the simulations end at 17:00). As shown in Supplementary Figure 8 in comparison with observations, MXL captures the diurnal variability of the ABL for the 2015 case well-until about 14:00 LT. After 14:00 LT, other factors like cloud formation (which are not included in the model) could have impacted boundary layer depth. ABL height observations were not available for 2012. What can be inferred, however, is that the lower surface forcing (sensible heat flux) in 2012 led to a lower boundary layer in 2012, assuming that other forcings (e.g., subsidence) were equal to the 2015 case. The shape of the modeled daytime boundary layer development did not differ much between 2012 and 2015, with ABL height peaking around 14:30 LT for both years. The simulated maximum ABL height is about 200 m higher in 2015 than in 2012, because of higher sensible heat fluxes. This means that reactive species which are emitted from the canopy during daytime were mixed over a deeper layer under the 2015 conditions and more diluted by entrainment of cleaner air from aloft, which should in principle cause lower reactivities. However, this did not lead to significant differences in overall daytime reactivity between the 2 years, possibly because higher emissions balanced the higher dilution.
Possible Influence of Plants' Emission Behavior
Stomatal or Non-stomatal BVOC Release?
Persisting isoprene emission fluxes until after 18:00 LT (Figure 5) indicate the possibility of continuing BVOC emissions as a reason for the evening OH reactivity maximum under El Niño conditions. Plant volatiles can be released from the leaf tissue either under stomatal control or without. The pathway depends on localization and physicochemical nature of the VOC species (Niinemets et al., 2004; Harley, 2013). In order to explore a possible drought stress-related difference in plants' emission behavior as a reason for the shift of diel OH reactivity maxima between an El Niño and an ENSO-neutral November, canopy stomatal conductance was derived from water fluxes, air temperature, and humidity measured in November 2015. As expected, canopy stomatal conductance increased at sunrise (between 5:00 and 6:00 LT), associated with BVOC release reflected in increasing OH reactivity (Figure 8). When temperatures had increased to a level that water loss via the stomata would become unfavorably large, conductance decreased (around 10:00 LT) and did not increase again until the next morning. This diel cycle shows the same pattern as in studies of stomatal conductance of tropical trees such as Dolman et al. (1991) and Granier et al. (1992), even though the approach applied here is more indirect. Diel medians of canopy stomatal conductance did not increase significantly at 17:00–17:30 LT, when OH reactivity was in its maximum. Santos et al. (2018) showed that drought during the 2015 El Niño decreased average stomatal conductance in an Amazon forest. Therefore, the release of unmeasured compounds responsible for the OH reactivity increase most likely was not affected by plants' stomata.
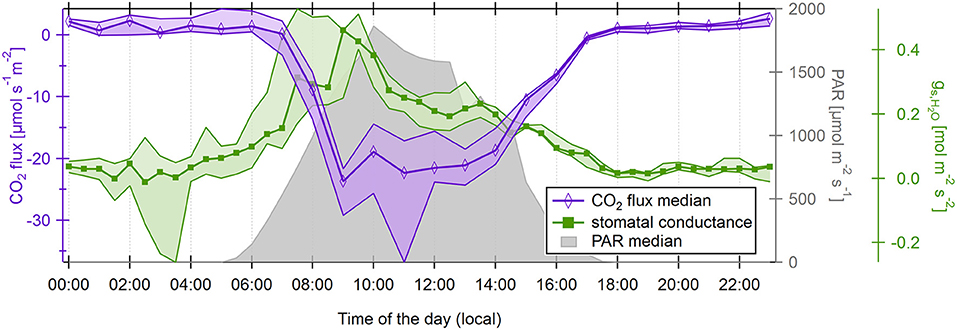
Figure 8. Diel half-hourly medians and 25–75th percentiles (shaded areas) of canopy stomatal conductance at 26 m (inside canopy), and of CO2 flux at 41 m height above ground level. The diel cycle of photosynthetic active radiation is displayed as gray shades.
For BVOCs that are not stored in specialized storage compartments of the leaf, release from plants independent of stomatal control has been reported especially for isoprene (Fall and Monson, 1992) and monoterpenes (Loreto et al., 1996). Niinemets and Reichstein (2002) found that β-ocimene and limonene emissions were unaffected by stomatal closure (in contrast to oxygenated monoterpenes). A general overview has been reported by Niinemets et al. (2004). In the absence of stomatal opening during the evening hours, such an emission mechanism independent of stomatal conductance could be responsible for the OH reactivity maximum seen at sunset under extremely dry conditions at the ATTO site. As isoprene was among the measured species and can only to a small extent explain total OH reactivity, one group of compounds that is likely to be at least partly responsible is monoterpenes. Monoterpenes were not monitored during the observation period described here, but 1 month prior to the El Niño influenced campaign (see section Monoterpene emissions). The decrease of ambient temperature at the end of the day started ca. 1 h later in 2015 than in 2012 (Figure 3). This means that the build-up of temperature-related VOCs such as monoterpenes might have lasted longer than usual. OH radical formation is dependent on sunlight. Therefore, during the sunset hour, the most important sink of BVOCs was decreasing rapidly and additionally released BVOCs were more likely to accumulate in the atmosphere. As discussed in 3.2, these emissions were more efficiently transported out of the canopy up to the point of observation than in 2012.
Monoterpene Emissions
VOC data acquired at the ATTO site in October 2015, 1 month before our campaign, show (1) higher monoterpene emissions than in other dry seasons (Yáñez-Serrano et al., 2018) and (2) a second monoterpene maximum at sunset (Figure 9). October 2015 was already influenced by El Niño, but it was less dry and hot than November. Average temperatures were 0.6°C lower, average RH was 5.7% higher. In the monoterpene time series (Supplementary Figure 9), a tendency toward higher monoterpene emissions is visible on drier and warmer days. Biogenic monoterpene emissions are well-known to be promoted by elevated temperatures (e.g., Guenther et al., 1993). At high temperatures, monoterpene emissions can be uncoupled from NPP (Jardine et al., 2017). Based on these observations, we speculate that it is very likely that monoterpene emissions during the exceptionally warm conditions in November 2015 were even higher than in October 2015. Using the emission factors for evergreen tropical broadleaf plants trees from Guenther et al. (2012) and the G93 equation for monoterpene emissions from Guenther et al. (1993), we estimate that the temperature increase for 17:00 LT of ca. 2.5°C in November 2015 compared to October 2015 could have caused ca. 28% higher monoterpene emissions.
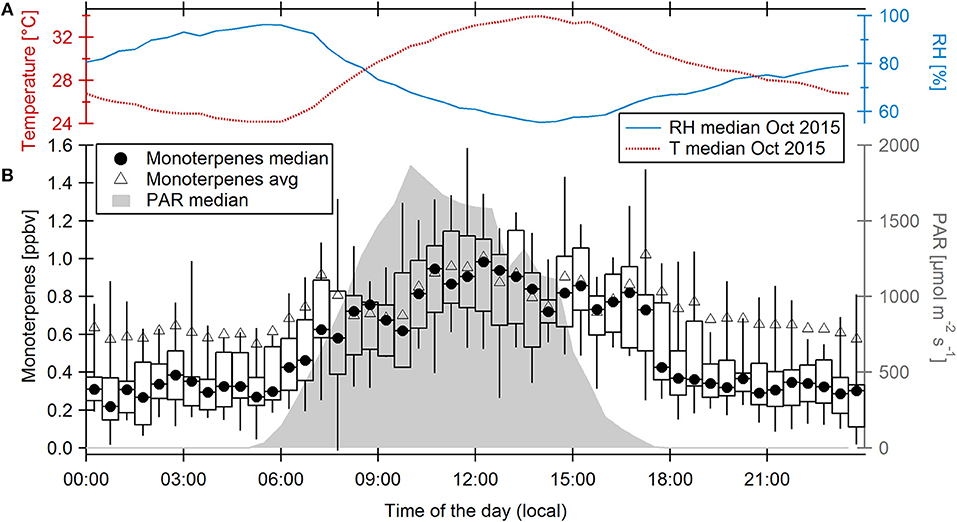
Figure 9. (A) Diel cycles of temperature and relative humidity measured at 41 m above ground level in October 2015. (B) Diel cycle of ambient monoterpene mixing ratios measured at 38 m above ground level during 12 days in October 2015 showing half-hourly monoterpene medians (circles) and averages (triangles). Boxes and whiskers represent the 25–75th and 5–95th percentiles, respectively. The diel cycle of photosynthetic active radiation (PAR) is displayed on the right axis.
In November 2015 at the ATTO site, maximum leaf surface temperatures at the top of the canopy reached up to 42.6°C (11:00 LT). In an ENSO-neutral November (due to data availability here November 2014), the maximum was 4.0°C lower and average leaf temperatures at 17:00 LT were 3.9°C lower than in 2015. Interestingly, Jardine et al. (2017) reported a dependence of monoterpene speciation in the Amazon region on leaf temperature. They found that extreme heat in 2015/16 triggered a shift of plant emissions toward more reactive monoterpenes such as β-ocimene, which is ≈ 100 times more reactive toward OH than the usually predominant α-pinene. Estimating a 28% increase of monoterpene mixing ratios at 17:00 LT, an OH reactivity of up to 7.8 s−1 if dominated by β-ocimene (4.8 s−1 when assuming a speciation as observed by Jardine et al., 2017) could be explained by monoterpenes, which is 22% of total OH reactivity and more than one third of the unexplained (“missing”) fraction.
Among other purposes, monoterpenes are thought to serve plants in stress relief, e.g., as antioxidants against elevated levels of cell-damaging reactive oxygen species and ozone (Loreto et al., 2004). Ozone levels at the ATTO site were on average 69% higher in November 2015 (16.7 ± 6.6 ppbv) than in November 2012 (9.9 ± 4.3 ppbv), with respective maxima of 40.6 ppbv in 2015 and of 20.5 ppbv in 2012. This difference can be attributed to a larger number of and more closely located forest fires [Aragão et al., 2018, and represented in elevated NOx values (see section OH reactivity during El Niño compared to an ENSO-neutral period)]. The ozone maximum occurred between 15:00 and 18:00 LT (Figure 10). It might have induced an oxidant stress reaction in plants which is reflected in higher monoterpene emissions. Moreover, due to the low OH concentration normally present at dusk being further suppressed by high OH reactivity, and the higher ozone levels at the same time, enhanced ozone-terpene reactions at the end of the day will lead to more efficient SOA formation. Reactions of the predominant terpene at the site (α-pinene) with ozone produce more particles than with OH (Griffin et al., 1999; Bonn and Moorgat, 2002; Jokinen et al., 2015). SOA formation is additionally furthered by a high VOC/NOx ratio (Donahue et al., 2005; Presto et al., 2005) as it is observed in the tropical forest. A fraction of the SOA will become cloud condensation nuclei (CCN). We therefore tentatively speculate this may represent a possible could formation feedback.
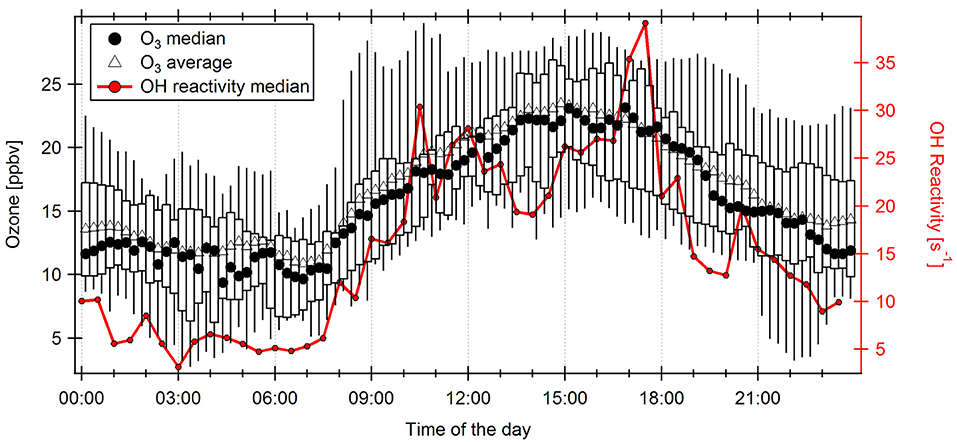
Figure 10. Quarter-hourly diel cycle of Ozone measured at 38 m height above ground level in November 2015 with medians (circles) and averages (triangles). Boxes and whiskers represent the 25–75th and 5–95th percentiles, respectively. The half-hourly median diel cycle of OH reactivity is displayed on the right axis.
In addition to the temperature and ozone effects, drought stress has been reported to enhance monoterpene emissions in several different plant species (Ormeno et al., 2007; Llusià et al., 2008; Blanch et al., 2009; Šimpraga et al., 2011). However, in some other studies drought had the opposite effect (e.g., Bourtsoukidis et al., 2014; Llusia et al., 2016; Lüpke et al., 2016; Saunier et al., 2017). Some species even show a trade-off between isoprene and monoterpenes: isoprene emissions can be reduced in favor of monoterpene emissions (Harrison et al., 2013).
Not much is known about the effect of combined multiple stress factors on plants' VOC emission behavior, although this is what usually occurs in nature (e.g., in this study a combination of water deficit, heat, and 69% higher ozone levels). However, Holopainen and Gershenzon (2010) suggest an additive effect of multiple abiotic stresses on BVOC emissions. We therefore conclude that the largely unexplained OH reactivity maximum observed during the sunset hours in 2015 could to some extent be explained by higher and more reactive monoterpene emissions from vegetation due to a combination of factors: Higher temperatures that decreased later in the course of the day, water deficit and ozone stress, combined with more efficient transport.
The 66% increase of OH reactivity seen at 17:00 LT in 2015 compared to 2012 (+ 14.5 s−1) would equal, depending on the compounds, an equivalent of several ppbv of unmeasured VOCs (e.g., ca. 2 ppbv of β-ocimene). 2 ppbv is within the variability of the ozone diel cycle (Figure 10), meaning that, based on ozone mixing ratios, a release of monoterpenes, or other compounds that react quickly with ozone cannot be ruled out.
Other Stress-Induced BVOC Emissions
Assuming non-stomatal release and build-up of monoterpenes as a potential cause of the high OH reactivity at sunset, stress factors may have induced the release of other reactive BVOCs alongside with monoterpenes. Water deficit stress is known to alter plants' mesophyll chemistry for maintaining osmotic potential (Ruehr et al., 2009) and can modify their BVOC composition and emission behavior. Drought stress is able to induce new emissions (Niinemets, 2010). For example, Šimpraga et al. (2011) found a burst of an unidentified green-leaf volatile associated with acute water deficit in beech trees.
Apart from triggering monoterpene emissions (see above), ozone can induce the release of additional BVOCs. For example, Bison et al. (2018) observed sesquiterpene emissions, which had not been there without ozone stress, after the Brazilian tropical tree species Croton floribundus was exposed to high ozone levels. Ozone-driven sesquiterpene emissions have been observed in other species as well (e.g., Bourtsoukidis et al., 2012).
O'Connell et al. (2018) report that drought had a more severe influence on biogeochemical cycles in tropical forest soils than previously thought, in particular concentrations of inorganic phosphorous (which usually is a limiting factor in tropical forest net primary productivity) were decreased, and organic phosphorous concentrations increased. Drought-impacted soil chemistry (e.g., changed nutrient availability) could therefore strongly influence plants. Nutrient availability might also affect VOC emission from soils, which may be highly relevant considering a recent report about significant sesquiterpene release from soil (Bourtsoukidis et al., 2018).
The 2015 OH reactivity maximum occurred during the light-dark transition of sunset. Several studies have shown VOC bursts of isoprene, acetaldehyde, and/or (stress-related) green-leaf volatiles after light-dark transitions (Karl et al., 2002; Graus et al., 2004; Hayward et al., 2004; Brilli et al., 2011; Jardine et al., 2012; Jud et al., 2016). These so-called “post-illumination bursts” are thought to be associated with fast changes in intracellular pH in fast light-to-dark-transitions (Brilli et al., 2011), a “pyruvate overflow mechanism” (Karl et al., 2002; Hayward et al., 2004), or a “pyruvate dehydrogenase bypass pathway” (Jardine et al., 2012). However, Jud et al. (2016) reported that acute drought stress lead to a disappearance of the “post-illumination bursts.” Only when recovering from stress, green-leaf volatiles were enhanced after the light-to-dark transition. Moreover, these bursts have only been observed under laboratory conditions. In a forest, illumination changes gradually and differently for every single leaf.
Green-leaf volatiles (GLVs) and sesquiterpenes are highly reactive toward the OH radical. If drought and/or ozone stress induced their release from vegetation alongside with monoterpenes, they might explain part of the unexplained OH reactivity. Courtois et al. (2009) observed 264 stress-related VOCs emitted by tropical trees, amongst which there were 137 different sesquiterpenes and 13 GLVs. Applying an average of known literature reaction rate coefficients of sesquiterpenes and GLVs with OH (kX+OH = 9.71 × 10⁻¹¹ cm3 molecule−1 s−1), an average of 40 pptv of each of the 137 sesquiterpenes and 13 GLVs would be sufficient to explain the 14.5 s−1 increase in total OH reactivity seen at 17:00 LT in 2015 compared to 2012.
Summary and Conclusions
Influence of Extreme Drought and High Temperature Conditions on the Diel Cycle of OH Reactivity
The diel cycle of total OH reactivity in November 2015 exhibits two maxima—one around noon, and a second, higher one, in the sunset phase of the day, which is only by 40% explained by the measured VOC species. This is in contrast to the diel cycle in November 2012, where only one maximum occurred around noon. The absolute amount of OH reactivity over the course of the day did not differ significantly between both observation periods, contradicting our initial hypothesis that drought stress would increase total OH reactivity.
The difference in diel behavior is attributed to extreme warming and drought linked to the 2015/16 El Niño event, reflected in lower soil and ambient humidities, and a higher number of regional forest fires. In the evening hours, less stable conditions inside and above the canopy favored air transport to 41 m (observation height). Additionally, we conclude that a combination of factors lead to higher, probably non-stomatal, emissions of unmeasured BVOCs during the El Niño period which, transported above the canopy by turbulence, resulted in a sunset maximum in OH reactivity. The key factors identified are:
a) The temperature decrease at the end of the day began 1 h later in November 2015, which suggests that temperature-related BVOCs such as monoterpenes were still released during the sunset hour, while their most important sink (OH radicals) was already decreasing.
b) Temperature levels were generally elevated in comparison to other dry seasons, causing above-normal emissions of monoterpenes and, potentially, other BVOCs.
c) Monoterpene speciation in the emissions was probably shifted toward more reactive species, such as β-ocimene, due to the high temperatures.
d) Drought stress might have induced additional emissions of monoterpenes and/or other BVOCs associated with maintaining osmotic pressure and/or antioxidant purposes in the evening hours.
e) A higher number of forest fires prompted elevated ozone levels (+ 69%) especially in the afternoon/evening, with possible oxidant stress implications for plants. Monoterpenes, sesquiterpenes, and/or green-leaf volatiles may have been released to mitigate this stress.
Implications for an Amazon Rainforest Subject to Future Global Change
Under stress such as elevated temperatures and water deficit, up to 10–67% of NPP by land plants is thought to be allocated to BVOCs (Sharkey and Loreto, 1993; Peñuelas, 2003). This poses a challenge to carbon cycle closure. The observations presented in this study have implications for future Amazon rainforest carbon balance and air chemistry, because it is expected that the frequency of strong El Niño events will increase due to climate change (Timmermann et al., 1999; Cai et al., 2015), and the expanding anthropogenic deforestation exacerbates precipitation deficits and warming in the Amazon region (Zeng et al., 1996; Baidya Roy, 2002; Swann et al., 2015; Alkama and Cescatti, 2016; Zemp et al., 2017). Therefore, it can be expected that warming and drought events like the one in 2015/16 will occur more often in the Amazon region (Marengo and Espinoza, 2016). Such periods of continuous elevated stress levels (oxidative, thermal, drought) generally result in a shift of the Amazon ecosystem from sink to source of atmospheric carbon (Metcalfe et al., 2010; Brienen et al., 2015; van der Laan-Luijkx et al., 2015; Feldpausch et al., 2016)—one of the reasons being elevated emissions of stress-mitigating BVOCs. With total OH reactivity observations, we show that, although the total sum of daytime OH reactivity was not altered, the diel cycle and amount of VOC mixing ratios as well as the diel cycle of the size of the OH sink did change in a rainforest under drought and heat stress. This change in the timing of the release of ambient OH reactivity can potentially impact atmospheric chemistry above the Amazon rainforest with subsequent implications for, amongst others, atmospheric oxidation capacity, photochemistry, and SOA formation. The increase of OH reactivity above the canopy at the end of the day would tend to favor terpene-ozone over terpene-OH reactions. This is because OH radical concentrations decrease with fading sunlight. Terpene-ozone reactions are more efficient in SOA production, and therefore potentially elevated CCN formation occurred at the time of nocturnal boundary layer formation. Our findings show that under El Niño conditions, total daytime OH reactivity was equivalent to ENSO-neutral conditions. However, as CO2 uptake by the forest is reduced under drought, heat and oxidative stress, the fraction of carbon uptaken that is released as VOCs has potentially increased. The effect of drought and warming needs more investigation in order to understand how diel rainforest carbon cycles and air chemistry will be modified under future climate change.
Plants emit more than 30,000 VOCs (Harley, 2013), and most studies of tropical forest VOCs have so far only focused on few of them. Often, compounds of very low concentration can be chemically highly important due to their high reactivity (Yáñez-Serrano et al., 2018). For a complete understanding of rainforest atmospheric chemistry and to close the gap of unidentified (“missing”) OH reactivity (Nölscher et al., 2016), more VOCs should be taken into account in future studies.
Data Availability Statement
The raw data supporting the conclusions of this manuscript will be made available by the authors, without undue reservation, to any qualified researcher. The OH reactivity dataset will be made available on https://www.attodata.org/.
Author Contributions
AN, AY-S, EB, SK, and JW performed CRM and VOC measurements. SW, AT, MS, DW, and JL contributed inorganic trace gas/greenhouse gas measurements and part of the micrometeorological data. AT calculated flux data. MOS and AA were responsible for meteorological measurements and data. RJ designed the meteorological model and contributed to meteorological data analysis. CD-J analyzed the boundary layer height observations. JK contributed the canopy stomatal conductance approach. EP performed the data analysis and wrote the first draft of the manuscript. All authors contributed to manuscript writing and revision, read and approved the submitted version.
Funding
We acknowledge the support by the German Federal Ministry of Education and Research (BMBF contract 01LB1001A and 01LK1602B) and the Brazilian Ministério da Ciência, Tecnologia e Inovação (MCTI/FINEP contract 01.11.01248.00) as well as the Amazon State University (UEA), FAPESP, CNPq, FAPEAM, LBA/INPA, and SDS/CEUC/RDS-Uatumã.
Conflict of Interest Statement
The authors declare that the research was conducted in the absence of any commercial or financial relationships that could be construed as a potential conflict of interest.
Acknowledgments
The authors thank the Max Planck Society and the Instituto Nacional de Pesquisas da Amazônia for continuous support in establishing the ATTO tower. Especially acknowledged are the contributions for technical and logistical support (in particular Reiner Ditz and Hermes Braga Xavier). Thanks to Thomas Klüpfel for help with CRM and PTRMS measurements, and to Christopher Pöhlker, Florian Ditas and Daniel Moran-Zuloaga for ceilometer measurements. We would like to express our gratitude to Rodrigo Souza for providing an ozone monitor and to Rosa dos Santos for radiosonde measurements.
Supplementary Material
The Supplementary Material for this article can be found online at: https://www.frontiersin.org/articles/10.3389/ffgc.2018.00012/full#supplementary-material
References
Alkama, R., and Cescatti, A. (2016). Biophysical climate impacts of recent changes in global forest cover. Science 351, 600–604. doi: 10.1126/science.aac8083
Andreae, M. O., Acevedo, O. C., Araùjo, A., Artaxo, P., Barbosa, C. G. G., Barbosa, H. M. J., et al. (2015). The Amazon Tall Tower Observatory (ATTO): overview of pilot measurements on ecosystem ecology, meteorology, trace gases, and aerosols. Atmos. Chem. Phys. 15, 10723–10776. doi: 10.5194/acp-15-10723-2015
Aragão, L. E. O. C., Anderson, L. O., Fonseca, M. G., Rosan, T. M., Vedovato, L. B., Wagner, F. H., et al. (2018). 21st Century drought-related fires counteract the decline of Amazon deforestation carbon emissions. Nat. Commun. 9:536. doi: 10.1038/s41467-017-02771-y
Aragão, L. E. O. C., Poulter, B., Barlow, J. B., Anderson, L. O., Malhi, Y., Saatchi, S., et al. (2014). Environmental change and the carbon balance of Amazonian forests. Biol. Rev. Cambridge Philos. Soc. 89, 913–931. doi: 10.1111/brv.12088
Arneth, A., Harrison, S. P., Zaehle, S., Tsigaridis, K., Menon, S., Bartlein, P. J., et al. (2010). Terrestrial biogeochemical feedbacks in the climate system. Nat. Geosci. 3, 525–532. doi: 10.1038/ngeo905
Baidya Roy, S. (2002). Impact of land use/land cover change on regional hydrometeorology in Amazonia. J. Geophys. Res. 107:3751. doi: 10.1029/2000JD000266
Ball, J. T. (1987). “Calculations related to gas exchange,” in Stomatal Function, ed E. Zeiger (Stanford, CA: Stanford Univ. Press), 445–467.
Bar-On, Y. M., Phillips, R., and Milo, R. (2018). The biomass distribution on Earth. Proc. Natl. Acad. Sci. U.S.A. 115, 6506–6511. doi: 10.1073/pnas.1711842115
Bison, J. V., Cardoso-Gustavson, P., Moraes, R. M., da Silva Pedrosa, G., Cruz, L. S., Freschi, L., et al. (2018). Volatile organic compounds and nitric oxide as responses of a Brazilian tropical species to ozone: the emission profile of young and mature leaves. Environ. Sci. Pollut. Res. Int. 25, 3840–3848. doi: 10.1007/s11356-017-0744-1
Blanch, J. S., Peñuelas, J., Sardans, J., and Llusià, J. (2009). Drought, warming and soil fertilization effects on leaf volatile terpene concentrations in Pinus halepensis and Quercus ilex. Acta Physiol. Plant. 31, 207–218. doi: 10.1007/s11738-008-0221-z
Bonn, B., and Moorgat, G. K. (2002). New particle formation during a- and b-pinene oxidation by O3, OH and NO3, and the influence of water vapour: particle size distribution studies. Atmos. Chem. Phys. 2, 183–196. doi: 10.5194/acp-2-183-2002
Bourtsoukidis, E., Behrendt, T., Yañez-Serrano, A. M., Hellén, H., Diamantopoulos, E., Catão, E., et al. (2018). Strong sesquiterpene emissions from Amazonian soils. Nat. Commun. 9:2226. doi: 10.1038/s41467-018-04658-y
Bourtsoukidis, E., Bonn, B., Dittmann, A., Hakola, H., Hellén, H., and Jacobi, S. (2012). Ozone stress as a driving force of sesquiterpene emissions: a suggested parameterisation. Biogeosciences 9, 4337–4352. doi: 10.5194/bg-9-4337-2012
Bourtsoukidis, E., Kawaletz, H., Radacki, D., Schütz, S., Hakola, H., Hellén, H., et al. (2014). Impact of flooding and drought conditions on the emission of volatile organic compounds of Quercus robur and Prunus serotina. Trees 28, 193–204. doi: 10.1007/s00468-013-0942-5
Brienen, R. J. W., Phillips, O. L., Feldpausch, T. R., Gloor, E., Baker, T. R., Lloyd, J., et al. (2015). Long-term decline of the Amazon carbon sink. Nature 519, 344–348. doi: 10.1038/nature14283
Brilli, F., Ruuskanen, T. M., Schnitzhofer, R., Müller, M., Breitenlechner, M., Bittner, V., et al. (2011). Detection of plant volatiles after leaf wounding and darkening by proton transfer reaction “time-of-flight” mass spectrometry (PTR-TOF). PLoS ONE 6:e20419. doi: 10.1371/journal.pone.0020419
Cai, W., Santoso, A., Wang, G., Yeh, S. W., An, S. I., Cobb, K. M., et al. (2015). ENSO and greenhouse warming. Nat. Clim. Change 5, 849–859. doi: 10.1038/nclimate2743
Cernusak, L. A., Ubierna, N., Jenkins, M. W., Garrity, S. R., Rahn, T., Powers, H. H., et al. (2018). Unsaturation of vapour pressure inside leaves of two conifer species. Sci. Rep. 8:7667. doi: 10.1038/s41598-018-25838-2
Chor, T. L., Dias, N. L., Araújo, A., Wolff, S., Zahn, E., Manzi, A., et al. (2017). Flux-variance and flux-gradient relationships in the roughness sublayer over the Amazon forest. Agric. Forest Meteorol. 239, 213–222. doi: 10.1016/j.agrformet.2017.03.009
Courtois, E. A., Paine, C. E. T., Blandinieres, P. A., Stien, D., Bessiere, J. M., Houel, E., et al. (2009). Diversity of the volatile organic compounds emitted by 55 species of tropical trees: a survey in French Guiana. J. Chem. Ecol. 35, 1349–1362. doi: 10.1007/s10886-009-9718-1
Dirzo, R., and Raven, P. H. (2003). Global state of biodiversity and loss. Annu. Rev. Environ. Resour. 28, 137–167. doi: 10.1146/annurev.energy.28.050302.105532
Dolman, A. J., Gash, J. H. C., Roberts, J., and Shuttleworth, W. J. (1991). Stomatal and surface conductance of tropical rainforest. Agric. For. Meteorol. 54, 303–318. doi: 10.1016/0168-1923(91)90011-E
Donahue, N. M., Huff Hartz, K. E., Chuong, B., Presto, A. A., Stanier, C. O., Rosenhørn, T., et al. (2005). Critical factors determining the variation in SOA yields from terpene ozonolysis: a combined experimental and computational study. Faraday Discuss. 130:295–309. doi: 10.1039/b417369d
Ehn, M., Thornton, J. A., Kleist, E., Sipilä, M., Junninen, H., Pullinen, I., et al. (2014). A large source of low-volatility secondary organic aerosol. Nature 506, 476–479. doi: 10.1038/nature13032
Erfanian, A., Wang, G., and Fomenko, L. (2017). Unprecedented drought over tropical South America in 2016: significantly under-predicted by tropical SST. Sci. Rep. 7:5811. doi: 10.1038/s41598-017-05373-2
Fall, R., and Monson, R. K. (1992). Isoprene emission rate and intercellular isoprene concentration as influenced by stomatal distribution and conductance. Plant Physiol. 100, 987–992. doi: 10.1104/pp.100.2.987
Feldpausch, T. R., Phillips, O. L., Brienen, R. J. W., Gloor, E., Lloyd, J., Lopez-Gonzalez, G., et al. (2016). Amazon forest response to repeated droughts. Glob. Biogeochem. Cycles 30, 964–982. doi: 10.1002/2015GB005133
Fuchs, H., Novelli, A., Rolletter, M., Hofzumahaus, A., Pfannerstill, E. Y., Kessel, S., et al. (2017). Comparison of OH reactivity measurements in the atmospheric simulation chamber SAPHIR. Atmos. Meas. Tech. 10, 4023–4053. doi: 10.5194/amt-10-4023-2017
Gerken, T., Chamecki, M., and Fuentes, J. D. (2017). Air-parcel residence times within forest canopies. Bound. Layer Meteorol. 165, 29–54. doi: 10.1007/s10546-017-0269-7
Granier, A., Huc, R., and Colin, F. (1992). Transpiration and stomatal conductance of two rain forest species growing in plantations in French Guyana. Ann. Sci. Forest 49, 17–24. doi: 10.1051/forest:19920102
Graus, M., Schnitzler, J. P., Hansel, A., Cojocariu, C., Rennenberg, H., Wisthaler, A., et al. (2004). Transient release of oxygenated volatile organic compounds during light-dark transitions in Grey poplar leaves. Plant Physiol. 135, 1967–1975. doi: 10.1104/pp.104.043240
Griffin, R. J., Cocker, D. R., Flagan, R. C., and Seinfeld, J. H. (1999). Organic aerosol formation from the oxidation of biogenic hydrocarbons. J. Geophys. Res. 104, 3555–3567. doi: 10.1029/1998JD100049
Guenther, A. B., and Hills, A. J. (1998). Eddy covariance measurement of isoprene fluxes. J. Geophys. Res. 103, 13145–13152. doi: 10.1029/97JD03283
Guenther, A. B., Jiang, X., Heald, C. L., Sakulyanontvittaya, T., Duhl, T., Emmons, L. K., et al. (2012). The model of emissions of gases and aerosols from nature version 2.1 (MEGAN2.1): an extended and updated framework for modeling biogenic emissions. Geosci. Model Dev. 5, 1471–1492. doi: 10.5194/gmd-5-1471-2012
Guenther, A. B., Zimmerman, P. R., Harley, P. C., Monson, R. K., and Fall, R. (1993). Isoprene and monoterpene emission rate variability model evaluations and sensitivity analyses. J. Geophys. Res. 98:12609–12617. doi: 10.1029/93JD00527
Harley, P. C. (2013). “The Roles of Stomatal Conductance and Compound Volatility in Controlling the Emission of Volatile Organic Compounds from Leaves,” in Biology, Controls and Models of Tree Volatile Organic Compound Emissions, eds Ü. Niinemets, and R. K. Monson (Dordrecht, New York, NY: Springer), 181–208.
Harrison, S. P., Morfopoulos, C., Dani, K. G. S., Prentice, I. C., Arneth, A., Atwell, B. J., et al. (2013). Volatile isoprenoid emissions from plastid to planet. New Phytol. 197, 49–57. doi: 10.1111/nph.12021
Hayward, S., Tani, A., Owen, S. M., and Hewitt, C. N. (2004). Online analysis of volatile organic compound emissions from Sitka spruce (Picea sitchensis). Tree Physiol. 24, 721–728. doi: 10.1093/treephys/24.7.721
Holopainen, J. K., and Gershenzon, J. (2010). Multiple stress factors and the emission of plant VOCs. Trends Plant Sci. 15, 176–184. doi: 10.1016/j.tplants.2010.01.006
Holst, T., Arneth, A., Hayward, S., Ekberg, A., Mastepanov, M., Jackowicz-Korczynski, M., et al. (2010). BVOC ecosystem flux measurements at a high latitude wetland site. Atmos. Chem. Phys. 10, 1617–1634. doi: 10.5194/acp-10-1617-2010
Houghton, R. A., Lawrence, K. T., Hackler, J. L., and Brown, S. (2001). The spatial distribution of forest biomass in the Brazilian Amazon: a comparison of estimates. Glob. Change Biol. 7, 731–746. doi: 10.1046/j.1365-2486.2001.00426.x
Intergovernmental Panel on Climate Change (2014). Climate Change 2013 - The Physical Science Basis. Cambridge: Cambridge University Press. doi: 10.1017/CBO9781107415324
Janssen, R. H. H., and Pozzer, A. (2015). Description and implementation of a MiXed Layer model (MXL, v1.0) for the dynamics of the atmospheric boundary layer in the Modular Earth Submodel System (MESSy). Geosci. Model Dev. 8, 453–471. doi: 10.5194/gmd-8-453-2015
Janssen, R. H. H., Vilà-Guerau de Arellano, J., Jimenez, J. L., Ganzeveld, L. N., Robinson, N. H., Allan, J. D., et al. (2013). Influence of boundary layer dynamics and isoprene chemistry on the organic aerosol budget in a tropical forest. J. Geophys. Res. Atmos. 118, 9351–9366. doi: 10.1002/jgrd.50672
Jardine, A. B., Jardine, K. J., Fuentes, J. D., Martin, S. T., Martins, G., Durgante, F., et al. (2015). Highly reactive light-dependent monoterpenes in the Amazon. Geophys. Res. Lett. 42, 1576–1583. doi: 10.1002/2014GL062573
Jardine, K., Barron-Gafford, G. A., Norman, J. P., Abrell, L., Monson, R. K., Meyers, K. T., et al. (2012). Green leaf volatiles and oxygenated metabolite emission bursts from mesquite branches following light-dark transitions. Photosyn. Res. 113, 321–333. doi: 10.1007/s11120-012-9746-5
Jardine, K. J., Jardine, A. B., Holm, J. A., Lombardozzi, D. L., Negron-Juarez, R. I., Martin, S. T., et al. (2017). Monoterpene ‘thermometer' of tropical forest-atmosphere response to climate warming. Plant Cell Environ. 40, 441–452. doi: 10.1111/pce.12879
Jardine, K. J., Meyers, K., Abrell, L., Alves, E. G., Yanez Serrano, A. M., Kesselmeier, J., et al. (2013). Emissions of putative isoprene oxidation products from mango branches under abiotic stress. J. Exp. Bot. 64, 3697–3708. doi: 10.1093/jxb/ert202
Jensen, N. R., Gruening, C., Goded, I., Müller, M., Hjorth, J., and Wisthaler, A. (2018). Eddy-covariance flux measurements in an Italian deciduous forest using PTR-ToF-MS, PTR-QMS and FIS. Int. J. Environ. Anal. Chem. 98, 758–788. doi: 10.1080/03067319.2018.1502758
Jiménez-Muñoz, J. C., Mattar, C., Barichivich, J., Santamaría-Artigas, A., Takahashi, K., Malhi, Y., et al. (2016). Record-breaking warming and extreme drought in the Amazon rainforest during the course of El Niño 2015-2016. Sci. Rep. 6:33130. doi: 10.1038/srep33130
Jokinen, T., Berndt, T., Makkonen, R., Kerminen, V. M., Junninen, H., Paasonen, P., et al. (2015). Production of extremely low volatile organic compounds from biogenic emissions: measured yields and atmospheric implications. Proc. Natl. Acad. Sci. U.S.A. 112, 7123–7128. doi: 10.1073/pnas.1423977112
Jud, W., Vanzo, E., Li, Z., Ghirardo, A., Zimmer, I., Sharkey, T. D., et al. (2016). Effects of heat and drought stress on post-illumination bursts of volatile organic compounds in isoprene-emitting and non-emitting poplar. Plant Cell Environ. 39, 1204–1215. doi: 10.1111/pce.12643
Karl, T., Curtis, A. J., Rosenstiel, T. N., Monson, R. K., and Fall, R. (2002). Transient releases of acetaldehyde from tree leaves - products of a pyruvate overflow mechanism? Plant Cell Environ. 25, 1121–1131. doi: 10.1046/j.1365-3040.2002.00889.x
Karl, T., Harley, P., Emmons, L., Thornton, B., Guenther, A., Basu, C., et al. (2010). Efficient atmospheric cleansing of oxidized organic trace gases by vegetation. Science 330, 816–819. doi: 10.1126/science.1192534
Keßel, S. U. (2016). Entwicklung und Charakterisierung der Comparative Reactivity Method zur Messung von Hydroxylradikal- und Chlorradikal-Reaktivitäten - Troposphärische Oxidationschemie in drei unterschiedlich stark anthropogen beeinflussten Gebieten. Dissertation, Johannes-Gutenberg-Universität, Mainz.
Kesselmeier, J., Ciccioli, P., Kuhn, U., Stefani, P., Biesenthal, T., Rottenberger, S., et al. (2002). Volatile organic compound emissions in relation to plant carbon fixation and the terrestrial carbon budget. Glob. Biogeochem. Cycles 16, 73-1-73-9. doi: 10.1029/2001GB001813
Kesselmeier, J., Kuhn, U., Wolf, A., Andreae, M. O., Ciccioli, P., Brancaleoni, E., et al. (2000). Atmospheric volatile organic compounds (VOC) at a remote tropical forest site in central Amazonia. Atmos. Environ. 34, 4063–4072. doi: 10.1016/S1352-2310(00)00186-2
Kljun, N., Calanca, P., Rotach, M. W., and Schmid, H. P. (2015). A simple two-dimensional parameterisation for Flux Footprint Prediction (FFP). Geosci. Model Dev. 8, 3695–3713. doi: 10.5194/gmd-8-3695-2015
Kruijt, B., Malhi, Y., Lloyd, J., Norbre, A. D., Miranda, A. C., Pereira, M. G. P., et al. (2000). Turbulence statistics above and within two amazon rain forest canopies. Bound. Layer Meteorol. 94, 297–331. doi: 10.1023/A:1002401829007
Kuhn, U., Andreae, M. O., Ammann, C., Araújo, A. C., Brancaleoni, E., Ciccioli, P., et al. (2007). Isoprene and monoterpene fluxes from Central Amazonian rainforest inferred from tower-based and airborne measurements, and implications on the atmospheric chemistry and the local carbon budget. Atmos. Chem. Phys. 7, 2855–2879. doi: 10.5194/acp-7-2855-2007
Kuhn, U., Rottenberger, S., Biesenthal, T., Wolf, A., Schebeske, G., Ciccioli, P., et al. (2004). Seasonal differences in isoprene and light-dependent monoterpene emission by Amazonian tree species. Glob. Change Biol. 10, 663–682. doi: 10.1111/j.1529-8817.2003.00771.x
Li, W., Fu, R., Juárez, R. I. N., and Fernandes, K. (2008). Observed change of the standardized precipitation index, its potential cause and implications to future climate change in the Amazon region. Philos. Trans. R. Soc. Lond. Ser. B 363, 1767–1772. doi: 10.1098/rstb.2007.0022
Lindinger, W., Hansel, A., and Jordan, A. (1998). On-line monitoring of volatile organic compounds at pptv levels by means of proton-transfer-reaction mass spectrometry (PTR-MS) medical applications, food control and environmental research. Int. J. Mass Spectrom. Ion. Process. 173, 191–241. doi: 10.1016/S0168-1176(97)00281-4
Llusià, J., Peñuelas, J., Alessio, G. A., and Estiarte, M. (2008). Contrasting species-specific, compound-specific, seasonal, and interannual responses of foliar isoprenoid emissions to experimental drought in a mediterranean shrubland. Int. J. Plant Sci. 169, 637–645. doi: 10.1086/533603
Llusia, J., Roahtyn, S., Yakir, D., Rotenberg, E., Seco, R., Guenther, A., et al. (2016). Photosynthesis, stomatal conductance and terpene emission response to water availability in dry and mesic Mediterranean forests. Trees 30, 749–759. doi: 10.1007/s00468-015-1317-x
Loreto, F., Ciccioli, P., Cecinato, A., Brancaleoni, E., Frattoni, M., and Tricoli, D. (1996). Influence of environmental factors and air composition on the emission of [alpha]-pinene from Quercus ilex leaves. Plant Physiol. 110, 267–275. doi: 10.1104/pp.110.1.267
Loreto, F., Pinelli, P., Manes, F., and Kollist, H. (2004). Impact of ozone on monoterpene emissions and evidence for an isoprene-like antioxidant action of monoterpenes emitted by Quercus ilex leaves. Tree Physiol. 24, 361–367. doi: 10.1093/treephys/24.4.361
Lüpke, M., Leuchner, M., Steinbrecher, R., and Menzel, A. (2016). Impact of summer drought on isoprenoid emissions and carbon sink of three Scots pine provenances. Tree Physiol. 36, 1382–1399. doi: 10.1093/treephys/tpw066
MacGregor, G. R., and Nieuwolt, S. (1998). Tropical Climatology: An Introduction to the Climates of the Low Latitudes. Chichester: Wiley.
Malhi, Y. (2002). Energy and water dynamics of a central Amazonian rain forest. J. Geophys. Res. 107, LBA 45-1–LBA 45-17. doi: 10.1029/2001JD000623
Marengo, J. A., and Espinoza, J. C. (2016). Extreme seasonal droughts and floods in Amazonia: causes, trends and impacts. Int. J. Climatol. 36, 1033–1050. doi: 10.1002/joc.4420
Marengo, J. A., Tomasella, J., Alves, L. M., Soares, W. R., and Rodriguez, D. A. (2011). The drought of 2010 in the context of historical droughts in the Amazon region. Geophys. Res. Lett. 38, 1033–1050. doi: 10.1029/2011GL047436
Mauder, M., and Foken, T. (2004). Documentation and Instruction Manual of the Eddy Covariance Software Package TK2. Bayreuth: Universität Bayreuth, Micrometeorology Dept.
McDowell, N., Allen, C. D., Anderson-Teixeira, K., Brando, P., Brienen, R., Chambers, J., et al. (2018). Drivers and mechanisms of tree mortality in moist tropical forests. New Phytol. 219, 851–869. doi: 10.1111/nph.15027
Metcalfe, D. B., Lobo-do-Vale, R., Chaves, M. M., Maroco, J. P., Aragão, L. E. O., Malhi, Y., et al. (2010). Impacts of experimentally imposed drought on leaf respiration and morphology in an Amazon rain forest. Funct. Ecol. 24, 524–533. doi: 10.1111/j.1365-2435.2009.01683.x
Michoud, V., Hansen, R. F., Locoge, N., Stevens, P. S., and Dusanter, S. (2015). Detailed characterizations of the new Mines Douai comparative reactivity method instrument via laboratory experiments and modeling. Atmos. Meas. Tech. 8, 3537–3553. doi: 10.5194/amt-8-3537-2015
Monson, R. K., Trahan, N., Rosenstiel, T. N., Veres, P., Moore, D., Wilkinson, M., et al. (2007). Isoprene emission from terrestrial ecosystems in response to global change: minding the gap between models and observations. Philos. Trans. Ser. A 365, 1677–1695. doi: 10.1098/rsta.2007.2038
Niinemets, U. (2010). Mild versus severe stress and BVOCs: thresholds, priming and consequences. Trends Plant Sci. 15, 145–153. doi: 10.1016/j.tplants.2009.11.008
Niinemets, U., Loreto, F., and Reichstein, M. (2004). Physiological and physicochemical controls on foliar volatile organic compound emissions. Trends Plant Sci. 9, 180–186. doi: 10.1016/j.tplants.2004.02.006
Niinemets, Ü., and Reichstein, M. (2002). A model analysis of the effects of nonspecific monoterpenoid storage in leaf tissues on emission kinetics and composition in Mediterranean sclerophyllous Quercus species. Glob. Biogeochem. Cycles 16, 57-1-57-26. doi: 10.1029/2002GB001927
Nölscher, A. C., Yanez-Serrano, A. M., Wolff, S., Araujo, A. C., de Lavric, J. V., Kesselmeier, J., et al. (2016). Unexpected seasonality in quantity and composition of Amazon rainforest air reactivity. Nat. Commun. 7:10383. doi: 10.1038/ncomms10383
O'Connell, C. S., Ruan, L., and Silver, W. L. (2018). Drought drives rapid shifts in tropical rainforest soil biogeochemistry and greenhouse gas emissions. Nat. Commun. 9:1348. doi: 10.1038/s41467-018-03352-3
Ormeno, E., Mevy, J. P., Vila, B., Bousquet-Melou, A., Greff, S., Bonin, G., et al. (2007). Water deficit stress induces different monoterpene and sesquiterpene emission changes in Mediterranean species. Relationship between terpene emissions and plant water potential. Chemosphere 67, 276–284. doi: 10.1016/j.chemosphere.2006.10.029
Paek, H., Yu, J. Y., and Qian, C. (2017). Why were the 2015/2016 and 1997/1998 extreme El Niños different? Geophys. Res. Lett. 23:2885. doi: 10.1002/2016GL071515
Palm, B. B., Sá, S. S., de Day, D. A., Campuzano-Jost, P., Hu, W., Seco, R., et al. (2018). Secondary organic aerosol formation from ambient air in an oxidation flow reactor in central Amazonia. Atmos. Chem. Phys. 18, 467–493. doi: 10.5194/acp-18-467-2018
Peñuelas, J. (2003). BVOCs: plant defense against climate warming? Trends Plant Sci. 8, 105–109. doi: 10.1016/S1360-1385(03)00008-6
Peñuelas, J., and Staudt, M. (2010). BVOCs and global change. Trends Plant Sci. 15, 133–144. doi: 10.1016/j.tplants.2009.12.005
Pöschl, U., Martin, S. T., Sinha, B., Chen, Q., Gunthe, S. S., Huffman, J. A., et al. (2010). Rainforest aerosols as biogenic nuclei of clouds and precipitation in the Amazon. Science 329, 1513–1516. doi: 10.1126/science.1191056
Presto, A. A., Huff Hartz, K. E., and Donahue, N. M. (2005). Secondary organic aerosol production from terpene ozonolysis. 2. Effect of NO x concentration. Environ. Sci. Technol. 39, 7046–7054. doi: 10.1021/es050400s
Restrepo-Coupe, N., da Rocha, H. R., Hutyra, L. R., da Araujo, A. C., Borma, L. S., Christoffersen, B., et al. (2013). What drives the seasonality of photosynthesis across the Amazon basin? A cross-site analysis of eddy flux tower measurements from the Brasil flux network. Agric. For. Meteorol. 182–183, 128–144. doi: 10.1016/j.agrformet.2013.04.031
Rinne, H. J. I., Guenther, A. B., Greenberg, J. P., and Harley, P. C. (2002). Isoprene and monoterpene fluxes measured above Amazonian rainforest and their dependence on light and temperature. Atmos. Environ. 36, 2421–2426. doi: 10.1016/S1352-2310(01)00523-4
Rizzo, L. V., Artaxo, P., Karl, T., Guenther, A. B., and Greenberg, J. (2010). Aerosol properties, in-canopy gradients, turbulent fluxes and VOC concentrations at a pristine forest site in Amazonia. Atmos. Environ. 44, 503–511. doi: 10.1016/j.atmosenv.2009.11.002
Rottenberger, S., Kuhn, U., Wolf, A., Schebeske, G., Oliva, S. T., Tavares, T. M., et al. (2004). Exchange of short-chain aldehydes between Amazonian vegetation and the atmosphere. Ecol. Appl. 14, 247–262. doi: 10.1890/01-6027
Ruehr, N. K., Offermann, C. A., Gessler, A., Winkler, J. B., Ferrio, J. P., Buchmann, N., et al. (2009). Drought effects on allocation of recent carbon: from beech leaves to soil CO2 efflux. N. Phytol. 184, 950–961. doi: 10.1111/j.1469-8137.2009.03044.x
Santana, R. A., Dias-Júnior, C. Q., da Silva, J. T., Fuentes, J. D., do Vale, R. S., Alves, E. G., et al. (2018). Air turbulence characteristics at multiple sites in and above the Amazon rainforest canopy. Agric. For. Meteorol. 260–261, 41–54. doi: 10.1016/j.agrformet.2018.05.027
Santos, V. A. H. F. D., Ferreira, M. J., Rodrigues, J. V. F. C., Garcia, M. N., Ceron, J. V. B., Nelson, B. W., et al. (2018). Causes of reduced leaf-level photosynthesis during strong El Niño drought in a Central Amazon forest. Glob. Change Biol. 24, 4266–4279. doi: 10.1111/gcb.14293
Saunier, A., Ormeño, E., Wortham, H., Temime-Roussel, B., Lecareux, C., Boissard, C., et al. (2017). Chronic drought decreases anabolic and catabolic BVOC emissions of Quercus pubescens in a mediterranean forest. Front. Plant Sci. 8:71. doi: 10.3389/fpls.2017.00071
Sharkey, T. D., and Loreto, F. (1993). Water stress, temperature, and light effects on the capacity for isoprene emission and photosynthesis of kudzu leaves. Oecologia 95, 328–333. doi: 10.1007/BF00320984
Sharkey, T. D., and Monson, R. K. (2017). Isoprene research - 60 years later, the biology is still enigmatic. Plant Cell Environ. 40, 1671–1678. doi: 10.1111/pce.12930
Sharkey, T. D., Wiberley, A. E., and Donohue, A. R. (2008). Isoprene emission from plants: why and how. Ann. Bot. 101, 5–18. doi: 10.1093/aob/mcm240
Šimpraga, M., Verbeeck, H., Demarcke, M., Joó, É., Pokorska, O., Amelynck, C., et al. (2011). Clear link between drought stress, photosynthesis and biogenic volatile organic compounds in Fagus sylvatica L. Atmos. Environ. 45, 5254–5259. doi: 10.1016/j.atmosenv.2011.06.075
Sinha, V., Williams, J., Crowley, J. N., and Lelieveld, J. (2008). The comparative reactivity method – a new tool to measure total OH Reactivity in ambient air. Atmos. Chem. Phys. 8, 2213–2227. doi: 10.5194/acp-8-2213-2008
Spirig, C., Neftel, A., Ammann, C., Dommen, J., Grabmer, W., Thielmann, A., et al. (2005). Eddy covariance flux measurements of biogenic VOCs during ECHO 2003 using proton transfer reaction mass spectrometry. Atmos. Chem. Phys. 5, 465–481. doi: 10.5194/acp-5-465-2005
Swann, A. L. S., Longo, M., Knox, R. G., Lee, E., and Moorcroft, P. R. (2015). Future deforestation in the Amazon and consequences for South American climate. Agric. For. Meteorol. 214-215, 12–24. doi: 10.1016/j.agrformet.2015.07.006
Timmermann, A., Oberhuber, J., Bacher, A., Esch, M., Latif, M., and Roeckner, E. (1999). Increased El Niño frequency in a climate model forced by future greenhouse warming. Nature 398, 694–697. doi: 10.1038/19505
van der Laan-Luijkx, I. T., van der Velde, I. R., Krol, M. C., Gatti, L. V., Domingues, L. G., Correia, C. S. C., et al. (2015). Response of the Amazon carbon balance to the 2010 drought derived with CarbonTracker South America. Glob. Biogeochem. Cycles 29, 1092–1108. doi: 10.1002/2014GB005082
Varotsos, C. A., Tzanis, C. G., and Sarlis, N. V. (2016). On the progress of the 2015–2016 El Niño event. Atmos. Chem. Phys. 16, 2007–2011. doi: 10.5194/acp-16-2007-2016
Vickers, C. E., Gershenzon, J., Lerdau, M. T., and Loreto, F. (2009). A unified mechanism of action for volatile isoprenoids in plant abiotic stress. Nat. Chem. Biol. 5, 283–291. doi: 10.1038/nchembio.158
Vickers, D., and Mahrt, L. (1997). Quality control and flux sampling problems for tower and aircraft data. J. Atmos. Oceanic Technol. 14, 512–526. doi: 10.1175/1520-0426(1997)014 < 0512:QCAFSP>2.0.CO;2
Vilà-Guerau de Arellano, J., Patton, E. G., Karl, T., van den Dries, K., Barth, M. C., and Orlando, J. J. (2011). The role of boundary layer dynamics on the diurnal evolution of isoprene and the hydroxyl radical over tropical forests. J. Geophys. Res. 116:8032. doi: 10.1029/2010JD014857
Wang, G., and Hendon, H. H. (2017). Why 2015 was a strong El Niño and 2014 was not. Geophys. Res. Lett. 93:631–651. doi: 10.1002/2017GL074244
Werth, D. (2002). The local and global effects of Amazon deforestation. J. Geophys. Res. 107:1142. doi: 10.1029/2001JD000717
Williams, J., Keßel, S. U., Nölscher, A. C., Yang, Y., Lee, Y., Yáñez-Serrano, A. M., et al. (2016). Opposite OH reactivity and ozone cycles in the Amazon rainforest and megacity Beijing: subversion of biospheric oxidant control by anthropogenic emissions. Atmos. Environ. 125, 112–118. doi: 10.1016/j.atmosenv.2015.11.007
Wolff, S. (2015). Reactive and Non-Reactive Trace Gas Exchange Within and Above an Amazonian Rainforest. Dissertation, Universidade Estadual do Amazonas, Manaus.
Yáñez-Serrano, A. M., Nölscher, A. C., Bourtsoukidis, E., Gomes Alves, E., Ganzeveld, L., Bonn, B., et al. (2018). Monoterpene chemical speciation in a tropical rainforest: variation with season, height, and time of day at the Amazon Tall Tower Observatory (ATTO). Atmos. Chem. Phys. 18, 3403–3418. doi: 10.5194/acp-18-3403-2018
Yáñez-Serrano, A. M., Nölscher, A. C., Williams, J., Wolff, S., Alves, E., Martins, G. A., et al. (2015). Diel and seasonal changes of biogenic volatile organic compounds within and above an Amazonian rainforest. Atmos. Chem. Phys. 15, 3359–3378. doi: 10.5194/acp-15-3359-2015
Yang, J., Tian, H., Pan, S., Chen, G., Zhang, B., and Dangal, S. (2018). Amazon drought and forest response: largely reduced forest photosynthesis but slightly increased canopy greenness during the extreme drought of 2015/2016. Glob. Change Biol. 24, 1919–1934. doi: 10.1111/gcb.14056
Zemp, D. C., Schleussner, C.-F., Barbosa, H. M. J., Hirota, M., Montade, V., Sampaio, G., et al. (2017). Self-amplified Amazon forest loss due to vegetation-atmosphere feedbacks. Nat. Commun. 8:14681. doi: 10.1038/ncomms14681
Keywords: El Niño, OH reactivity, Amazon, drought, warming, abiotic stress, biogenic volatile organic compounds (BVOCs)
Citation: Pfannerstill EY, Nölscher AC, Yáñez-Serrano AM, Bourtsoukidis E, Keßel S, Janssen RHH, Tsokankunku A, Wolff S, Sörgel M, Sá MO, Araújo A, Walter D, Lavrič J, Dias-Júnior CQ, Kesselmeier J and Williams J (2018) Total OH Reactivity Changes Over the Amazon Rainforest During an El Niño Event. Front. For. Glob. Change 1:12. doi: 10.3389/ffgc.2018.00012
Received: 24 August 2018; Accepted: 04 December 2018;
Published: 18 December 2018.
Edited by:
Jaana Bäck, University of Helsinki, FinlandReviewed by:
Paul Christopher Stoy, Montana State University, United StatesSteffen M. Noe, Estonian University of Life Sciences, Estonia
Copyright © 2018 Pfannerstill, Nölscher, Yáñez-Serrano, Bourtsoukidis, Keßel, Janssen, Tsokankunku, Wolff, Sörgel, Sá, Araújo, Walter, Lavrič, Dias-Júnior, Kesselmeier and Williams. This is an open-access article distributed under the terms of the Creative Commons Attribution License (CC BY). The use, distribution or reproduction in other forums is permitted, provided the original author(s) and the copyright owner(s) are credited and that the original publication in this journal is cited, in accordance with accepted academic practice. No use, distribution or reproduction is permitted which does not comply with these terms.
*Correspondence: Eva Y. Pfannerstill, ZXZhLnBmYW5uZXJzdGlsbEBtcGljLmRl
†Present Address: Anke C. Nölscher, German Weather Service, Offenbach am Main, Germany
Ana M. Yáñez-Serrano, Ecosystem Physiology Department, Albert Ludwigs University, Freiburg, Germany