 Sarah E. Crouchet
 Jennifer Jensen
 Benjamin F. Schwartz
 Susanne Schwinning
- 1Biology Department, Texas State University, San Marcos, TX, United States
- 2Geography Department, Texas State University, San Marcos, TX, United States
Hot drought is a climate phenomenon that has received much attention lately for its potential to disrupt forest function worldwide. A sharp increase in tree mortality associated with this climate pattern is often cast as a disturbance, in which high temperature is responsible for causing exceptional rates of mortality across species. The alternative interpretation is simply that drought kills trees species in a density-dependent manner, related to the water deficit experienced by individual trees. To evaluate the evidence for density-dependent vs. -independent dynamics, we conducted censuses on 30 m × 30 m plots across 30 sites in Ashe juniper (Juniperus ashei) woodlands on the Edwards Plateau of central Texas, USA, 4 years after the hot drought of 2011. We hypothesized that variation in crown mortality of the two most dominant species, Ashe juniper and live oak (Quercus virginiana and Q. fusiformis), could be attributed to tree size, stand density, precipitation amount and/or bedrock depth; factors we considered indicative of density (resource)-dependent dynamics. We further hypothesized that crown mortality in subordinate species and the occurrence of resprouting in trees whose crowns had died would be more strongly controlled by air temperature, vapor pressure deficit, or aspect, acting independently of density. Through model selection analysis, we identified the most parsimonious binomial regression models for crown death in Ashe juniper, live oak and the understory shrub Texas persimmon (Diospyros texana). In Ashe juniper populations, overall crown mortality was 20% and largely followed hypothesized patterns. Live oak had an overall crown mortality rate of 23%, which declined rather than increased with tree density, and no evidence that crown death was linked to atmospheric conditions. Further in support of hypotheses, crown mortality in Texas persimmon and resprouting in Ashe juniper and live oak were significantly affected by exposure to hot and dry conditions and not by density-dependent factors. A surprise finding was the positive effect of bedrock depth on crown mortality. Based on data analysis, we hypothesized that excess precipitation in 2010 was stored in the fractured bedrock below the soil horizon, especially on sites where the soil layer was thin. In the following drought year, this “rock-stored” water rescued larger Ashe juniper trees and live oak trees from crown death, presumably because they had roots in the fractured rock zone.
Introduction
There is growing concern that episodes of extreme temperature related to global warming in interaction with episodic drought embody a new threat to the world's forests, which are already decimated by intentional deforestation (Pravalie, 2018). Numerous studies to date have documented forest die-off events, caused either directly or indirectly by hot and dry conditions (Allen et al., 2010; Anderegg et al., 2016). These events have often been interpreted as disturbances, in which harsh conditions kill many trees through direct effects on physiological function (Zeppel et al., 2013). Debate has predominantly focused on proximate causes of death, for example, whether trees died because of irreversible desiccation, carbon starvation or the interaction of these factors (Zeppel et al., 2013; Adams et al., 2017). However, the quest for understanding the proximate mechanisms of tree death must not overlook ultimately drives mortality at the population level, such as unsustainable population sizes. We suggest that the classic ecological division between density-dependent and -independent mortality can help frame the question in a different way and thereby guide the development of new mortality algorithms for dynamic vegetation models or determine whether new algorithms are necessary at all (Fisher et al., 2018).
In classic ecological theory, negative density-dependent mortality is a stabilizing force in communities; it regulates diversity (Chesson, 2018), helps maintain the balance between resource supply and demand (Tilman, 1980), and accelerates the death of subordinate, old or unhealthy individuals to the benefit of healthier individuals (Kohyama, 1994). By contrast, density-independent mortality is caused by external forces that disrupt the ecological balance, kills individuals indiscriminately and relaxes resource limitations that would normally inhibit radical community change (Cobb et al., 2017). Therefore, whether recently observed incidents of forest die-off are attributable to disturbance dynamics caused by extreme temperature or dynamics related to overcrowding and water shortage should have very different consequences for the future of forests and should therefore be distinguished in analysis, modeling, and discussion.
Density-dependent and -independent drivers of mortality rarely act independently, however. For example, fire can cause greater proportional damage in denser populations because of greater fuel accumulation (Miller and Urban, 2000). Heat waves can reduce precipitation frequency and amount, increase evapotranspiration, thus intensifying resource scarcity, which may in turn intensify vulnerability to heat stress (Fischer et al., 2007). Stochastic population dynamics further blur the boundaries between density-dependent and -independent dynamics by introducing externally driven fluctuations in resource supply (Parolari et al., 2014). For example, a wet decade may allow a forest to overshoot long-term sustainable biomass density, only to take a sudden plunge in a dry year. Rising CO2 levels, recognized to be a driver of worldwide woody thickening and encroachment (Macinnis-Ng et al., 2011; Prentice et al., 2011), may well contribute to making stochastic density fluctuations more extreme by accelerating growth and recruitment in favorable years and culling a greater percentage of the population in resource-deficient years.
Nonetheless, density-dependent mortality mechanisms are indicated if (i) mortality increases with stand density, (ii) less-competitive individuals have higher mortality rates, including smaller or old trees, (iii) mortality decreases with precipitation and iv) more trees die when the capacity of a site to store water is low (e.g., in shallow soils). Any of these patterns would link mortality to stabilizing rather than disruptive dynamics, in terms of regulating populations to better match resource supply. By contrast, if these patterns are absent and mortality is instead correlated with non-resource factors, such as higher air temperature and harsher site conditions (e.g., steep slopes and southern aspect), density-independent causes of mortality are strongly indicated.
The concept of multiple causation in tree mortality was first promoted by Manion (1981) when previously forest dieback (“Waldsterben”) was considered a global ecological crisis (Ciesla and Donaubauer, 1994). Manion highlighted complex causation in the terminology of “predisposing,” “inciting,” and “contributing” factors (Manion, 1981). Predisposing factors are persistent site or climate factors that modify susceptibility to a crisis (e.g., elevation), inciting factors are the conditions that cause acute physiological stress during the crisis (e.g., drought), and contributing factors are those that ultimately kill weakened trees (e.g., parasites or pathogens, although the roles of parasites and drought could also be reversed). The role of density-dependence was not stressed in this analysis, but other authors pointed out that canopy dieback and tree death always occurs in natural forests, and that there can be an appearance of decline in forests of simple age structure due to self-thinning or synchronized morbidity (Franklin et al., 1987; Mueller-Dombois, 1992).
Here, we present a case study that takes the framework of density-dependence as the organizing principle to characterize drivers of crown death following a hot drought that took place in Texas, USA in 2011. This drought reportedly killed 110–120 million trees statewide over 3 years, at a 9x higher annual rate than previously observed (Moore et al., 2016; Klockow et al., 2018). Although this event was not as destructive as some drought events reported in southwestern US forests [e.g., Breshears et al., 2005], it was extreme in terms of its spatial, biogeographic and taxonomic extent. Mortality rates were especially high in Ashe juniper woodlands of the Edwards Plateau in central Texas (Schwantes et al., 2017), a relatively water-limited bioregion, in which woody encroachment has greatly increased woody density over the past century. Somewhat paradoxically, Ashe juniper is the most drought-tolerant species in this biome yet suffered high rates of mortality. Differences in population mortality were generally not correlated with differences in species traits associated with drought response, neither for species in the Ashe juniper biome (Johnson et al., 2018), nor across biomes and taxa statewide (Moore et al., 2016).
We conducted a plot-level analysis in Ashe juniper woodlands 4 years after the drought to determine which and how many trees died and whether plot variation in climate, soil characteristics, topography, and tree size and density significantly modified rates of mortality. Four years after the event, we were able to include trees whose decline was delayed by several years (Trugman et al., 2018), as well as quantify recovery by resprouting. We also assessed mortality among saplings in the understory as a further indicator of how forests might recover. Using a model selection approach, we aimed to identity the most parsimonious models of tree mortality, resprouting, and sapling mortality. Our main objective was to determine the extent to which mortality and recovery were dominated by density-dependent vs. independent factors as defined above. Secondarily, we wanted to determine if different species were affected by the same risk factors or experienced the stresses of a drought year in different ways.
Based on the general expectation of stronger competitive effects among the dominant species in a community, including between juveniles and adults (Zhu et al., 2015), we predicted that (a) crown loss in the dominant species Ashe juniper and live oak, and the mortality of their juveniles, would be linked primarily to density-dependent effects, (b) crown loss or sapling mortality in subordinate species would be either low or more strongly linked to temperature effects, and (c) resprouting would be would linked only to temperature effects, since this depends on the survival of cells in the phloem and cambium of the wood (Sala et al., 2010) and stressed trees have no control over avoiding lethal temperatures, whereas they do have some control over the degree of tissue desiccation.
Methods
The 2011 drought in Texas was extreme in terms of both spatial extent and duration (Nielsen-Gammon, 2012; Hoerling et al., 2013). In addition to the record low precipitation (380 mm compared to the 734 mm statewide normal), high temperature records were exceeded across the state and the average temperature for that year was 2.1°C higher than normal.
Plots were located in Ashe juniper (Juniperus ashei J. Buchholz) communities in Central Texas, chiefly on the Edwards Plateau, on 16 private properties that participated in the Texas EcoLab program (Texasecolab.org). Plots spanned a 30-year average precipitation gradient from 583 to 938 mm and a range of precipitation deficits from 344 to 733 mm (Figure 1, Table 2).
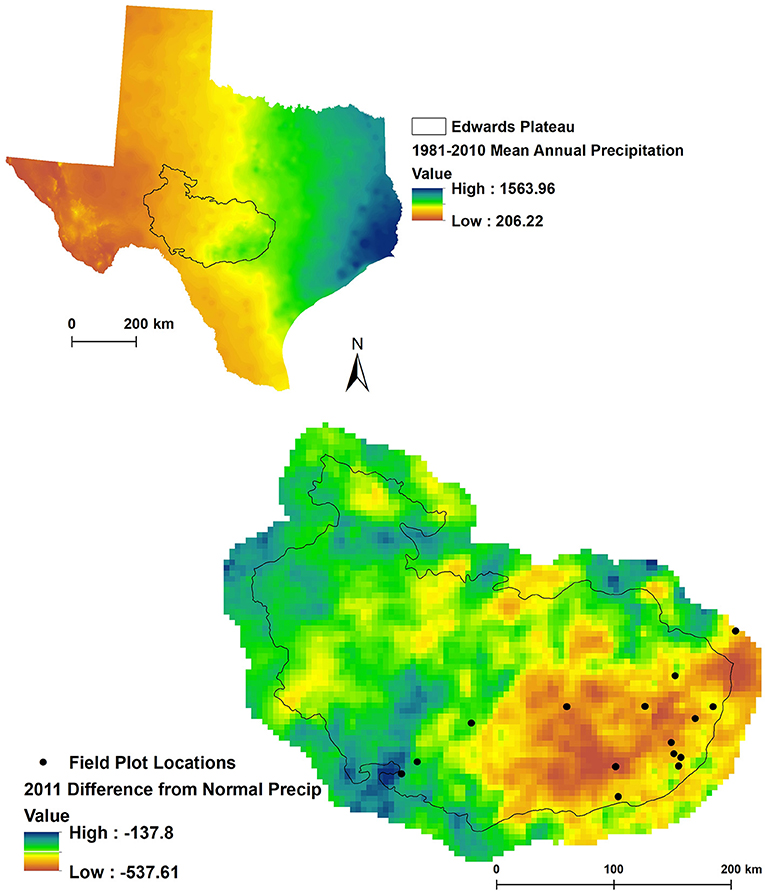
Figure 1. Site locations on the Edwards plateau. The top graph highlights long-term average annual precipitation and the location of the Edwards Plateau in Texas. The bottom graph highlights deviations from average precipitation in 2011 and the study site locations. One site (two plots) falls outside of the Edwards Plateau bioregion but was included in the analysis based on species composition (Ashe juniper woodland).
The most common species included Ashe juniper, escarpment live oak [Quercus fusiformis v. var. fusiformis (Small) Sarg.] and its close relative Southern live oak (Quercus virginiana v. var. virginiana), as well as Texas persimmon (Diospyros texana Scheele). A more complete species list is shown in the Supplementary Materials (Table A1).
Ashe juniper and live oak are evergreen and Texas persimmon is described variably as winter-deciduous or semi-evergreen. They are all drought-tolerant species but achieve tolerance by different hydraulic strategies. Live oak controls its leaf water potentials within a narrower range (above−5 MPa) and is probably deeper-rooted (Jackson et al., 1999), whereas the leaf water potential of Ashe juniper can drop to−8 MPa or lower during drought conditions (Kukowski et al., 2013; Dammeyer et al., 2016). Live oak has wider xylem conduits which cavitate at much lower water potentials than Ashe juniper (McElrone et al., 2004). However, live oak has higher maximal photosynthesis rates than Ashe juniper, with greater seasonal variation (Bendevis et al., 2010). Texas persimmon is a small tree or large shrub with small leathery leaves, extremely hard wood and a dehydration tolerance somewhere between that of live oak and Ashe juniper (Johnson et al., 2018).
Plots were surveyed in 2015/16. On each property, one to three plot locations were pre-selected from aerial Google Earth images, with the objective to sample across a range of conditions on that property, including high to low tree densities and apparent tree mortality rates. Plots of 30 m × 30 m were randomly placed in these pre-selected locations and systematically surveyed in increments of 5 m × 30 m. In total, 30 plots were sampled across 16 properties in the study.
In each plot, the basal circumference at ground level of all trees with ≥ 10 cm circumference was measured. This included dead trees, provided they appeared to have died recently, i.e., within the last few years. This determination was made by assessing the status of the terminal branches, specifically, whether they were as thin as on living trees, thus indicating minimal break down since death. Tree mortality following the 2011 drought year was up 9x over background levels (Moore et al., 2016). Thus, although the survey method may have included some trees that died before 2011, their proportion in the total sample volume would have been small. In addition, we considered trees that died since 2011 as late victims of the drought, since drought conditions do not always kill trees outright but may start them on a downward spiral from which they cannot recover (Klockow et al., 2018; Trugman et al., 2018).
Trees were identified by species and their crown status was classified visually into one of four categories based on the amount of recent crown die-back observed: >75%, 25–75%, <25% and 0%. Trees with 100% crown death were additionally classified in terms of whether they resprouted or not. Saplings ≤ 100 cm in height were identified by species, counted and recorded as dead or alive. Bark characteristics were used to identify species without leaves.
Local climate data were obtained for each property from the PRISM tool (PRISM, 2016) for the period October 1, 2007–September 30, 2011, thus including four full “water years” or “hydrological years,” which start by convention on 1 October when water stored in soil and groundwater are typically at their annual low (but see Kamps and Heilman, 2018). The accuracy of the PRISM tool has not been tested for central Texas, but in one study conducted in the southern Appalachian mountains, the average difference between estimated data and ground-truth was determined to be 5% on average (Daly et al., 2017).
Local soil water capacity was extracted from the USDA Gridded Soil Survey Geographic Database for Texas (Soil Survey Staff FY2015)1. Sand, silt and clay fraction, and depth to bedrock were extracted from the Soil Information for Environmental Modeling and Ecosystem Management soil database (Miller and White, 1998). Slope, aspect, and elevation were extracted for individual plots with 30 m Digital Elevation Models (DEM) from the National Elevation Dataset produced by the United States Geological Survey (U. S. Geological Survey, 2009).
Solar insolation was calculated using the Spatial Analyst tool in ArcGIS (ESRI, 2013) based on slope, aspect and elevation derived from the DEM. Slope was represented in degrees of inclination. Aspect was represented as Sine (eastern aspect) and the Cosine (northern aspect).
Response Variables
We limited the analysis to three taxa that exceeded a minimal number of tree counts (>200) and were observed across a minimal number of plots (>12) (Table 1). This in included Ashe juniper and Texas persimmon. Escarpment live oak and Southern live oak (Quercus virginiana v. var. virginiana) are two closely related species, can co-occur and are difficult to distinguish in the field. Since they showed no statistically significant difference in mortality patterns, they were consolidated as “live oak” for analysis.
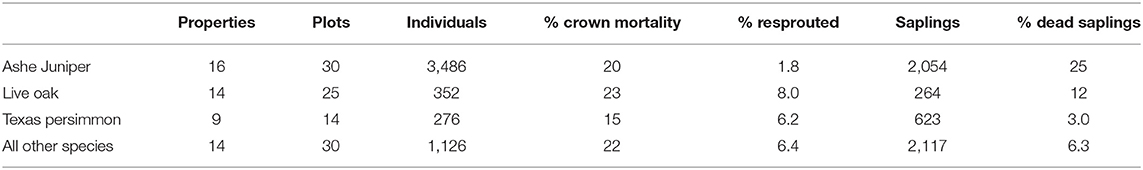
Table 1. Occurrence, abundance, and health status of taxa selected for analysis.
The goal was to obtain the most parsimonious multivariate model to predict rates of crown death, resprouting and sapling death from community characteristics, climate and site conditions. Partial canopy loss was relatively rare, so we decided to represent individual tree status with a binomial variable with value 0 if the tree maintained all or part of the crown and value 1 if all of the crown was lost (= crown death occurred).
The group of trees with 100% crown death included a small percentage of individuals that had resprouted (Table 1) and we constructed a second binomial variable to represent resprouting with value 1 if the tree had resprouted and value 0 if it had not.
Both crown mortality and resprouting were analyzed by binomial regression analysis. Lacking individual size data for saplings, we analyzed the rate of sapling mortality at the plot level. Plot-level rates were logit-transformed for linear regression analysis.
Model Selection
We began the analysis by compiling a list of potential explanatory factors for predicting crown death, resprouting, and sapling death, which included local climate data, physical site factors and community characteristics (Table 2). In addition, we included the individual basal stem areas for all trees over 10 cm circumference. We did not collect information on biological attack or injury in trees, chiefly because we could not determine if attack or injury happened before or after death. In general, however, we observed little to no evidence of insect parasitism.
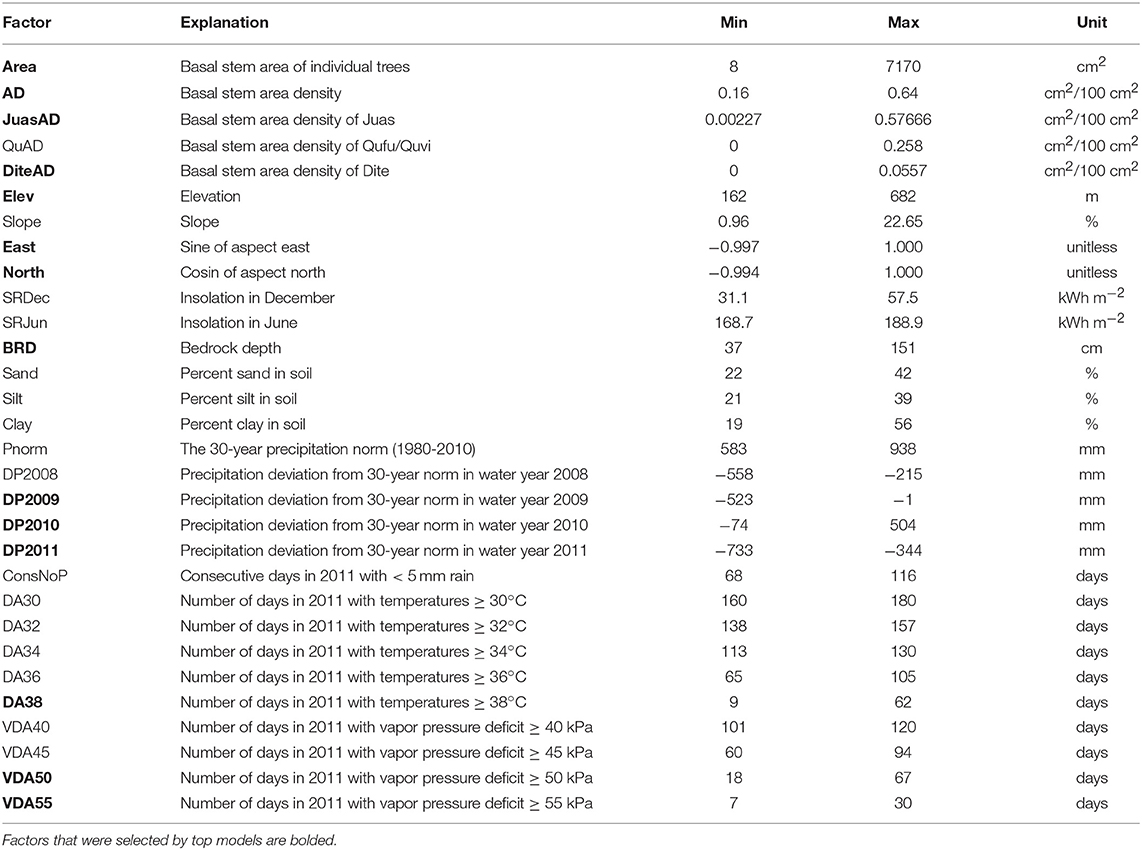
Table 2. List of all risk factors considered in the regression models, with data ranges and units.
Among the climate data, we considered annual precipitation from water years 2008 to 2011, normalized to mean annual precipitation measured between 1980 and 2010. The years 2008 and 2009 were also dry years, which may have predisposed trees negatively. On the other hand, 2010 had above-average precipitation and might have buffered the impact of the 2011 drought. To represent drought intensity in 2011, we counted the longest number of consecutive days with precipitation <5 mm. To represent heat and dry air exposure, we considered the number of days in 2011 with maximal temperatures ≥30°C, ≥32°C, ≥34°C, ≥36°C or ≥38°C as well as the number of days above a vapor pressure deficit ≥40 kPa, ≥45 kPa, ≥50 kPa, or ≥55 kPa.
Among the physical site factors, we considered elevation, bedrock depth, slope, northern and eastern aspect and soil texture. We also considered alternative variables to represent the same fundamental drivers, for example, insolation in December or June, which integrates the effects of aspect and slope for different seasons.
Community characteristics were represented by the basal stem area density of all trees above 10 cm circumference, or the stem area density of individual species.
In addition, we evaluated a limited and carefully selected number of interaction terms, which included any interaction with basal stem area, considering that trees of different sizes may be differentially sensitive to risk factors, and an interaction between bedrock depth and precipitation in 2010, allowing that high precipitation in the previous year might only have been useful if it had been stored in deep soil. Deliberately, we did not consider all possible interactions, following recommended practices in model-selection analysis to avoid over-fitting or the use of mechanistically meaningless constructs (Burnham and Anderson, 2002).
Next, we conducted a cross correlation analysis to group these variables into sets of highly correlated variables (Pearson correlation coefficient >0.6 or < −0.6) and within each set, selected one variable that was the strongest (although not necessarily significant) single predictor of crown death rate based on Wald's χ2 value. The complete correlation matrix is presented in Table B1.
Then, starting with a model containing one variable from each set of correlated variables, as well as all variables that were not correlated with any other, we removed the least explanatory variable stepwise until all remaining variables met the significance criterion. We used the relatively strict exclusion criterion of p > 0.01 to eliminate weak, possibly spurious associations that could have been caused by relatively low plot numbers. Having reduced the models in this way, we lastly swapped variables with “second-best” and “third-best” alternate variables from the correlated sets to compare and rank model variants according to AICc values. We present the three top models resulting from this model selection process and calculated their relative likelihoods using AICc weights (Burnham and Anderson, 2001). The overall goodness of fit of the top model predicting crown mortality was evaluated by determining the R2 of the prediction by regressing observed crown mortality at the plot level on predicted crown mortality, forcing the intercept through zero (Ritter and Munoz-Carpena, 2013). All analyses were conducted in SPSS (Version 23).
Results
Ashe Juniper Mortality
The most parsimonious models of crown death in Ashe juniper identified five significant risk factors, four of which were selected in all three top models (Table 3). At the plot level, the predicted R2 value for J1 was 0.56 (Figure C1).
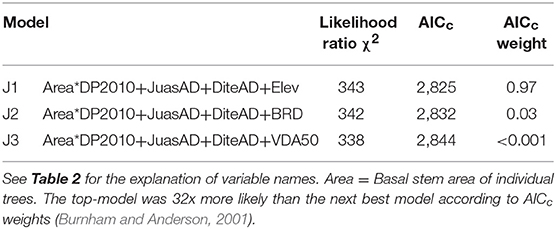
Table 3. The three top regression models for incidence of crown death in Ashe juniper.
The interaction between DP2010 and basal stem area was a dominant regression factor (Table C1; Figure 2). Recall, precipitation in 2010, the year before the drought, was far above average, but also there was a negative correlation between DP2010 and DP2011 (Table B1), such that sites that received high precipitation in 2010 encountered particularly harsh conditions in 2011.
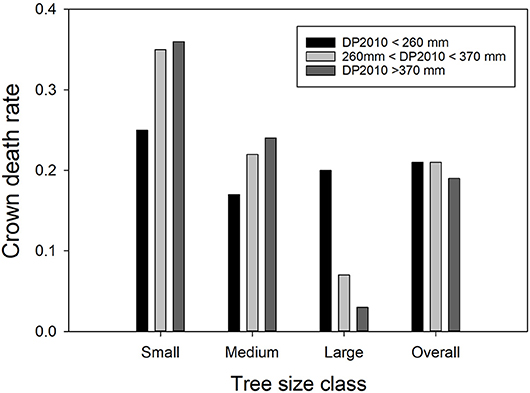
Figure 2. The interactive effects of precipitation deviation from the 30-year norm in 2010 (DP2010) and Ashe juniper basal stem area on crown death rate. The bars show average crown death rates in the respective classes. Precipitation data were binned into three classes with approximately equal membership. Small trees had basal stem areas of 8 to 38 cm2, medium trees of 39.1 to 169 cm2 and large trees of 170 to 7170 cm2.
The strongest effect of DP2010 was observed among large trees; increasing amounts of above-average precipitation drastically decreased crown death. Crown mortality generally decreased with tree size, but the effect was more pronounced at the high end of the precipitation spectrum in 2010.
Overall, crown death rate decreased with tree size following a negative (“L-shaped”) power function (Figure 3A). On average, live trees were 145 cm2 or 120% larger than dead trees. Part of this difference must be attributed to a measurement bias, since at the time of measurement, surviving trees had benefited from four more years of growth compared to trees that died in 2011. Based on published data (Polley et al., 2016) and applying a regression model to estimate how much trees that died would have grown over 4 years (Polley, personal communication), we estimated the measurement bias to be 13 cm2, thus only a fraction of the size actual difference between live and dead trees.
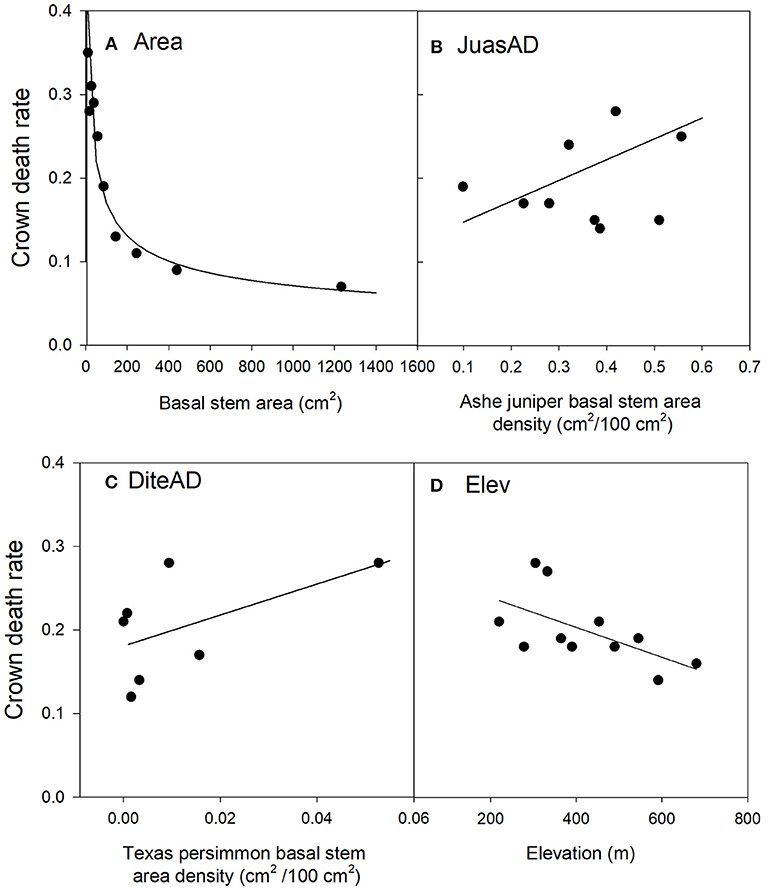
Figure 3. Relationships between Ashe juniper crown death rate and significant risk factors in the top regression model (J1). The values of the risk factors were divided into classes of individual basal stem area (A), the basal stem area density of Ashe juniper (B), the basal stem area of Texas persimmon (C) and elevation (D). Data were binned into 10 (Area, JuasAD. Elev) or 7 (DiteAD) classes with approximately equal membership and the class average was plotted on the x-axis. The smaller number of bins were dictated by the granularity of the data. See Table 2 for an explanation of variable names.
Crown death rate increased with the stem area densities of both Ashe juniper and Texas persimmon (Figures 3B,C).
Sites at lower elevation had increased rates of crown death (Figure 3D). This last risk factor was the only one that varied between the three top models and substitutes for this term were all highly correlated with elevation. Specifically, depth to bedrock was negatively correlated with elevation, related to the hilly karst topography of the Edwards Plateau (Table B1), with rocky hill tops and soil accumulation in valleys and plains (Schwantes et al., 2018). Thus, crown mortality was higher at low points in the topography, where soils were thicker.
Sapling death was positively correlated with the basal stem area density of Ashe juniper (p = 0.012) and no other factor.
Live Oak Mortality
The most parsimonious model of crown death in live oak contained three significant factors (Table 4). As with Ashe juniper, the occurrence of crown death declined with tree size (Figure 4A), but in a more linear manner. On average, live oak trees were 149 cm2 or 43% larger than dead trees. We found no suitable data to rigorously estimate the measurement bias for this species, but very crude rules of thumb to estimate the age of urban southern live oak trees places the potential 4-year growth increment of the dead tree population at 44 cm2. An average growth rate of 1 cm y−1, reported southern live oak trees in Gainesville, FL, places the potential bias at 62 cm2 (Lawrence et al., 2012). Although these estimates almost surely too high, they are still far exceeded by the actual size difference we found between live and dead oak trees.
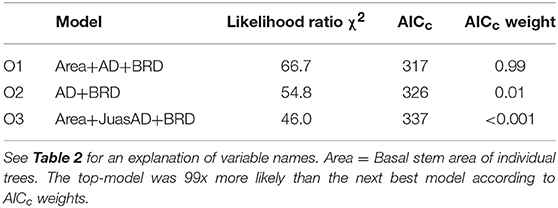
Table 4. The three top regression models for incidence of crown death in live oak.
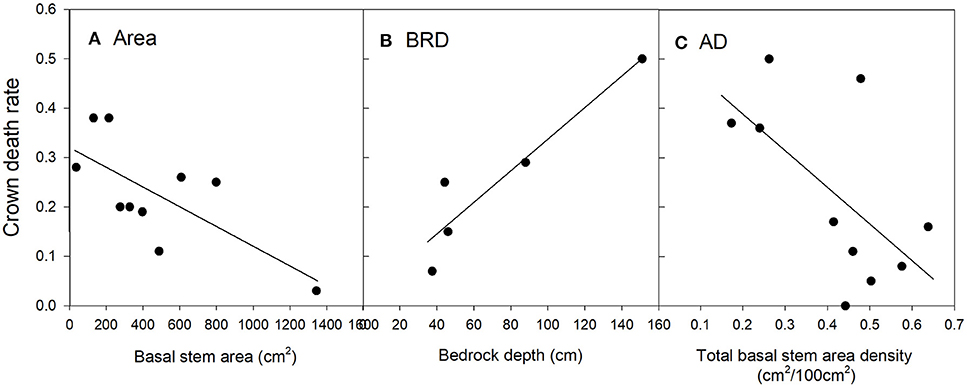
Figure 4. Relationships between live oak crown death rate and significant risk factors in the top regression model (O1). The values of the risk factors were divided into classes of individual basal stem area (A), bedrock depth (B) and the basal stem area density of all tree species (C). Data were binned into 10 (Area, AD), or 5 (BRD) classes with approximately equal membership and the class average was plotted on the x-axis. The smaller number of bins were dictated by the granularity of the data. See Table 2 for an explanation of variable names.
Crown death rate in live oak also increased with bedrock depth (Figure 4B). However, crown death was less common in plots with higher total basal stem density (Figure 4C).
For the top model, the predicted R2 at the plot-level was 0.20 (Table C2, Figure C2), thus, considerably lower than for Ashe juniper. Ten plots had zero mortality where non-zero mortality was predicted and six of these plots had less than five live oak trees. Thus, the lower accuracy of the model was in part caused by the much lower frequency of live oak trees in plots.
Sapling death had no significant relationship with any potential risk factor.
Texas Persimmon Mortality
Crown death in Texas persimmon was correlated with only two risk factors (Table 5): positively with the number of days that reached or exceeded a vapor pressure deficit of 55 kPa (Figure 5A) and negatively with northern aspect (Figure 5B). The predicted R2 on the plot-level was 0.27 (Table C3, Figure C3). Sapling death had no significant relationship with any risk factor.
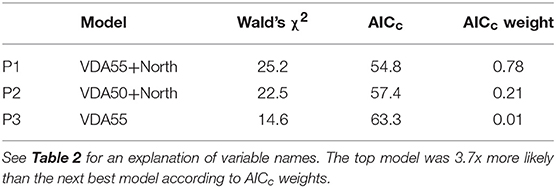
Table 5. The three top regression models for incidence of crown death in Texas persimmon.
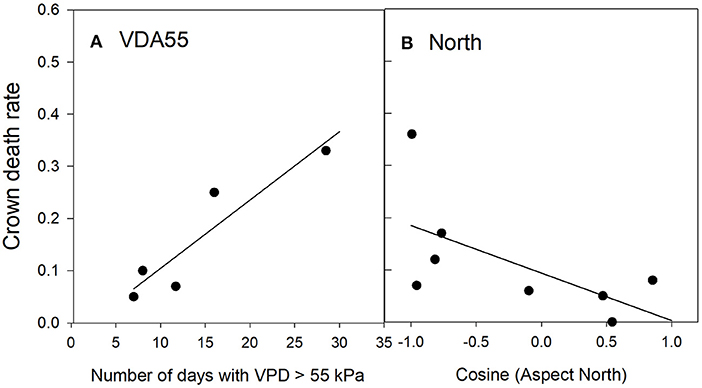
Figure 5. Relationships between Texas persimmon crown death rate and significant risk factors in the top regression model (P1). The values of the risk factors were divided into classes of the number of days with aa VPD > 55 kPa (A) and the Cosine of the Aspect North (B). Data were binned into 5 (VDA55) or 8 (North) classes with approximately equal membership and the class average was plotted on the x-axis. The number of classes were the largest permitted by the granularity of the data. See Table 2 for an explanation of variable names.
Resprouting
Across all species, of the 20% of trees that experienced crown death, 15% resprouted (Table 1). Resprouting was unevenly distributed across species, with higher rates in Texas persimmon and live oak and the lowest rate in Ashe juniper. Limited by sample size, we restricted the statistical analysis of resprouting to Ashe juniper and live oak.
For Ashe juniper, the two top models contained two significant factors: the number of days in 2011 with temperatures at or above 38°C (DA38) and the difference in 2009 precipitation from the 30-year average (DP2009). That year had a drought nearly as severe as 2011 but without the high temperatures. The top model had substantially more support than the next best models (Table 6A) and indicated that the incidence of resprouting decreased the more “hot days” were experienced in 2011 and the closer 2009 rainfall was to the 30-year average at a site (Figures 6A,B).
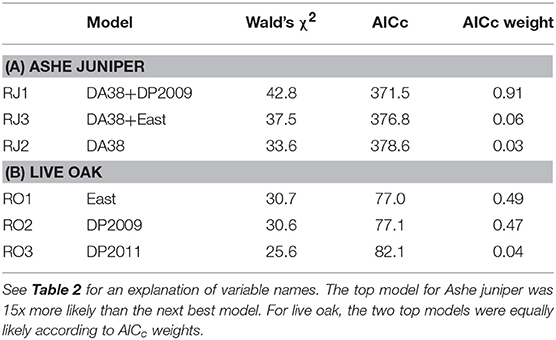
Table 6. The three top regression models for incidence of resprouting among trees with 100% crown death.
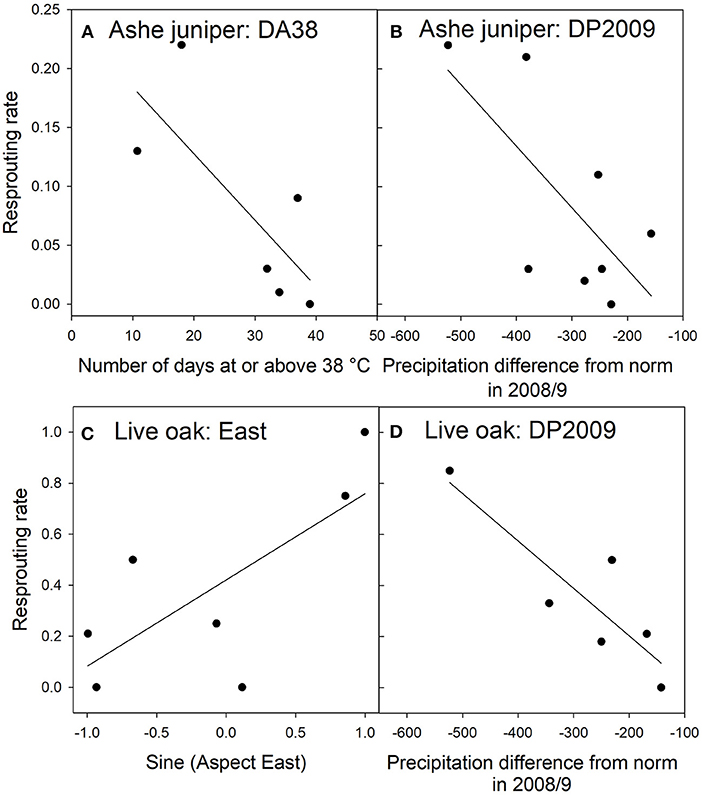
Figure 6. Relationships between resprouting rates and environmental factors in Ashe juniper (A,B) and live oak (C,D) in the top regression models RJ1 and RO1. The environmental factors were divided into classes with approximately equal membership and class averages were plotted on the x-axis. There are as many classes as the granularity of the data allowed. See Table 2 for an explanation of variable names.
For live oak, regression with eastern exposure or DP2009 resulted in equally strong models of resprouting rate (Table 6B). There was no strong correlation between these two factors, suggesting that both influenced resprouting independently, but that the data set was too small to support a regression model with two significant factors. More trees resprouted when they were facing east than west (Figure 6C), and fewer trees resprouted when the 2009 rainfall was closer to the 30-year average (Figure 6D).
Discussion
Was Mortality in Dominant Species Governed by Density-Dependence?
Ashe juniper was by far the most abundant member of the community and in support of our hypothesis, only effects related to density-dependence were predictive of crown mortality. This included effects of tree size, tree density, precipitation, and the capacity of a site to store water (correlated with elevation). Somewhat surprisingly, we did not find a direct effect of precipitation in 2011, despite substantial site variation (Table 2).
The highest mortality rates were experienced by the smallest trees (Figure 2A), consistent with self-thinning. Especially in younger stands, self-thinning takes out smaller trees that are competitively suppressed by taller neighbors (Kohyama, 1994). The dynamic also occurs in self-regenerating populations after disturbance, particularly if recruitment occurs within a narrow timeframe (Bi and Turvey, 1996; Coomes and Allen, 2007). These results conflict somewhat with several previously published reports in which larger Ashe juniper trees suffered higher mortality (Twidwell et al., 2014; Polley et al., 2016, 2018). However, these studies were conducted in savanna sites rather than closed canopy woodlands, which may explain the difference.
Ashe juniper saplings also died in a negatively density-dependent manner, specifically responding to the density of conspecifics. This dynamic is frequently observed in mesic forests (Zhu et al., 2015), although positive density (nurse plant) effects are more common in Mediterranean, semi-arid woodlands (Andivia et al., 2018). Ashe juniper woodlands occur at cusp of semi-arid conditions and the overwhelming dominance of Ashe juniper would be expected to intensify intraspecific competition.
Interestingly, Ashe juniper crown loss was not only amplified by intra-specific, but also by inter-specific competition from Texas persimmon (Figures 3B,C). We do not know much about the rooting habit of Texas persimmon, but in terms of stomatal behavior during drought, the species is more similar to Ashe juniper than to live oak (Johnson et al., 2018), thus it could be a strong competitor for water.
Against expectation, crown mortality was higher at lower elevation, likely related to greater soil depth in valleys. We had expected that the greater water storage capacity of a deeper soil would increase survivorship, especially since the drought followed a year with 277 mm precipitation above the 804 mm average across sites. For example, in the analysis by Schwantes et al. (2018), higher levels of crown dieback were observed on soils of <50 cm depth.
Yet, precipitation excess in 2010 did have a strong positive effect on survivorship, but only in large trees (Figure 2). The implication is that larger trees have deeper roots that may draw water from greater depth below the soil. A study conducted on a rocky hillslope in Ashe juniper/live oak woodlands documented that stand transpiration far exceeded precipitation from March to August 2011 (Dammeyer et al., 2016). The most likely source was water in fractured bedrock below the soil layer, which would have been recharged in fall and winter 2010 at a time when precipitation far exceeded transpiration By contrast, the deeper soil of valleys could diminish infiltration into the fractured bedrock below, resulting in less carry-over of moisture from 2010 to 2011.
Ryel et al. (2010) proposed a conceptual model with two functionally distinct soil moisture pools; a “growth pool” in the organic shallow soil responsible for plant growth during the growing season and a “maintenance pool” in deeper soil linked to summer drought survivorship. It would be interesting to explore the idea of functionally separate roles for soil- and rock-stored water in semi-arid karst, including potentially antagonistic interactions between them (i.e., more soil/more growth = less deep recharge/more drought mortality).
Ashe juniper has been an aggressive woody encroacher on Edwards Plateau for nearly 200 years (Van Auken, 2000). Unless actively managed to discourage woody plant growth, open grasslands are still being encroached today, as are sites where overstory trees have been mechanically removed and no follow-up treatment has been imposed (Moore and Owens, 2006). Unmanaged, woody cover increases 2% per year on average and exhibits negative density-dependence at higher cover levels, suggesting increasing resource limitations as populations reach 100% cover (Gonzalez, 2010). We would therefore expect Ashe juniper populations near their climax state to be quite sensitive to interannual variation in precipitation inputs.
In general, mature forests are more vulnerable to drought and other stressors. It is widely appreciated in forest management that lower density improves forest resistance and resilience to drought (Bottero et al., 2017) and that deliberate thinning is an effective tool for diminishing drought damage (D'Amato et al., 2013; Sohn et al., 2016).
Live oak is arguably a co-dominant species in Ashe juniper woodlands, albeit far less common and perhaps more accurately characterized as a savanna remnant after juniper encroachment (Norma Fowler, personal communication). For this species, evidence for negatively density-dependent mortality was weak, but there was also no evidence that heat exposure affected crown mortality. As in Ashe juniper, crown death rates decreased with tree size (4A). Trees that died may have been smaller because they experienced low growth for many years prior to death, as happens in Mediterranean oak species (Colangelo et al., 2017). Even across genera, this pattern of low growth for up to a decade before death appears to be quite general (Cailleret et al., 2017).
Oddly, live oak trees appeared to be protected by higher tree density (Figure 4C). The absence of a negative density effect does not exclude competitive effects on growth, just indicates that density did not increase crown mortality. Perhaps live oak is generally deeper-rooted than its competitors and has an independent source of water deep in the fractured bedrock (Jackson et al., 1999). In live oak, too, crown mortality was higher on deeper soils (Figure 4B), further supporting the hypothesis of life-saving water storage in fractured bedrock. Alternatively, crown survivorship may not be particularly sensitive to the number of days endured without plant-available water (which would increase with tree density). Live oak trees cope with drought conditions by closing stomata and dropping leaves, thereby moderating declines in water potentials and limiting xylem cavitation (Kukowski et al., 2013).
Regardless, positive density-dependence requires additional explanations. Perhaps a dense neighborhood of trees ameliorated stress levels by providing shade, lowering temperature and vapor pressure deficits, especially if Ashe juniper and pother woodland trees continued to transpire. Alternatively, some unrecognized aspect of site quality could have had independent positive effects on both tree density and live oak survivorship.
Was Mortality of Subordinate Species Governed by Density-Independent Effects?
We hypothesized that species with subordinate status in the community are not necessarily more vulnerable to drought, in fact, their survivorship may be less dependent on water availability and more dependent on other factors, including the high temperature and low humidity. For Texas persimmon, we found fairly strong evidence of sensitivity to atmospheric conditions, and no evidence of sensitivity to factors we associated with density-dependence. Number of days with extreme water vapor deficit was the factor most strongly correlated with crown death (Figure 6A). Additionally, the moderating effect of northern exposure, which should reduce afternoon temperature peaks, implicated atmospheric conditions as the main risk factor.
Physiologically, the effect of dry air is to accelerate uncontrolled water loss through cuticles and suberized stems and roots, which is particularly detrimental after water uptake ceases. Longer periods of unstoppable water loss ramp up water debt eventually to damaging levels (Anderegg et al., 2012). It is during this time that survival may be determined primarily by the length of time stems are exposed to hot and dry air, drawing out stored stem water day after day. Thus, while acute resource scarcity may be a prerequisite for tree death to occur at all, actual mortality rates could be correlated more strongly with atmospheric conditions than with tree density.
Texas persimmon is a winter-deciduous shrub or tree of short stature and an understory species in Ashe juniper woodlands. It has no particularly remarkable physiological characteristics (that we know of) that would explain temperature sensitivity. The species is more similar to Ashe juniper in xylem vulnerability and more similar to live oak in leaf photosynthesis (Johnson et al., 2018). As a deciduous species, it might be expected to avoid dangerously low water potentials, which would explain the lack of density-dependence in crown mortality but would not explain sensitivity to atmospheric conditions.
The species does have a somewhat unusual bark, which is smooth, thin and tends to flake off. Thin bark is a well-known risk factor in fire mortality, because it is less effective insulating cambium and other living stem tissues from lethal temperatures (Pellegrini et al., 2017). Perhaps the same vulnerability operates during a hot drought, maybe in conjunction with higher rates of stem water loss, but this is obviously speculative.
Was Resprouting Controlled by Temperature Effects?
Once a tree crown is destroyed by drought, whole-tree survivorship depends less on soil water availability and more on the availability of internal substrate and water reserves, the integrity of the phloem for substrate transport, and the survival of meristematic tissues (Sala et al., 2010). On this basis, we hypothesized that resprouting would be insensitive to density-dependent factors and sensitive environmental stressors, including heat exposure.
In support of this hypothesis, our study indicated that resprouting was generally inhibited by heat exposure (including on west-facing slopes; Figures 6A,C). Juniper is not normally classified as a sprouter, but we documented an overall 9% occurrence of resprouting in trees with dead crowns. That chance greatly increased to 17% in plots that experienced fewer than 20 “hot days.” Thus, the heat component of a “hot drought” may have a distinct effect on trees, besides accelerating the development of soil water deficits, heat may kill the living cells of the cambium, phloem, and parenchyma needed for repair and regrowth (Michaletz et al., 2012).
Resprouting was apparently also enhanced by the severity of a previous drought, in 2009 (Figures 6B,D). Multiple drought events are not known to have beneficial effects on recovery, on the contrary (Lloret et al., 2004; Plaut et al., 2013). We therefore judge this effect to be an artifact. For example, some tree crowns could have died in 2009 and in the absence of extreme temperatures in 2009, could have resprouted at a higher rate.
Comment on Risk Factor Analysis
The present analysis capitalized on variation in environmental factors and mortality rates between plots to help identify principle drivers of crown death and recovery. Variation in edaphic and geographic factors (e.g., depth to bedrock, elevation, slope, aspect) are expected in the heterogeneous landscape of a karst region, but we were surprised by how much the climate factors varied as well. Spatial variation in exposure to high temperature and precipitation during a regional, “exceptional” drought is sometimes overlooked in analyses of drought mortality and could lead to erroneous attribution of cause to other factors. On the other hand, the absence reference plots with moderate or no drought conditions also places limitations on data interpretation.
A further caveat to all multivariate regression approaches, besides being purely empirical and dependent on a-priory variable selection, is the covariance that might exist between some of the explanatory factors. Correlation between atmospheric drivers is bound to exist, for example, in our study, the negative correlation between precipitation in 2010 and 2011, related to climate gradients over the study area. Our strategy in the face of this uncertainty was to identify the strongest explanation through a systematic model selection process and to accept a model as the better explanation only if it resulted in a substantially more predictive or more parsimonious model.
Density-Dependence vs. -Independence for Modeling Tree Mortality
Why have we stressed the distinction between density-dependent and -independent mortality? Isn't the essential point just how many trees died, irrespective of the chain of causation? We would argue that the ultimate cause of tree mortality affects how ecosystems respond to drought, in particular, how fast they recover; a key metric for quantifying the long-term impact of climate change on forest stability and productivity (Schwalm et al., 2017).
When drought predominantly kills those trees that are competitively suppressed, perhaps grow in inferior microsites, or are morbid from old age or previous attacks by pathogens and parasites, populations are expected to recover quickly, as compensatory growth of fitter individuals would soon fill the vacated spaces. In this scenario, drought merely accelerates individual turn-over rates and replace less productive with more preductive individuals. This dynamic is nothing more than bounded population fluctuations in a stochastic environment, which may have been amplified in the recent past by the effects of CO2-fertilization, and could be further amplified in the future by more frequent droughts (Jump et al., 2017). Most, if not all forest models already have the essential components to represent these resource-supply-and-demand driven fluctuations.
By contrast, when drought kills trees haphazardly, based on exposure and vulnerability to novel stressors such as extreme heat waves, mortality rates may be disproportionate to resource scarcity and kill morbid as well as healthy trees. Recovery would be delayed, as available resources exceed resource demand in the aftermath and give new species (e.g., invasive grasses) opportunity to move in, which could further delay forest recovery. These dynamics of disturbance and succession are associated with far greater uncertainty and would require a significantly greater effort in terms of developing suitable modeling concepts (Johnstone et al., 2016).
As for the relationship between species traits and drought vulnerability, we should not lose sight that the most relevant chain of causation may be indirect (McDowell, 2011). Traits determine the status of a species within a community, such as whether a species is common or rare, and the latter may determine how a population responds to drought rather more so than absolute trait values (Mouillot et al., 2013; Russell et al., 2014). On the Edwards Plateau, traits of dehydration tolerance were no doubt important in allowing Ashe juniper to invade grasslands and dominate woodlands. Dense, nearly monospecific tree stands then cause higher rates of mortality during drought. A similarly dehydration tolerant species in our study, Texas persimmon, responded differently to drought, with no better explanation than the fact this species was subordinate in the community, occupied a different niche than the dominant competitor, and may have been relatively heat-intolerant.
Conclusion
One of the grand challenges of land surface modeling is to predict the response of vegetation to extreme climate events, including episodic hot droughts. So far, there has been no clear road map for developing mortality algorithms. They could be developed from trait-based models of individual stress tolerance, emulate the stochastic disturbance framework of fire models, or simply build upon frameworks of density-dependent resource supply and demand. We demonstrated using the case of Ashe juniper woodlands in central Texas that resource supply and demand considerations can fit the mortality patterns of a dominant woodland tree very well. Dominant populations have the highest demand for water, compete for it (mostly intra-specifically) most intensely, and are therefore strongly impacted by low precipitation. Our results further suggested that less common species, which either tolerate or avoid resource competition with dominant species, may be less affected by low precipitation, but respond idiosyncratically to other stressors including heat, according to their specific traits and ecological relationships with other species in the community. We suggest that it could be productive to examine tree mortality in the community context.
Author Contributions
SEC led the field data collection effort. SEC and SS conducted the data analysis and wrote the manuscript. JJ contributed to the collection and representation of public domain data. SEC, SS, JJ, and BFS substantially contributed to the conception and design of the work.
Funding
The study was supported by a grant from Texas Ecolab (texasecolab.org) and a MIRG (Multidisciplinary Internal Research Grant) from Texas State University grant to JJ, BFS, and SS. Funds from both sources were used to support travel costs and graduate student salaries.
Conflict of Interest Statement
The authors declare that the research was conducted in the absence of any commercial or financial relationships that could be construed as a potential conflict of interest.
Supplementary Material
The Supplementary Material for this article can be found online at: https://www.frontiersin.org/articles/10.3389/ffgc.2019.00021/full#supplementary-material
Footnotes
1. ^Soil Survey Staff FY2015. Gridded Soil Survey Geographic (gSSURGO) Database for Texas.
References
Adams, H. D., Zeppel, M. J. B., Anderegg, W. R. L., Hartmann, H., Landhäusser, S. M., Tissue, D. T., et al. (2017). A multi-species synthesis of physiological mechanisms in drought-induced tree mortality. Nat. Ecol. Evol. 1, 1285–1291. doi: 10.1038/s41559-017-0248-x
Allen, C. D., Macalady, A. K., Chenchouni, H., Bachelet, D., McDowell, N., Vennetier, M., et al. (2010). A global overview of drought and heat-induced tree mortality reveals emerging climate change risks for forests. Forest Ecol. Manage. 259, 660–684. doi: 10.1016/j.foreco.2009.09.001
Anderegg, W. R., Berry, J. A., and Field, C. B. (2012). Linking definitions, mechanisms, and modeling of drought-induced tree death. Trends Plant Sci. 17, 693–700. doi: 10.1016/j.tplants.2012.09.006
Anderegg, W. R., Klein, T., Bartlett, M., Sack, L., Pellegrini, A. F., Choat, B., et al. (2016). Meta-analysis reveals that hydraulic traits explain cross-species patterns of drought-induced tree mortality across the globe. Proc. Natl. Acad. Sci. U.S.A. 113, 5024–5029. doi: 10.1073/pnas.1525678113
Andivia, E., Madrigal-Gonzalez, J., Villar-Salvador, P., and Zavala, M. A. (2018). Do adult trees increase conspecific juvenile resilience to recurrent droughts? Implications for forest regeneration. Ecosphere 9:e02282. doi: 10.1002/ecs2.2282
Bendevis, M. A., Owens, M. K., Heilman, J. L., and McInnes, K. J. (2010). Carbon exchange and water loss from two evergreen trees in a semiarid woodland. Ecohydrology 3, 107–115. doi: 10.1002/eco.100
Bi, H. Q., and Turvey, N. D. (1996). Competition in mixed stands of Pinus radiata and Eucalyptus obliqua. J. Appl. Ecol. 33, 87–99. doi: 10.2307/2405018
Bottero, A., D'Amato, A. W., Palik, B. J., Bradford, J. B., Fraver, S., Battaglia, M. A., et al. (2017). Density-dependent vulnerability of forest ecosystems to drought. J. Appl. Ecol. 54, 1605–1614. doi: 10.1111/1365-2664.12847
Breshears, D. D., Cobb, N. S., Rich, P. M., Price, K. P., Allen, C. D., Balice, R. G., et al. (2005). Regional vegetation die-off in response to global-change-type drought. Proc. Natl. Acad. Sci. U.S.A. 102, 15144–15148. doi: 10.1073/pnas.0505734102
Burnham, K. P., and Anderson, D. R. (2001). Kullback-Leibler information as a basis for strong inference in ecological studies. Wildlife Res. 28, 111–119. doi: 10.1071/WR99107
Burnham, K. P., and Anderson, D. R. (2002). Model Selection and Multimodel Inference: A Practical Information-Theoretic Approach. New York, NY: Springer-Verlag.
Cailleret, M., Jansen, S., Robert, E. M., Desoto, L., Aakala, T., Antos, J. A., et al. (2017). A synthesis of radial growth patterns preceding tree mortality. Glob. Change Biol. 23, 1675–1690. doi: 10.1111/gcb.13535
Chesson, P. (2018). Updates on mechanisms o maintenance of species diversity. J. Ecol. 106, 1773–1794. doi: 10.1111/1365-2745.13035
Ciesla, W. M., and Donaubauer, E. (1994). Decline and Dieback of Trees and Forests: A Global Overview. Rome: Food and Agriculture Organization of the United Nations.
Cobb, R. C., Ruthrof, K. X., Breshears, D. D., Lloret, F., Aakala, T., Adams, H. D., et al. (2017). Ecosystem dynamics and management after forest die-off: a global synthesis with conceptual state-and-transition models. Ecosphere 8, 1–17. doi: 10.1002/ecs2.2034
Colangelo, M., Camarero, J. J., Borghetti, M., Gazol, A., Gentilesca, T., and Ripullone, F. (2017). Size matters a lot: drought-affected Italian oaks are smaller and show lower growth prior to tree death. Front. Plant Sci. 8:135. doi: 10.3389/fpls.2017.00135
Coomes, D. A., and Allen, R. B. (2007). Mortality and tree-size distributions in natural mixed-age forests. J. Ecol. 95, 27–40. doi: 10.1111/j.1365-2745.2006.01179.x
Daly, C., Slater, M. E., Roberti, J. A., Laseter, S. H., and Swift, L. W. (2017). High-resolution precipitation mapping in a mountainous watershed: ground truth for evaluating uncertainty in a national precipitation dataset. Int. J. Climatol. 37, 124–137. doi: 10.1002/joc.4986
D'Amato, A. W., Bradford, J. B., Fraver, S., and Palik, B. J. (2013). Effects of thinning on drought vulnerability and climate response in north temperate forest ecosystems. Ecol. Appl. 23, 1735–1742. doi: 10.1890/13-0677.1
Dammeyer, H. C., Schwinning, S., Schwartz, B. F., and Moore, G. W. (2016). Effects of juniper removal and rainfall variation on tree transpiration in a semi-arid karst: evidence of complex water storage dynamics. Hydrol. Process. 30, 4568–4581. doi: 10.1002/hyp.10938
Fischer, E. M., Seneviratne, S. I., Vidale, P. L., Luthi, D., and Schar, C. (2007). Soil moisture - atmosphere interactions during the 2003 European summer heat wave. J. Clim. 20, 5081–5099. doi: 10.1175/JCLI4288.1
Fisher, R. A., Koven, C. D., Anderegg, W. R. L., Christoffersen, B. O., Dietze, M. C., Farrior, C. E., et al. (2018). Vegetation demographics in earth system models: a review of progress and priorities. Glob. Change Biol. 24, 35–54. doi: 10.1111/gcb.13910
Franklin, J. F., Shugart, H. H., and Harmon, M. E. (1987). Tree death as an ecological process. Bioscience 37, 550–556. doi: 10.2307/1310665
Gonzalez, A. V. (2010). Dynamics of Woody Plant Encroachment in Texas Savannas [electronic resource]: Density Dependence, Environmental Heterogeneity, and Spatial Patterns. Austin, TX: University of Texas.
Hoerling, M., Kumar, A., Dole, R., Nielsen-Gammon, J. W., Eischeid, J., Perlwitz, J., et al. (2013). Anatomy of an extreme event. J. Clim. 26, 2811–2832. doi: 10.1175/JCLI-D-12-00270.1
Jackson, R. B., Moore, L. A., Hoffmann, W. A., Pockman, W. T., and Linder, C. R. (1999). Ecosystem rooting depth determined with caves and DNA. Proc. Natl. Acad. Sci. U.S.A. 96, 11387–11392.
Johnson, D. M., Domec, J. C., Berry, Z., Schwantes, A. M., McCulloh, K. A., Woodruff, D. R., et al. (2018). Co-occurring woody species have diverse hydraulic strategies and mortality rates during an extreme drought. Plant Cell Environ. 41, 576–588. doi: 10.1111/pce.13121
Johnstone, J. F., Allen, C. D., Franklin, J. F., Frelich, L. E., Harvey, B. J., Higuera, P. E., et al. (2016). Changing disturbance regimes, ecological memory, and forest resilience. Front. Ecol. Environ. 14, 369–378. doi: 10.1002/fee.1311
Jump, A. S., Ruiz-Benito, P., Greenwood, S., Allen, C. D., Kitzberger, T., Fensham, R., et al. (2017). Structural overshoot of tree growth with climate variability and the global spectrum of drought-induced forest dieback. Glob. Change Biol. 23, 3742–3757. doi: 10.1111/gcb.13636
Kamps, R. H., and Heilman, J. L. (2018). A method to calculate a locally relevant water year for ecohydrological studies using eddy covariance data. Ecohydrology 11:9. doi: 10.1002/eco.1980
Klockow, P. A., Vogel, J. G., Edgar, C. B., and Moore, G. W. (2018). Lagged mortality among tree species four years after an exceptional drought in east Texas. Ecosphere 9:14. doi: 10.1002/ecs2.2455
Kohyama, T. (1994). Size-structure-based models of forest dynamics to interpret population-level and community-level mechanisms. J. Plant Res. 107, 107–116. doi: 10.1007/BF02344537
Kukowski, K. R., Schwinning, S., and Schwartz, B. F. (2013). Hydraulic responses to extreme drought conditions in three co-dominant tree species in shallow soil over bedrock. Oecologia 171, 819–830. doi: 10.1007/s00442-012-2466-x
Lawrence, A. B., Escobedo, F. J., Staudhammer, C. L., and Zipperer, W. (2012). Analyzing growth and mortality in a subtropical urban forest ecosystem. Landsc. Urban Plan. 104, 85–94. doi: 10.1016/j.landurbplan.2011.10.004
Lloret, F., Siscart, D., and Dalmases, C. (2004). Canopy recovery after drought dieback in holm-oak Mediterranean forests of Catalonia (NE Spain). Glob. Change Biol. 10, 2092–2099. doi: 10.1111/j.1365-2486.2004.00870.x
Macinnis-Ng, C., Zeppel, M., Williams, M., and Eamus, D. (2011). Applying a SPA model to examine the impact of climate change on GPP of open woodlands and the potential for woody thickening. Ecohydrology 4, 379–393. doi: 10.1002/eco.138
McDowell, N. G. (2011). Mechanisms linking drought, hydraulics, carbon metabolism, and vegetation mortality. Plant Physiol. 155, 1051–1059. doi: 10.1104/pp.110.170704
McElrone, A. J., Pockman, W. T., Martinez-Vilalta, J., and Jackson, R. B. (2004). Variation in xylem structure and function in stems and roots of trees to 20 m depth. New Phytol. 163, 507–517. doi: 10.1111/j.1469-8137.2004.01127.x
Michaletz, S. T., Johnson, E. A., and Tyree, M. T. (2012). Moving beyond the cambium necrosis hypothesis of post-fire tree mortality: cavitation and deformation of xylem in forest fires. New Phytol. 194, 254–263. doi: 10.1111/j.1469-8137.2011.04021.x
Miller, C., and Urban, D. L. (2000). Connectivity of forest fuels and surface fire regimes. Landsc. Ecol. 15, 145–154. doi: 10.1023/A:1008181313360
Miller, D. A., and White, R. A. (1998). A conterminous United States multi-layer soil characteristics data set for regional climate and hydrology modeling. Earth Interact. 2, 1–26. doi: 10.1175/1087-3562(1998)002<0001:ACUSMS>2.3.CO;2
Moore, G. W., Edgar, C. B., Vogel, J. G., Washington-Allen, R. A., March, O. G., and Zehnder, R. (2016). Tree mortality from an exceptional drought spanning mesic to semiarid ecoregions. Ecol. Appl. 26, 602–611. doi: 10.1890/15-0330
Moore, G. W., and Owens, M. K. (2006). Removing adult overstory trees stimulates growth and transpiration of conspecific juvenile trees. Rangeland Ecol. Manage. 59, 416–421. doi: 10.2111/1551-5028(2006)59[416:RAOTSG]2.0.CO;2
Mouillot, D., Graham, N. A., Villéger, S., Mason, N. W., and Bellwood, D. R. (2013). A functional approach reveals community responses to disturbances. Trends Ecol. Evol. 28, 167–177. doi: 10.1016/j.tree.2012.10.004
Mueller-Dombois, D. (1992). “A natural dieback theory, cohort senescence as an alternative to the decline-disease theory,” in Forest Decline Concepts, eds D. Manion and D. Lachance (St. Paul, MN: The American Phytopathological Society), 26–37.
Parolari, A. J., Katul, G. G., and Porporato, A. (2014). An ecohydrological perspective on drought-induced forest mortality. J. Geophys. Res. Biogeosci. 119, 965–981. doi: 10.1002/2013JG002592
Pellegrini, A. F., Anderegg, W. R., Paine, C. E., Hoffmann, W. A., Kartzinel, T., Rabin, S. S., et al. (2017). Convergence of bark investment according to fire and climate structures ecosystem vulnerability to future change. Ecol. Lett. 20, 307–316. doi: 10.1111/ele.12725
Plaut, J. A., Wadsworth, W. D., Pangle, R., Yepez, E. A., McDowell, N. G., and Pockman, W. T. (2013). Reduced transpiration response to precipitation pulses precedes mortality in a pinon-juniper woodland subject to prolonged drought. New Phytol. 200, 375–387. doi: 10.1111/nph.12392
Polley, H. W., Johnson, D. M., and Jackson, R. B. (2016). Canopy foliation and area as predictors of mortality risk from episodic drought for individual trees of Ashe juniper. Plant Ecol. 217, 1105–1114. doi: 10.1007/s11258-016-0636-3
Polley, H. W., Johnson, D. M., and Jackson, R. B. (2018). Projected drought effects on the demography of Ashe juniper populations inferred from remote measurements of tree canopies. Plant Ecol. 219, 1259–1267. doi: 10.1007/s11258-018-0876-5
Pravalie, R. (2018). Major perturbations in the Earth's forest ecosystems. Possible implications for global warming. Earth Sci. Rev. 185, 544–571. doi: 10.1016/j.earscirev.2018.06.010
Prentice, I. C., Harrison, S. P., and Bartlein, P. J. (2011). Global vegetation and terrestrial carbon cycle changes after the last ice age. New Phytol. 189, 988–998. doi: 10.1111/j.1469-8137.2010.03620.x
PRISM (2016). Climate Group. Created 27 April 2016. Oregon State University. Available online at http://prism.oregonstate.edu
Ritter, A., and Munoz-Carpena, R. (2013). Performance evaluation of hydrological models: Statistical significance for reducing subjectivity in goodness-of-fit assessments. J. Hydrol. 480, 33–45. doi: 10.1016/j.jhydrol.2012.12.004
Russell, M. B., Woodall, C. W., D'Amato, A. W., Domke, G. M., and Saatchi, S. S. (2014). Beyond mean functional traits: influence of functional trait profiles on forest structure, production, and mortality across the eastern US. Forest Ecol. Manage. 328, 1–9. doi: 10.1016/j.foreco.2014.05.014
Ryel, R. J., Leffler, A. J., Ivans, C., Peek, M. S., and Caldwell, M. M. (2010). Functional differences in water-use patterns of contrasting life forms in great basin steppelands. Vadose Zone J. 9, 548–560. doi: 10.2136/vzj2010.0022
Sala, A., Piper, F., and Hoch, G. (2010). Physiological mechanisms of drought-induced tree mortality are far from being resolved. New Phytol. 186, 274–281. doi: 10.1111/j.1469-8137.2009.03167.x
Schwalm, C. R., Anderegg, W. R. L., Michalak, A. M., Fisher, J. B., Biondi, F., Koch, G., et al. (2017). Global patterns of drought recovery. Nature 548, 202–205. doi: 10.1038/nature23021
Schwantes, A. M., Parolari, A. J., Swenson, J. J., Johnson, D. M., Domec, J. C., Jackson, R. B., et al. (2018). Accounting for landscape heterogeneity improves spatial predictions of tree vulnerability to drought. New Phytol. 220, 132–146. doi: 10.1111/nph.15274
Schwantes, A. M., Swenson, J. J., González-Roglich, M., Johnson, D. M., Domec, J. C., and Jackson, R. B. (2017). Measuring canopy loss and climatic thresholds from an extreme drought along a fivefold precipitation gradient across Texas. Glob. Change Biol. 23, 5120–5135. doi: 10.1111/gcb.13775
Sohn, J. A., Saha, S., and Bauhus, J. (2016). Potential of forest thinning to mitigate drought stress: a meta-analysis. Forest Ecol. Manage. 380, 261–273. doi: 10.1016/j.foreco.2016.07.046
Tilman, D. (1980). Resources - a graphical-mechanistic approach to competition and predation. Am. Natural. 116, 362–393. doi: 10.1086/283633
Trugman, A. T., Detto, M., Bartlett, M. K., Medvigy, D., Anderegg, W. R. L., Schwalm, C., et al. (2018). Tree carbon allocation explains forest drought-kill and recovery patterns. Ecol. Lett. 21, 1552–1560. doi: 10.1111/ele.13136
Twidwell, D., Wonkka, C. L., Taylor, C. A., Zou, C. B., Twidwell, J. J., and Rogers, W. E. (2014). Drought-induced woody plant mortality in an encroached semi-arid savanna depends on topoedaphic factors and land management. Appl. Veg. Sci. 17, 42–52. doi: 10.1111/avsc.12044
U. S. Geological Survey, (ed) USGS (2009). National Elevation Dataset (NED). Sioux Falls, SD: U. S. Geological Survey.
Van Auken, O. W. (2000). Shrub invasions of North American semiarid grasslands. Ann. Rev. of Ecol. System. 31, 197–215. doi: 10.1146/annurev.ecolsys.31.1.197
Zeppel, M. J., Anderegg, W. R., and Adams, H. D. (2013). Forest mortality due to drought: latest insights, evidence and unresolved questions on physiological pathways and consequences of tree death. New Phytol. 197, 372–374. doi: 10.1111/nph.12090
Keywords: climate-change type drought, density-dependence, disturbance, growth pool, logistic regression, maintenance pool, tree mortality
Citation: Crouchet SE, Jensen J, Schwartz BF and Schwinning S (2019) Tree Mortality After a Hot Drought: Distinguishing Density-Dependent and -Independent Drivers and Why It Matters. Front. For. Glob. Change 2:21. doi: 10.3389/ffgc.2019.00021
Received: 04 January 2019; Accepted: 29 April 2019;
Published: 22 May 2019.
Edited by:
Mike Aspinwall, University of North Florida, United StatesReviewed by:
Georgianne W. Moore, Texas A&M University, United StatesSophie Fauset, University of Plymouth, United Kingdom
Paul Klockow, Texas A&M University, United States, in collaboration with reviewer GM
Copyright © 2019 Crouchet, Jensen, Schwartz and Schwinning. This is an open-access article distributed under the terms of the Creative Commons Attribution License (CC BY). The use, distribution or reproduction in other forums is permitted, provided the original author(s) and the copyright owner(s) are credited and that the original publication in this journal is cited, in accordance with accepted academic practice. No use, distribution or reproduction is permitted which does not comply with these terms.
*Correspondence: Susanne Schwinning, c2Nod2lubkB0eHN0YXRlLmVkdQ==