 Kaisa Rissanen
 Teemu Hölttä
 Luís F. M. Barreira
 Noora Hyttinen
 Theo Kurtén
 Jaana Bäck
- 1Institute for Atmospheric and Earth System Research/Forest Sciences, Faculty of Agriculture and Forestry, University of Helsinki, Helsinki, Finland
- 2Department of Chemistry, University of Helsinki, Helsinki, Finland
- 3Department of Chemistry, Institute for Atmospheric and Earth System Research/Faculty of Science, University of Helsinki, Helsinki, Finland
Resin is a first-line defense in pine trees, but important questions regarding its temporal and spatial variation remain unsolved. Resin pressure varies according to water potential in dry conditions, but in moist conditions, it follows temperature dynamics for a yet unknown reason. Relations between resin composition, resin pressure, and shoot monoterpene emissions are also unquantified. To gain mechanistic understanding on the resin dynamics in a boreal forest, we measured temperature and water potential dependency of Scots pine resin pressure. We attempted to quantify the temperature dependency of resin pressure in terms of three contributions: (1) saturation vapor pressure, (2) thermal expansion, and (3) N2, O2, and CO2 solubility. We also analyzed monoterpene composition in the resin and the shoot emissions of 16 pines with gas chromatography mass spectrometry to study their interrelations. We show that in moist conditions, resin pressure is driven by temperature at a diurnal scale, but also affected by soil water potential at a day-to-day scale. Diurnal temperature dependency was explained by thermal expansion of resin and changes in bubble volume due to changes in gas solubility in resin with temperature. Resin pressures correlated also with total monoterpene and α-pinene content in resin and with total monoterpene and Δ3-carene and terpinolene emissions from shoots.
Introduction
Resin (also called oleoresin) of conifer trees is a secondary metabolite that plays a major role in tree defense. It is a viscous, sticky combination of non-volatile resin acids (diterpenes) and volatile monoterpenes and sesquiterpenes that forms a pressurized barrier against pest insects and harmful fungal spores. Certain monoterpenes in resin, such as limonene and Δ3-carene, have toxic or antifungal properties, yet certain insects can also transform monoterpenes into communication pheromones (Phillips and Croteau, 1999). In pine trees, resin is stored in a network of resin ducts in the xylem, cortex, and needles. Epithelial cells lining these storage structures produce the resin. The pressure of resin in the resin ducts (oleoresin exudation pressure, OEP) can reach 10–15 bars, with variation between trees (Bourdeau and Schopmeyer, 1958; Vité, 1961; Vité and Wood, 1961; Rissanen et al., 2016).
Despite the important role of resin in coniferous forest defense, and the extensive body of literature related to the composition and anti-herbivory effects of resin, many questions related to its temporal dynamics and tree-to-tree variation in natural conditions remain unanswered.
First, resin pressure in pines follows the diurnal dynamics of tree water potential in relatively dry regions (Schopmeyer et al., 1954; Bourdeau and Schopmeyer, 1958; Vité, 1961; Hodges and Lorio, 1968; Lorio and Hodges, 1968; Helseth and Brown, 1970; Neher, 1993), but an opposite diurnal pattern with a strong correlation to temperature has been observed in moist boreal conditions (Rissanen et al., 2016). The effect of water potential has been explained in two ways. According to Vité (1961), increasing transpiration and decreasing tree water potential decrease turgor pressure in the epithelial cells lining the resin ducts, decreasing resin pressure. Helseth and Brown (1970) and Neher (1993) proposed that the shrinking of tracheids due to transpiration decreases the pressure exerted on the resin ducts, thus decreasing the resin pressure. However, the ultimate reason for the strong positive correlation with temperature in a humid boreal forest remains unknown. The thermal expansion of resin and temperature-related changes in the vapor pressures of small molecules in resin are two possible explanations. The correlation could also be explained by temperature-related changes in gas solubility in resin: an increase in temperature decreases the solubility of for example, nitrogen (N2), oxygen (O2), and carbon dioxide (CO2) in liquids, which increases the size of gas bubbles within the liquid, and thus its total volume. Understanding the different environmental effects on resin dynamics in different conditions might help in foreseeing the challenges posed on tree defense in changing environmental conditions, for example, due to altered patterns of rainfall and temperature.
Second, although the diurnal dynamics of resin pressure have been studied in a few different environments, not much is known about resin dynamics over longer periods. Even though the diurnal dynamics of resin pressure follows temperature in the boreal environment (Rissanen et al., 2016), in the longer term it may also be affected by soil and tree water potential.
Third, resin pressure does not only vary with time, but also from tree to tree (Bourdeau and Schopmeyer, 1958; Vité, 1961; Vité and Wood, 1961; Rissanen et al., 2016). Tree-level variation also occurs in resin composition (Marpeau et al., 1989; Latta et al., 2000, 2003), but the relation between resin composition and pressure has not been investigated to our knowledge. Resin contains an average 75% of resin acids and 25% of monoterpenes, with minor concentrations of several sesquiterpenes (Smith, 2000). Both the monoterpene spectrum and the relation of the volatile to non-volatile part in the resin vary largely between conifer species (Santamour, 1965; Smith, 2000) and even between individuals of the same species (Marpeau et al., 1989; Latta et al., 2000). Resin composition and its monoterpene spectrum are considered genetic traits (Muona et al., 1986; Latta et al., 2000), but they can also vary due to various abiotic and biotic stresses, along with tree age and phenology (e.g.,Hodges and Lorio, 1975; Russell and Berryman, 1976; Litvak and Monson, 1998; McKay et al., 2003; Turtola et al., 2003; Thoss and Byers, 2006).
Finally, although resin forms a large monoterpene pool, only a few studies have addressed its effect on monoterpene emissions from conifer trees and ecosystems (Haapanala et al., 2012; Kivimäenpää et al., 2012; Eller et al., 2013; Flores and Doskey, 2015; Rissanen et al., 2016). Understanding the variation in resin composition between trees and the effect of resin on monoterpene emissions at the tree level would help to interpret the tree-to-tree variation in monoterpene emissions. Comprehension on the range of tree-to-tree variation in monoterpene emissions may enable refining the models of ecosystem-scale fluxes, which often rely on one single tree chemotype or even on one single monoterpene compound.
We used detailed field measurements in a boreal conifer stand to (1) determine the dependency of resin pressure on temperature at a diurnal time scale and the dependency on temperature and soil water potential over the growing season, (2) quantify the tree-to-tree variation in resin monoterpene composition within one Scots pine population, and (3) analyze relations between resin composition and pressure, and monoterpene emissions spectra of the shoots.
Materials and Methods
The study was conducted in summer 2017 at the SMEAR II measurement station (Station for Measuring Ecosystem-Atmosphere Relations) in Hyytiälä, southern Finland (61°51′N, 24°17′E, 181 m above sea level) (Hari and Kulmala, 2005). The site is an approximately 55-year-old managed boreal Scots pine (Pinus sylvestris L.) forest stand of medium fertility, established by sowing, with an annual mean temperature of 3.5°C and annual precipitation of 711 mm (Ilvesniemi et al., 2010; Pirinen et al., 2012). During our measurements, the mean temperature varied between 12.2 and 15 °C and relative humidity (RH) between 66 and 83%. Precipitation sum in June was 119 mm, in July 85 mm and in August 117 mm.
Resin Pressure Measurements
From June to August 2017, we recorded resin pressure in Scots pine stems continuously using six pressure transducers (Gems Sensors 3100, Plainville, USA). Two of the transducers were attached to the same pine (Tree 1): one was installed at the bottom of the stem, at a height of 1–1.5 m, and the other at the top of the stem, approximately 12–13 m from the ground. The top transducer was inside the living canopy, which was reached using a scaffold tower. The other two transducers were installed similarly, but the measured tree was switched in early August (from Tree 2 to Tree 3). In both trees, the top transducer was just below the living canopy at 9 to 10 m from the ground, which was reached using a scaffold tower, and the bottom transducer was at a height of 1–1.5 m. Two additional transducers were rotated among seven other trees in the study (Trees 4–10), with the installation changed approximately every second week, and these transducers were always installed to measure the bottom half of the stem (at a height of 1.3–6 m from the ground). See the measurement times of each tree in Table 1. The transducers were installed to the side of the stem that was available from the scaffold tower, thus the side varied slightly between trees. In total, we recorded resin pressure in 10 Scots pines, four of which were always measured simultaneously.

Table 1. Information on which trees were used for continuous resin pressure measurement, for point resin pressure measurements and for sampling of resin and shoots for monoterpene analyses.
Installation of the pressure transducers followed the procedure in Rissanen et al. (2016), modified from Vité (1961). We attached a pressure transducer to each tree by boring a small hole (diameter 3 mm, length approximately 5 cm) slightly tangentially through the bark to the xylem. A thin steel tube (diameter 3.18 mm) was inserted into the hole and connected to a pressure transducer. Prior to tube installation, we filled the hole, tube, and empty space in the transducer with glycerin that transmitted the pressure changes of the resin and flushed air out from the system. We sealed the tube-stem interface with silicone and the small quantity of resin that leaked and crystallized after installation was also a good seal.
Due to eventual crystallization of resin also within the hole and tube, we relocated the pressure transducers approximately every 2 weeks. These 2 weeks are referred to as measuring periods. After installation of a resin transducer, resin pressure initially increased rapidly during the first 24 h. We recorded the resin pressure 24 h after installation to compare between different trees. However, because of this large peak, we omitted the first 36 h of data from the analysis of resin pressure dynamics. Pressure showed a clear decreasing trend after the first 36 h; in addition, the variation in daily values diminished. Along with the natural trends in resin pressure, the resin crystallization in the tube may degrade the measured signal. For comparing modeled and measured daily relations between temperature and resin pressures retaining the long-term trend was irrelevant, thus, we de-trended the measured resin pressure by subtracting a five-day moving average from the original signal (Figure S1). For other analysis, we made no corrections to the data, because with our measurement set-up we could not define which part of the trend was related to tree defense or other natural trends, and which part originated from crystallization. We omitted data where resin pressure was below 0.5 bars, because in such cases the observed daily variation in resin pressure was very small (Figure S1).
In addition to the automated measurements, we conducted point measurements of resin pressure in five additional Scots pines with a corresponding set-up, but using manual pressure gauges (Wika 111.16.40.16, Klingenberg, Germany) in August 2017 (Table 1). In these measurements, we recorded the peak resin pressure 24 h after gauge installation. The pressure gauges were always installed at a height of 1.3 m and on the north side of the stem. If the pressure was below one bar and without diurnal variation 24 h after installation, the measurement was classified as unsuccessful and not used in further analyses.
Monoterpenes in Resin and Shoot Emissions
To analyze resin chemical composition, we collected small resin samples from a total of 16 Scots pines, two samples per tree. The sample trees included six pines used in the continuous resin pressure measurements, the five pines used in the point resin pressure measurements and five additional pines (Table 1). Their diameters at breast height were approximately 12–20 cm. The samples were collected in August 2017 at a height of 1.3 m and on the northern side of the stem, and the collection site was separated from the resin pressure measurement location by at least 10 cm. We first punched a 6-mm hole through the bark of the tree to the xylem surface. First resin drops appeared on the cut surface within seconds from the punching. From these drops, we collected with a small spatula two resin samples [~3 mg (0.9–13.6 mg)] into separate pre-weighed 10-ml glass vials. Immediately upon the collection, we closed the vials to preserve as much of the volatile monoterpenes as possible and stored them in a cooled box (+ 8°C) until weighting. In case enough resin did not appear within a minute after the punching, we plugged the hole with a clean piece of wood covered with PTFE tape and returned to sampling after 10–30 min. Within an hour from the resin collection, we weighted the vials for calculating the sample masses. Then, the resin duplicates were dissolved in heptane and measured using gas chromatography-mass spectrometry (GC-MS). The volume injected into the GC-MS was 1μl. Decane-d22 was used as the internal standard. The samples were temporarily stored and transported to the laboratory in liquid nitrogen. In the laboratory, the samples were stored at a temperature of −20°C prior to analysis.
Resin composition and concentration measurements of the target analytes were performed using an Agilent 6890 N gas chromatograph equipped with an Agilent 5975 mass selective detector (Agilent Technologies, Palo Alto, CA, USA). The analytical column was an HP-5MS (30 m × 0.25 mm × 0.25 μm, Agilent Technologies, Palo Alto, CA, USA). The initial oven temperature was set at 40°C (1.5 min), and it was increased to 160°C at a rate of 5°C /min and subsequently to 250°C (1.5 min) at 30°C /min. The total run time was 30 min. Helium (99.996%, AGA, Espoo, Finland) was used as a carrier gas in a constant flow mode (1.2 mL/min). Due to the high variation in the relative concentrations of the analytes and occurrence of detector saturation for the most abundant analytes, samples were measured both in splitless mode (2 min) and split mode (5:1) for liquid injections. A 2.0-mm internal diameter (i.d.) split/splitless inlet liner and a standard inlet septum were used. The temperature of the GC-MS transfer line was 250°C and the ion source and quadrupole temperatures were kept at 230 and 150°C, respectively. Electron ionization (70 Ev) was employed as the ionization method. The scan mass range was 25–250 amu. The mass spectra and retention times of each analyte were obtained with standard solutions and used for the identification of studied compounds in the collected samples. Extracted ion chromatograms with base ions were used for quantitation. We used results from split mode measurements in the further analysis to obtain reliable relative abundance estimates of the most abundant compounds.
To measure the monoterpene composition in shoot emissions of the test trees, we followed the procedure described by Bäck et al. (2012). In August 2017, we collected shoots from the same 16 pines that were used for resin sampling (Table 1). In contrast to Bäck et al. (2012), we could not reach the upper canopy due to the growth of the trees. Thus, we sampled shoots that appeared intact and vital from the lower canopy by using a long pole tree branch cutter. After collection, the shoots were stored in airtight bags and in the dark at +4°C for 1 week. During that time, the resin on the cut end of the shoot crystallized. For monoterpene emissions sampling, we placed the shoots gently into 30 x 30-cm FEP foil bags. We pumped filtered (active carbon trap and manganese dioxide-coated copper net) laboratory room air though the bag at a rate of 0.2 l/min and led sample air into Tenax TA Carbopack B adsorbent tubes both from incoming and outgoing air at rates from 0.50 to 0.1 l/min. The tubes were stored at +4 °C for approximately 1 week and then analyzed using a thermal desorpter (PerkinElmer TurboMatrix 650, Waltham, USA) connected to a gas chromatograph (PerkinElmer Clarus 600, Waltham, USA) and a mass spectrometer (PerkinElmer Clarus 600T, Waltham, USA). The analysis results were calibrated using six standard solutions consisting of various concentrations of the studied analytes. The emissions were calculated as the difference between the concentrations in incoming and outgoing sample air multiplied by sample airflow. For more information on the chromatographic method and calculations, see Aaltonen et al. (2011) and Mäki et al. (2017). The emissions from each shoot were standardized to the dry mass of the shoot. Temperature normalization was not performed, because all the sample shoots were stored and measured in similar conditions and their emissions were thus intercomparable.
Temperature Effects on Resin Pressure
The thermal expansion of a liquid can be measured by warming the liquid in a narrow tube or capillary and recording changes in the surface level. In this study, we tested this approach for measuring the thermal expansion of resin, but resin is difficult to handle in small volumes due to its viscosity. In addition, small gas bubbles that appeared within the resin affected the measured thermal expansion. Thus, to gain a more reliable estimate, we modeled the density of three different simplified resin mixtures at temperatures from 0 to 40°C in steps of five degrees (°C) using the COSMOtherm software. COSMOtherm is a software for calculating and predicting liquid properties, based on the COSMO-RS (COSMOtherm, 2008) (COnductor-like Screening Model for Real Solvents) theory (Klamt et al., 1998). Further information on the methods in COSMOtherm software and COSMO-RS theory is presented in the Supplementary Material (Part 4).
The simplified resin mixtures used in the resin density modeling had low, intermediate, and high monoterpene fractions (Table 2), and they were composed based on the analyzed resin samples (Table S1). This was done by choosing the four most abundant monoterpenes and two most abundant sesquiterpenes present in the analyzed resin samples and approximating their mole fractions based on their mass fractions in the analyzed samples with high, intermediate, and low monoterpene concentrations. For the resin mixture with a high monoterpene fraction, we further increased the proportions of α-pinene and Δ3-carene to create a larger difference between the mixtures. The estimated total fraction of resin acids was based on the total monoterpene fraction assuming that resin consists only of monoterpenes, sesquiterpenes and resin acids, and the most abundant resin acids and their proportions were based on literature on Scots pine wood (e.g., Nerg et al., 1994; Turtola et al., 2003; Hovelstad et al., 2006). The thermal expansion coefficient of resin (αresin) was calculated from the resin density change separately for each temperature step based on Equation 1
where Δρ is the calculated change in resin density from low temperature to high temperature, ρ is the calculated initial density of resin, and Δ°C is the change in temperature.
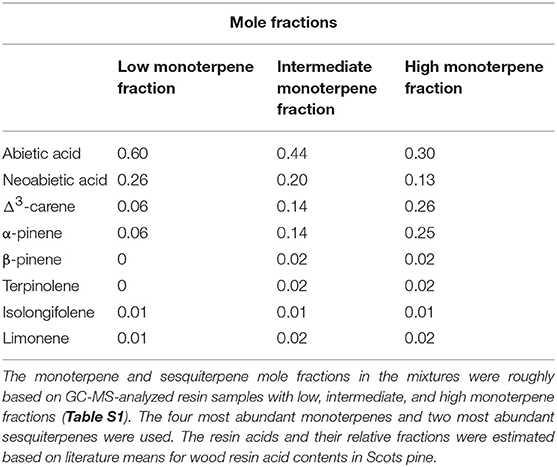
Table 2. Simplified resin mixtures used in COSMOtherm modeling.
Due to the bubbles visible in the resin when the samples were heated, we wanted to estimate the solubility of gases in the resin at various temperatures and the subsequent changes in bubble and total resin volume. For that purpose, N2, O2, and CO2 solubilities in resin were modeled as mol (gas)/ m3 of resin using COSMOtherm and the same three resin mixtures and temperature steps as in the resin density modeling. We assumed that when the solubility of the gases in resin decreased, the outgassed volume of gas turned into bubbles, increasing the total volume of the resin according to the ideal gas law. The change in resin volume due to the gas solubility effect was calculated for each temperature step and each gas based on Equation 2 and weighted by the proportion of gas molecules in the total gas concentration.
where αbubble, resin is the change in resin volume (due to change in bubble volume) per change in temperature, Δs/ΔT is the change in solubility of CO2, N2, and O2 in a unit volume of resin per a unit change in temperature, R is the ideal gas constant (8.314), T is temperature (K), and patm is the ambient air pressure (assumed an unchanging 101.325 KPa). The actual pressure in the bubble is the pressure of resin rather than ambient air pressure, but because resin pressure would already be used in calculating the change in solubility (Δs), in the final form of the calculations it gets removed. The complete calculation of change in resin volume per temperature change due to an increase in bubble volume is explained in detail in the Supplementary Materials (Part 3). In the end, the proportions of each gas were summed, and the sum used for calculating the effect on resin pressure. As O2 and CO2 quantities can vary substantially in the tree stems, we used two concentration scenarios for their proportions based on xylem gas composition estimates made for Norway spruce (Eklund, 1990; Etzold et al., 2013): (1) 2% of CO2, 18% of O2 and 80% of N2, (2) 8% of CO2 and 12% of O2, and 80% of N2.
The calculated change in resin volume due to thermal expansion and increase in bubble volume was converted into change in resin pressure with Equation 3.
where ΔOEP is the change in resin pressure (oleoresin exudation pressure) and ε is the elastic modulus of the resin duct. As the elastic modulus of a resin duct is unknown, we used 5 and 10 MPa, which are close to the average elastic modulus of plant cells, 10 MPa (Nobel, 2005).
The vapor pressures (mbar) of resin monoterpenes at various temperatures were also modeled for the three resin mixtures and the five degrees steps in COSMOtherm.
Concerning the errors related to COSMOtherm results, the liquid density predictions of COSMOtherm have been found to be accurate to within a few percent (Palomart et al., 2007). However, the mean unsigned deviation of solvation free energies predicted by COSMOtherm is in the order of 0.5 kcal/mol (Klamt, 2018). This implies an approximate error margin of a factor of three for parameters depending exponentially on solvation free energies or their differences such as saturation vapor pressures and solubility.
Other Measurements and Data Analysis
In addition to the above-mentioned measurements, we used data on ambient temperature, relative humidity of ambient air (RH), precipitation, and soil water potential (SWP)in A and B-horizons available at SMEAR II (https://avaa.tdata.fi/web/smart/smear). SWP was measured in four locations over the measurement area with an EQ2 Equitensiometers (Delta-T Devices, Cambirdge, UK) that measures matric potential of the surrounding soil. The data over five locations was averaged for the overall SWP.
To investigate the diurnal relations between resin pressure and temperature, we calculated their Pearson's correlations separately for each tree and each day. We omitted from the analysis days with < 10 data points. We also calculated the approximate median correlation over all the days, but separately for each tree by applying Fisher Z-transformation on the daily correlation coefficients (z' = 0.5[ln(1+r)-ln(1-r)], where r is the correlation coefficient), calculating the median of z'-values and converting the median back to Pearson's correlation coefficient.
To analyze the resin pressure trends at a longer scale and effects of environmental variables on them, we calculated three-day means of all parameters. Pearson's correlations of the three-day means were calculated separately for trees 1 and 2, top and bottom parts between resin pressure, temperature RH, and SWP in the A and B-horizons. Using the three-day means already reduced autocorrelation in the data, but to account for any residual autocorrelation and compare the anomalies from the long-term trend, we removed the trend from resin pressure, RH, temperature and SWP data. This was done by applying a fourth-degree polynomial fit as a function of time and using the residuals of the fit to calculate de-trended three-day means. The Pearson's correlations were calculated also between these de-trended three-day means.
To calculate correlations over all the measured trees, both for the measured and de-trended values, we used rmcorr package of R that applies ANCOVA for computing correlation over repeated measures taking into account the individual differences between measurement subjects (Bakdash and Marusich, 2017). Finally, we investigated the relations between resin pressure, resin composition, and monoterpene emissions from the shoots with Pearson's correlations. For the statistical analysis, we used R version 3.4.4 (the R Foundation for Statistical Computing) and Matlab version R2017b (The MathWorks, Inc.).
Results
Diurnal and Day-to-day Dynamics of Resin Pressure
As expected, the diurnal variation in resin pressure followed the temperature in the measured trees during the measurement season, an example of the relation between resin pressure and temperature is shown in Figure 1. During the decrease in resin pressure, hysteresis could be observed as the pressure decreased further in the evening compared to the similar temperatures in the morning (Figure 1). The daily correlation coefficients between resin pressure and temperature varied largely (Figure 2), the lowest correlations values being on the days when resin pressure was decreasing rapidly 1 or 2 days after the pressure transducer installation (not shown). Approximate median daily correlation between the resin pressure and temperature varied from 0.29 to 0.90, depending on the tree (Figure 2).
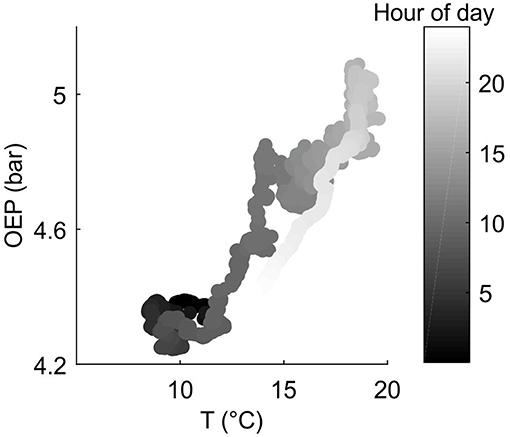
Figure 1. Example on the relation between measured oleoresin exudation pressure (OEP) at the top part of Tree 1 stem (Scots pine) and ambient temperature at SMEAR II station on 9.6.2017.
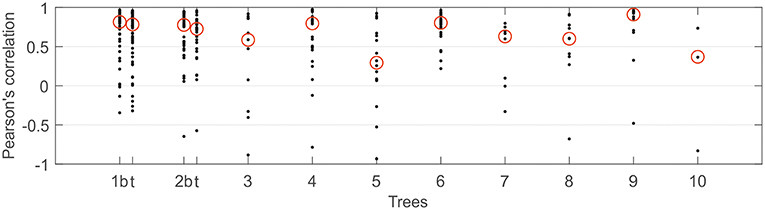
Figure 2. Daily Pearson's correlation coefficients between resin pressure and temperature per each continuously measured Scots pine tree at SMEAR II station in 2017. Approximate median value over the correlation coefficients highlighted with a red circle. With trees 1 and 2, t presents results from top part of stem and b from bottom part of stem.
In addition to diurnal dynamics, we observed similar, generally decreasing long-term resin pressure trends in the bottom parts of the stems over the studied season from June to August (Figure 3). However, the trends in resin pressures differed between the top and bottom parts of the stem (Figure 3).
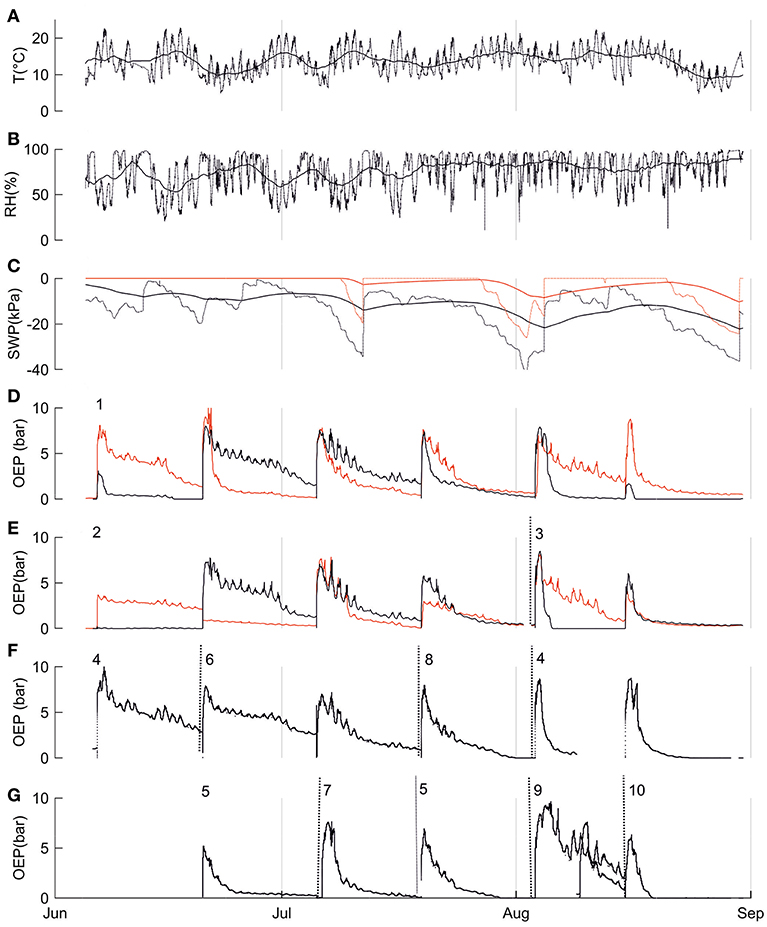
Figure 3. Environmental and physiological parameters from the SMEAR II site and three mature Scots pines (Trees 1, 2, and 3) in summer 2017. In A-D: (A) ambient temperature at 16 m, (B) relative humidity at 16 m, (C) soil water potential of the A horizon (black line) and B horizon (red line). Solid lines in (A-C) represent five-day means; dotted lines represent the diurnal dynamics. In (D-G) oleoresin exudation pressures (OEP) of trees indicated with numbers (D) OEP in the top (red line) and bottom parts (black line) of the stem of Tree 1, (E) OEP in the top (red line) and bottom parts (black line) of the stem of Tree 2 until the end of June and Tree 3 in August (change marked with dotted line), (F) OEP in the bottom parts of trees 4, 6, and 8, change of the measurement tree indicated with dotted line, (G) OEP in the bottom parts of trees 5, 7, 9, and 10, change of the measurement tree indicated with dotted line, Note: OEP increased abruptly whenever the pressure transducer was relocated (relocation was done due to resin crystallization), referring to measurement periods.
Despite its importance in determining the diurnal variation in resin pressure, temperature had a weaker relation with the day-to-day trends in resin pressure. The relations between three-day means of resin pressure and ambient temperature were generally negative, and the negative correlations were significant over all the trees and in the bottom parts of Trees 1 and 2 (Table 3; Figure 4). Between the de-trended values of resin pressure and temperature, no significant correlations were found. RH also generally had a negative relation with the three-day means of resin pressures, the negative correlation being significant over all the trees (Table 3; Figure 4). Between the de-trended values of RH and resin pressure, we found a positive correlation in Tree 2 top part, but negative correlations in Tree 1 both top and bottom part (Table 3). The relations between SWP and three-day means of resin pressures were generally positive, the positive correlations being significant between SWP in B-horizon and resin pressure in Tree 1 top part and over all the trees (Table 3; Figure 4). Applying de-trending showed significant positive correlations between SWP in A-horizon and resin pressure in Tree 1 top part, and SWP in B-horizon and resin pressure in top part of Tree 2 (Table 3).
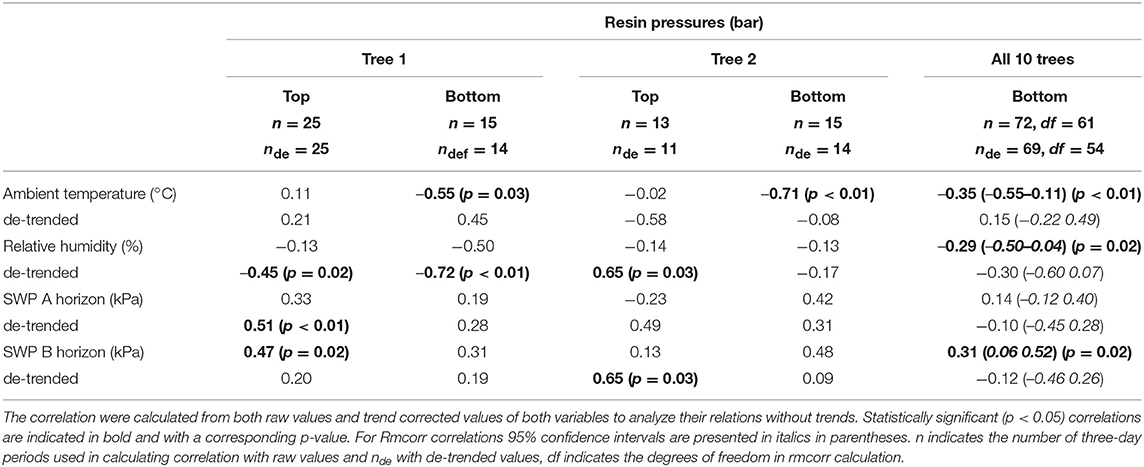
Table 3. Pearson's correlation coefficients between three-day averages of resin pressure (Trees 1 and 2, top and bottom part of stem) and repeated measures correlations (Rmcorr) over the ten measured trees (bottom parts), and ambient temperature, relative humidity and soil water potentials (SWP).
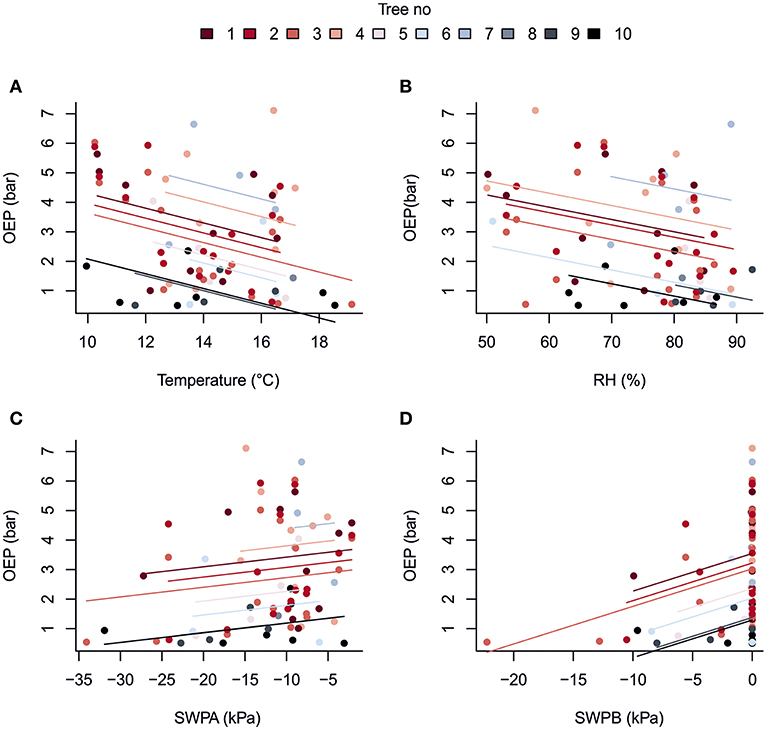
Figure 4. Repeated measures correlation for the overall relationship between three-day averages of oleoresin exudation pressure (OEP) measured two or more times in ten mature Scots pines and (A) ambient temperature at 16 m, (B) relative humidity at 16 m, (C) soil water potential in A horizon and (D) soil water potential in B horizon at the SMEAR II station in summer 2017.
The large confidence intervals in the rmcorr correlations indicated that the slopes between three-day means of resin pressure and the environmental variables are not necessarily the same between each studied tree. These differences could be accounted for in mixed effect modeling that could bring more power to the analysis, but we were unable to reliably conduct that analysis due the small number of data points for trees 3–10.
Modeling the Short-Term Temperature Dependence of Resin Pressure
To explain the temperature dependence of resin pressure, we estimated the impacts of: (1) thermal expansion of resin, (2) changes in gas solubility in resin, and (3) vapor pressure of resin monoterpenes, with the help of COSMOtherm modeling.
The thermal expansion of resin, calculated based on estimated resin density at temperatures from 5 to 40°C (278.15 to 313.5 K), averaged 9.98 × 10⁻⁴ 1/°C, corresponding to a volume increase of 0.1% per one degree (°C). The thermal expansion coefficient increased with increasing temperature. The monoterpene fraction of the resin mixture (Table 2) had only a negligible effect on thermal expansion (Table S2), so we used the value of the intermediate monoterpene fraction.
To further analyze the effects of temperature, we also calculated the change in resin volume due to changes in estimated gas solubility. Again, the monoterpene fraction of the resin mixture had only a negligible effect on gas solubility (Tables S3–S6), and thus we used the value from the intermediate monoterpene fraction. Based on our calculation, the decreasing solubility of N2, O2, and CO2 and the subsequently increasing bubble volume within the resin as a function of temperature caused an average increase of 0.2% or 0.4% in the volume per one degree (°C) with a low (2%) or high proportion of CO2 (8%), correspondingly. Opposite to thermal expansion, the rate of increase in resin volume due to gas solubility decreased with temperature.
Lastly, the estimated monoterpene vapor pressure increase as a function of temperature was 0.06–0.37 mbar/°C for a resin mixture with a high monoterpene fraction and 0.03–0.16 mbar/°C for a low monoterpene fraction (Table S7). Thus, the effect of vapor pressure was negligible in explaining the resin pressure dynamics and the tree-to-tree variations of resin pressure.
In total, the combination of thermal expansion of resin and gas solubility could explain the diurnal variation in resin pressure assuming an elastic modulus of resin ducts of approximately 5 MPa (Figure 5). A higher elastic modulus yielded an overestimation of the temperature effect. Because we did not directly measure the gas composition of the wood or resin, and proportions of O2 and CO2 can vary largely within a tree stem, we used two gas concentration scenarios based on the literature with a small and large CO2 proportion. The CO2 proportion had a large impact on the estimate: the difference between the results of the two CO2 scenarios could be up to 0.5 bars (Figure 5). The observed positive daily relation between resin pressure and temperature was close to linear but varied slightly between days and trees (Figure 6). The thermal expansion coefficient increased with increasing temperature, and the gas solubility effect decreased with increasing temperature, thus, the total modeled effect of temperature was slowly saturating (Figure 6). The scenario with a low CO2 concentration (2% of total gases in resin solution) and a low elastic modulus of the resin duct (5 MPa) was closest to the temperature effect on resin pressure. However, the estimated pressure that is solely based on thermal expansion and gas solubility cannot account for the decrease in resin pressure and in the daily resin pressure range toward the end of the measurement period.
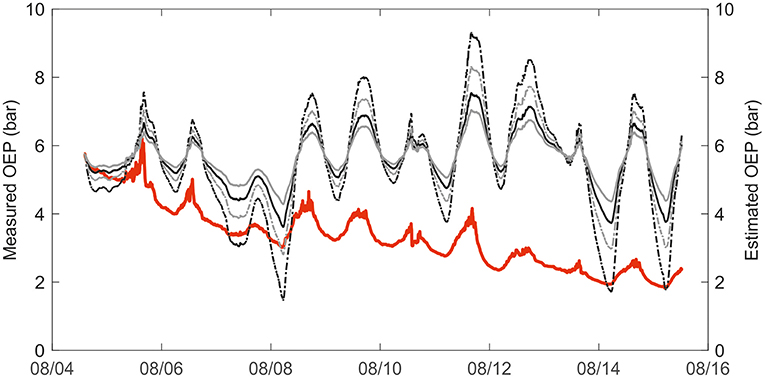
Figure 5. Measured oleoresin exudation pressure (OEP) in a mature Scots pine (Tree 1) in 2017 compared to modeled resin pressure, based on thermal expansion and gas solubility in resin. Measured OEP in solid red. Estimated OEP with high CO2 concentration (8%) and elasticity coefficient 5MPa in solid black line, and with high CO2 concentration (8%) and elasticity coefficient 10 MPa in dashed black line. Estimated OEP with low CO2 concentration (2%) and elasticity coefficient 5 MPa in solid gray line, and with low CO2 concentration (2%) and elasticity coefficient 10 MPa in dashed gray line.
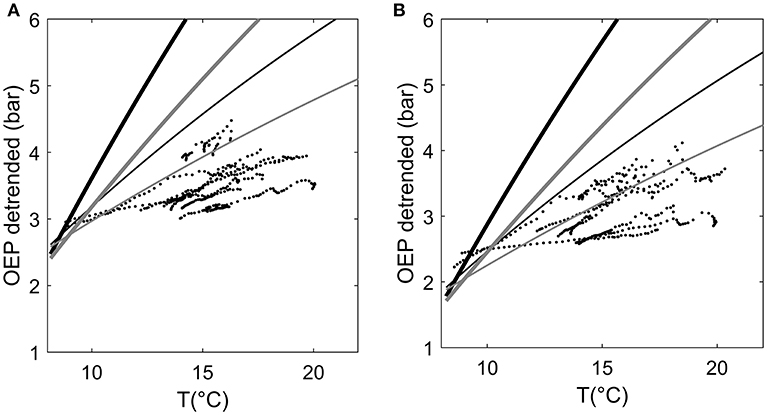
Figure 6. 10-min averages of de-trended oleoresin exudation pressure (OEP) (decreasing trend removed by subtracting running 5-day average) in two Scots pines as a function of ambient temperature during morning and afternoon hours (from 6:00 to 14:00), August 4–16 2017. (A) stem top of Tree1 and (B) stem top of Tree 3. Lines present the OEP that could be expected based only on the thermal expansion and gas solubility of resin. Black lines represent a model scenario with high CO2 content in resin (8% of total gases) and gray lines a scenario with small CO2 content (2%). Thick lines represent a model scenario where the elastic modulus of a resin duct is 10 MPa, and thin lines a scenario where the elastic modulus is 5 MPa.
Tree-to-tree Variation in Resin Pressure, Resin Composition, and Monoterpene Emissions From Shoots
In addition to the temporal variation, resin pressures varied between the measured trees. In August 2017, resin pressures 24 h after the pressure transducer installation varied from 1.6 to 6.8 bar in the 10 measured trees. Resin composition also varied between trees (Table S1). The volatile part of resin was composed of monoterpenes (6.2–34.7% of the resin mass) and sesquiterpenes (0.07 to 0.3% of the resin mass), and we did not detect traces of any smaller molecules (e.g., isoprene). We expected the rest (65–94%) of the resin mass to be composed of resin acids, but they were not analyzed in this study. A-pinene (24–62% of monoterpenes) and Δ3-carene (0.5–66% of monoterpenes) were the main resin monoterpenes (Figure S2B). In two of the studied trees, β-pinene was also a major component (31–46% of monoterpenes) (Figure S2B). In addition, resin contained smaller quantities of limonene, terpinolene, camphene, and p-cymene. Several sesquiterpenes were also quantified, including aromadendrene, iso-longifolene, and β-carophyllene. However, a large part of the detected sesquiterpenes were not identified using authentic standards, and thus were not quantified in this study.
The monoterpene spectra in the shoot emissions were also dominated by α-pinene and Δ3-carene (Figure S2A). Although the proportions of α-pinene and Δ3-carene in resin were nearly equal (40–45%), their proportions in shoot emissions could vary from 10% or 20% to 80% of the total emissions (Figure S2). Yet, especially β-pinene proportions correlated between resin monoterpene content and shoot emissions (r = 0.88, p < 0.001, respectively). The correlations between other monoterpenes were also positive but non-significant (not shown).
Although resin monoterpene fraction or composition had negligible effects on resin pressure dynamics through thermal expansion or gas solubility we found certain positive correlations between the resin compositions and resin pressures of different trees. We observed a positive, yet not quite significant correlation between α-pinene content in resin and resin pressure measured 24 h after installation of the pressure transducer (r = 0.61, p = 0.06) (Figure 7A). The correlation between total monoterpene content and resin pressure after 24 h from pressure transducer installation was also positive, but non-significant (r = 0.57, p = 0.08) (Figure 7B). A positive correlation was observed also between resin pressure 24 h after transducer installation and Δ3-carene emissions from shoot samples (r = 0.73 p = 0.016) (Figure 7C) and a positive, yet not quite significant correlation between resin pressure and terpinolene emissions from shoot samples (r = 0.62 p = 0.054) (Figure 7D). Correlation between the resin pressure measured 24 h after pressure transducer installation and the total monoterpene emissions from shoot samples was also positive and significant once one outlier tree was omitted (r = 0.71 p = 0.03) (Figure 7E).
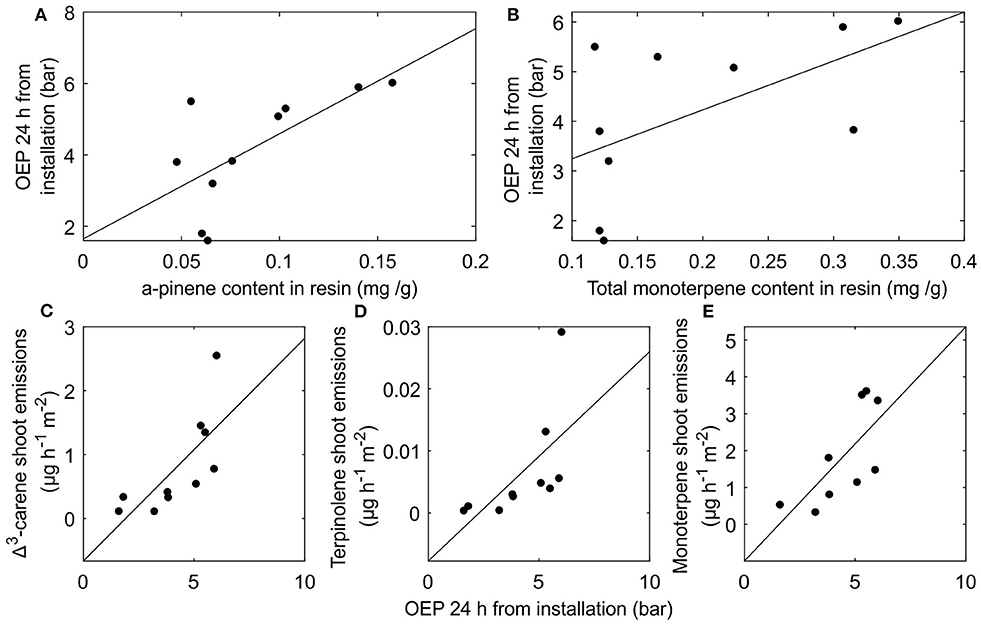
Figure 7. The interrelations between stem resin composition, oleoresin exudation pressure (OEP), and shoot monoterpene emissions Scots pine trees. (A) correlation between α-pinene content in resin and OEP 24 h after pressure transducer installation (B) correlation between total monoterpene content in resin and OEP 24 h after pressure transducer installation (C) correlation between OEP 24 h after pressure transducer installation and Δ3-carene emissions from shoots (D) correlation between OEP 24 h after pressure transducer installation and terpinolene emissions from shoots and (E) correlation between OEP 24 h after pressure transducer installation and total monoterpene emissions from shoots with one outlier tree removed.
Discussion
Diurnal and Day-to-Day Dynamics of Resin Pressure
We found that the day-to-day resin pressure dynamics in a boreal Scots pine forest over the growing seasons were generally positively connected to SWP whereas temperature was the main driver at the diurnal scale, as observed earlier (Rissanen et al., 2016). These results shed new light on resin pressure dynamics in humid boreal condition and the causal relationships between tree physiology and physical factors of the environment.
The average SWP during three-day periods correlated generally positively with resin pressure These results are in line with the effects of tree water relations reported by e.g., Vité (1961); Lorio and Hodges (1968); Helseth and Brown (1970) and Neher (1993), although our results do not apply at a diurnal scale. At the structural level, the soil water potential can influence the resin pressure through the tree water potential in two ways: (1) increasing soil water availability increases turgor pressure in the epithelial cells lining resin ducts and may increase resin pressure (Vité, 1961), and (2) expansion of the tracheids following high soil water potentials and high tree water potential may increase the pressure exerted on resin ducts and consequently resin pressure (Helseth and Brown, 1970 and Neher, 1993). Although with certain individual trees the positive relation between SPW and resin pressure three-day means seemed stronger when only anomalies were compared, over all the trees, the relation was generally stronger when the trends in both resin pressure and SWP were included.
Although SWP appeared to have a small positive effect on day-to-day trends in resin pressure, most likely through tree water potential, air humidity (RH) was over all negatively related to the resin pressures at a day-to-day scale. RH also appeared to be connected to resin pressure more through anomalies than the trend; although less significant, the negative correlation coefficient over all the trees was slightly larger when using de-trended values and the negative correlations for individual trees were also stronger between the de-trended values. The stronger relations between the anomalies as well as the generally small impact of RH could be explained the confounding effects of temperature, since it affects both resin pressures and RH, and the relatively high soil water content throughout the measurement summer. Lorio and Hodges (1968) found that vapor pressure deficit had a strong effect on resin pressure when soil water content was low, but a weaker effect when soil water content was high (Lorio and Hodges, 1968). Thus, potentially larger effects of air humidity as well as SWP might have been detected during a drier year. During our study period, summer 2017, the regional precipitation exceeded the long-term average by approximately 100 mm.
Although at a day-to-day scale, temperature had a negative effect on the trends of resin pressure it was the major positive driver for resin pressure at the diurnal scale, as reported earlier (Rissanen et al., 2016). We suggest that the thermal expansion of resin and changes in the resin solubility of gases (N2, O2 and CO2) and the subsequent variation in resin bubble volume are the major reasons for the strong short-term temperature dependence of resin pressure. According to our modeling results, if the elastic modulus in a resin duct is approximately 5 MPa, these two effects cover the entire range of diurnal variation in resin pressure.
The possible error related to the calculation of gas solubility in resin is rather large and it does not include the possible effect of resin monoterpenes evaporating into the gas phase of the bubbles, though this is expected to be minor due to the low saturation vapor pressure of the monoterpenes. The formation and behavior of such bubbles in resin have not been analyzed before, thus our result of their contribution to resin pressure dynamics remain somewhat tentative. On the contrary, the error related to calculation of the thermal expansion of resin is small (Palomart et al., 2007) and can be expected to strongly contribute to the temperature dependence of resin pressure at a short time scale. The vapor pressure changes in resin monoterpenes were negligible in explaining short-term resin pressure dynamics.
The effect of temperature on the diurnal dynamics of resin pressure in humid, boreal forest is probably overruling the inverse effects of tree water potential due to the relatively moist soil and generally low vapor pressure deficit, which do not provoke sufficiently large responses in the epithelial cell pressures to affect resin pressure. The difference between moist and a drier environment can also be seen in the different daily ranges in resin pressures, as suggested by Vité (1961): in this study, the daily range of resin pressure was approximately from 0.5 to 1 bar, whereas Lorio and Hodges (1968) reported a range of approximately 4 bar in Louisiana, southern USA.
In continuous measurements of resin pressure during several days, the crystallization of resin within the measurement system degrades the measured resin pressure signal. This poses difficulties for analyzing the long-term trends of resin pressure, as the actual trends and trends caused by the signal degradation cannot be explicitly separated. Aiming at keeping as much of the actual trends of resin pressure as possible, we decided not to do trend corrections to the data when analyzing longer-term trends. This workflow might have led to weaker relations between the explanatory variables and resin pressures than the relations that could be observed with an ideal measurement system. Yet, we are confident that the overall trends in resin pressure were presented adequately with our methods, as they were repeated over the different measured trees both at a diurnal and day-to-day scale. Some imprecision also yields from the fact that although SWP is measured in five locations of the forest, the soil conditions are so heterogeneous that the average of these values does not necessarily describe the water potential near the roots of the studied trees. However, as we study the effects of soil water potential on the resin pressure at a time scale of days, we assume that small-scale imprecision does not affect the overall trends and correlations we found.
Tree-to-Tree Variation in Resin Pressure, Resin Composition, and Monoterpene Emissions From Shoots
Although we did not observe considerable effects of resin composition on resin pressure dynamics, certain interesting interrelations existed in the tree-to-tree variation of resin pressures, resin compositions, and shoot-scale monoterpene emissions. On one hand, resin pressures of the different trees were related to the total quantity of monoterpenes and especially to the α-pinene quantity in their resin. On the other hand, especially the emissions of Δ3-carene and terpinolene from the sampled shoots appeared to be related to the resin pressure of the tree.
Since the COSMOtherm models indicated only a very small impact of the total amount of monoterpenes in resin on the temperature sensitivity of resin pressure, it is unlikely that the observed differences between the monoterpene content or monoterpene spectrum in resin samples could explain the tree-to-tree differences in measured resin pressures. However, if resin pressure in the stem is indicative of the resin pressure in shoots, the resin pressure could directly increase monoterpene emissions from the shoots by enhancing their diffusion out from the resin ducts.
These relations between resin pressure, its composition and shoot monoterpene emissions can also be consequences of stress events in the life of the trees. Trees that have experienced stresses often in the past have increased resin production (Ruel et al., 1998; Lombardero et al., 2000; Martin et al., 2002; Knebel et al., 2008) and more resin ducts (e.g., Fahn and Zamski, 1970; Nagy et al., 2000). Thus, they could also have increased resin pressure. They may also produce more of certain terpenes, such as α-pinene, β-pinene, camphene, Δ3-carene, and β-phellandrene (Marpeau et al., 1989; Rocchini et al., 2000; Zeneli et al., 2006), and thus maintain higher shoot and stem emissions (Heijari et al., 2011). The type and severity of stress factors, in addition to the baseline differences between the trees probably contribute to the observed tree-to-tree variation in both resin dynamics and monoterpene emissions that we also observed.
The monoterpene spectrums in the resin samples and shoot emissions roughly corresponded to each other at a population level, although tree-to-tree variation in the monoterpene spectrum was smaller in resin than in shoot emissions. For example, the large differences in α-pinene and Δ3-carene abundances in shoot emissions, also reported earlier by Bäck et al. (2012), were not clear in the resin samples. These differences between stem resin and shoot emissions may be expected because resin composition can differ slightly between the shoots and stem even within one tree (Hanover, 1992; Thoss and Byers, 2006) and the different compounds have differing diffusion rates from the resin pool to ambient air (Tingey et al., 1991; Widhalm et al., 2015), which skews the emissions patterns in relation to the pool. In addition, shoots emit certain monoterpenes directly from de novo synthesis, which to some extent decouples emissions from pool composition (Ghirardo et al., 2010; Harley et al., 2014). To more precisely investigate the local interrelations between the compositions resin and shoot emission, resin could be sampled from the shoots.
Conclusions
We suggest that in moist boreal conditions where soil water and vapor pressure deficit are not limiting factors, temperature controls the diurnal dynamics of resin pressure because of thermal expansion and the increased volume of gas bubbles caused by decreased gas solubility. Yet, rather than temperature, the day-to-day trends of resin pressure are connected to the effects of soil water potential. To gain a better view on why the humidity effects on diurnal dynamics of resin pressure are invisible in moist conditions, experiments with moisture manipulations should be conducted. In addition, we found that resin monoterpene composition in stem roughly corresponds to the emissions from shoots, and resin pressure and composition can help to understand the tree-to-tree variation in shoot monoterpene emissions.
Data Availability
The datasets analyzed for this study are available in Supplementary Materials (data from COSMOtherm calculations) and upon request from the corresponding author.
Author Contributions
KR: conception and design, collection and assembly of data, analysis and interpretation of the data, drafting of the article, final approval of the article. TH: conception and design, analysis and interpretation of the data, critical revision of the article for important intellectual content, final approval of the article. LB: conception and design, collection and assembly of data, analysis and interpretation of the data, critical revision of the article for important intellectual content, final approval of the article. NH: analysis and interpretation of the data, critical revision of the article for important intellectual content, final approval of the article. TK: conception and design, obtaining funding, critical revision of the article for important intellectual content, final approval of the article. JB: conception and design, obtaining funding, critical revision of the article for important intellectual content, final approval of the article.
Funding
This study was funded by The Academy of Finland (Center of Excellence program grant 307331; also grants 1266388 and 1303676) and the University of Helsinki Research Foundation. NH thanks the European Research Council (Grant No. 692891-DAMOCLES) for funding.
Conflict of Interest Statement
The authors declare that the research was conducted in the absence of any commercial or financial relationships that could be construed as a potential conflict of interest.
Acknowledgments
The authors wish to thank the staff of SMEAR II station for their work in maintaining and developing the measurements. We also want to thank Mari Mäki and Heidi Hellén for their important advice and help in the gas chromatograph measurements. We thank the CSC IT Center for Science for computing time.
Supplementary Material
The Supplementary Material for this article can be found online at: https://www.frontiersin.org/articles/10.3389/ffgc.2019.00023/full#supplementary-material
References
Aaltonen, H., Pumpanen, J., Pihlatie, M., Hakola, H., Hellén, H., Kulmala, L., et al. (2011). Boreal pine forest floor biogenic volatile organic compound emissions peak in early summer and autumn. Agric. for. Meteorol. 151, 682–691. doi: 10.1016/j.agrformet.2010.12.010.
Bäck, J., Aalto, J., Henriksson, M., Hakola, H., He, Q., and Boy, M. (2012). Chemodiversity of a Scots pine stand and implications for terpene air concentrations. Biogeosciences 9, 689–702. doi: 10.5194/bg-9-689-2012.
Bakdash, J., and Marusich, L. (2017). Repeated measures correlation. Front. Psychol. 8:456. doi: 10.3389/fpsyg.2017.00456
Bourdeau, F., and Schopmeyer, S. (1958). “Oleoresin exudation pressure in slash pine: its measurement, heritability, and relation to oleoresin yield,”in The Physiology of Forest Trees, ed K. V. Thinnmann (New York, NY: Ronald Press Co.), 313–319.
COSMOtherm (2008). Release 18.0.2, COSMOlogic. KG. Version C3.0. GmbH & Co. Available online at: http://www.cosmologic.de
Eklund, L. (1990). Endogenous levels of oxygen, carbon dioxide and ethylene in stems of Norway spruce trees during one growing season. Trees 4, 150–154. doi: 10.1007/BF00225779
Eller, A. S. D., Harley, P., and Monson, R. K. (2013). Potential contribution of exposed resin to ecosystem emissions of monoterpenes. Atmos. Environ. 77, 440–444. doi: 10.1016/j.atmosenv.2013.05.028
Etzold, S., Zweifel, R., Ruehr, N. K., Eugster, W., and Buchmann, N. (2013). Long-term stem CO2 concentration measurements in Norway spruce in relation to biotic and abiotic factors. New Phytol. 197, 1173–1184. doi: 10.1111/nph.12115
Fahn, A., and Zamski, E. (1970). Influence of pressure, wind, wounding and growth substances on the rate of resin duct formation in Pinus halepensis wood. Israel J. Bot. 1970, 429–446.
Flores, R. M., and Doskey, P. V. (2015). Estimating terpene and terpenoid emissions from conifer oleoresin composition. Atmos. Environ. 113, 32–40. doi: 10.1016/j.atmosenv.2015.04.062
Ghirardo, A., Koch, K., Taipale, R., Zimmer, I., and Schnitzler, J.-, Rinne, J. (2010). Determination of de novo and pool emissions of terpenes from four common boreal/alpine trees by 13CO2 labelling and PTR-MS analysis. Plant Cell Environ. 33, 781–92. doi: 10.1111/j.1365-3040.2009.02104.x
Haapanala, S., Hakola, H., Hellén, H., Vestenius, M., Levula, J., and Rinne, J. (2012). Is forest management a significant source of monoterpenes into the boreal atmosphere? Biogeosciences 9, 1291–300. doi: 10.5194/bg-9-1291-2012
Hanover, J. W. (1992). Applications of terpene analysis in forest genetics. New Forest 6, 159–178. doi: 10.1007/BF00120643
Hari, P., and Kulmala, M. (2005). Station for measuring ecosystem-atmosphere relations (SMEAR II). Boreal. Environ. Res. 10, 315–322. doi: 10.1007/978-94-007-5603-8_9
Harley, P., Eller, A., Guenther, A., and Monson, R. K. (2014). Observations and models of emissions of volatile terpenoid compounds from needles of ponderosa pine trees growing in situ: control by light, temperature and stomatal conductance. Oecologia 176, 35–55. doi: 10.1007/s00442-014-3008-5
Heijari, J., Blande, J. D., and Holopainen, J. K. (2011). Feeding of large pine weevil on Scots pine stem triggers localised bark and systemic shoot emission of volatile organic compounds. Environ. Exp. Bot. 71, 390–398. doi: 10.1016/j.envexpbot.2011.02.008
Helseth, F. A., and Brown, C. L. (1970). A system for continuously monitoring oleoresin exudation pressure in slash pine. Forest Sci. Sept. 346–349.
Hodges, J. D., and Lorio, P. L. (1968). Measurement of oleoresin exudation pressure in loblolly pine. For. Sci. 14:75.
Hodges, J. D., and Lorio, P. L. (1975). Moisture stress and composition of xylem oleoresin in loblolly pine Pinus taeda, susceptibility to attack by Dendroctonus frontalis. For. Sci. 21, 283–290.
Hovelstad, H., Leirset, I., Oyaas, K., and Fiksdahl, A. (2006). Screening analysis of pinosylvin stilbenes, resin acids and lignans in Norwegian conifers. Molecules 11, 103–114. doi: 10.3390/11010103
Ilvesniemi, H., Pumpanen, J., Duursma, R., Hari, P., Keronen, P., Kolari, P., et al. (2010). Water balance of a boreal scots pine forest. Boreal Environ. Res. 15, 375–396.
Kivimäenpää, M., Magsarjav, N., Ghimire, R., Markkanen, J., Heijari, J., Vuorinen, M., et al. (2012). Influence of tree provenance on biogenic VOC emissions of Scots pine (Pinus sylvestris) stumps. Atmos. Environ. 60, 477–485. doi: 10.1016/j.atmosenv.2012.07.018.
Klamt, A. (2018). The COSMO and COSMO-RS solvation models. WIREs Comput. Mol. Sci. 8:e1338. doi: 10.1002/wcms.1338
Klamt, A., Jonas, V., Bürger, T., and Lohrenz, J. C. (1998). Refinement and parametrization of COSMO-RS. J. Phys. Chem. A. 102, 5074–5085.
Knebel, L., Robison, D. J., Wentworth, T. R., and Klepzig, K. D. (2008). Resin flow responses to fertilization, wounding and fungal inoculation in loblolly pine (Pinus taeda) in North Carolina. Tree Physiol. 28, 847–853. doi: 10.1093/treephys/28.6.847
Latta, R. G., Linhart, Y. B., Lundquist, L., and Snyder, M. A. (2000). Patterns of monoterpene variation within individual trees in ponderosa pine. J. Chem. Ecol. 26, 1341–57. doi: 10.1023/A:1005471322069
Latta, R. G., Linhart, Y. B., Snyder, M. A., and Lundquist, L. (2003). Patterns of variation and correlation in the monoterpene composition of xylem oleoresin within populations of ponderosa pine. Biochem. Syst. Ecol. 31, 451–65. doi: 10.1016/S0305-1978(02)00176-X
Litvak, M. E., and Monson, R. K. (1998). Patterns of induced and constitutive monoterpene production in conifer needles in relation to insect herbivory. Oecologia 114, 531–540. doi: 10.1007/s004420050477
Lombardero, M. J., Ayres, M. P., Lorio, P. LJr, and Ruel, J. J. (2000). Environmental effects on constitutive and inducible resin defences of Pinus taeda. Ecol. Lett. 3, 329–339. doi: 10.1046/j.1461-0248.2000.00163.x
Lorio, P. L., and Hodges, J. D. (1968). Oleoresin exudation pressure and relative water content in inner bark as indicators of moisture stress in Loblolly pines. For. Sci. 14, 392–398.
Mäki, M., Heinonsalo, J., Hellen, H., and Bäck, J. (2017). Contribution of understorey vegetation and soil processes to boreal forest isoprenoid exchange. Biogeosciences 14, 1055–1073. doi: 10.5194/bg-14-1055-2017
Marpeau, A., Walter, J., Launay, J., Charon, J., Baradat, P., and Gleizes, M. (1989). Effects of wounds on the terpene content of twigs of maritime pine (Pinus pinaster Ait.) - II. Changes in the volatile terpene hydrocarbon composition. Trees 3, 220–226. doi: 10.1007/BF00225355
Martin, D., Tholl, D., Gershenzon, J., and Bohlmann, J. (2002). Methyl jasmonate induces traumatic resin ducts, terpenoid resin biosynthesis, and terpenoid accumulation in developing xylem of Norway spruce stems. Plant Physiol. 129, 1003–1018. doi: 10.1104/pp.011001
McKay, S. A. B., Hunter, W. L., Godard, K., Wang, S. X., Martin, D. M., Bohlmann, J., and Plant, A. L. (2003). Insect attack and wounding induce traumatic resin duct development and gene expression of (-)-pinene synthase in Sitka spruce. Plant Physiol. 133, 368–378. doi: 10.1104/pp.103.022723
Muona, O., Hiltunen, R., Morén, E., and Shawn, D. V. (1986). Analysis of monoterpene variation in natural stands and plustrees of Pinus sylvestris in Finland. Silva Fennica 20, 1-2. doi: 10.14214/sf.a15435
Nagy, N. E., Franceschi, V. R., Solheim, H., Krekling, T., and Christiansen, E. (2000). Wound-induced traumatic resin duct development in stems of Norway spruce (Pinaceae): Anatomy and cytochemical traits. Am. J. Bot. 87, 302–313. doi: 10.2307/2656626
Neher, H. V. (1993). Effects of pressures inside Monterey pine trees. Trees Struct. Funct. 8, 9-Structure.
Nerg, A., Kainulainen, P., Vuorinen, M., Hanso, M., Holopainen, J. K., and Kurkela, T. (1994). Seasonal and geographical variation of terpenes, resin acids and total phenolics in nursery grown seedlings of Scots pine (Pinus sylvestris L.) New. Phytol. 128, 703–713.
Nobel, P. (2005). Physicochemical and Environmental Plant Physiology, 3rd edn. Cambridge, U.S: Academic Press.
Palomart, J., Ferro, V., Torrecilla, J., and Rodríguez, F. (2007). Density and molar volumen predictions using COSMO-RS for ionic liquids. An approach for solvent design. Ind. Chem. Res. 46, 6041–6048. doi: 10.1021/ie070445x
Phillips, M. A., and Croteau, R. B. (1999). Resin-based defenses in conifers. Trends Plant Sci. 4, 184–190.
Pirinen, P., Simola, H., Aalto, J., Kaukoranta, J., Karlsson, P., and Ruuhela, R. (2012). Climatological Statistics of Finland 1981–2010. Finnish Meteorological Institute Reports 2012:1
Rissanen, K., Höltt,ä, T., Vanhatalo, A., Aalto, J., Nikinmaa, E., Rita, H., et al. (2016). Diurnal patterns in Scots pine stem oleoresin pressure in a boreal forest. Plant Cell Environ. 39, 527–538. doi: 10.1111/pce.12637
Rocchini, L. A., Lindgren, B. S., and Bennett, R. G. (2000). Effects of resin flow and monoterpene composition on susceptibility of lodgepole pine to attack by the Douglas-fir pitch moth, Synanthedon novaroensis (Lep., Sesiidae). J. Appl. Entomol. 124, 87–92. doi: 10.1046/j.1439-0418.2000.00449.x
Ruel, J. J., Ayres, M. P., and Lorio, P. L Jr (1998). Loblolly pine responds to mechanical wounding with increased resin flow. Can. J. Forest. Res. 28, 596–602. doi: 10.1139/x98-030
Russell, C. E., and Berryman, A. A. (1976). Host resistance to the fir engraver beetle. 1. Monoterpene composition of Abies grandis pitch blisters and fungus-infected wounds. Can. J. Bot. 54, 14–18. doi: 10.1139/b76-003
Santamour, F. S. (1965). Insect-Induced Crystallization of White Pine Resins I. White-Pine Weevil. Research Note NE-38. Upper Darby, PA: U.S. Department of Agriculture, Forest Service, Northeastern Forest Experiment Station. 1-8 NE-38.
Schopmeyer, C. S., Mergen, F., and Evans, T. C. (1954). Applicability of poiseuille's law to exudation of oleoresin from wounds on slash pine. Plant. Physiol. 29, 82–87.
Smith, R. H. (2000). Xylem Monoterpenes of Pines: Distribution, Variation, Genetics, Function. General Technical Report PSWGTR- 177. Albany, CA: Pacific Southwest Research Station, Forest Service.
Thoss, V., and Byers, J. A. (2006). Monoterpene chemodiversity of ponderosa pine in relation to herbivory and bark beetle colonization. Chemoecology 16, 51–58. doi: 10.1007/s00049-005-0331-7
Tingey, D. T., Turner, D. P., and Weber, J. A. (1991). “Factors controlling the emissions of monoterpenes and other volatile organic compounds,” in Trace Gas Emissions by Plant, eds T. D. Sharkey, E. A. Holland, and H. A. Mooney (San Diego, CA: Academic Press, Inc.), 93–119
Turtola, S., Manninen, A., Rikala, R., and Kainulainen, P. (2003). Drought stress alters the concentration of wood terpenoids in scots pine and norway spruce seedlings. J. Chem. Ecol. 29, 1981–1995. doi: 10.1023/A:1025674116183
Vité, J. (1961). The influence of water supply on oleoresin exudation pressure and resistance to bark beetle attack in Pinus ponderosa. Contributions of Boyce and Thompson Institute 21: 31-31-66.
Vité, J., and Wood, D. (1961). A Study on the Applicability of the Measurement of Oleoresin Exudation Pressure in Determining Susceptibility of Second Growth Ponderosa Pine to Bark Beetle Infestation. Contributions of Boyce and Thompson Institute 21, 67-67-78.
Widhalm, J. R., Jaini, R., Morgan, J. A., and Dudareva, N. (2015). Rethinking how volatiles are released from plant cells. Trends Plant Sci. 20, 545–550. doi: 10.1016/j.tplants.2015.06.009
Zeneli, G., Krokene, P., Christiansen, E., Krekling, T., and Gershenzon, J. (2006). Methyl jasmonate treatment of mature Norway spruce (Picea abies) trees increases the accumulation of terpenoid resin components and protects against infection by Ceratocystis polonica, a bark beetle-associated fungus. Tree Physiol. 26, 977–988. doi: 10.1093/treephys/26.8.977
Keywords: scots pine, resin pressure, resin composition, tree water potential, monoterpene emissions
Citation: Rissanen K, Hölttä T, Barreira LFM, Hyttinen N, Kurtén T and Bäck J (2019) Temporal and Spatial Variation in Scots Pine Resin Pressure and Composition. Front. For. Glob. Change 2:23. doi: 10.3389/ffgc.2019.00023
Received: 20 February 2019; Accepted: 03 May 2019;
Published: 17 May 2019.
Edited by:
Henry D. Adams, Oklahoma State University, United StatesReviewed by:
Monica L. Gaylord, United States Forest Service (USDA), United StatesCate Macinnis-Ng, The University of Auckland, New Zealand
Copyright © 2019 Rissanen, Hölttä, Barreira, Hyttinen, Kurtén and Bäck. This is an open-access article distributed under the terms of the Creative Commons Attribution License (CC BY). The use, distribution or reproduction in other forums is permitted, provided the original author(s) and the copyright owner(s) are credited and that the original publication in this journal is cited, in accordance with accepted academic practice. No use, distribution or reproduction is permitted which does not comply with these terms.
*Correspondence: Kaisa Rissanen, a2Fpc2Eucmlzc2FuZW5AaGVsc2lua2kuZmk=
†Present Address: Luís F. M. Barreira, Department of Applied Physics, University of Eastern Finland, Kuopio, Finland Noora Hyttinen, Nano and Molecular Systems Research Unit, University of Oulu, Oulu, Finland