 Andrew J. Plumptre1,2*
 Daniele Baisero1,3
 Włodzimierz Jędrzejewski4
 Hjalmar Kühl5,6
 Fiona Maisels3,7Justina C. Ray8Eric W. Sanderson3
 Samantha Strindberg3Maria Voigt5,6Serge Wich9,10
- 1Key Biodiversity Area Secretariat, c/o BirdLife International, Cambridge, United Kingdom
- 2Cambridge Science Group, Zoology Department, Cambridge University, Cambridge, United Kingdom
- 3Wildlife Conservation Society, Bronx, NY, United States
- 4Centro de Ecología, Instituto Venezolano de Investigaciones Científicas (IVIC), Caracas, Venezuela
- 5Max Planck Institute for Evolutionary Anthropology, Department of Primatology, Leipzig, Germany
- 6German Centre for Integrative Biodiversity Research (iDiv) Halle – Jena – Leipzig, Leipzig, Germany
- 7Faculty of Natural Sciences, University of Stirling, Stirling, United Kingdom
- 8Wildlife Conservation Society Canada, Toronto, ON, Canada
- 9School of Natural Sciences and Psychology, Liverpool John Moores University, Liverpool, United Kingdom
- 10Institute for Biodiversity and Ecosystem Dynamics, University of Amsterdam, Amsterdam, Netherlands
Efforts to designate priority areas for conservation have had a long history, with most modern initiatives focused on either designating areas important for biodiversity or those least impacted by direct human disturbance. Ecologically intact ecosystems are becoming increasingly limited on the planet, making their identification and conservation an important priority. Intact forest landscapes (IFL) are defined as forests that are mainly free of significant anthropogenic degradation and at least 500 km2 in size. Here we define a new metric, the Last of the Wild in each Ecoregion (LWE), as a preliminary scoping of the most intact parts of each ecoregion. IFL and LWE are approaches among a broad family of techniques to mapping ecological integrity at the global scale. Although both implicitly include species integrity as a dimension of intactness, this is inferred rather than directly measured. We assessed whether IFL or LWE areas were better at capturing species where they are most abundant using species distribution data for a set of forest species for which range-wide data were available and human activity limits the range. We found that IFL and LWE methods identified areas where species we assessed are either absent or at too low an abundance to be ecologically functional. As such many IFL/LWE polygons did not have intact fauna. We also show that 54.7% of the terrestrial realm (excluding Antarctica) has at least one species recorded as extinct and that two thirds of IFL/LWE areas overlap with areas where species have gone extinct in the past 500 years. The results show that even within the most remote areas, serious faunal loss has taken place at many localities so direct species survey work is also needed to confirm faunal intactness.
Introduction
Throughout history, the reasons why areas have been established for wildlife protection have varied considerably. Some of the oldest forms of wildlife protection occurred as a result of land being put aside by the nobility for hunting (Hamin, 2002). For example, the Białowieża Primeval Forest protected the European bison for royal hunts and its habitats persisted for over 500 years (Jędrzejewska and Jędrzejewski, 1998). Prioritization of conservation sites for other reasons started with the establishment of the first national parks in the late 1800s. Initially, concepts of natural wonders, spiritual refuge, and scenic beauty were the criteria used to identify these parks (Runte, 1997; Nash, 2001; Lewis, 2007). In Africa, many of the first protected areas in the early to mid-1900s were established to enable sport hunting with a focus on the conservation of large mammals (with big trophies), usually where it was observed that they were declining in numbers (Willock, 1964).
It wasn't until the mid-1970s and 1980s that the attention started to shift to biodiversity conservation and the idea of saving life on Earth in all its forms. In the mid-1990s, Centres of Plant Diversity were identified to map species-rich plant regions (Davis et al., 1994). This led to the identification of ecoregions (Olson et al., 2001), areas of similar floristic and faunal composition, and the prioritization of these into the Global 200 (Olson and Dinerstein, 1998). The definition of biodiversity hotspots (Mittermeier et al., 2004) also emerged—regions rich in endemic plant species that also suffered a high degree of human impact. However, these broad-scale prioritizations, while helpful in identifying general regions important for conservation investment, were not easily translated into conservation actions at a local scale, and were biased toward tropical regions of the planet (Noss et al., 2015).
The Important Bird Areas (IBA) program (Donald et al., 2018), established in the early 1980s, was one of the first site-based prioritization initiatives based on the diversity of all species within a taxon. When it was shown that prioritization for birds also led to a good percentage of other taxa being captured, IBAs became known as the Important Bird and Biodiversity Areas program (Donald et al., 2018). Numerous additional schemes to identify important sites for taxonomic or thematic subsets of biodiversity (e.g., Alliance for Zero Extinction sites (AZE) etc.) were independently created. These formed the basis of a consolidated approach: the Key Biodiversity Areas (KBA) framework and methodology (IUCN, 2016), the purpose of which was to bring a standard and comparable approach to the identification of the most important sites for biodiversity on Earth that could be applied across all taxa. Following extensive consultation within the conservation community, A Global Standard for the Identification of Key Biodiversity Areas was finalized (Potapov et al., 2009; IUCN, 2016). Sites of importance for the global persistence of biodiversity can be selected if they meet one of five higher level criteria that have been recognized in several site identification or conservation prioritization approaches: (A) Threatened species or ecosystems, (B) Geographically restricted species or ecosystems, (C) Ecological Integrity, (D) Biological processes or congregations, and (E) Irreplaceability (IUCN, 2016). The ecological integrity criterion (C) was designed to identify outstanding examples at the global scale of still-natural and intact areas that maintain fully functional ecosystems within each ecoregion, and are therefore critical for sustaining biodiversity in the face of human-induced change.
KBA Criterion C deliberately incorporates both intactness and biotic integrity (IUCN, 2016) into the KBA approach by calling for the delineation of wholly intact natural areas with minimal post-industrial anthropogenic disturbance, sufficiently large to accommodate most broad-scale ecological processes, and supported by evidence that all ecosystem components (including highly mobile predators and herbivores and long-lived structural plant species) still fulfill their functional roles (KBA Standards Appeals Committee, 2018). Because comprehensive assessments of biotic communities will be impractical in many areas with high ecological integrity, especially in remote ecoregions with few human settlements and limited access, direct measures of intact faunal communities would have to be accomplished using indicator species (KBA Standards Appeals Committee, 2018). We note that unfortunately many ecoregions will not have criterion C KBAs because they have been so heavily impacted by humans that no areas within them now satisfy a meaningful intactness requirement.
The effort to identify which parts of the planet are globally important for biodiversity has been paralleled with assessments of global threats, in particular the impact of humans on the environment. The Human Footprint (Sanderson et al., 2002; Venter et al., 2016a; Allan et al., 2017) aimed to map the variation in human influence around the world using remotely sensed and other geographic data, such as human population data, infrastructure, and lights visible to a satellite at night. Areas of the least human influence within biomes have been termed “Last of the Wild” areas (Sanderson et al., 2002; Watson et al., 2016). It is now clear that these are rapidly dwindling in size and connectivity (Watson et al., 2016; Jones et al., 2018) and at the same time our understanding is growing of the exceptional value of intact ecosystems for provision of ecosystem services (water, carbon, etc.), biodiversity conservation, indigenous peoples, and human health (Watson et al., 2018).
Intact Forest Landscapes (IFL) adopted a similar approach to “last of the wild,” albeit restricted to forested ecosystems (Potapov et al., 2008, 2017). The methodology identifies large undeveloped forest areas through satellite-based mapping of tree canopy cover, with areas unfragmented by roads or other development of no smaller than 500 km2, assumed to be large enough to “maintain all native biodiversity, including viable populations of wide-ranging species” (Potapov et al., 2008, 2009). This size threshold was developed to be globally generalizable, but has been critiqued for being arbitrary and without scientific basis with respect to meeting biotic expectations, given the space needs of many wide-ranging species (Venier et al., 2018).
Here we make a scoping of the wildest parts of each ecoregion, what we term the “last of the wild in each ecoregion (LWE)” and compare this with IFL. We focused the Last of the Wild approach (Sanderson et al., 2002) down to the ecoregion scale with the LWE method because of the value in conserving the most intact areas of each ecoregion, rather than the most intact areas of each biome. This method is also a first step in a scoping of potential KBA Criteria C sites. With a focus on forested ecosystems, we assessed whether either approach identifies areas of faunal intactness as a preliminary measure of a more comprehensive species intactness. LWE and IFL are two approaches in what is now a broad family of techniques to mapping ecological integrity at the global scale, identified through measures of degree of human impact or influence, rather than through mapping of intact faunal communities. Others include Wilderness Areas (McCloskey and Spalding, 1989), Frontier Forests (Bryant et al., 1997), Hinterland Forests (Tyukavina et al., 2016), and very recently the Human Modification map (Kennedy et al., 2019). One concern with all these approaches is that they do not map what the satellites cannot see. Defaunation (Dirzo and Miranda, 1990) in what appears to be intact forest has long been recognized, and often referred to as “empty forest” (Redford, 1992; Wilkie et al., 2011). Verification of defaunation would require complete biological inventories and intimate historical knowledge.
Because both KBA and IFL approaches implicitly include species integrity as a dimension of intactness, it is of significant interest to determine the extent to which measures of human impact truly correspond with locations of intact animal communities, given the absence of credible global measures of this mapping dimension (Martin et al., 2019). An initial scoping of KBA criteria C sites requires likely intact areas of each ecoregion to be identified. The LWE approach we document here uses one method that might be used to scope potential Criteria C sites by identifying the areas with lowest human impact as measured by the human footprint. Threats are often mapped at various scales, from local to global, using remote sensing products, but their value for identifying intact fauna is often assumed rather than tested. In this paper we use both IFL and LWE areas as two measures of low human impact to assess how well measures such as these, made using remote sensing products and global datasets, actually capture important areas for fauna. We test the areas with (1) data on large, forest-dwelling mammals for which there are global data that tend to be negatively affected by human pressures and are likely to be some of the first species lost from a site, and (2) a measure of species extinction.
Methods
We compared two estimates of intact habitat: IFL and LWE. “Last of the Wild” (Sanderson et al., 2002; Watson et al., 2016) maps focused on the wildest areas within biomes; the largest such areas, not surprisingly, are inhospitable deserts and tundra areas, and inaccessible areas such as the Amazon. Rather than using biomes, we modified the “last of the wild” method (Sanderson et al., 2002) to select within ecoregions rather than biomes. Ecoregions are more ecologically fine-grained and representative of biodiversity than biomes, as well as potentially compatible with the KBA Criterion C. Other similar published metrics (e.g., hinterland forests - Tyukavina et al., 2016) have an overlap of 92% with IFL maps.
Scoping of LWE Areas
We undertook a scoping of candidate LWE areas by identifying the five most intact areas for each ecoregion of the world. We overlaid the most recent human footprint map (Venter et al., 2016a,b) on the most recent map of ecoregions of the world (Dinerstein et al., 2017). The human influence index (HII) can range between 0 and 50; for the purposes of this analyses we identified the best 10% of each ecoregion (lowest footprint scores), and within this subset selected the 5 largest intact polygons. HII has been widely used relative to more recent datasets of human modification (e.g., Kennedy et al., 2019) and therefore offered opportunities to compare our results with previous literature. A similar approach was used for the “Last of the Wild” (Sanderson et al., 2002), except this assessed the 10 largest areas within the best 10% of each Biome. In order to avoid polygons that had a lot of “gaps” resulting from pockets of high human activity in otherwise non-impacted landscapes, we applied a 5 km smoothing buffer to the HII map (each pixel representing the average HII score within the buffer radius). We selected this buffer radius from a range between 0 and 25 km, testing the result in ~2.5 km increments. The 5 km buffer provided the best smoothing, and appeared to stabilize both the reduction in border effects and remnant habitat selection (median effects on area perimeter and shape did not substantially vary using larger buffers). This meant that fragmented and border habitats would experience an increase in HII, while core areas would remain unaffected.
We selected a subset of these areas, designated Forest LWE, which selected only those forested ecoregions that overlapped with IFL polygons. We used these polygons to intersect with global maps of species loss (see below).
Our rationale for using anthropogenic influence to identify LWE areas is that a reduced anthropogenic influence is likely to translate to a reduced ecological impact, including species loss. Global maps of anthropogenic influence, however, are not likely detailed enough in many places of the world to capture (directly or indirectly) all pressure types that might result in species loss, or if modern measures of anthropogenic influence can still capture historical impacts. Notable pressures that are unmapped to date include hunting/poaching and will have drastically altered species composition in large landscapes; regional or local-scale maps will capture more elements of the human footprint. The regions we identify will need to go through more stages of rigorous analysis, including on-the-ground evaluation before KBA criterion C sites can be positively identified. As such, this is a preliminary scoping of regions of the world where such sites are likely to exist.
Intersecting IFL and LWE Areas With Species Distributions
Species With Measures of Density
To assess how well these areas might capture faunal intactness we compiled range and, where possible, density maps for a small subset of tropical forest mammals that are sensitive to human disturbance. We assembled density data for the following species: jaguars (Panthera onca) (Jedrzejewski et al., 2018), African forest elephants (Loxodonta africana cyclotis) (Maisels et al., 2013), western lowland gorillas (Gorilla gorilla gorilla), central chimpanzees (Pan troglodytes troglodytes) (Strindberg et al., 2018), eastern chimpanzees (P. t. schweinfurthii) (Plumptre et al., 2010), eastern gorilla (Gorilla beringei) (Plumptre et al., 2016), Bornean orangutan (Pongo pygmaeus) (Voigt et al., 2018), Sumatran orangutan (P. abelii) (Wich et al., 2016), and Tapanuli orangutan (P. tapanuliensis) (Nater et al., 2017). For each of these maps we identified a threshold density separating high and low density populations using expert assessment of the relevant author's knowledge of each of the species. We then intersected the maps of IFL and the LWE areas with each species map to calculate areas of high density that were within these polygons and the area across the species range. We measured the percentage of the area of the LWE and IFL polygons that contained high density scores for a species and compared this with the percentage area of high density scores across the species global range to assess whether the methods selected more of the area where species are considered to be likely to be at a functional density. We used this calculation because IFL and LWE areas have a great difference in extent, and failing to do so would have almost certainly indicated the larger areas to be more inclusive, despite the potential to also include large segments of low-density populations.
Species With Range-Wide Priority Setting
We also compiled maps from range-wide priority setting exercises that mapped areas where a species was definitely occurring, probably/possibly occurring and extirpated. We assembled maps for tigers (Panthera tigris) (Dinerstein et al., 2006), white-lipped peccary (Tayassu pecari), and tapir (Tapirus terrestris) (Taber et al., 2008), Asian black bear (Ursus thibetanus), brown bear in Asia (Ursus arctos), sloth bear (Melursus ursinus) and sun bear (Helarctos malayanus) (Garshelis et al., 2007), snow leopard (Panthera uncia) (McCarthy et al., 2016; Sanderson et al., 2016) and Asian elephant (Elephas maximus) (Hedges et al., 2009; Calabrese et al., 2017). Although large areas of IFL and LWE occur in boreal forest, analogous full range assessments of boreal species other than brown bear in Asia were not available. For the purposes of this analysis we assumed that where a species was definitely known, it was occurring at a reasonably functional density, because the species could be detected. Where a species was possible/probable it was at low density because it was uncertain whether the species was present. We use the term “suitable habitat” to define where a species definitely occurred in the rest of this paper. This will overestimate where a species is at functional density because there will be many sites where the species is known to occur, but only at low density, as well as known sink sites. We calculated the area of suitable habitat within the LWE and IFL polygons as well as within the species global range. We also assessed the percentage of the range of the species with suitable habitat and the percentage of this suitable habitat within LWE areas and within IFLs, to assess whether the method was selecting areas where the species was more likely to be at a higher density and more functional.
Intersecting IFL and LWE Areas With a Map of Where Species Have Gone Extinct
We assessed loss of faunal intactness by mapping the distribution of extinct ranges for species. We compiled maps of all species assessed from the IUCN Red List of Threatened Species (IUCN, 2018) and mapped the native range where a species was considered to be extinct or possibly extinct as classified under the range fields “Presence” for each species range polygon. The Red List assesses where species have gone extinct since the year 1500 AD, so does not include species that were extirpated prior to this date and there are recognized gaps in coverage as a result. It maps species that have gone extinct, and areas of range where extant species have lost range. We mapped all such ranges to assess the numbers of extinct species to obtain a measure of loss of faunal intactness across the world. We then intersected this map with the IFL and LWE/Forest LWE polygons to calculate the percentage area of polygons that had not lost any species using this measure.
Results
LWE Areas
The map of LWE areas is visually dominated by large areas of the northern ecoregions in tundra, taiga, and boreal forests (Figure 1). This is because the HII in these less populated ecoregions are mostly scored zero, so that when selecting the 10% of lowest scores, all cells with zero are selected. Human impacts in these regions include logging and other resource development (e.g., mining areas, seismic lines), but these are not available on global maps and therefore do not get incorporated in the HII (though see Kennedy et al., 2019). This highlights a compromise tied with using current global data sets, accepting data that may be of lower quality than locally available in order to reduce geographical bias across management units (countries or sub-national regions). For this reason, there have been several efforts to make regional human footprint maps (Leu and Hanser, 2008; Woolmer et al., 2008) What is clear is that for most of the ecoregions of the planet, the five most intact areas of each ecoregion are relatively small in size (average area was 6,323 km2 but median area was only 696 km2), reflecting the fine scale of many ecoregions and the density of human activity. Only 340 areas out of a total of 3,852 identified were larger than 10,000 km2, the recommended minimum size for a KBA criterion C site (IUCN, 2016).
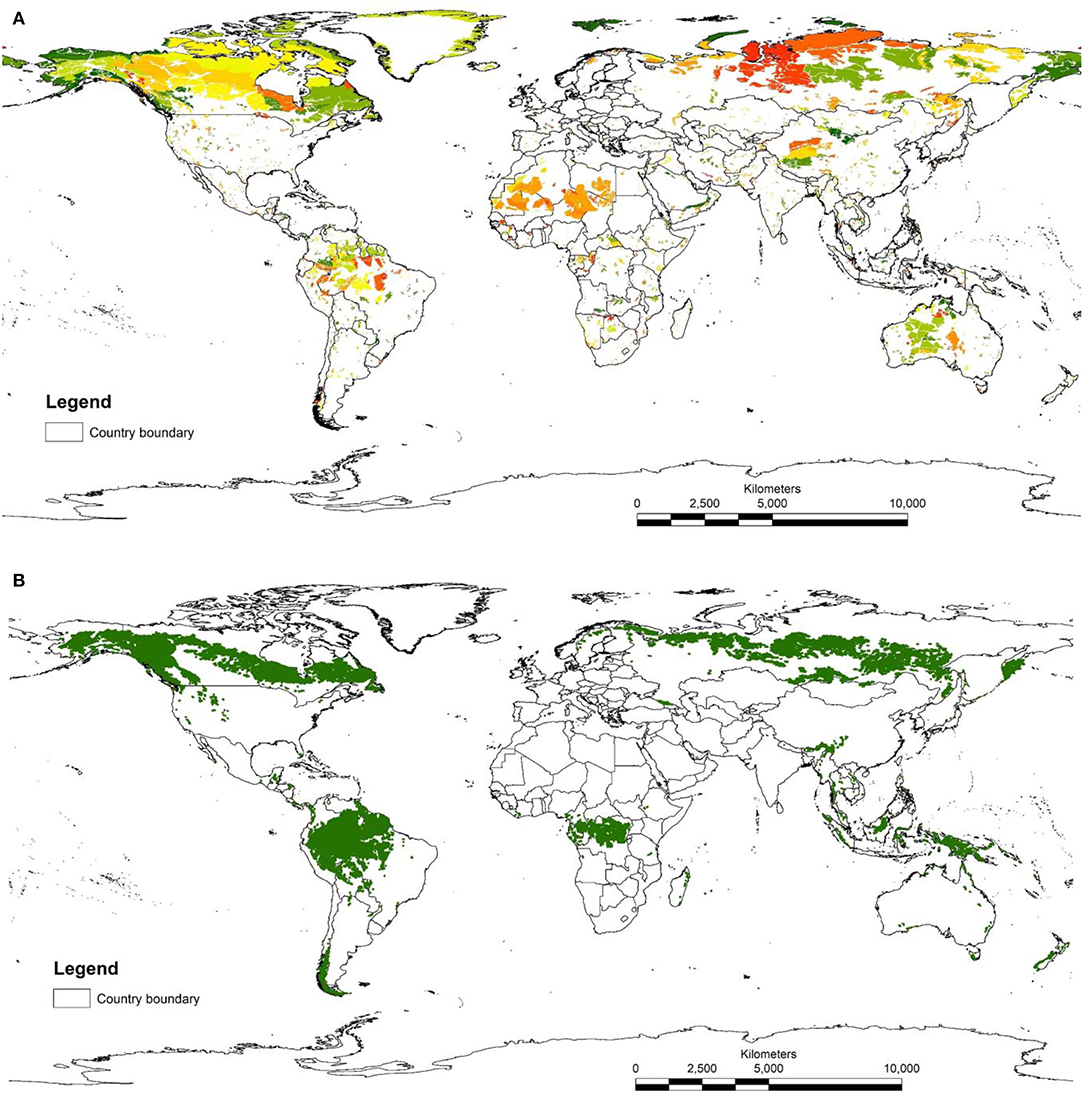
Figure 1. (A) Map of LWE sites. These are the five largest parts of each ecoregion with the lowest 10% of human influence index scores. Different colors represent different ecoregions. (B) map of IFL sites.
Intersection of Species Ranges and IFL/LWE Areas
The results of the intersection of the IFL and LWE areas with the ranges of the 16 species for which we had data on density or suitable habitat are shown in Table 1 (Figure S1 in supplementary material shows the overlap of LWE/IFL with suitable/high density habitat for all forest species). This table shows the areas of high density/suitable habitat in the LWE areas, the IFLs and the percentage of the species global range. On average 21% of high density/suitable habitat of a species range was captured within the LWE areas and 34% within IFLs. Given that all LWE areas (including those in non-forest ecoregions) cover only 2% of the surface covered by IFL (24.4 million km2 vs. 1,163.3 million km2), we also compared the relative percentages of high density/suitable habitat captured by each approach by plotting the percentage of high density/suitable habitat within the species range against the percentage of the area of the LWE/IFL polygons where there was overlap (Figure 2). For example, only 17% of the LWE areas that overlap African forest elephant range have high elephant densities, and this drops to only 4.5% in IFL polygons, similar to the global percentage across their range (3.8%). In some cases, the LWE areas capture more of a species' high-density range while for others the IFL do a better job. For the most part both capture a larger percentage than what is available within the species' range (species above the line of 1:1 –Figure 2), although many of the comparisons are close to what would be expected if polygons were allocated randomly (1:1 line—Figure 2). For many species, however, large areas of the IFL or LWE polygons do not have high density/suitable habitat. In these areas, the species are unlikely to be at a functional density or not even present. This was particularly true for those species measured using density, which were likely to better reflect functional integrity of a site. Note that the percentage areas of suitable habitat will be on the high side for the ranges determined by range wide priority setting because the assumption was made that definite/confirmed range or high quality range would have functional densities of the species, yet at many areas this may not be the case and they are simply recorded as being present which qualifies it as definite range. This assessment clearly shows that these species, which tend to be affected by human impact, will be at low and likely non-functional densities across large areas of either IFL or the LWE areas.
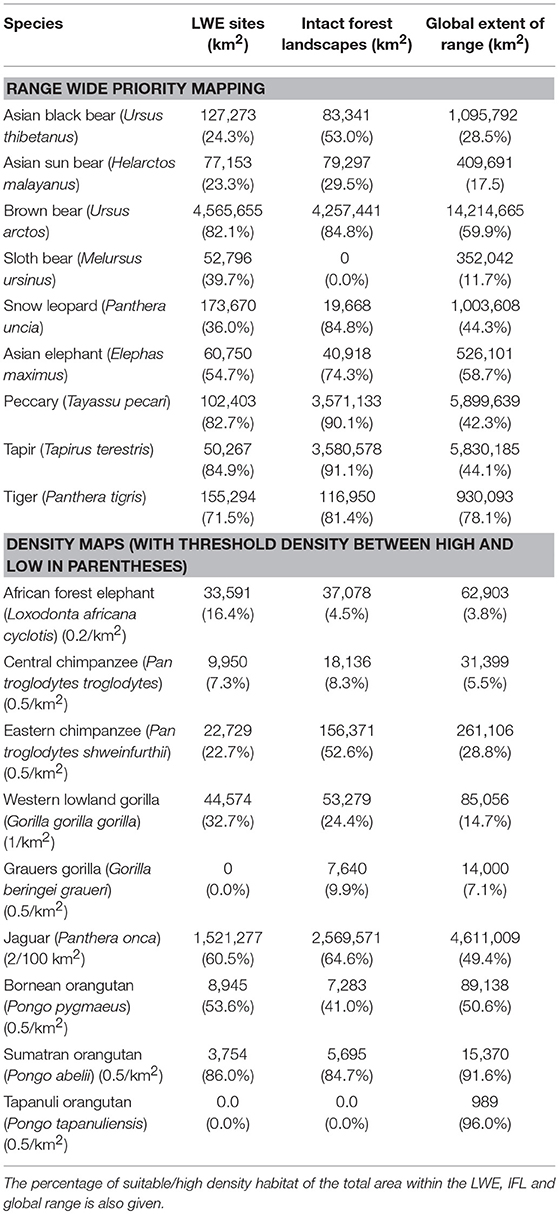
Table 1. The area of suitable habitat, or area where the species was at high density (for species with density estimates), calculated within the LWE sites or IFL sites (where they overlap the species range), and within the global range of the species as a whole.
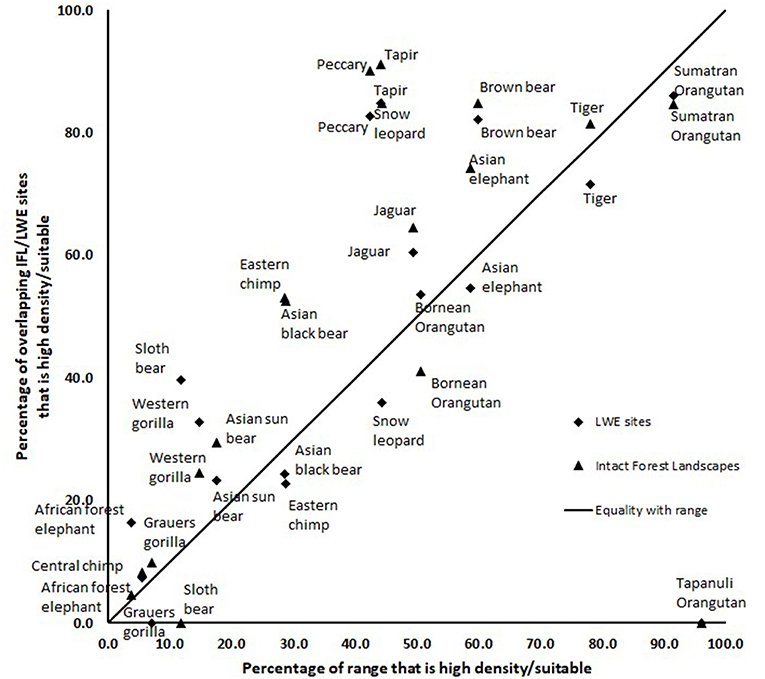
Figure 2. A comparison of the percentage of “high density” or “suitable” habitat within a species range plotted against the percentage of the area within the LWE/IFL polygons that overlap the species range. Species below the 1:1 line have less suitable/high density habitat than available.
Faunal Loss in IFL and LWE Areas
Figure 3 shows the results of mapping all species assessed on the IUCN Red List where a species has been extirpated or is possibly extirpated since 1500 AD. A total area of 54.7% of the terrestrial realm of the earth (excluding Antarctica) has at least one species with range recorded as extinct or possibly extinct. The white areas in Europe and central Asia would certainly have had species that had been lost prior to 1500 AD, such as bears (Ursus arctos), wolves (Canis lupus), and beavers (Castor fiber). It is important to note that within the IUCN Red List assessments, most records do not estimate where the species has lost part of its range. Therefore, this map will very much be an underestimate of species loss across the world. Yet it is still valuable in highlighting how much of the world has lost one or more species.
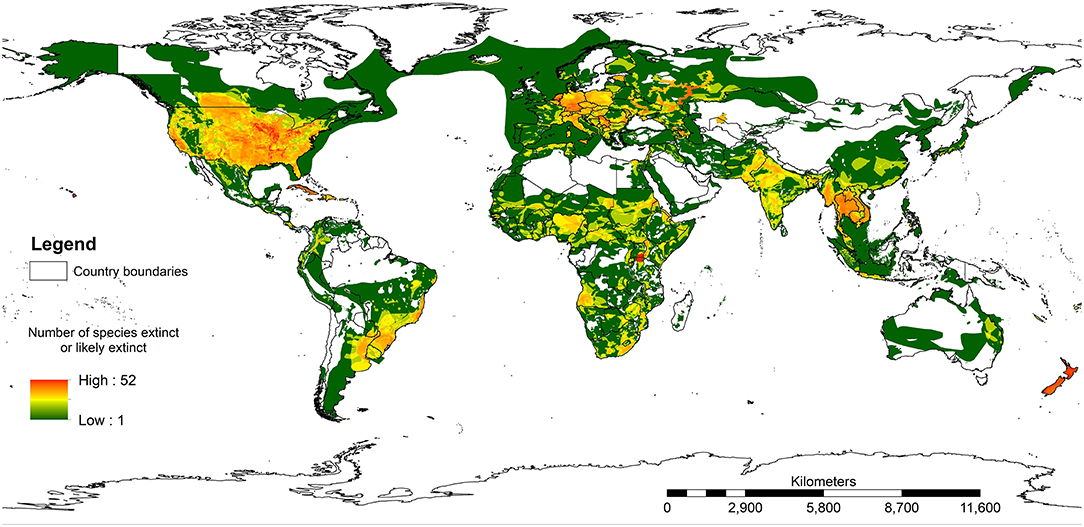
Figure 3. The ranges where any species on the IUCN Red List of Threatened Species has been assessed as extinct or possibly extinct. Note that this map will be a significant underestimate because the IUCN Red List does not map species prior to 1500 AD and many extant species probably do not have their extinct ranges mapped.
Intersecting all LWE areas with this map shows that 33% of the area of LWE polygons have no recorded extinctions, compared with 31% of IFL polygons. However, of the forested LWE areas only 19% of their total area have no extinctions recorded (Table 2).
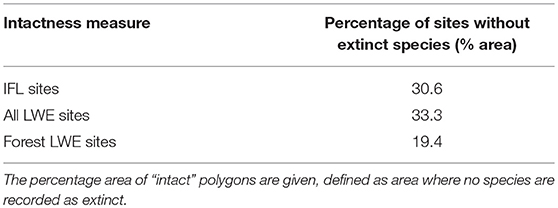
Table 2. The results of intersecting the IFL, LWE, and Forest LWE polygons with the Extinct species map.
Discussion
What Do We Mean by Intactness?
Our results show that there are few places left on the planet that are faunally intact, a result that corresponds with many assessments of global biodiversity (e.g., Secretariat of the Convention on Biological Diversity United Nations Environment Programme, 2014; Wolf and Ripple, 2017). The two measures we assessed of intactness—the IFL measure and the LWE areas—encompass reasonably large areas of the globe. However, when we look at forest species that might be using the IFLs and LWE areas, for many there are large parts of these “intact areas” where they are absent or at low densities (Figure 2) that are not likely ecologically functional (sensu Sanderson, 2006). In extreme cases, species may be present, but ecologically extinct (Estes et al., 1989; Novaro et al., 2000). Assessment of species range loss or complete extinction also shows that a large area of the earth does not have a full complement of species and cannot be thought of as faunally intact (Figure 3). More than half of LWE areas had no species recorded as having gone extinct, but this would decrease if pre 1500 data were available for ecoregions in Europe in particular, and if extinction records in the IUCN Red List were more comprehensive in general. Comparison of forested areas demonstrated that more than half of IFL and forest LWE areas had lost at least one species.
Table 1 shows that areas of suitable habitat/high density range for the species we assessed were not captured by the IFL or LWE assessments, indicating that there are important areas for species where lack of intactness, as measured by HII or from anthropogenic alteration of forest cover, is still important for these species.
Estimates of human influence could be improved by using available local and regional data at the jurisdictional (e.g., national or subnational) level (e.g., Woolmer et al., 2008). Many smaller-scale analyses will reveal considerably higher levels of human impact, however, which could reduce the area of IFL polygons or LWE areas. Our use of a 10% threshold to select the least impacted areas of each ecoregion does limit the area where candidate LWE sites could occur in some ecoregions where human impacts are negligible throughout the ecoregion. In ecoregions with extensive scores of zero (northern tundra/taiga) LWE areas were large and included more than 10% of the area of the ecoregion, however for most ecoregions we were able to limit the analysis to the best 10% or smaller area of the ecoregion (if there were more than 5 candidate sites). There is a need to assess the potential impact of this on the identification of LWE areas in future.
In addition to regional-scale human pressures mapping, accurate assessments of faunal intactness will require (1) better models of direct pressures on biodiversity such as hunting intensity, which cannot be predicted using HII-like approaches, and (2) knowledge of the extent to which abundance levels have changed relative to historical baseline for multiple species throughout their ranges. How far a hunter will move into a forest will be determined by several factors such as the importance of hunting to their livelihood (e.g., poachers in wealthier vs. poorer countries), the relative reward obtained from hunting a species (e.g., ivory vs. bushmeat), the accessibility of a site (e.g., rugged terrain vs. flat), and the intensity and likelihood of penalties that might be incurred if caught (e.g., small fine vs. jail terms). Considerably more detail than traditional range maps will be necessary to evaluate the extent to which faunal communities have retained their integrity in the face of human disturbance. Only when we have a good handle on factors such as these will we be able to start modeling faunal intactness better. A recent study that was published as this paper went to press makes the first attempt to model hunting across tropical forests (López et al., 2019) which estimates large mammals have been lost in more than 50% of IFL. Global analyses, while being useful to help with planning for conservation, must also be supplemented with site evaluations for identification of evidence-based, intact areas for species, as specified by Global Standard for the identification of Key Biodiversity Areas with respect to criterion C sites.
Intactness as measured by global datasets and functional ecological integrity of biodiversity may not always co-occur and it is important to recognize that the two have a value for conservation independently. Some well-managed protected areas, for example, will inevitably have a high degree of anthropogenic influence, while at the same time retaining a full, or nearly full, complement of species at functional densities, exactly because they are being well protected and managed (e.g., Nairobi National Park on the outskirts of Nairobi city in Kenya (Ogutu et al., 2013). On the other hand, some intact areas may not currently contain species at functional densities but numbers might be recovered with management, so that areas become ecologically functional in the future. Areas, for instance, where a keystone species has been extirpated through hunting, and could meet KBA criterion C status after reintroduction and recovery of that species to functional levels.
The message highlighted from these analyses is that faunal intactness is highly rare in the remaining large areas on earth and that we cannot easily identify this from satellite images of seemingly intact forest canopy and human disturbance (the IFL method) nor from assessments using the HII (the LWE areas). Recent papers have highlighted the small percentage of remaining wilderness or intact sites (Watson et al., 2016, 2018; Potapov et al., 2017) and yet our results indicate that truly intact sites with a full complement of species are likely to be much rarer still.
Author Contributions
AP and DB made the analyses described in this paper. AP drafted the paper. WJ, HK, FM, MV, ES, SS, and SW provided data sets and contributed to the writing and JR contributed ideas and to the writing of the paper.
Funding
Funding for this work was provided by a Cambridge Conservation Initiative Collaborative Grant (CCI-05-18-004) for scoping KBAs and by the Daniel K Thorne Foundation for support to AP and DB. AP's time was financed by IUCN, BirdLife International, RSPB, Rainforest Trust, and DB's time by Wildlife Conservation Society.
Conflict of Interest Statement
The authors declare that the research was conducted in the absence of any commercial or financial relationships that could be construed as a potential conflict of interest.
Acknowledgments
We are grateful to Penny Langhammer, Hedley Grantham, and James Watson who gave advice and input to the paper.
Supplementary Material
The Supplementary Material for this article can be found online at: https://www.frontiersin.org/articles/10.3389/ffgc.2019.00024/full#supplementary-material
References
Allan, J. R., Venter, O., Maxwell, S., Bertzky, B., Jones, K., Shi, Y., et al. (2017). Recent increases in human pressure and forest loss threaten many Natural World Heritage Sites. Biol. Conserv. 206, 47–55. doi: 10.1016/j.biocon.2016.12.011
Bryant, D., Nielsen, D., and Tangley, L. (1997). The Last Frontier Forests: Ecosystems and Economies on the Edge. Washington, DC: World Resources Institute (WRI).
Calabrese, A., Calabrese, J. M., Songer, M., Wegmann, M., Hedges, S., Rose, R., et al. (2017) Conservation status of Asian elephants: the influence of habitat governance. Biodiversity Conserv. 26, 2067–2081. doi: 10.1007/s10531-017-1345-5.
Davis, S., Heywood, V. H., and Hamilton, A. C. (eds.). (1994). Centres of Plant Diversity: A Guide and Strategy for Their Conservation. Vol. I: Europe, Africa, South west Asia and the middle east. Gland and Cambridge: WWF/ IUCN/EC/ ODA.
Dinerstein, E., Loucks, C., Heydlauff, A., Wikramanayake, E., Bryja, G., Forrest, J., et al. (2006). Setting Priorities for the Conservation and Recovery of Wild Tigers: 2005–2015. A User's Guide. Washington, DC; New York, NY: WWF, WCS, Smithsonian, and NFWF-STF.
Dinerstein, E., Olson, D., Joshi, A., Vynne, C., Burgess, N. D., Wikramanayake, E., et al. (2017). An ecoregion-based approach to protecting half the terrestrial realm. Bioscience 67, 534–545. doi: 10.1093/biosci/bix014
Dirzo, R., and Miranda, A. (1990). Contemporary neotropical defaunation and forest structure, function, and diversity-A sequel to John Terborgh. Conserv. Biol. 4, 444–447. doi: 10.1111/j.1523-1739.1990.tb00320.x
Donald, P. F., Fishpool, L. D. C., Ajagbe, A., Bennun, L. A., Bunting, G., Burfield, I. J., et al. (2018). Important Bird and Biodiversity Areas (IBAs): the development and characteristics of a global inventory of key sites for biodiversity. Bird Conserv. Int. 2018:S0959270918000102. doi: 10.1017/S0959270918000102
Estes, J. A., Duggins, D. O., and Rathburn, G. B. (1989). The ecology of extinctions in kelp forest communities. Conserv. Biol. 3, 252–264.
Garshelis, D. L., Minkowski, K., and Sanderson, E. W. (2007). “Mapping bear distributions: meshing hard data and expert opinion,” in Abstract presented at 18th International Conference on Bear Research and Management, Monterrey, November 4–11, 2007.
Hamin, E. (2002). Western European approaches to landscape protection: a review of the literature. J. Plann. Literature 16, 339–358. doi: 10.1177/08854120222093400
Hedges, S., Fisher, K., and Rose, R. (2009). Range-Wide Mapping Workshop for Asian Elephants (Elephas maximus), Cambodia, October 2008. A report to the U.S. Fish and Wildlife Service on Assistance Award No: 98210-6-G232. Wildlife Conservation Society, Bronx.
IUCN (2016). A Global Standard for the Identification of Key Biodiversity Areas, Version 1.0. 1st edn. Gland: IUCN.
IUCN (2018). The IUCN Red List of Threatened Species. Version 2018-2. Available online at: http://www.iucnredlist.org. (accessed November 14, 2018).
Jędrzejewska, B., and Jędrzejewski, W. (1998). Predation in Vertebrate Communities. The Białowieża Primeval Forest as a Case Study. Berlin, Heidelberg, and New York, NY: Springer-Verlag, Ecological Studies 135, 450 doi: 10.1007/978-3-662-35364-6
Jedrzejewski, W., Robinson, H. S., Abarca, M., Zeller, K. A., Velasquez, G., Paemelaere, E. A. D., et al. (2018). Estimating large carnivore populations at global scale based on spatial predictions of density and distribution - Application to the jaguar (Panthera onca). PLoS ONE 13:0194719. doi: 10.1371/journal.pone.0194719
Jones, K. R., Klein, C. J., Halpern, B. S., Venter, O., Grantham, H., Kuempel, C. D. (2018) The location protection status of earth's diminishing marine wilderness. Curr. Biol. 28, 2506–2512. doi: 10.1016/j.cub.2018.06.010, et al.
KBA Standards and Appeals Committee (2018). Guidelines for Using a Global Standard for the Identification of Key Biodiversity Areas. Version 1.0. Prepared by the KBA Standards and Appeals Committee of the IUCN Species Survival Commission and IUCN World Commission on Protected Areas. Gland: IUCN.
Kennedy, C. M., Oakleaf, J. R., Theobald, D. M., Baruch-Mordo, S., and Kiesecker, J. (2019). Managing the middle: a shift in conservation priorities based on the global human modification gradient. Global Change Biol. 25, 811–826. doi: 10.1111/gcb.14549
Leu, M., and Hanser, S. E. (2008). The human footprint in the west: a large-scale analysis of anthropogenic impacts. Ecol. Appl. 18, 1119–1139. doi: 10.1890/07-0480.1
López, A. B., Santini, L., Schipper, A. M., Busana, M., and Huijbregts, M. A. J. (2019). Intact but empty forests? Patterns of hunting-induced mammal defaunation in the tropics. PLoS Biol. 17:e3000247. doi: 10.1371/journal.pbio.3000247
Maisels, F., Strindberg, S., Blake, S., Wittemyer, G., Hart, J., Williamson, E. A., et al. (2013). Devastating decline of forest elephants in central Africa. PLoS ONE 8:e59469. doi: 10.1371/journal.pone.0059469
Martin, P., Green, R. E., and Balmford, A. (2019), Is biodiversity as intact as we think it is? PeerJ 7:e27575v1. doi: 10.7287/peerj.preprints.27575v1
McCarthy, T., Mallon, D., Sanderson, E. W., Zahler, P., and Fisher, K. (2016). “What is a snow leopard? Biogeography and status overview,” in Snow Leopards, eds T. McCarthy, and D. Mallon (New York, NY: Academic Press). doi: 10.1016/B978-0-12-802213-9.00003-1
McCloskey, J. M., and Spalding, H. (1989). A reconnaissance level inventory of the amount of wilderness remaining in the world. Ambio 18, 221–227.
Mittermeier, R. A., Robles-Gil, P., Hoffmann, M., Pilgrim, J. D., Brooks, T. M., Mittermeier, C. G., et al. (2004). Hotspots Revisited: Earth's Biologically Richest and Most Endangered Ecoregions. 2nd Edn. Mexico: Cemex.
Nater, A., Mattle-Greminger, M. P., Nurcahyo, A., Nowak, M. G., de Manuel, M., Desai, T., et al. (2017). Morphometric, behavioral, and genomic evidence for a new orangutan species. Curr. Biol. 27:3487. doi: 10.1016/j.cub.2017.09.047
Noss, R. F., Platt, W. J., Sorrie, B. A., Weakley, A. S., Means, D. B., Costanza, J., et al. (2015). How global biodiversity hotspots may go unrecognized: lessons from the North American coastal Plain. Diversity Distribut. 21, 236–244. doi: 10.1111/ddi.12278
Novaro, A., Funes, M., and Walker, R. S. (2000). Ecological extinction of native prey of a carnivore assemblage in Argentine Patagonia. Biol. Conserv. 92, 25–33. doi: 10.1016/s0006-3207(99)00065-8
Ogutu, J. O., Owen-Smith, N., Piepho, H. P., Said, M. Y., Kifugo, S. C., Reid, R. S., et al. (2013) Changing wildlife populations in Nairobi National Park Adjoining Athi-Kaputiei Plains: collapse of the migratory wildebeest. Open Conserv. Biol. J. 7, 11–26. doi: 10.2174/1874839201307010011.
Olson, D. M., and Dinerstein, E. (1998). The global 200: a representation approach to conserving the earth's most biologically valuable ecoregions. Conserv. Biol.12, 502–515. doi: 10.1046/j.1523-1739.1998.012003502.x
Olson, D. M., Dinerstein, E., Wikramanayake, E. D., Burgess, N. D., Powell, G. V. N., Underwood, E. C., et al. (2001). Terrestrial ecoregions of the world: a new map of life on Earth. Bioscience 51, 933–938. doi: 10.1641/0006-3568(2001)051[0933:TEOTWA]2.0.CO;2
Plumptre, A. J., Nixon, S., Kujirakwinja, D. K., Vieilledent, G., Critchlow, R., Williamson, E. A., et al. (2016). Catastrophic decline of world's largest primate: 80% loss of Grauer's Gorilla (Gorilla beringei graueri) population justifies critically endangered status. PLoS ONE 11:e0162697. doi: 10.1371/journal.pone.0162697
Plumptre, A. J., Rose, R., Nangendo, G., Williamson, E. A., Didier, K., Hart, J., et al. (2010). Status Survey and Conservation Action Plan for the Eastern Chimpanzee (Pan troglodytes schweinfurthii). Gland: IUCN.
Potapov, P., Hansen, M. C., Laestadius, L., Turubanova, S., Yaroshenko, A., Thies, C., et al. (2017). The last frontiers of wilderness: tracking loss of intact forest landscapes from 2000 to 2013. Sci. Adv. 3:e1600821. doi: 10.1126/sciadv.1600821
Potapov, P., Laestadius, L., Yaroshenko, A., and Turubanova, S. (2009) “Global mapping monitoring the extent of forest alteration: the intact forest landscapes method,” in Forest Resources Assessment Working Paper 166, FAO, Rome.
Potapov, P., Yaroshenko, A., Turubanova, S., Dubinin, M., Laestadius, L., Thies, C., et al. (2008). Mapping the world's intact forest landscapes by remote sensing. Ecol. Soc. 13:51. doi: 10.5751/ES-02670-130251
Sanderson, E. W. (2006) How many animals do we want to save? The many ways of setting population target levels for conservation. Bioscience 56, 911–922 doi: 10.1641/0006-3568(2006)56[911:HMADWW]2.0.CO;2
Sanderson, E. W., Jaiteh, M., Levy, M. A., Redford, K. H., Wannebo, A. V., and Woolmer, G. (2002). The human footprint and the last of the wild. Bioscience 52, 891–904 doi: 10.1641/0006-3568(2002)052[0891:THFATL]2.0.CO;2
Sanderson, E. W., Mallon, D., McCarthy, T., Zahler, P., and Fisher, K. (2016). “Global strategies for snow leopard conservation: a synthesis,” in eds T. McCarthy and D. Mallon (New York, NY: Academic Press). doi: 10.1016/B978-0-12-802213-9.00044-4
Secretariat of the Convention on Biological Diversity United Nations Environment Programme (eds.). (2014). Global Biodiversity Outlook 4: A Mid-Term Assessment of Progress Towards the Implementation of the Strategic Plan for Biodiversity 2011-2020. Secretariat for the Convention on Biological Diversity, Montreal, QC.
Strindberg, S., Maisels, F., Williamson, E. A., Blake, S., Stokes, E. J., and Aba'a, R. (2018). Guns, germs, and trees determine density and distribution of gorillas and chimpanzees in Western Equatorial Africa. Sci. Adv. 4:eaar2964. doi: 10.1126/sciadv.aar2964
Taber, A., Chalukian, S. C., Altrichter, M., Minkowski, K., Lizarraga, L., Sanderson, E., et al. (2008). El Destino de los Arquitectos de los Bosques Neotropicales: Evaluacion de la Distribucion y el Esatdo de Conservacion de los Pecaries Labiados y los Tapires de Tierras Bajas. Unpublished report to Wildlife Conservation Society and IUCN Tapir Specialist Group.
Tyukavina, A., Hansen, M. C., Potapov, P. V., Krylov, A. M., and Goetz, S. J. (2016). Pan-tropical hinterland forests: mapping minimally disturbed forests. Global Ecol. Biogeogr. 25, 151–163. doi: 10.1111/geb.12394
Venier, L. A., Walton, R., Thompson, I. D., Arsenault, A., and Titus, B. D. (2018) A review of the intact forest landscape concept in the Canadian boreal forest: its history, value, measurement. Environ. Rev. 26, 369–377. doi: 10.1139/er-2018-0041
Venter, O., Sanderson, E. W., Magrach, A., Allan, J. R., Beher, J., Jones, K. R., et al. (2016a). Sixteen years of change in the global terrestrial human footprint and implications for biodiversity conservation. Nat. Commun. 7:12558. doi: 10.1038/ncomms12558
Venter, O., Sanderson, E. W., Magrach, A., Allan, J. R., Beher, J., Jones, K. R., et al. (2016b) Data from: global terrestrial human footprint maps for 1993 2009. Dryad Digital Repository 2016:67. doi: 10.1038/sdata.2016.67.
Voigt, M., Wich, S. A., Ancrenaz, M., Meijaard, E., Abram, N., Banes, G. L., et al. (2018) Global demand for natural resources eliminated more than 100,000 bornean orangutans. Curr. Biol. 28, 761–769. doi: 10.1016/j.cub.2018.01.053.
Watson, J. E. M., Evans, T., Venter, O., Williams, B., Tulloch, A., Stewart, C., et al. (2018). The exceptional value of intact forest ecosystems. Nat. Ecol. Evol. 2, 599–610. doi: 10.1038/s41559-018-0490-x
Watson, J. E. M., Shanahan, D. F., Di Marco, M., Allan, J., Laurance, W. F., Sanderson, E. W., et al. (2016). Catastrophic declines in wilderness areas undermine global environment targets. Curr. Biol. 26, 2929–2934. doi: 10.1016/j.cub.2016.08.049
Wich, S. A., Singleton, I., Nowak, M. G., Utami Atmoko, S. S., Nisam, G., Arif, S. M., et al. (2016). Land-cover changes predict steep declines for the Sumatran orangutan (Pongo abelii). Sci. Adv. 2:e1500789. doi: 10.1126/sciadv.1500789
Wilkie, D. S., Bennett, E. L., Peres, C. A., and Cunningham, A. A. (2011). The empty forest revisited. Ann. N Y Acad. Sci. 1223, 120–128. doi: 10.1111/j.1749-6632.2010.05908.x
Willock, C. (1964). The Enormous Zoo: A Profile of the Uganda National Parks. London: Longmans, Green and Co., 210.
Wolf, C., and Ripple, W. J. (2017). Range contractions of the world's large carnivores. Open Sci. 4:170052. doi: 10.1098/rsos.170052
Keywords: intact forest landscapes, ecoregions, faunal intactness, prioritization for conservation, species extinction
Citation: Plumptre AJ, Baisero D, Jędrzejewski W, Kühl H, Maisels F, Ray JC, Sanderson EW, Strindberg S, Voigt M and Wich S (2019) Are We Capturing Faunal Intactness? A Comparison of Intact Forest Landscapes and the “Last of the Wild in Each Ecoregion”. Front. For. Glob. Change 2:24. doi: 10.3389/ffgc.2019.00024
Received: 14 January 2019; Accepted: 09 May 2019;
Published: 10 June 2019.
Edited by:
Yadvinder Malhi, University of Oxford, United KingdomReviewed by:
Wayne S. Walker, Woods Hole Research Center, United StatesDaniel J. Wieczynski, University of California, Los Angeles, United States
Copyright © 2019 Plumptre, Baisero, Jędrzejewski, Kühl, Maisels, Ray, Sanderson, Strindberg, Voigt and Wich. This is an open-access article distributed under the terms of the Creative Commons Attribution License (CC BY). The use, distribution or reproduction in other forums is permitted, provided the original author(s) and the copyright owner(s) are credited and that the original publication in this journal is cited, in accordance with accepted academic practice. No use, distribution or reproduction is permitted which does not comply with these terms.
*Correspondence: Andrew J. Plumptre, YXBsdW1wdHJlQGtleWJpb2RpdmVyc2l0eWFyZWFzLm9yZw==