 Roberto Cruz-García1*
 Angela Balzano2
 Katarina Čufar2
 Tobias Scharnweber1
 Marko Smiljanić1
 Martin Wilmking1
- 1Landscape Ecology and Ecosystem Dynamics, Institute of Botany and Landscape Ecology, University of Greifswald, Greifswald, Germany
- 2Department of Wood Science and Technology, Biotechnical Faculty, University of Ljubljana, Ljubljana, Slovenia
Determining the effect of a changing climate on tree growth will ultimately depend on our understanding of wood formation processes and how they can be affected by environmental conditions. In this context, monitoring intra-annual radial growth with high temporal resolution through point dendrometers has often been used. Another widespread approach is the microcoring method to follow xylem and phloem formation at the cellular level. Although both register the same biological process (secondary growth), given the limitations of each method, each delivers specific insights that can be combined to obtain a better picture of the process as a whole. To explore the potential of visualizing combined dendrometer and histological monitoring data and scrutinize intra-annual growth data on both dimensions (dendrometer → continuous; microcoring → discrete), we developed DevX (Dendrometer vs. Xylogenesis), a visualization application using the “Shiny” package in the R programming language. The interactive visualization allows the display of dendrometer curves and the overlay of commonly used growth model fits (Gompertz and Weibull) as well as the calculation of wood phenology estimates based on these fits (growth onset, growth cessation, and duration). Furthermore, the growth curves have interactive points to show the corresponding histological section, where the amount and development stage of the tissues at that particular time point can be observed. This allows to see the agreement of dendrometer derived phenology and the development status at the cellular level, and by this help disentangle shrinkage and swelling due to water uptake from actual radial growth. We present a case study with monitoring data for Acer pseudoplatanus L., Fagus sylvatica L., and Quercus robur L. trees growing in a mixed stand in northeastern Germany. The presented application is an example of the innovative and easy to access use of programming languages as basis for data visualization, and can be further used as a learning tool in the topic of wood formation and its ecology. Combining continuous dendrometer data with the discrete information from histological-sections provides a tool to identify active periods of wood formation from dendrometer series (calibrate) and explore monitoring datasets.
Introduction
Forest growth monitoring has become an important field of research, given that current climate prognoses indicate that there will be regionally heterogeneous seasonal changes (IPCC et al., 2014). Hence, intensive monitoring is performed at the tree and stand level and more frequently an assembly of these datasets is used to understand forest and tree growth under a changing environment (Klos et al., 2009; Solberg et al., 2009; Pretzsch et al., 2014). The most common approaches to study seasonal tree growth dynamics and wood formation phenology include the monitoring of stem-size variation (dendrometers), repeated wounding of the cambium through the pinning technique (e.g., Gričar et al., 2007) and repeated cambium sampling through microcores (e.g., Mäkinen et al., 2008; Drew and Downes, 2009; Prislan et al., 2013; Balzano et al., 2018). Among these approaches, the use of point-dendrometers has been shown to be an effective technique for recording intra-annual tree growth variability and attempts have been made to link radial variations to meteorological conditions by disentangling hydraulic stem-diameter fluctuations and biomass increments (Deslauriers et al., 2007; van der Maaten et al., 2013, 2018; Aldea et al., 2018). Although the use of daily stem variation data seems to be promising for understanding the ecology of radial growth on a fine temporal scale, its use on determining (absolute) wood formation phenology is limited, since changes in stem water content can potentially mask signals from actual cellular production (Cuny et al., 2015; Sass-Klaassen, 2015). This aspect is highly relevant in dendrochronology, since wood (xylem) formation phenology provides the key to interpret different tree-ring parameters (e.g., Prislan et al., 2018; De Micco et al., 2019) as the observed climate correlations can be the result of complex interactions between environmental conditions and physiological processes (e.g., Fritts, 1976; Čufar et al., 2008). It is widely acknowledged that xylogenesis can only be accurately determined through microscopic observations of the cambium and currently formed wood in different phases of differentiation. Since it occurs inside the tree stem, the pinning or microcore techniques are often used to track the different phases of wood formation.
Comparisons of intra-annual growth dynamics between high resolution dendrometer readings and xylogenesis have proven insightful to understand the temporal dynamics related to the tree-ring formation process (Cocozza et al., 2016; Cardil et al., 2018). The comparison of the two methods has been mostly done between different trees growing in the same stand with similar growth rates (Mäkinen et al., 2008; Camarero et al., 2009; Linares et al., 2009; Chan et al., 2016; Cocozza et al., 2016), while few studies have assessed dendrometer readings and cambial activity of the same trees (Michelot et al., 2012; Cuny et al., 2015; Ziaco and Biondi, 2016; Güney et al., 2017). Although general growth patterns from a stand can be captured while monitoring intra-annual stem dynamics with different approaches on different trees, large individual variability has been reported on monitoring data of broad-leaved trees in the temperate Central European forests (Čufar et al., 2008, 2011; Prislan et al., 2013; Martinez del Castillo et al., 2018). This complicates a direct comparison of dendrometer data with time series of cell production and development from repeated microcoring, especially if the data is derived from different tree-individuals. Adding to the relevance of xylogenesis studies for dendroecology, it is noteworthy that during the last two decades, wood anatomy and the intra-annual dynamics of wood formation have become a relevant field of study given the uncertainty of knowing how trees and forests will respond to climate change (Prislan et al., 2013, 2016, 2019a; Gričar et al., 2015; Martinez del Castillo et al., 2018). Related to this, software mostly developed for the R programming environment (R Development Core Team, 2018) that specializes on dendrometer data and xylogenesis has been developed over time, focusing mostly on the statistical assessment and visualization of time series (Rathgeber et al., 2011, 2018; van der Maaten et al., 2016). Although the tools for their specific assessment are available separately, combining dendrometer measurements with wood anatomical approaches has the potential to improve our mechanistic understanding of xylem development and environmental conditions, which in turn would help to physiologically explain climate-growth relationships (Rathgeber et al., 2016). Thus, allowing the exploration of individual trees' phloem and xylem formation behavior and their respective growth signals in dendrometer records, the proposed visualization tool can contribute to improve the parametrization of mechanistic models that deal with larger-scale ecological phenomena. These include, for instance, forest landscape models (FLM; Gustafson et al., 2016), which model forest dynamics based on interacting processes such as competition, growth, seed dispersal and disturbance. Exploring phloem and xylem formation parameters based on individual tree characteristics that could affect these processes (e.g., species, tree social status, size, etc.) can enhance the performance and interpretability of such models. Likewise, the use of the simple visualization tool allows for the identification of stem-water dynamics and possibly separate them from periods of actual growth, by identifying active cell production in dendrometer records. This can also facilitate the posterior quantitative analysis of dendrometer records.
Xylem phenology is characterized by the cellular development phases of cell division, cell enlargement, secondary wall formation and maturation (lignification and apoptosis) (Rathgeber et al., 2016). Phloem cell production is lower than in the xylem and it is less responsive to variability in climate (Prislan et al., 2013). Its cells can be roughly characterized in early and late phloem, according to the formation time (Gričar and Čufar, 2008; Prislan et al., 2019b). These processes are linked to irreversible stem enlargement, however since dendrometer readings also integrate reversible stem hydraulic dynamics, these are known to deliver rough estimates of cambial activity and less reliable critical dates like onset and cessation of growth (de Vries et al., 2003; Deslauriers et al., 2007; Solberg et al., 2009; van der Maaten et al., 2018). Therefore, a calibration and comparison with anatomical sections of tissues including cambium and forming wood of the same tree should be performed to securely separate both processes from each other. This in turn can make monitoring data more relevant in understanding carbon and biomass deposition dynamics in forests, since cambial sampling and preparation of microscopic sections up to data production is highly time and resource consuming (Rossi et al., 2006).
By generating methods and tools to accurately derive wood formation phenology estimates from dendrometer data (for example estimates based on growth model fittings) we can be a step closer to include the variability related to wood formation in climate-growth relationships and ultimately for species distribution models which use climate variables to constrain species ranges. For the purpose of characterizing seasonal wood growth data, the Gompertz function has been the standard use sigmoid curve, since a re-parametrized version of it can be biologically interpreted (Zwietering et al., 1990; Rossi et al., 2003). Although usually yielding high goodness of fit model values, several other sigmoid models can be ultimately used to describe the wood formation process, such as the Weibull function (van der Maaten et al., 2018) and ad-hoc models with biological interpretability (McMahon and Parker, 2015). However, only few studies have compared different models to estimate critical dates (e.g., Korpela et al., 2010). Although the main application of model fitting to tree growth curves is the standardization of data for the investigation of weather forcing of stem-radius variation, oftentimes assumptions on the wood formation process are performed with model fits. This outlines the need to assess which methods yield best estimates of critical dates for xylogenesis.
A potential application of combined dendrometer records and xylogenesis imagery is to determine, according to the observed tree species and its ecology, which dendrometer methods are more accurate for the permanent monitoring of tree-growth. Microcoring being time and effort intensive, can be applied for a short term only for the determination of best indicators of phenological phases, thus in a sense allowing for the calibration of dendrometer measurements. In this article we present DevX, a software implementation for an interactive visualization of dendrometer stem radial variations cumulative curves and xylogenesis samples (microcore thin-sections) using the widespread statistical programming environment R (R Development Core Team, 2018). With these interactive visualizations, ecologists, foresters, dendrochronologists, and wood anatomists can inspect how well-modeled dendrometer data and its derived estimates of phenological events fit with actual wood formation imagery.
Materials and Methods
Case Study Site
The case study data used for the deployment of the application was obtained from a permanent forest monitoring plot located in the silviculturally managed area of Eldena, a temperate broadleaf lowland forest in northeast Germany (Coordinates 54°04′39.2″N, 13°28′31.6″E) and part of the LTER-D (German Long Term Ecological Research) network. The area is situated in a morainic landscape, having hydromorphic and stagnic soil types (Buczko et al., 2017). The region has a temperate humid climate with mean annual temperature of 8.1°C and annual precipitation of 562 mm (Harris et al., 2014; 1901–2017 mean). In the beginning of 2016, three European beech (Fagus sylvatica), three pedunculate oak (Quercus robur), and two sycamore maple (Acer pseudoplatanus) trees were selected and point-dendrometers (Type DR, Ecomatik, Munich, Germany) installed at the trunk. Before mounting, the dead outer bark was removed from oaks and maples to ensure low influence of its changes on measurements. The investigated trees are all dominant or co-dominant, and represent the three most abundant tree species present in the plot. Beech trees located in this stand have an average height of 22.4 m (± 9.5) and a DBH of 32.5 cm (± 25.7), sycamore maples with 23.2 m (± 7.89) average height and 32.4 cm (± 16.6) mean DBH. Pedunculate oaks, less abundant in this plot than beech and sycamore maple, are characterized by an average height of 33.0 m (± 2.36) and a DBH of 61.5 cm (± 14.0). A detailed map with the spatial location of the monitored trees can be found in Figure 1. The available tree-ring data for the monitored trees indicate that sycamore maples and oaks have a cambial age between 131 and 133 years and beech trees in average 191 years.
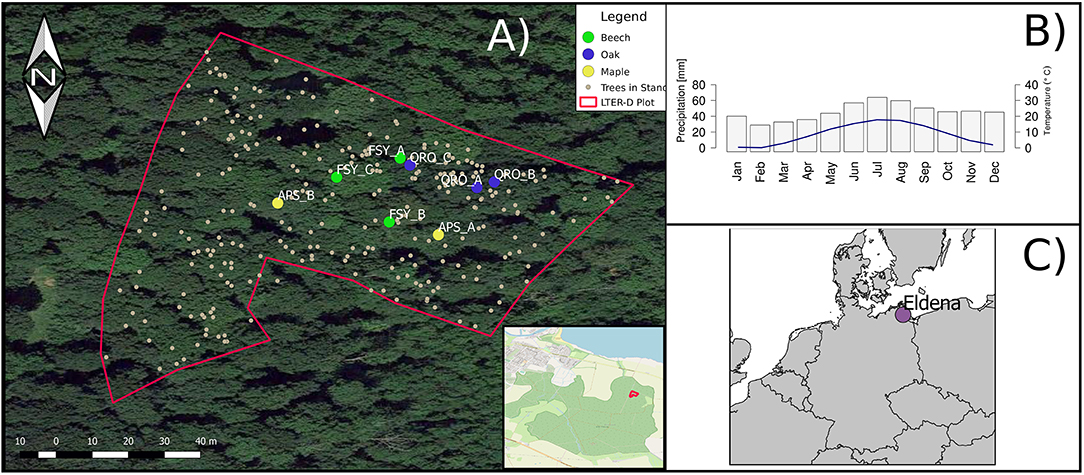
Figure 1. General overview of long term monitoring plot and location of trees from the presented case study, where tree name abbreviations correspond to the species (Beech = FSY, Oak = QRO, Maple = APS) and letters to individual trees. The inset represents the location of the stand within the whole forest surface (A) (OpenStreetMap Contributors, 2017). The pre-loaded data in DevX contains monitoring data (dendrometer series and histological images) from these individuals. Monthly average precipitation sums (gray bars) and temperature (blue line) of the site during the period 1901–2017 (B), taken from CRU-TS 4.02 Dataset. Overview of location of case study site (C).
Dendrometer Readings and Microcore Sampling
Stem radial variations were monitored with temporal resolution of 1 min using point dendrometers of the Radius type (Ecomatik, Munich, Germany) installed at 3 m height on the northward side of the trunk, and connected to CR1000 dataloggers (Campbell Scientific Ltd., Logan, USA) using a “Full-Bridge” configuration. The final resolution and accuracy of the datalogger-dendrometer setup was, therefore, 0.2 and 1.5 μm, respectively. Furthermore, two microcores with a diameter of 2 and 15 mm length were obtained every sampling date at breast height from each tree equipped with a point-dendrometer during the growing season of 2016. Sample collection was performed from mid March to June on a weekly basis, and biweekly thereafter until November. A Trephor tool was used to extract the microcores following a spiral pattern on the tree stem, with a minimum distance of 5 cm between sampling points to avoid collection of wound tissue (Rossi et al., 2006). After collection, microcores were placed in 80% ethanol for transportation and immediately embedded in PEG after arriving to the laboratory (Polyethilenglycol-−2000, Carl Roth GmbH&Co. KG, Karlsruhe, Germany). For the embedding procedure, PEG was warmed to 60°C to become fluid and placed in metal containers where a small amount was poured on. When this small layer of PEG solidified, the microcore was placed on it with the radial plane parallel to the ground, afterwards the plates were filled with liquid PEG and left to solidify. Thin-sections with a thickness of 8 μm were cut with a rotary microtome (Leica RM 2245, Wetzlar, Germany). The sections were stained using a safranin/astra-blue solution (Gärtner and Schweingruber, 2013) and mounted in Euparal (Carl Roth GmbH&Co. KG, Karlsruhe, Germany). Photographs were taken with a light microscope (Leica DM 2500, Wetzlar, Germany) equipped with a camera (Leica DFC450C, Wetzlar, Germany) and further annotations were made on the digital files using a standard graphics editor (Inkscape 0.92, Inkscape Project). On the slides, the following tissues were identified: cambium (CC), differentiating cells in the phases of enlargement (E), cell wall-deposition and lignification (W) and fully mature (M) cells (e.g., Prislan et al., 2009; Martinez del Castillo et al., 2018).
Curve Fitting Methods (Weibull, Gompertz)
The commonly used Gompertz (Equation 1) and Weibull (Equation 2) functions were fitted to the dendrometer data series. As a first step, dendrometer series were standardized relative to the total radial increment of the length of the series (Min-Max standardization). This step was undertaken to ease subsequent model fitting procedures. Sigmoid Gompertz (1) and Weibull (2) functions were fitted using the R “stats” package. These functions have been widely used in dendrometer and xylogenesis studies (e.g., Deslauriers et al., 2003; van der Maaten et al., 2018).
Their formulas are defined as
and
where y is stem-radius variation, t is time in 30 min intervals, A is the asymptote of the curve, μ is the largest slope, λ as lag-phase (prior to growth begin), T as a scale parameter (point in time where 63% of total cumulative growth is achieved) and m is a shape parameter. The shown Gompertz formula is a re-parametrization which makes its terms biologically meaningful (Zwietering et al., 1990).
Deriving Phenological Phases
Growth phenology was calculated based on the fitted sigmoid models. Based on the Gompertz and Weibull model fits as well as the raw dendrometer measurements the points in time where 5 and 95% of the total radial increment were identified and set as growth onset and growth cessation, respectively. In the case of raw data, the first point in time where 5 or 95% of growth was achieved was used to estimate onset and cessation of growth for comparison with fitted curves. Growth duration was calculated as the number of calendar days between these estimates.
Interactive Data Analysis (DevX)
To visualize wood development from the obtained microcore digital images together with dendrometer cumulative radial displacement curves, an interactive graph deployed as a web application, called DevX, was developed using the “Shiny” and “shinydashboard” packages for the R statistical programming language (Chang and Borges-Ribeiro, 2018; Chang et al., 2018). Upon starting the visualization, the initial page (“Data selection,” left menu) indicates how to upload user generated data by on-screen instructions. The instructions are simple to follow and in general make two requirements to launch the interactive graph: (a) dendrometer records in a CSV (“Comma-separated values”) file with three columns (“tree,” “dendrometer,” and “time”) which indicate the individual tree identity, the stem-radial cumulative curves and the timestamp value, respectively and (b) digital images of histological sections in PNG format whose file name should contain the identity of the corresponding individual (matching the “tree” column of the CSV file) and the date of sampling (in day, month, and year format—“DDMMYYY”). In the current DevX version, the species name should be encoded in the first three letters of an individual tree identity (as in the case study data). For the timestamp value in the CSV file, a string that can be converted to “POSIXct” class (usually a string indicating the date followed by time in hours, minutes, and seconds) is expected. Furthermore, the user has the option to upload annotated images, in case they are available. If annotated images will be uploaded, their file names have to exactly match non-annotated images. Examples of valid data are shown in the software itself and instructions on how to upload user data is presented in Figure 2.
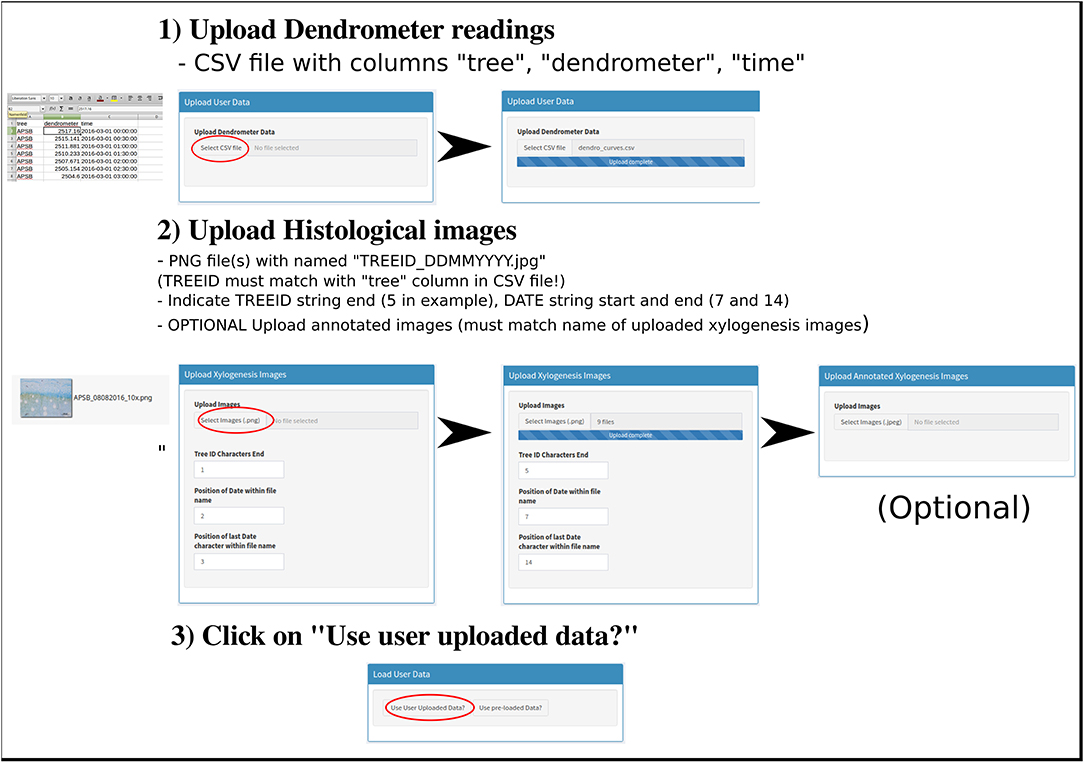
Figure 2. Graphical instructions on how to upload user data. After completing the outlined steps, the “Dendro/Thin-section Viewer” page will load showing the dendrometer curve and available xylogenesis images.
To start the visualization, the user either has to upload the required data, or explore the software with the pre-loaded case study data. If the user wishes to upload data, this has to be performed first and afterwards the corresponding button should be clicked. By pressing the corresponding button in the “Load user data” box, the program launches the option “Dendro/Thinsection Viewer,” where it is possible to click on the available microcore sampling dates of each tree, which displays an image of the obtained wood sample. The dendrometer data of the case study is comprised of cumulative values of radial displacement measurements taken every 30 min, while the microcores were sampled every week or biweekly at the same weekdays. For this reason points representing microcore sampling dates/images are represented in a daily scale on the x-axis.
A secondary panel named “Phenology Comparison” is included. In this option a faceted scatter plot with phenology estimates per tree, grouped by species (encoded in the first three letters of individual tree identities), is displayed. Growth onset and cessation were expressed as dates in day of year format (DOY) and length as amount of days. A control option was included to choose the curve from which the derived wood phenology phases originated. Also, a control panel is included that allows for (a) choosing a tree record to display and the date range within the available data and (b) the option to choose the phenology dates (growth onset and cessation) as derived from the fitted sigmoid models or raw curve and to choose which model fits (Weibull or Gompertz) to show, as well as the option to display the thin-section image with or without annotations on their features, in case these were uploaded (available for the pre-loaded data). For the manipulation and preparation of the dendrometer data and microcore image date and identification, the packages, “readr,” “broom,” “ggplot2,” “dplyr,” and “lubridate” were used (Grolemund and Wickham, 2011; Wickham, 2016; Wickham et al., 2017a,b; Robinson and Hayes, 2018). The software and its code are available upon request as well as directly on the online deployed application under “Source Code” at the left panel (“https://rcruzgarcia-dendro.shinyapps.io/DevX”).
Results
Comparison of Derived Phenology for Different Methods
After fitting the Weibull and Gompertz curves to the raw standardized dendrometer curves, wood phenology estimations were obtained for each tree and averages as well as deviations from the mean. Growth begin, growth cessation and growth duration were obtained based on fitted Weibull and Gompertz curves and also from the raw curves for comparison. In general, the Weibull model consistently yielded smaller values (i.e., earlier dates) than those obtained from the Gompertz model, in average for all trees. The derived phenology dates based on raw data consistently showed earlier growth begins, considerably later growth cessation dates and consequently longer growth duration and were similar for the three species analyzed. Although the sample size is low, it is evident that the unfitted (raw) dendrometer cumulative measurements do not supply realistic results, since a previous study performed in the same study area found that growth phenology is highly species specific, which the raw data estimates failed to capture (van der Maaten et al., 2018). When considering Weibull and Gompertz phenology estimates, beech averages generally suggest shorter growth duration and an earlier finish than sycamore maple. The latter showed the latest growth begin of the three observed species. Oak on the other hand exhibited the earliest growth begin and latest growth cessation and consequently also presented the longest growth duration (Figure 3).
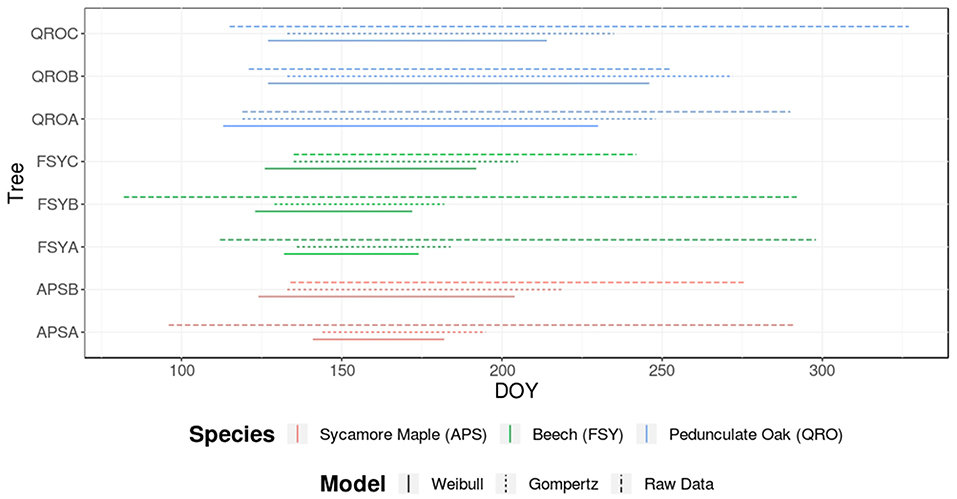
Figure 3. Derived phenology estimates from dendrometer data for three main broadleaved tree species of central Europe and treated in the presented case study. The lines represent the growth period of the monitored trees according to the estimated dates by the fitted models (and also by the raw-unfitted dendrometer measurements for comparison). The color of the lines indicate the species and the line type the model fitting used to derive phenological phases.
Based on the stem radial variation data obtained from dendrometer records, the stem increment in 2016 was the highest for the monitored oaks (QROA = 2.0 mm, QROB = 4.27 mm, QROC = 1.27 mm). The beech individuals showed homogeneous increment levels (FSYA = 0.64 mm, FSYB = 0.73 mm, FSYC = 0.84 mm) whereas the two monitored sycamore maples showed contrasting stem increments (APSA = 0.40 mm, APSB = 1.89 mm). See Supplementary Figure S1 for an overview of the before mentioned raw stem increment curves.
Phenology Estimates and Wood Formation on the Cellular Level
To show the functionality of the application, for each species one tree was used to offer a qualitative comparison of the synchronism of phenology estimations and thin-section evidence. Here only the beech example is presented below and in Figure 4, see Supplementary Figures S2, S3 for a similar assessment of oak and sycamore maple data. The Weibull and Gompertz estimates of wood formation onset, cessation, and duration were compared with wood formation images. To descriptively assess the histological images the following criteria were followed: (1) the onset of growth can be defined based on observing the first xylem cells produced by the cambium (C), which were in the phase of enlargement (E) and contained primary cell wall; (2) The end of growth can be defined as the stage where no newly produced E cells are observed, while the wood of the currently formed growth ring might contain cells in the phase of cell wall deposition and lignification (W) and fully mature (M) cells.
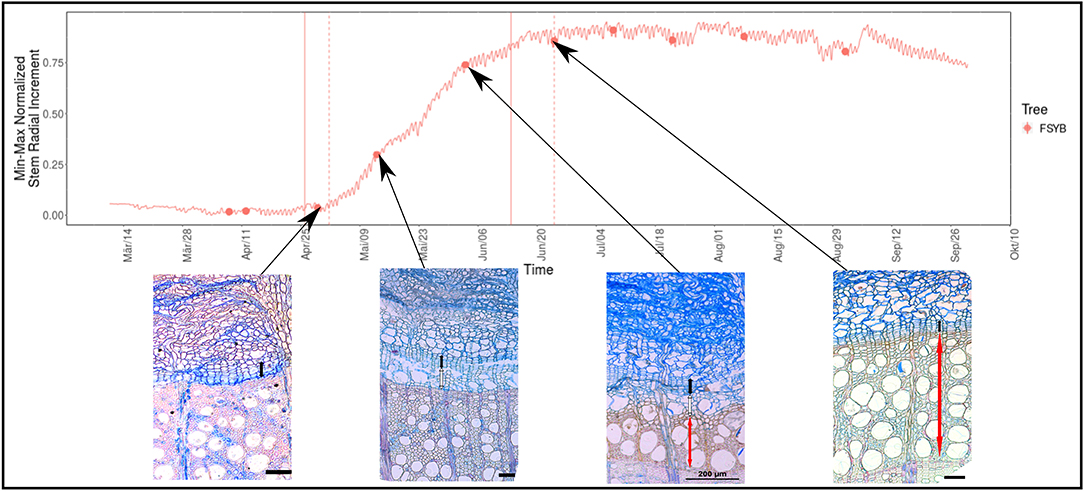
Figure 4. DevX image composition for the beech example. In the top diagram, the normalized (scaled to min-max values) cumulative growth curve for beech specimen “B” in 2016 is shown. The vertical lines depict the growth onset and cessation estimates according to Weibull (solid) and Gompertz (dashed) model fits. Below, the micro-core images relevant to the estimates are shown. Each red dot represents an available micro-core image, which can be displayed by simply clicking on the respective dot. On the lower histological images, the cambium (C) is depicted by a black bar, wood of the current growth ring with cells in the phase of extension and cell wall deposition and lignification (E and W) by a white bar and fully mature (M) cells by a red bar. All Scale bars 100 micrometers (except otherwise stated on the image).
For Beech individual “B” a histological section from the 29th of April 2016 fell between both the Gompertz and Weibull estimates of growth begin (Figure 4, note that this illustration is a composition of images contained in the online version of DevX and the same is valid for the figures in this section). The histological section showed a cambium zone ca. 8 cells wide and no newly produced cells in phase E. The onset of growth as estimated by Gompertz (Figure 4) is therefore closer to the true onset of cambial production than the Weibull estimation. The sample taken on the 13th of May showed the current tree-ring with xylem cells in phases E and W, and the slide taken on the 3rd of June presented cells in all phases of differentiation (E and W), including some mature cells (M). The thin-section taken on the 24th of June, close to the asymptote phase of the growth curve, showed that wood production ceased and the last formed cells were in phases W and M. This agreed with the estimation of growth cessation by the Gompertz model fit.
Additionally, a simple assessment on the identification of the main period of growth in dendrometer data was performed for sycamore maple individual “A.” An inspection of the available histological sections indicates that cambium activation was not reached by the 3rd of June 2016, although the dendrometer series indicates an upward change in slope. This upward trend (marked with the left blue bar on Figure 5) might be related to stem-radial variations caused by re-hydration before the active growth period commences. On the other end, the histological section from the 1st of September showed a fully mature tree-ring. In the showcased example, we adjusted the length of the dendrometer curve (by adjusting the “Choose a date range” box) to display the dendrometer series segment where active cellular growth is occurring.
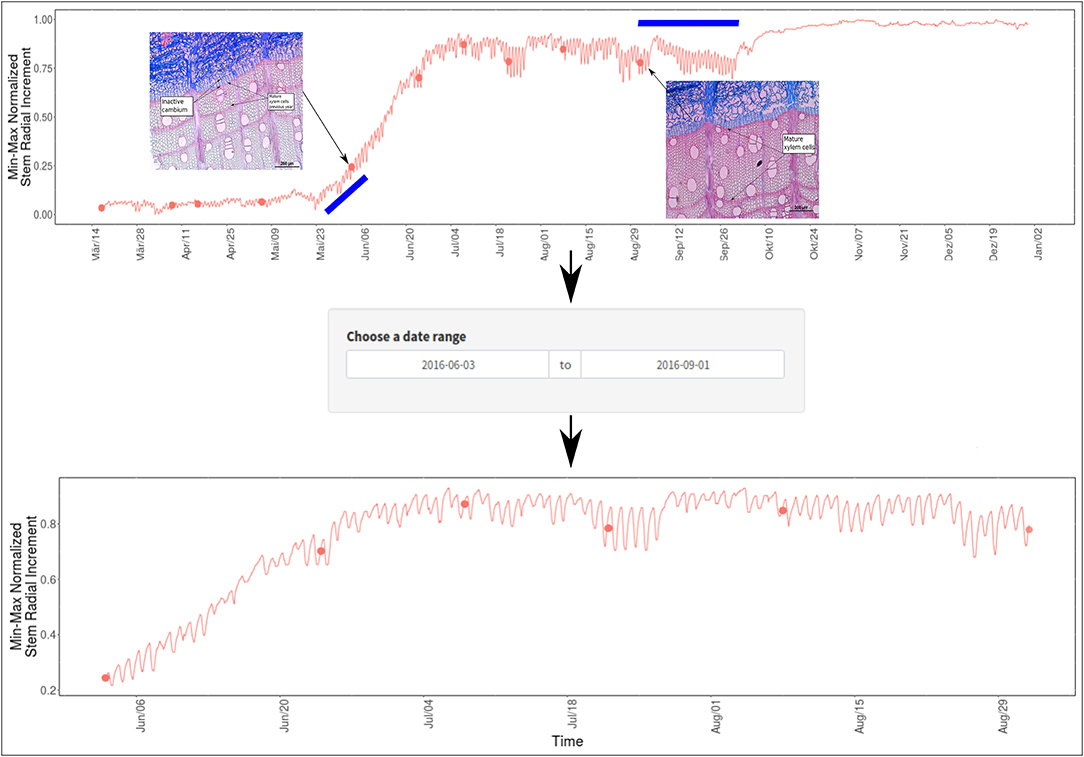
Figure 5. DevX image composition displaying how to find the period of active growth in dendrometer series. In the top diagram, the identified microcore images indicate that the period in between contains the active growth signal in the dendrometer curve. The periods marked with a blue bar, when considering the xylogenesis stage at that point in time, can be attributed to signals regarding other factors affecting stem dynamics.
Interactive Application
The resulting application written in R can be accessed at “https://rcruzgarcia-dendro.shinyapps.io/DevX/.” In the online repository (“Source Code” left menu in previous link) all files and scripts required to run the code locally in R can be found. The files can be freely downloaded as a bundle or individually. To start the application the file “DevX.R” should be run in an interactive R session. If the user has more than 40 images to combine with dendrometer data, it is recommended to run the program locally. The software is pre-loaded with the presented case study data of monitored trees in northeastern Germany, as well as available microcore thin-section images. The user can follow the simple instructions on screen (also described in section Material and Methods) to either upload data or use the pre-loaded case study data to explore the visualization method. The online deployed program is available to anyone with Internet access and standard up-to-date browsers (Chrome, Safari, Mozilla Firefox, etc.). An overview of the application can be found in following Figure 6.
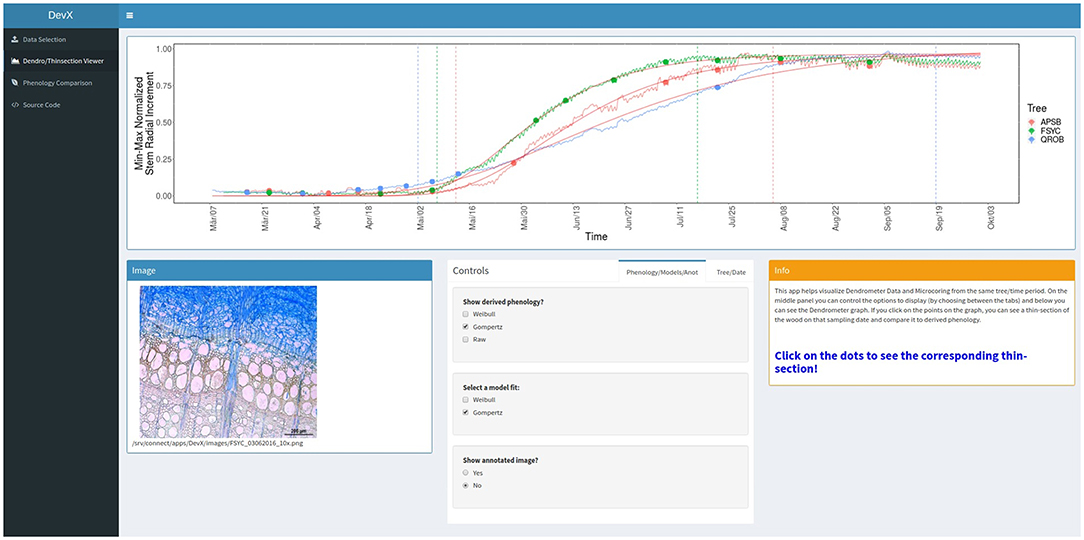
Figure 6. DevX overview. A screen shot of the currently deployed online version of the presented visualization tool. An overview of its functionality and options are given in the section “Material and Methods—Interactive data visualization”.
Discussion
With the development of DevX, we demonstrated that the methodology used to characterize the general patterns of intra-annual stem-radius variations can lead to different results regarding the definition of critical dates for wood formation. Dendrometer data being more readily available, should be used carefully when assumptions about wood formation processes are made. The methodologies used to characterize sigmoid growth curves for trees in temperate forests (with a clear unimodal cambial activity pattern throughout the year) are useful to observe general species-level patterns. Hence, to obtain precise xylogenesis critical dates, the use of microscopic observations of the cambium and currently produced wood, through microcoring or a similar technique, should be considered. Considering the lack of a clear synchronization of stem-radial variations and cambial activity, species-specific calibrations of dendrometer records with xylem development sampling should be attempted, also as a prior step when analyzing weather forcing on stem-radius variation. The application presented here offers a method to easily do this, once dendrometer records and thin-sections of repeated cambium sampling are available.
Dendrometer and Microcore Studies
Dendrometers are generally designed to register an increase in tree diameter. Smaller daily or seasonal fluctuations are due to general swelling and shrinking of tissues associated with water balance and changes in the bark, i.e., production of phloem (e.g., Gričar and Čufar, 2008; Gričar et al., 2014, 2016) as well as processes of tissue inflation, sclerification, collapse, and shedding in older bark. The cambium is a bi-facial meristem which produces wood and bark (phloem) tissues where the production of the xylem is normally much higher than the production of the phloem (Gričar et al., 2009; Prislan et al., 2011). As the changes in dimensions due to water balance and processes in the bark are minor, the measurements by dendrometers mainly record wood production (e.g., King et al., 2013; Cuny et al., 2015). Nonetheless, stem-radial variation changes in stem water content (reversible changes) at the daily scale can be bigger than actual cellular production (irreversible changes) (Deslauriers et al., 2007), which can make the calculation of exact critical dates of wood formation from dendrometer data uncertain. This has been demonstrated in the case study loaded in DevX. Studies where both approaches, dendrometer, and histological measurements are combined are still scarce, mostly focusing on conifers in temperate (Michelot et al., 2012; Cuny et al., 2015; Urban et al., 2015), Mediterranean (Camarero et al., 2009; Linares et al., 2009; Vieira et al., 2014a,b; Pacheco et al., 2016; Güney et al., 2017), and boreal forests (Chan et al., 2016) or mountain ranges (Ziaco and Biondi, 2016). Some examples of the use of band dendrometers and xylogenesis analysis in the tropics also exist (Mendivelso et al., 2016). Even fewer studies compare microcore samples and dendrometer records of the same tree (Michelot et al., 2012; Cuny et al., 2015; Urban et al., 2015; Ziaco and Biondi, 2016; Güney et al., 2017). Comparisons of the methodological approaches for detecting phenological phases on cumulative stem-radius variations have been performed in several data analysis methods by Korpela et al. (2010), although none of the widespread sigmoid models were tested (i.e., Gompertz, Weibull, and logistic functions). In their work, they concluded that the application of cumulative sum (CUSUM) charts (Page, 1954) to detect parameter changes in time-series was the most accurate method to detect phenological phases in dendrometer records, as compared to expert assessments (Korpela et al., 2010). The applied CUSUM charts are a tool to effectively detect changes in the mean of dendrometer series, however it does not detect increments in mean related to water uptake or cell formation, which can be overcome by inspecting cellular characteristics of the cambium and differentiating wood at different time points during the vegetation period. Without a mechanistic model of stem-hydraulics and the xylogenesis process or just without observations of thin-sections, it is almost impossible to tell if an increase in dendrometer values is (unequivocally) due to production of new cells or to water uptake. Additionally, specialized software for the calculation of critical dates from wood formation histological datasets exists, however the focus lies on data analysis rather than visualization of different data sources (Rathgeber et al., 2018). The use of a visualization tool, like the one we present, could also aid in the parametrization and development of hydraulic models that disentangle growth and swelling-contraction of stem tissues. Through the use of hydraulic models, Chan et al. (2016) performed a model parametrization in which the contribution of stem hydraulics and cell production to stem-radial variations in Scots pine in Finland was quantified. Such studies could benefit from the use of the presented application by qualitatively analyzing the model fits to monitoring records.
When considering stem radial variation data, the possible phenological phases that can be identified include growth begin, growth period (amount of days) and growth cessation (e.g., Rother et al., 2018; van der Maaten et al., 2018). Since dendrometers record also water storage fluctuations, analysis of weather forcing on intra-annual radial growth should be performed on the period of time where the cambium is actively forming phloem and xylem (Deslauriers et al., 2007). In fact, stem variation in slow growing tree species in temperate and boreal forests can show larger variability due to water budget of the stem (e.g., re-hydration in spring, freezing, and thawing in winter) than actual increments due to cellular growth (Deslauriers et al., 2007). The advantage of using dendrometers for this purpose is the relatively easiness with which they can be installed and its already widespread use in permanent forest monitoring plots, being the main disadvantage that it remains challenging to neatly extract growth signals from them (Chan et al., 2016). To overcome this, it is almost unavoidable to look inside the tree stem through cambial sampling methods and define the timing of critical dates through histological analysis. Due to this, dendrometer series can only possibly reflect phases of xylogenesis where cells are dividing/enlarging.
Case Study—Xylem Phenology of Central European Temperate Tree Species
Although the sample size in the case study is not large enough to draw conclusions on the ecology of xylogenesis for the species of the monitored trees, a short discussion on the obtained results, and thus an example of the possible insights DevX might provide, is presented as follows.
The general pattern obtained by the derived phenology might indicate a species-level life strategy adaptation in the timing of growth. Regarding forest succession in Central European lowland temperate forests, pedunculate oak is considered an intermediate, sycamore maple an intermediate-late and beech a late successional species (Leuschner and Ellenberg, 2017). This can be is reflected in an early growth start, longer duration and larger growth increments in our monitored oaks. Beech, as a tree species with diffuse porous wood anatomy, leaf out and wood production by the cambium at the breast height occur approximately at the same time (Čufar et al., 2008; Prislan et al., 2013). Growth duration and growth cessation are rather similar for beech and sycamore maple. It must be noted that to understand (wood) phenological dynamics in temperate forests tree age and stand structure should be considered, since productivity can decrease with age (Ryan et al., 1997), competition stress (Linares et al., 2009) and can be affected by species-level leaf phenology (Cuny et al., 2012; Michelot et al., 2012). All these factors, which could not be controlled in our case study, can affect xylogenesis and radial growth rates and would provide a wider picture of the general intra-annual growth process.
Comparisons of dendrometer and histological wood formation analysis specifically for temperate lowlands forest tree species are scarce in general. Considering work performed outside this area, most studies where both monitoring methods are applied have found a delay in wood formation phenological phases, when compared to dendrometer records (Mäkinen et al., 2008; Michelot et al., 2012; Güney et al., 2017), which might be partly ascribed to differentiation and production of phloem (e.g., Gričar et al., 2009, 2016). Urban et al. (2015), although not comparing growth curves of both monitoring approaches, found that the growth begin in dendrometers coincided with histological observations in a pure beech forest. In conifers, according to Mäkinen et al. (2008), growth dynamics can systematically lag more than a week behind for microcores when compared to dendrometer records. They also found that the 95% increment in dendrometer records was reached at least one week later compared to the growth cessation date as extracted from cell counting. For angiosperm seasonal wood dynamics, Michelot et al. (2012) found a similar lag between measurements for beech and oak in an oceanic-temperate forest stand in France. A visual assessment of the influence of phloem and xylem formation on the stem radial variation dynamics could be performed through the use of the DevX visualization method, which can improve the discussion on the role of phloem formation, early wood vessel formation (e.g., in pedunculate Oak) and stem re-hydration dynamics. These processes might leave a confounding imprint in dendrometer records, which could be explored through thorough analysis of xylem and phloem development imagery and intra-annual tree growth curves.
Regarding the differences between the applicable sigmoid functions, based on goodness of fit values and general interpretability, the Gompertz, Weibull, and general logistic (not shown in DevX) models can certainly almost equally be used to characterize seasonal growth patterns of tree ring formation in temperate environments (Pödör et al., 2014). For our case study, the Gompertz derived phenology consistently delivered estimates closer to the histological evidence. DevX can be used to explore which fitting function delivers more accurate critical date estimates, considering a sufficient sized sample.
Use of the Application in an Educational Context
The presented application DevX might be also interesting for educational purposes, particularly in curricula that are dealing with topics such as wood anatomy, wood formation, sylviculture, forest monitoring, plant physiology, tree productivity, and wood quality. Its interactive display in the basic first version (presented in this article) can be used to explore the temporal dynamics of wood formation in angiosperms with a marked seasonal growth. It could be used to comprehend stem-hydration, plant histology and wood phenology dynamics, as well as to statistically characterize intra-annual tree growth data.
Limitations
The main limitation for the extended use of this tool is obtaining the required data. Unfortunately, microcoring of cambial tissue has a limited potential in long-term forest monitoring, due to the large variability in wood phenology between years (Martinez del Castillo et al., 2016; Prislan et al., 2019a) and the time-consuming laboratory work involved in the preparation of histological sections. Nevertheless, the combination of these data could allow for a more efficient use of high precision dendrometer records, which are widespread employed. A calibration of dendrometer readings with xylogenesis analysis for at least one growing season can help to derive more realistic estimates to study variability in the wood formation process over time, without the need for repeated intruding sampling and extenuating laboratory work.
Conclusion
The improvement and development of methodologies and statistical approaches to disentangle the processes within dendrometer series will lead to a more efficient use of data that is already available for a large number of monitoring plots throughout forests in the world. Dendrometer data can help to understand the influence of climate and weather on growth processes and with caution, also offer insights on growth phenology. If growth dynamics are neatly extracted from intra-annual dendrometer records and calibrated by xylogenesis data, it will also be possible to use this information to make predictions on the impact a changing climate can have on timing and duration of wood formation, and thus enhance the use of such data not only for theoretical discussions but also for practical applications. Furthermore, its use as a simple visual inspection tool can potentially be an aid during the development of next generation vegetation models which include input from single individuals, allowing for finer parametrization of individual tree growth rates and phenology of secondary growth. The software we present in this publication can be used toward these goals by scrutinizing the signals that dendrometer data contain, as well as the assumptions we base on them, by comparing perspectives of the same process (with histological sections) and thus enhancing their individual value. Furthermore, DevX has the potential to serve for educational purposes in forestry and biology curricula, by creating a simple visual representation of a complex biological process.
Data Availability Statement
The datasets generated for this study are available on request to the corresponding author.
Author Contributions
RC-G, MS, TS, and MW designed the study. RC-G, MS, and TS collected the data and tissue samples. RC-G designed the software application and wrote the first draft of the manuscript. All authors contributed to manuscript revision, read, and approved the submitted manuscript.
Funding
RC-G was supported by a DAAD-Conacyt Mexican Government scholarship. The work of AB and KČ was supported by the Slovenian Research Agency (ARRS), program P4-0015.
Conflict of Interest
The authors declare that the research was conducted in the absence of any commercial or financial relationships that could be construed as a potential conflict of interest.
Acknowledgments
The authors are thankful to Ilse Siller-Aguillón for assistance in sample collection and histological section preparation. The authors also wish to thank the partners involved in the Waldklimafonds FOMOSY-KK Project for their support.
Supplementary Material
The Supplementary Material for this article can be found online at: https://www.frontiersin.org/articles/10.3389/ffgc.2019.00060/full#supplementary-material
References
Aldea, J., Bravo, F., Vázquez-Piqué, J., Rubio-Cuadrado, A., and del Río, M. (2018). Species-specific weather response in the daily stem variation cycles of Mediterranean pine-oak mixed stands. Agric. For. Meteorol. 256–257, 220–230. doi: 10.1016/j.agrformet.2018.03.013
Balzano, A., Čufar, K., Battipaglia, G., Merela, M., Prislan, P., Aronne, G., et al. (2018). Xylogenesis reveals the genesis and ecological signal of IADFs in Pinus pinea L. and Arbutus unedo L. Ann. Bot. 121, 1231–1242. doi: 10.1093/aob/mcy008
Buczko, U., Köhler, S., Bahr, F., Scharnweber, T., Wilmking, M., and Jurasinski, G. (2017). Variability of soil carbon stocks in a mixed deciduous forest on hydromorphic soils. Geoderma 307, 8–18. doi: 10.1016/j.geoderma.2017.07.015
Camarero, J. J., Olano, J. M., and Parras, A. (2009). Plastic bimodal xylogenesis in conifers from continental Mediterranean climates. New Phytol. 185, 471–480. doi: 10.1111/j.1469-8137.2009.03073.x
Cardil, A., Imbert, J. B., Camarero, J. J., Primicia, I., and Castillo, F. (2018). Temporal interactions among throughfall, type of canopy and thinning drive radial growth in an Iberian mixed pine-beech forest. Agric. For. Meteorol. 252, 62–74. doi: 10.1016/j.agrformet.2018.01.004
Chan, T., Hölttä, T., Berninger, F., Mäkinen, H., Nöjd, P., Mencuccini, M., et al. (2016). Separating water-potential induced swelling and shrinking from measured radial stem variations reveals a cambial growth and osmotic concentration signal: removing water-related changes from stem radius. Plant Cell Environ. 39, 233–244. doi: 10.1111/pce.12541
Chang, W., and Borges-Ribeiro, B. (2018). shinydashboard: Create Dashboards with “Shiny”. R package version 0.7.1. Available online at: https://CRAN.R-project.org/package=shinydashboard
Chang, W., Cheng, J., Allaire, J., Xie, Y., and McPherson, J. (2018). shiny: Web Application Framework for R. R package version 1.1.0. Available online at: https://CRAN.R-project.org/package=shiny
Cocozza, C., Palombo, C., Tognetti, R., La Porta, N., Anichini, M., Giovannelli, A., et al. (2016). Monitoring intra-annual dynamics of wood formation with microcores and dendrometers in Picea abies at two different altitudes. Tree Physiol. 36, 832–846. doi: 10.1093/treephys/tpw009
Čufar, K., Cherubini, M., Gričar, J., Prislan, P., Spina, S., and Romagnoli, M. (2011). Xylem and phloem formation in chestnut (Castanea sativa Mill.) during the 2008 growing season. Dendrochronologia 29, 127–134. doi: 10.1016/j.dendro.2011.01.006
Čufar, K., Prislan, P., de Luis, M., and Gričar, J. (2008). Tree-ring variation, wood formation and phenology of beech (Fagus sylvatica) from a representative site in Slovenia, SE Central Europe. Trees 22, 749–758. doi: 10.1007/s00468-008-0235-6
Cuny, H. E., Rathgeber, C. B. K., Frank, D., Fonti, P., Mäkinen, H., Prislan, P., et al. (2015). Woody biomass production lags stem-girth increase by over one month in coniferous forests. Nat. Plants 1:15160. doi: 10.1038/nplants.2015.160
Cuny, H. E., Rathgeber, C. B. K., Lebourgeois, F., Fortin, M., and Fournier, M. (2012). Life strategies in intra-annual dynamics of wood formation: example of three conifer species in a temperate forest in north-east France. Tree Physiol. 32, 612–625. doi: 10.1093/treephys/tps039
De Micco, V., Carrer, M., Rathgeber, C. B. K., Julio Camarero, J., Voltas, J., Cherubini, P., et al. (2019). From xylogenesis to tree rings: wood traits to investigate tree response to environmental changes. IAWA J. 40, 155–182. doi: 10.1163/22941932-40190246
de Vries, W., Vel, E., Reinds, G. J., Deelstra, H., Klap, J. M., Leeters, E. E. J. M., et al. (2003). Intensive monitoring of forest ecosystems in Europe: 1. Objectives, set-up and evaluation strategy. For. Ecol. Manag. 174, 77–95. doi: 10.1016/S0378-1127(02)00029-4
Deslauriers, A., Morin, H., and Begin, Y. (2003). Cellular phenology of annual ring formation of Abies balsamea in the Quebec boreal forest (Canada). Can. J. For. Res. 33, 190–200. doi: 10.1139/x02-178
Deslauriers, A., Rossi, S., and Anfodillo, T. (2007). Dendrometer and intra-annual tree growth: what kind of information can be inferred? Dendrochronologia 25, 113–124. doi: 10.1016/j.dendro.2007.05.003
Drew, D. M., and Downes, G. M. (2009). The use of precision dendrometers in research on daily stem size and wood property variation: a review. Dendrochronologia 27, 159–172. doi: 10.1016/j.dendro.2009.06.008
Gärtner, H., and Schweingruber, F. H. (2013). Microscopic Preparation Techniques for Plant Stem Analysis. Kessel: Remagen-Oberwinter.
Gričar, J., and Čufar, K. (2008). Seasonal dynamics of phloem and xylem formation in silver fir and Norway spruce as affected by drought. Russ. J. Plant Physiol. 55, 538–543. doi: 10.1134/S102144370804016X
Gričar, J., KrŽe, L., and Čufar, K. (2009). Number of cells in xylem, phloem and dormant cambium in Silver fir (Abies alba), in trees of different vitality. IAWA J. 30, 121–133. doi: 10.1163/22941932-90000208
Gričar, J., Prislan, P., De Luis, M., Gryc, V., Hacurova, J., Vavrčik, H., et al. (2015). Plasticity in variation of xylem and phloem cell characteristics of Norway spruce under different local conditions. Front. Plant Sci. 6:730. doi: 10.3389/fpls.2015.00730
Gričar, J., Prislan, P., Gryc, V., Vavrčík, H., de Luis, M., and Čufar, K. (2014). Plastic and locally adapted phenology in cambial seasonality and production of xylem and phloem cells in Picea abies from temperate environments. Tree Physiol. 34, 869–881. doi: 10.1093/treephys/tpu026
Gričar, J., Prislan, P., Luis, M. D., Novak, K., Longares, L. A., Castillo, E. M., et al. (2016). Lack of annual periodicity in cambial production of phloem in trees from mediterranean areas. IAWA J. 37, 349–364. doi: 10.1163/22941932-20160138
Gričar, J., Zupančič, M., Čufar, K., and Oven, P. (2007). Wood formation in Norway spruce studied by pinning technique and intact tissue sampling method. Wood Res. 52, 1–9.
Grolemund, G., and Wickham, H. (2011). Dates and times made easy with lubridate. J. Stat. Softw. 40, 1–25. doi: 10.18637/jss.v040.i03
Güney, A., Küppers, M., Rathgeber, C., Sahin, M., and Zimmermann, R. (2017). Intra-annual stem growth dynamics of Lebanon Cedar along climatic gradients. Trees 31, 587–606. doi: 10.1007/s00468-016-1492-4
Gustafson, E. J., Bruijn, A. M. G. D., Miranda, B. R., and Sturtevant, B. R. (2016). Implications of mechanistic modeling of drought effects on growth and competition in forest landscape models. Ecosphere 7:e01253. doi: 10.1002/ecs2.1253
Harris, I., Jones, P. D., Osborn, T. J., and Lister, D. H. (2014). Updated high-resolution grids of monthly climatic observations – the CRU TS3.10 Dataset. Int. J. Climatol. 34, 623–642. doi: 10.1002/joc.3711
IPCC, Pachauri, R. K., Allen, M. R., Barros, V. R., Broome, J., Cramer, W., et al. (2014). “IPCC, 2014: Climate Change 2014: Synthesis Report,” in Contribution of Working Groups I, II and III to the Fifth Assessment Report of the Intergovernmental Panel on Climate Change, eds R. K. Pachauri and L. A. Meyer (Geneva: IPCC; Core Writing Team), 151. Available online at: http://epic.awi.de/37530/ (accessed February 28, 2017).
King, G., Fonti, P., Nievergelt, D., Büntgen, U., and Frank, D. (2013). Climatic drivers of hourly to yearly tree radius variations along a 6°C natural warming gradient. Agric. For. Meteorol. 168, 36–46. doi: 10.1016/j.agrformet.2012.08.002
Klos, R. J., Wang, G. G., Bauerle, W. L., and Rieck, J. R. (2009). Drought impact on forest growth and mortality in the southeast USA: an analysis using forest health and monitoring data. Ecol. Appl. 19, 699–708. doi: 10.1890/08-0330.1
Korpela, M., Mäkinen, H., Nöjd, P., Hollmén, J., and Sulkava, M. (2010). Automatic detection of onset and cessation of tree stem radius increase using dendrometer data. Neurocomputing 73, 2039–2046. doi: 10.1016/j.neucom.2009.11.035
Leuschner, C., and Ellenberg, H. (2017). Ecology of Central European Forests: Vegetation Ecology of Central Europe, Vol. 1. Cham: Springer International Publishing.
Linares, J. C., Camarero, J. J., and Carreira, J. A. (2009). Plastic responses of Abies pinsapo xylogenesis to drought and competition. Tree Physiol. 29, 1525–1536. doi: 10.1093/treephys/tpp084
Mäkinen, H., Seo, J.-W., Nöjd, P., Schmitt, U., and Jalkanen, R. (2008). Seasonal dynamics of wood formation: a comparison between pinning, microcoring and dendrometer measurements. Eur. J. For. Res. 127, 235–245. doi: 10.1007/s10342-007-0199-x
Martinez del Castillo, E., Longares, L. A., Gričar, J., Prislan, P., Gil-Pelegrín, E., Čufar, K., et al. (2016). Living on the edge: contrasted wood-formation dynamics in Fagus sylvatica and Pinus sylvestris under Mediterranean conditions. Front. Plant Sci. 7:370. doi: 10.3389/fpls.2016.00370
Martinez del Castillo, E., Prislan, P., Gričar, J., Gryc, V., Merela, M., Giagli, K., et al. (2018). Challenges for growth of beech and co-occurring conifers in a changing climate context. Dendrochronologia 52, 1–10. doi: 10.1016/j.dendro.2018.09.001
McMahon, S. M., and Parker, G. G. (2015). A general model of intra-annual tree growth using dendrometer bands. Ecol. Evol. 5, 243–254. doi: 10.1002/ece3.1117
Mendivelso, H. A., Camarero, J. J., Gutiérrez, E., and Castaño-Naranjo, A. (2016). Climatic influences on leaf phenology, xylogenesis and radial stem changes at hourly to monthly scales in two tropical dry forests. Agric. For. Meteorol. 216, 20–36. doi: 10.1016/j.agrformet.2015.09.014
Michelot, A., Simard, S., Rathgeber, C., Dufrêne, E., and Damesin, C. (2012). Comparing the intra-annual wood formation of three European species (Fagus sylvatica, Quercus petraea and Pinus sylvestris) as related to leaf phenology and non-structural carbohydrate dynamics. Tree Physiol. 32, 1033–1045. doi: 10.1093/treephys/tps052
OpenStreetMap Contributors (2017). Planet Dump. Available online at: https://planet.osm.org (accessed July 7, 2019).
Pacheco, A., Camarero, J. J., and Carrer, M. (2016). Linking wood anatomy and xylogenesis allows pinpointing of climate and drought influences on growth of coexisting conifers in continental Mediterranean climate. Tree Physiol. 36, 502–512. doi: 10.1093/treephys/tpv125
Page, E. S. (1954). Continuous inspection schemes. Biometrika 41, 100–115. doi: 10.1093/biomet/41.1-2.100
Pödör, Z., Manninger, M., and Jereb, L. (2014). “Application of sigmoid models for growth investigations of forest trees,” in Advanced Computational Methods for Knowledge Engineering. Advances in Intelligent Systems and Computing, Vol. 282, eds T. van Do, H. Thi, and N. Nguyen (Cham: Springer).
Pretzsch, H., Biber, P., Schütze, G., Uhl, E., and Rötzer, T. (2014). Forest stand growth dynamics in Central Europe have accelerated since 1870. Nat. Commun. 5:4967. doi: 10.1038/ncomms5967
Prislan, P., Čufar, K., De Luis, M., and Gričar, J. (2018). Precipitation is not limiting for xylem formation dynamics and vessel development in European beech from two temperate forest sites. Tree Physiol. 38, 186–197. doi: 10.1093/treephys/tpx167
Prislan, P., Gričar, J., Čufar, K., de Luis, M., Merela, M., and Rossi, S. (2019a). Growing season and radial growth predicted for Fagus sylvatica under climate change. Clim. Change. 153, 181–197. doi: 10.1007/s10584-019-02374-0
Prislan, P., Gričar, J., de Luis, M., Novak, K., Martinez del Castillo, E., Schmitt, U., et al. (2016). Annual cambial rhythm in Pinus halepensis and Pinus sylvestris as indicator for climate adaptation. Front. Plant Sci. 7:1923. doi: 10.3389/fpls.2016.01923
Prislan, P., Gričar, J., de Luis, M., Smith, K. T., and Čufar, K. (2013). Phenological variation in xylem and phloem formation in Fagus sylvatica from two contrasting sites. Agric. For. Meteorol. 180, 142–151. doi: 10.1016/j.agrformet.2013.06.001
Prislan, P., Koch, G., Čufar, K., Gričar, J., and Schmitt, U. (2009). Topochemical investigations of cell walls in developing xylem of beech (Fagus sylvatica L.). Holzforschung 63, 482–490. doi: 10.1515/HF.2009.079
Prislan, P., Koch, G., Schmitt, U., Gričar, J., and Čufar, K. (2011). Cellular and topochemical characteristics of secondary changes in bark tissues of beech (Fagus sylvatica). Holzforschung 66, 131–138. doi: 10.1515/HF.2011.119
Prislan, P., Mrak, P., Žnidaršič, N., Štrus, J., Humar, M., Thaler, N., et al. (2019b). Intra-annual dynamics of phloem formation and ultrastructural changes in sieve tubes in Fagus sylvatica. Tree Physiol. 39, 262–274. doi: 10.1093/treephys/tpy102
R Development Core Team (2018). R: A Language and Environment for Statistical Computing. Vienna, Austria: R Foundation for Statistical Computing. Available online at: http://www.R-project.org (accessed July 7, 2019).
Rathgeber, C. B. K., Cuny, H. E., and Fonti, P. (2016). Biological basis of tree-ring formation: a crash course. Front. Plant Sci. 7:734. doi: 10.3389/fpls.2016.00734
Rathgeber, C. B. K., Longuetaud, F., Mothe, F., Cuny, H., and Le Moguédec, G. (2011). Phenology of wood formation: data processing, analysis and visualisation using R (package CAVIAR). Dendrochronologia 29, 139–149. doi: 10.1016/j.dendro.2011.01.004
Rathgeber, C. B. K., Santenoise, P., and Cuny, H. E. (2018). CAVIAR: an R package for checking, displaying and processing wood-formation-monitoring data. Tree Physiol. 38, 1246–1260. doi: 10.1093/treephys/tpy054
Robinson, D., and Hayes, A. (2018). broom: Convert Statistical Analysis Objects Into Tidy Tibbles. Available online at: https://CRAN.R-project.org/package=broom (accessed July 7, 2019).
Rossi, S., Deslauriers, A., and Morin, H. (2003). Application of the Gompertz equation for the study of xylem cell development. Dendrochronologia 21, 33–39. doi: 10.1078/1125-7865-00034
Rossi, S., Menardi, R., and Anfodillo, T. (2006). Trephor: a new tool for sampling microcores from tree stems. IAWA J. 27, 89–97. doi: 10.1163/22941932-90000139
Rother, M. T., Huffman, J. M., Harley, G. L., Platt, W. J., Jones, N., Robertson, K. M., et al. (2018). Cambial phenology informs tree-ring analysis of fire seasonality in coastal plain pine savannas. Fire Ecol. 14, 164–185. doi: 10.4996/fireecology.140116418.
Ryan, M. G., Binkley, D., and Fownes, J. H. (1997). “Age-related decline in forest productivity: pattern and process,” in Advances in Ecological Research, Vol. 27, eds M. Begon and A. H. Fitter (Academic Press), 213–262. doi: 10.1016/S0065-2504(08)60009-4
Sass-Klaassen, U. (2015). Tree physiology: tracking tree carbon gain. Nat. Plants 1:15175. doi: 10.1038/nplants.2015.175
Solberg, S., Dobbertin, M., Reinds, G. J., Lange, H., Andreassen, K., Fernandez, P. G., et al. (2009). Analyses of the impact of changes in atmospheric deposition and climate on forest growth in European monitoring plots: a stand growth approach. For. Ecol. Manag. 258, 1735–1750. doi: 10.1016/j.foreco.2008.09.057
Urban, J., Bednarova, E., Plichta, R., Gryc, V., Vavrcik, H., Hacura, J., et al. (2015). Links between phenology and ecophysiology in a European beech forest. Iforest Biogeosci. For. 8, 438–447. doi: 10.3832/ifor1307-007
van der Maaten, E., Bouriaud, O., van der Maaten-Theunissen, M., Mayer, H., and Spiecker, H. (2013). Meteorological forcing of day-to-day stem radius variations of beech is highly synchronic on opposing aspects of a valley. Agric. For. Meteorol. 181, 85–93. doi: 10.1016/j.agrformet.2013.07.009
van der Maaten, E., Pape, J., van der Maaten-Theunissen, M., Scharnweber, T., Smiljanić, M., Cruz-García, R., et al. (2018). Distinct growth phenology but similar daily stem dynamics in three co-occurring broadleaved tree species. Tree Physiol. 38, 1820–1828. doi: 10.1093/treephys/tpy042
van der Maaten, E., van der Maaten-Theunissen, M., Smiljanić, M., Rossi, S., Simard, S., Wilmking, M., et al. (2016). dendrometeR: analyzing the pulse of trees in R. Dendrochronologia 40, 12–16. doi: 10.1016/j.dendro.2016.06.001
Vieira, J., Rossi, S., Campelo, F., and Nabais, C. (2014a). Are neighboring trees in tune? Wood formation in Pinus pinaster. Eur. J. For. Res. 133, 41–50. doi: 10.1007/s10342-013-0734-x
Vieira, J., Rossi, S., Campelo, F., Freitas, H., and Nabais, C. (2014b). Xylogenesis of Pinus pinaster under a Mediterranean climate. Ann. For. Sci. 71, 71–80. doi: 10.1007/s13595-013-0341-5
Wickham, H. (2016). ggplot2: Elegant Graphics for Data Analysis. New York, NY: Springer-Verlag. doi: 10.1007/978-3-319-24277-4
Wickham, H., Francois, R., Henry, L., and Müller, K. (2017a). dplyr: A Grammar of Data Manipulation. R package version 0.7.4. Available online at: https://CRAN.R-project.org/package=dplyr (accessed July 7, 2019).
Wickham, H., Hester, J., and Francois, R. (2017b). readr: Read Rectangular Text Data. Available online at: https://CRAN.R-project.org/package=readr (accessed July 7, 2019).
Ziaco, E., and Biondi, F. (2016). Tree growth, cambial phenology, and wood anatomy of limber pine at a Great Basin (USA) mountain observatory. Trees 30, 1507–1521. doi: 10.1007/s00468-016-1384-7
Keywords: dendrometer, microcore, xylogenesis, wood anatomy, Gompertz, Weibull, Shiny, forest monitoring
Citation: Cruz-García R, Balzano A, Čufar K, Scharnweber T, Smiljanić M and Wilmking M (2019) Combining Dendrometer Series and Xylogenesis Imagery—DevX, a Simple Visualization Tool to Explore Plant Secondary Growth Phenology. Front. For. Glob. Change 2:60. doi: 10.3389/ffgc.2019.00060
Received: 02 July 2019; Accepted: 16 September 2019;
Published: 02 October 2019.
Edited by:
Andreas Rigling, Snow and Landscape Research (WSL), SwitzerlandReviewed by:
Patrick Fonti, Snow and Landscape Research (WSL), SwitzerlandTeemu Hölttä, University of Helsinki, Finland
Copyright © 2019 Cruz-García, Balzano, Čufar, Scharnweber, Smiljanić and Wilmking. This is an open-access article distributed under the terms of the Creative Commons Attribution License (CC BY). The use, distribution or reproduction in other forums is permitted, provided the original author(s) and the copyright owner(s) are credited and that the original publication in this journal is cited, in accordance with accepted academic practice. No use, distribution or reproduction is permitted which does not comply with these terms.
*Correspondence: Roberto Cruz-García, cmMxMzM4NDRAdW5pLWdyZWlmc3dhbGQuZGU=