Abstract
Carbon (C), nitrogen (N), and phosphorus (P) become released in inorganic or organic forms during decomposition of soil organic matter (SOM). Environmental perturbations, such as drying and rewetting, alter the cycling of C, N, and P. Our study aimed at identifying the patterns and controls of C, N, and P release in soils under beech forests. We exposed organic and mineral horizons from a nutrient availability gradient in Germany to permanent moist conditions or dry spells in microcosms and quantified releases of inorganic and organic C, N, and P. Under moist conditions, mobilization of DOC, DON, and DOP were interrelated and depended on the C:N:P ratio of SOM, whilst net mineralization rates of C, N, and P correlated poorly. Mineralization of C decreased with soil depth from Oi to A horizons, reflecting the increasing SOM stability. Net mineralization of N and P showed divergent depth patterns. In the Oi horizon, net mineralization was smaller for N than for C and P, indicating more pronounced microbial immobilization for N than for P. In A horizons, net mineralization of P was less than of N, very likely because of strong sorption of released phosphate by mineral phases. Counterintuitively, net P mineralization in A horizons increased toward P-poor sites, probably due to decreasing contents of clay and pedogenic oxides, and thus, declining P sorption. Drying and rewetting caused stronger release of inorganic and organic P, and organic N than of inorganic C and inorganic N, most likely by lysis of microbial biomass with tight C:N:P ratios. Due to the divergent patterns in N and P cycling, the organic layer seems more crucial for net mineralization of P than the mineral soil; for N the mineral soil appears more important. Consequently, the loss of the organic layer would deteriorate P nutrition, in particular at nutrient-poor sites. Overall, our results indicate that the cycling of C, N, and P in soil is not directly coupled because of the different microbial immobilization and, in the mineral soil, differential sorption of inorganic N and P. This may ultimately cause imbalances in N and P nutrition of forests.
Introduction
Phosphorus (P) and nitrogen (N) are major nutrients for plants and soil biota and their availability is a key constraint for the productivity of terrestrial ecosystems (Vitousek and Howarth, 1991; Augusto et al., 2017). While ecosystem N originates from biological N2 fixation and atmospheric processes, the primary P supply is rock weathering (Walker and Syers, 1976). Nitrogen accumulates during ecosystem development, and in mature ecosystems, more than 90% is bound in soil organic matter (SOM). It becomes available to plants by the decomposition and mineralization of SOM by microbial communities; the release rate is usually less than 1% of the N stock per year. With progressing pedogenesis, rock-derived P decreases (Turner et al., 2007), inorganic P becomes strongly bound to reactive secondary minerals, and the fraction of organic P increases (Anderson, 1988, Walker and Syers, 1976; Davies et al., 2016). In mature ecosystems, plant nutrition strongly relies on the mineralization of organically bound N and P, especially in organic layers lying atop the mineral soil (e.g., Bünemann et al., 2016; Lang et al., 2017).
Along with carbon (C), N, and P are released during microbial SOM decomposition, either as dissolved organic C, N, and P (DOC, DON, and DOP) or in inorganic forms. Net nutrient mineralization represents the net sum of gross mineralization and immobilization (Schimel and Bennett, 2004). For litter and organic horizons, net nutrient release is closely related to stoichiometry (C:N:P) of organic substrates, which generally varies more strongly than that of soil microbial biomass (Manzoni et al., 2010; Xu et al., 2013; Zederer et al., 2017). Microbial communities can cope with the stoichiometric variations of their organic substrates by (i) altering the microbial community composition and turnover, (ii) producing extracellular enzyme to mobilize nutrients, or (iii) by adjusting their element use efficiencies by releasing carbon or nutrients in excess to their demands (Manzoni et al., 2008; Fanin et al., 2013; Mooshammer et al., 2014; Spohn and Widdig, 2017). Consequently, net nutrient release from decomposing organic materials is positively linked to the nutrient content in organic matter, and the transition from net nutrient immobilization to net nutrient mineralization occurs at distinct threshold elemental ratios (Manzoni et al., 2010; Davies et al., 2016). While these ratios are well-established for the C and N, much less is known about C:P ratios (Heuck and Spohn, 2016). Also, the majority of nutrient mineralization studies focused on decomposing litter (e.g., Manzoni et al., 2008). However, with increasing degree of SOM transformation and the narrowing of carbon-to-nutrient ratios during decomposition, SOM bio-availability and stability becomes increasingly important (Colman and Schimel, 2013; Mooshammer et al., 2014). In the mineral soil, the bio-availability of SOM is largely controlled by the interactions with the soil mineral phase (e.g., Kleber et al., 2015). Moreover, mineralized nutrients sorb to reactive surface, and thus, become less available to microbial communities (Lilienfein et al., 2004; Brödlin et al., 2019). Since phosphate has a greater affinity to positively charged Al and Fe oxides and hydroxides than (e.g., Barrow, 1983), sorption processes may cause decoupling of net N and P mineralization (Achat et al., 2010).
Substantially less than on mineralization is known on the mobilization of dissolved organic nutrient forms, typically comprising a small but rapid cycling fraction of low-molecular weight compounds (amino acids and sugars, P-mono and diesters, hydrolysable inositol) and a large fraction of refractory compounds of higher molecular weight (Michalzik and Matzner, 1999; Kaiser et al., 2003; Neff et al., 2003). As parts of dissolved organic matter, DON and DOP derive from leaching of litter, microbial metabolites, and degradation products of SOM (Qualls and Haines, 1991; Hagedorn et al., 2004; Kaiser and Kalbitz, 2012). The relative contributions of these sources differ among organic materials and depend on environmental conditions (Hagedorn et al., 2001; Michalzik et al., 2001), and thus, mechanisms and magnitudes of mobilization may differ for DON and DOP (Qualls and Haines, 1991; Kaiser et al., 2003). Knowledge is particularly limited for DOP, partly due to the difficulty in measuring the often very low DOP concentrations in soil solutions (Bol et al., 2016). One possible reason for the differential mobilization of DON and DOP is that DOP occurs in more bioavailable form than DON (ester versus direct C binding; Michalzik and Matzner, 1999; Kaiser et al., 2003).
Abiotic perturbation, e.g., drying–rewetting or freeze–thawing, are impacting C, N, and P mobilization in soil due to physical disruption of soil structure, substrate desorption from surfaces (Birch, 1958, Bünemann et al., 2013), and/or the death and lysis of microbial biomass (Borken and Matzner, 2009; Dinh et al., 2016, 2017; Mooshammer et al., 2017; Schimel, 2018). The C, N, and P release from formerly protected substrate or lysed microbial biomass may differ because of the different C:N:P ratios of SOM and microbial biomass, in particular in organic layers (Xu et al., 2013; Mooshammer et al., 2014). In addition, the magnitude of drying and rewetting effects depends on the severity of the drought, soil properties, and microbial community composition (Borken and Matzner, 2009; Dinh et al., 2017) and may differ among inorganic and organic nutrient forms (Hömberg and Matzner, 2018; Brödlin et al., 2019), which makes prediction of net releases of C, N, and P in response to drying and rewetting difficult.
Our study aimed at identifying the controls of and linkage between the release of inorganic and organic C, N, and P from organic horizons and A horizons of temperate forested soils. We sampled soils under beech forests along a gradient in P and N availability (Lang et al., 2017), exposed them either to permanent moist conditions or two drying–wetting (D/W) cycles of different drought intensities, and quantified the net mineralization of C, N, and P as well as the mobilization of DOC, DON, and DOP. We hypothesized: (1) Since linked to the overall SOM bioavailability, the release of N and P will decrease from the litter layer to the mineral soil, paralleling C release. (2) Net N and P mineralization will diverge from C mineralization due to microbial nutrient immobilization at nutrient-poor sites and/or due to sorptive retention of released nutrients, in particular of phosphate, in the mineral soil. (3) Disruption of N and P-rich microbial biomass by D/W cycles will decouple the cycling of C, N, and P by enhanced mobilization of N and P.
Materials and Methods
Study Sites and Sampling
Soils were sampled from three mature European beech forest stands in Germany, Bad Brückenau (BBR), Mitterfels (MIT), and Lüss (LUE) (Table 1). The soils of the three sites have developed from different parent material, resulting in a gradient in P stocks and availability from BBR > MIT > LUE (Lang et al., 2017). The soils at BBR have developed from basaltic rock, those at MIT originate from paragneiss rock, and those at LUE from sandy glacial till. Soils were sampled in early spring 2016. At each site, the Oi horizons was collected in three 1 × 1 m plots. Within each of these plots, the Oe-Oa horizons as well as the A horizon were sampled in two squares of 20 × 20 cm. Materials were bulked to one composite samples per site and horizon, immediately transported to the laboratory and stored at 4 °C. The samples were mixed by hand and cleaned from pieces of wood, bark, roots, fruits, stones, and larger organisms. The A horizons were sieved at 4 mm.
Table 1
| Bad Brückenau | Mitterfels | Lüss | |
|---|---|---|---|
| BBR | MIT | LUE | |
| Location GPS (WGS84) | N: 50.351800° | N: 48.976008° | N: 52.838967° |
| E: 09.927478° | E: 12.879879° | E: 10.267250° | |
| Elevation (m a.s.l.) | 809 | 1023 | 115 |
| Mean annual temperature (°C) | 5.8 | 4.5 | 8.0 |
| Mean annual precipitation (mm) | 1031 | 1299 | 779 |
| Tree species | Fagus sylvatica L. | Fagus sylvatica L. | Fagus sylvatica L. |
| Parent material | Basalt | Paragneis | Glacial sandy material |
| Soil type (FAO) | Eutric Cambisol | Dystric Cambisol | Spodic Cambisol |
| Humus layer | Mull-type Moder | Moder | Mor-type Moder |
| Horizon depth (cm) (Oi/Oe-Oa/A) |
3/3/14 | 4/4/10 | 4/9/7 |
| Clay in A horizon (%)a | 37 | 24 | 6 |
| Fe oxalate in A horizona | 29.3 | 13.1 | 0.9 |
| Al oxalate in A horizona | 8.4 | 7.8 | 0.3 |
Characteristics of the three study sites Bad Brückenau (BBR), Mitterfels (MIT), and Lüss (LUE), representing a natural gradient in P availability.
Data from Lang et al. (2017).
Experimental Set-Up
Design of Microcosms
The release of C, N, and P, resulting from mineralization as well as mobilization of dissolved organic matter (DOM), was determined in custom-made microcosms allowing for simultaneous and repeated measurement of CO2 production and leaching of solutes for 233 days (Brödlin et al., 2019). The microcosms consisted of polyvinylchloride (PVC) tubes (Ostendorf Kunststoffe, Vechta, Germany). Two socket plugs (DN 16, Ø 160 mm, height 49 mm), representing bottom and cap, and one tube with rubber seal (DN 16, Ø 160 mm, height 172 mm) were put together to form an air-tight microcosm (Supplementary Figure 1). The bottom socket plug was equipped with a small plastic tube (Ø 10 mm, Tygon, Saint-Gabain S.A., Paris, France) and served as sample tray for the collection of leachates. A layer of 200 g acid-washed quartz sand (grain size of 0.06–0.3 mm, Bernasconi AG, Switzerland) was placed at bottom of the microcosm to ensure a continuum of pores impeding water saturation. Samples were placed in a nylon net container with a mesh size of one mm (Ø 155 mm, SEFAR NITEX, Sefar AG, Switzerland) that was placed on top of the sand layer. If necessary, the net container allowed the transfer of samples. A one cm wide plastic pipe cutting (Ø 150 mm, DVC, Vink, Switzerland) was fixed on the upper part of the nylon net container to improve stability and to allow for placement of a beaker serving as CO2 trap with a hook-and-loop fastener. To facilitate the opening of the microcosm with pressurized air, the cap socket plug on top of the microcosms was equipped with a lockable gas valve (conic, R1/4, Esska, Germany). All couplings and rubber seals were regularly treated with grease (Glisseal-N, Borer AG, Switzerland) to ensure gas tightness.
For the element mobilization experiment, fresh samples were weighed into the net containers; 30 g of dry mass equivalents for Oi horizons, 75 g of dry mass equivalents for Oe-Oa horizons, and 180 g of dry mass equivalents for A horizons. All materials were mixed with 100 g of acid-washed quartz sand (grain size of 1.5–2.2 mm, Bernasconi AG, Switzerland) to enhance aeration. In total, 72 microcosms were prepared with soil materials; four additional microcosms without soil materials were prepared to serve as controls.
Drying and Rewetting Treatment
Thirty six microcosms (each 3 horizons per site, 4 replicates) were exposed to two D/W cycles, one at the beginning of the experiment and one after 15 weeks. The first dry spell was harsh, with samples being dried for 72 h at 40 °C. For the moderate second dry spell, the microcosms were left open in a ventilated climate chamber at 20 °C until C mineralization was no longer detectable in any of the samples, which was after 4 weeks. The other 36 microcosms (each 3 horizons per site, 4 replicates) were kept permanently moist by adjusting their water content after each leaching cycle; they served as controls. Throughout the entire experiment, all microcosms were placed in a dark climate chamber at 20 °C and randomly repositioned on shelfs after each leaching cycle. Water contents were monitored by weighing the microcosms.
Release of C, N, and P Forms
Soil samples were repeatedly leached by adding 450 ml of nutrient solution (deionized H2O supplemented with 400 μM CaCl2, 50 μM K2SO4, and 50 μM MgSO4) to prevent nutrient limitation of microorganisms. Salt concentrations corresponded to those of soil waters leached from forest floors. After 1 h, microcosms were closed and evacuated by applying a suction of 250 hPa using a vacuum pump (EcoTech, Bonn, Germany) for 20 min. The application of a suction of 250 hPa prevented anaerobic conditions in the soil samples. Aliquots of leachates were immediately filtered through 0.45-μm nitrocellulose filters (GVS Life Sciences, USA) and stored at 4 °C prior to analysis. During the first 10 weeks, samples were leached every week, followed by leaching cycles in week 12 and 15. After the second dry spell in week 19, soil samples were again leached on a weekly basis for 4 weeks, as well as in the weeks 26, 29, and 33. In total, 20 leaching cycles were run.
Carbon Mineralization
Carbon mineralization was measured on a weekly basis by closing the microcosms for the entire week directly after each leaching cycle. The CO2 evolved was quantified by trapping in 25 ml of 1 M NaOH. The amount of CO2 fixed as Na2CO3 was determined via the decline in electrical conductivity calibrated against known amounts of trapped CO2 (Wollum and Gomez, 1970). The decline in C mineralization during the second dry spell was monitored by repeatedly measuring the increase in CO2 concentration in closed microcosms with an infrared CO2 gas analyzer (GMP343 CO2 diffusion probe, Vaisala, Vantaa, Finland).
Chemical Analyses
Organic Matter Quality
For each site, materials of Oi, Oe-Oa, and A were dried at 60°C and ground with a ball mill. Contents of C and N were measured with a CN analyzer (NC 2500, CE Instruments Ltd., Hindley Green, Wigan, UK). Total P contents were determined via digestion in 40% HNO3 with 1.2% HF in a microwave digestion unit (MW ultraCLAV MLS, Milestone Inc., Shelton, CT, USA). Subsequently, P concentrations were measured by inductively coupled plasma-optical emission spectrometry (ICP-OES; Optima 7300 DV, Perkin Elmer, Waltham, MA, USA). Hot-water-extractable carbon was determined by extracting one g of ground sample three times with 25 ml of hot water (80 ± 5°C) and once with cold water (extraction time 15 min each). In the water extracts, phenolics were quantified colorimetrically using the Folin-Denis reagent (Swain and Hillis, 1959). Klason lignin was determined according to Heim and Frey (2004). The residues of the hot water-extracted sample were first extracted four times with 25 ml of ethanol. An aliquot was then hydrolyzed with 72% sulfuric acid, autoclaved, and finally, lignin contents were determined gravimetrically after incineration at 550°C for 4 h.
Leachates
Concentrations of dissolved organic carbon (DOC) and total nitrogen (TN) were determined with a Formacs-HT/TN analyzer (Skalar, Breda, The Netherlands). The UV absorptivity at 285 nm was analyzed using a Cary 60UV-Spectrophotometer (Varian, Palo Alto, CA, USA). Total phosphorus (TP) concentrations in leachates were measured by ICP–OES (Ultima 2, Horiba Jobin-Yvon, Longjumeau, France). Dissolved inorganic phosphorus (DIP) was measured spectrophotometrically by the molybdate-ascorbic acid method (Murphy and Riley, 1962) using a flow-injection analyzer (ScanPlus, Skalar, Breda, The Netherlands). Dissolved organic phosphorus (DOP) was calculated as the difference between TP and DIP. Nitrate concentrations were measured by ion chromatography (ICS 3000 IC, Dionex, Sunnyvale, Cal., USA) and ammonium concentrations with a FIAS-300 (Perkin-Elmer, Waltham, USA) by ammonia gas diffusion and photometric determination. Dissolved organic nitrogen (DON) was calculated as the difference between TN and the sum of nitrate and ammonium (TN – ( + )).
Sorption of C, N, and P Forms
We tested the potential sorption of dissolved organic and inorganic C, N, and P by examining the change in solute concentrations upon reaction with hydrous Fe oxide (goethite, α-FeOOH) – one of the most abundant secondary soil minerals – using a solid-to-solution ratio of 1 to 100 (g/ml) [slightly modified as compared to Kaiser and Zech (1997)]. The goethite was prepared by adjusting a 1M FeCl3 solution to pH 12 with NaOH, recrystallizing the precipitate at 55°C for 48 h, and washing with deionized water. In the sorption experiment, we weighed 0.5 g of goethite into 50-ml Falcon™ tubes and let it react with 50 ml of leachates in a 4°C cold room (to prevent biodegradation) and constant horizontal shaking for 20 h. Following centrifugation (10 000 × g) and filtration through 0.45-μm nitrocellulose membranes (GVS Life Sciences, USA), the supernatant was analyzed for DOC, , , DON, DIP, and DOP as described above. Note, goethite is positive charged under the prevalent pH conditions in the tested soils, and thus, the sorption test may underestimate the possible retention of . For the experiment, we used leachates from the Oe-Oa horizons sampled after 19 weeks that had relatively high concentration of all C, N, and P forms allowing the accurate determination of dissolved organic N and P.
Data Analysis and Statistics
Net N and P mineralization as well as DOC, DON, and DOP mobilization were calculated by multiplying the volumes of leachate with their concentrations. The D/W effects for the first and second dry spell were calculated as the differences between concentrations in the D/W and the control treatment divided by concentrations in the control treatment. We used only data from the first 4 weeks following rewetting, as the D/W effect disappeared afterwards. For estimating the C:P ratio of the organic matter in the A horizons, we used the relative contributions of organic P concentrations to total P in the same horizons at the same sites measured by Lang et al. (2017). These contributions of organic P were multiplied with the total P contents measured in our study and then related to the C contents in the A horizons.
Statistical data analysis was carried out by fitting mixed-effect models by maximum likelihood [lme function of the nlme package, R 3.4.0, (R Core Team, 2019)]. In these models, fixed effects were element (C, N, P), nutrient status of sites, horizon (Oi, Oe-Oa, A), and treatment (control, drying–rewetting), whilst microcosms were the random effects. To account for repeated measurements per microcosm, we included the corAR1 function in the model with a first-order autoregressive covariate structure. Separate models were calculated for each element and individual horizons when there was a significant interaction between nutrient status and horizon. The nutrient status was determined by first normalizing the C:N and C:P ratios for each horizon by relating their values of each site to the horizon mean of all sites and then averaging all three horizons for each site and taking the average of both ratios. This resulted in a N and P status of 0.7 for BBR, 1.0 for MIT and 1.3 for LUE. For the statistical analysis, we used the mean values of four replicates per horizon and site, as the samples were only laboratory replicates. Normal distribution of the residuals was checked by visual inspection of the normal probability plots and the Shapiro–Wilk test. Response variables were log transformed in some cases to meet assumptions of normality of the residuals and variance homogeneity.
Results
Soil Characteristics
At all sites, ratios of C:N and C:P decreased with soil depth from the Oi over the Oe-Oa to the A horizons (Table 2). The ratios followed the fertility gradient of the sites and increased in all corresponding horizons from the nutrient-rich site BBR over MIT to the nutrient-poor site LUE (Table 2). The N:P ratio increased from the nutrient-rich to the nutrient-poor site. Concentrations of Klason lignin, hot water-extractable C, and water-soluble phenolics decreased from the Oi over the Oe-Oa to the A horizons. In the A horizon, contents of clay and oxalate extractable Fe and Al were smallest at LUE and increased to MIT and BBR (Table 1; data from Lang et al., 2017).
Table 2
| Organic horizon | Site |
C
(mg g−1) |
C:N | C:Porg | N:Porg | Klason Lignina (mg g−1) | Hot water-soluble C (mg g−1) | Water-soluble phenolics (mg g−1) | Water content (field moist) % | Water content (Dry Spell 1/Dry Spell 2) % |
|---|---|---|---|---|---|---|---|---|---|---|
| Oi | BBR | 472 | 32.3 | 445 | 13.8 | 428 | 22.6 | 4.48 | 81.6 | 22.1/23.4 |
| Oi | MIT | 490 | 39.8 | 676 | 17.0 | 467 | 25.5 | 7.49 | 82.3 | 34.9/28.5 |
| Oi | LUE | 470 | 45.8 | 841 | 18.4 | 408 | 24.8 | 5.35 | 33.7 | 11.3/28.6 |
| Oe-Oa | BBR | 299 | 19.6 | 244 | 12.5 | 318 | 14.0 | 1.66 | 73.8 | 22.3/17.1 |
| Oe-Oa | MIT | 438 | 19.2 | 461 | 24.0 | 504 | 15.7 | 2.16 | 72.7 | 24.1/19.2 |
| Oe-Oa | LUE | 391 | 24.0 | 755 | 31.4 | 454 | 13.4 | 2.16 | 71.9 | 20.6/18.1 |
| A | BBR | 117 | 14.9 | 222 | 18.4 | 129 | 6.2 | 0.44 | 48.6 | 5.2/11.8 |
| A | MIT | 168 | 18.2 | 405 | 31.4 | 190 | 7.9 | 0.71 | 53.1 | 11.3/11.6 |
| A | LUE | 34.0 | 22.6 | 702 | 31.2 | 28 | 1.5 | 0.20 | 21.7 | 0.9/2.3 |
| P Nutrientstatus | 0.47 | 0.007** | < 0.001** | 0.004** | 0.5 | 0.62 | 0.79 | |||
| P Horizon | 0.042* | 0.001** | 0.005** | 0.06 | 0.06 | 0.005** | 0.014* | |||
| P Nutrientstatus × Horizon | 0.37 | 0.33 | 0.036* | 0.09 | 0.38 | 0.42 | 0.54 |
Selected chemical properties of the Oi, Oe-Oa, and A horizons of the beech forest sites Bad Brückenau (BBR), Mitterfels (MIT) and Lüss (LUE).
The lower part of the table gives statistical indicators of the effects of nutrient status of the sites, horizon (Oi, Oe-Oa, and A horizon), and their interaction on chemical properties.
Sum of Klason lignin and acid-soluble lignin. Significant at
P < 0.05,
P < 0.01,
P < 0.001.
Carbon Mineralization and DOC Mobilization
Carbon (C) mineralization during the 33-week long experiment decreased strongly with soil depth (PHorizon < 0.001; Figures 1, 2). In the Oi horizon, 32 to 48% of C were mineralized under permanent moist conditions, whilst C mineralization in the A horizon was only 5 to 8% of initial C stocks (Figure 2). Mobilization of DOC was small when compared to C mineralization, accounting only for a small fraction of the total C losses (0.25–4%; Supplementary Material Figure 2). Carbon mineralization and DOC mobilization did not differ significantly among the three sites (Table 3).
Figure 1
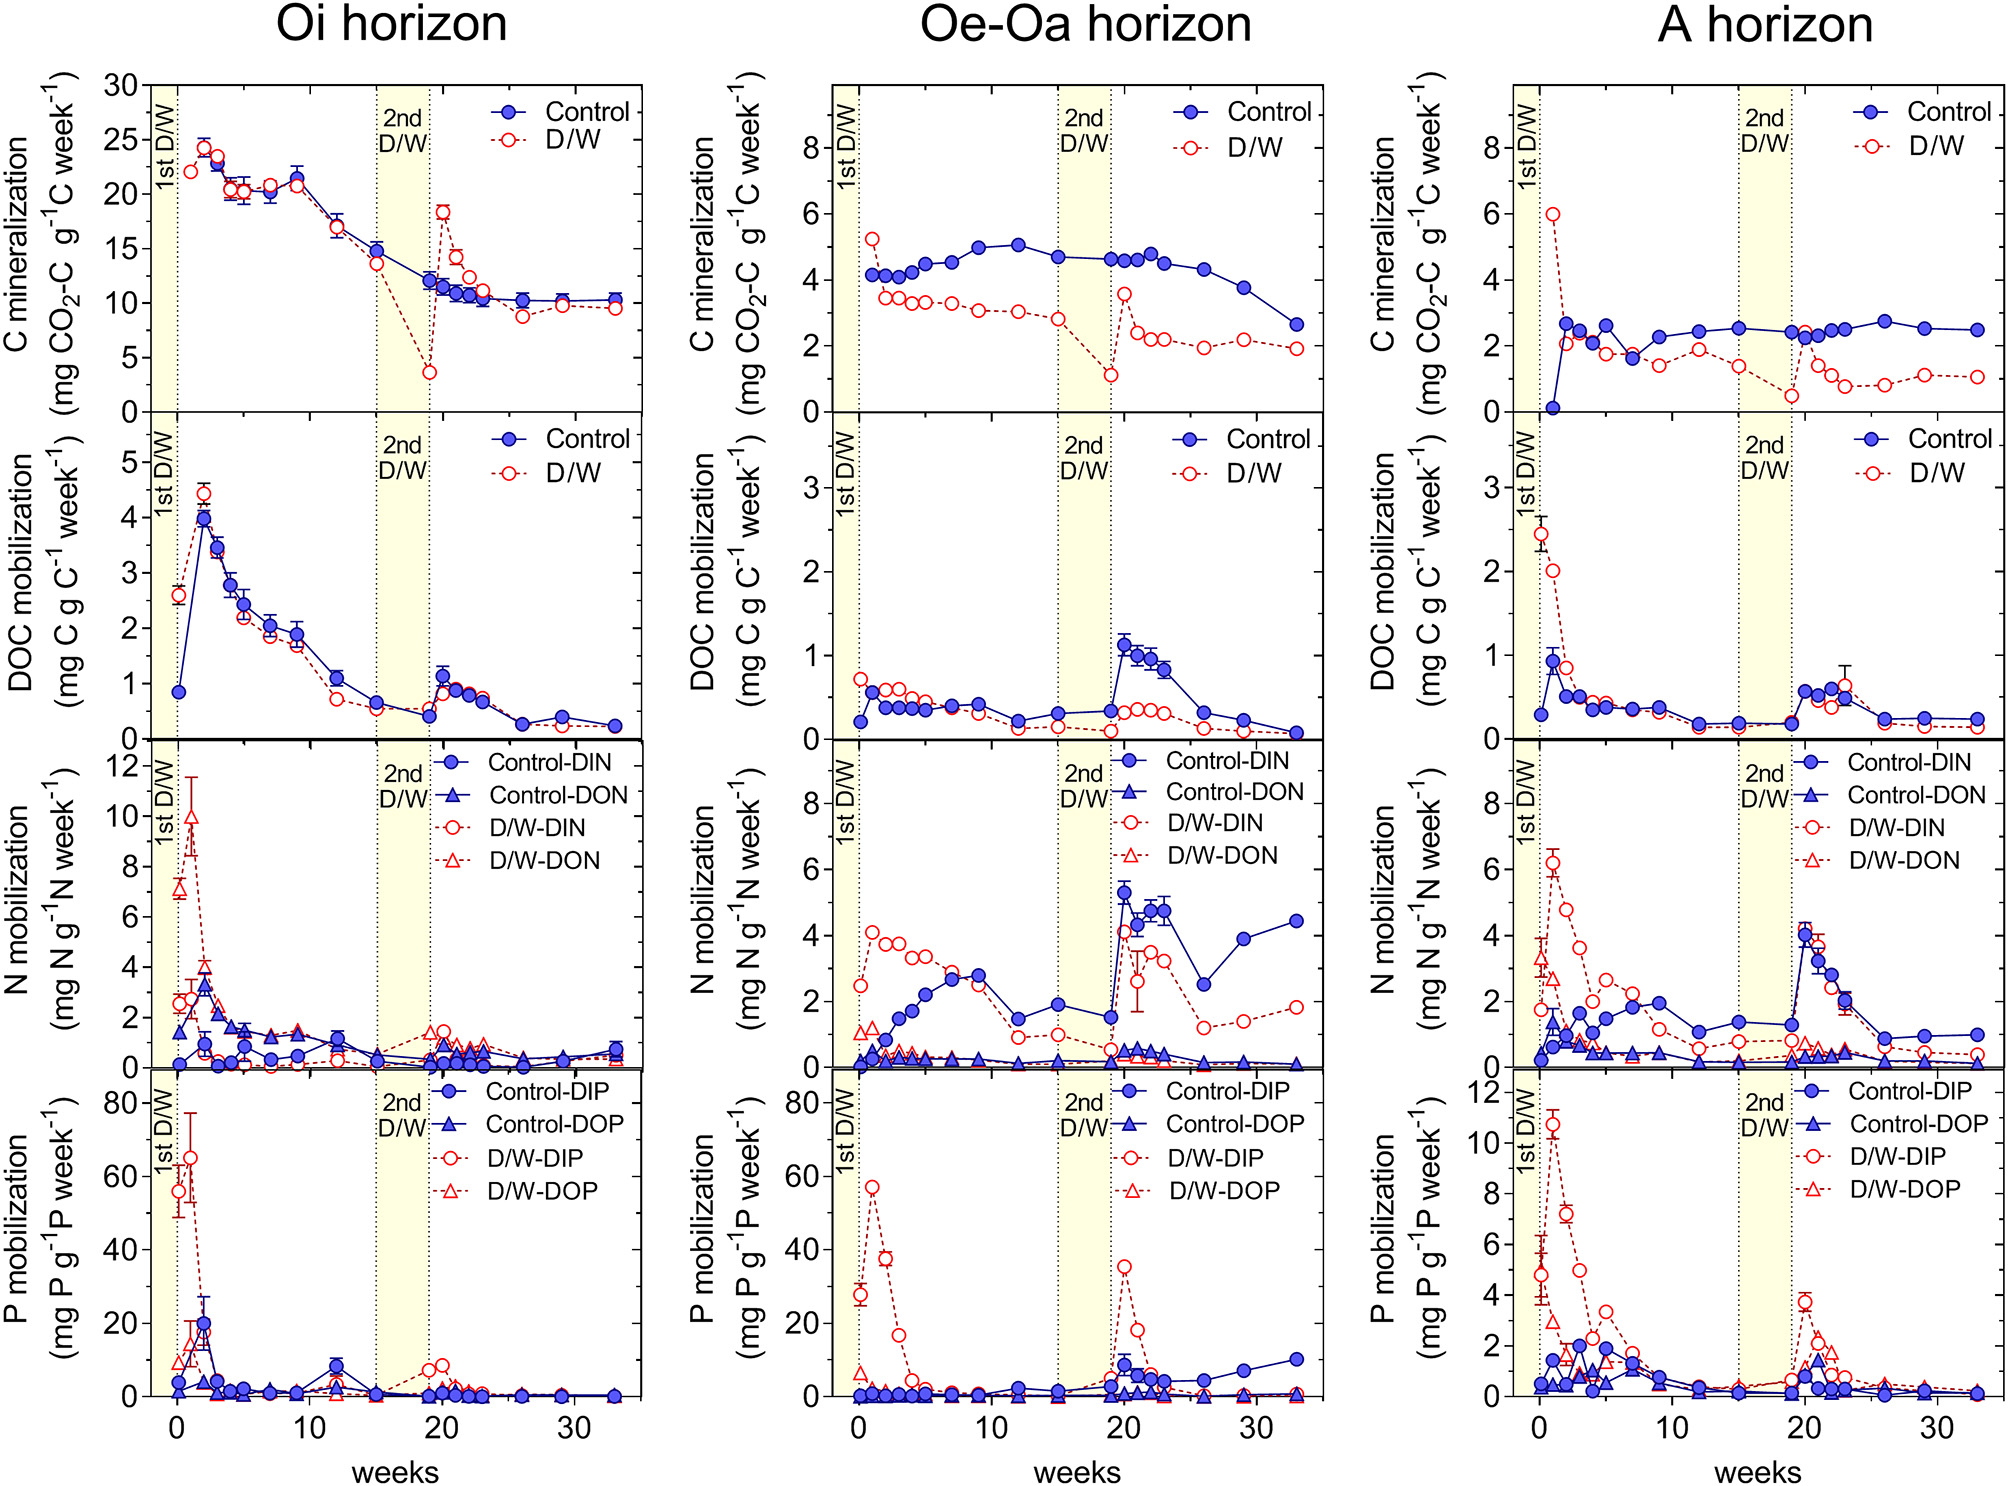
Release of inorganic and organic carbon, nitrogen, and phosphorus from the Oi, Oe-Oa, and A horizons at the site Luess (LUE) over the course of the 33 weeks experiment. The drying-rewetting treatment consisted of two dry spells. Means and standard errors of four replicates per treatment. The D/W-treatment consisted of one short, harsh initial drying and a second moderate, 1 month-long drying.
Figure 2
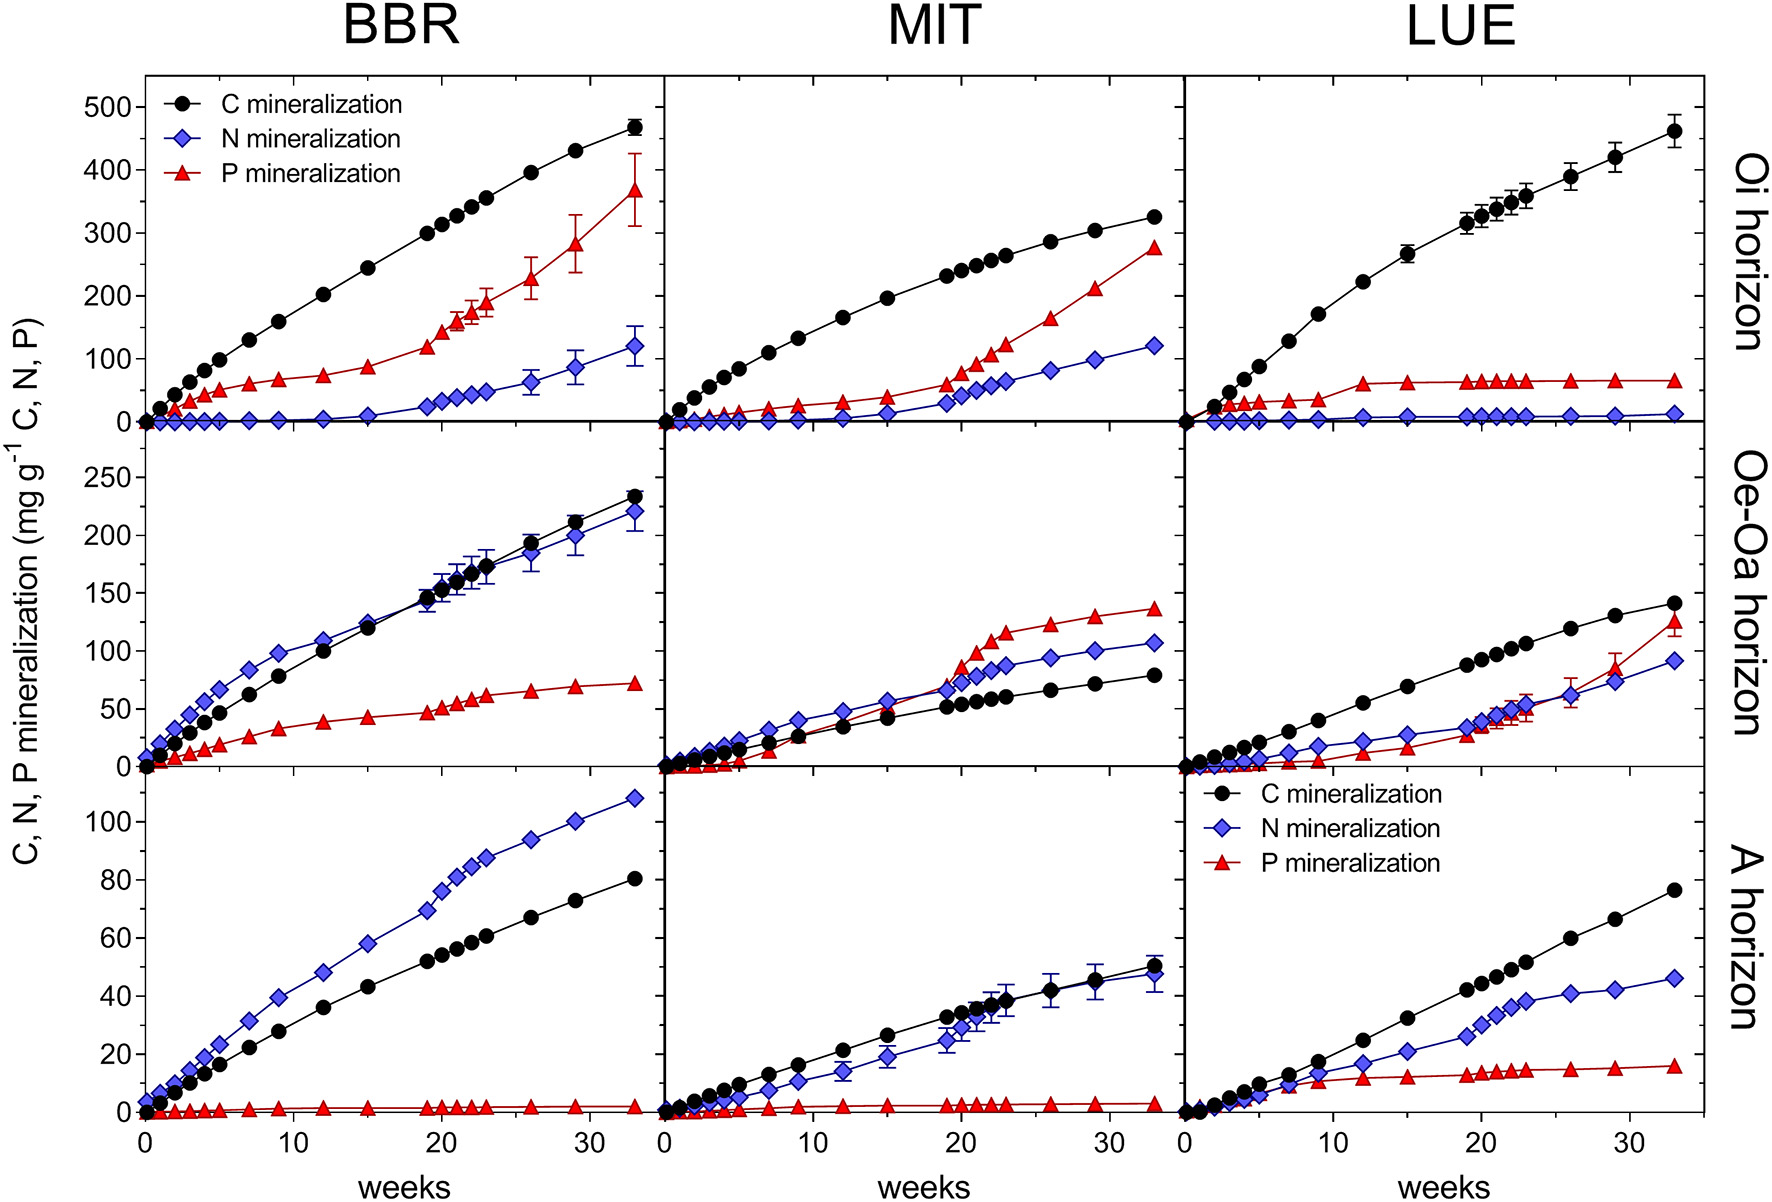
Cumulative net mineralization rates of C, N, and P from the Oi, Oe-Oa, and A horizons from the nutrient-rich site Bad Brückenau (BBR), the intermediate site Mitterfels (MIT) and the nutrient-poor sandy site Luess (LUE). Means and standard errors of four replicates in the permanent moist control treatment.
Table 3
|
C
mineralization (mg g −1 C) |
Net N
mineralization (mg g−1 N) |
Net P
mineralization (mg g−1 P) |
DOC mobilization
(mg g−1 C) |
DON
mobilization (mg g−1 N) |
DOP
mobilization (mg g−1 P) |
DOC:DON
ratio (g g−1) |
DOC:DOP
ratio (g g−1) |
|
|---|---|---|---|---|---|---|---|---|
| P Nutrient status | 0.266 | 0.025* | 0.552 | 0.192 | 0.041* | 0.013* | 0.321 | 0.034* |
| P Horizon | < 0.001*** | 0.032* | < 0.001*** | 0.001** | < 0.001*** | < 0.001*** | 0.002** | 0.415 |
| P D/W | 0.325 | 0.463 | 0.089 | 0.251 | 0.013* | 0.009** | 0.006** | 0.172 |
| P Week | < 0.001*** | < 0.001*** | 0.330 | < 0.001*** | < 0.001*** | 0.039* | 0.584 | 0.867 |
| P Nutrient status × Horizon | 0.385 | 0.839 | 0.004** | 0.192 | 0.091 | 0.002** | 0.937 | 0.121 |
| P Nutrient status × D/W | 0.965 | 0.491 | 0.218 | 0.448 | 0.372 | 0.887 | 0.955 | 0.509 |
| P Horizon × D/W | 0.929 | 0.984 | 0.860 | 0.253 | 0.327 | 0.383 | 0.781 | 0.885 |
| P Nutrient status × Week | 0.893 | 0.735 | 0.749 | 0.698 | 0.716 | 0.185 | 0.652 | 0.044* |
| P Horizon × Week | 0.760 | 0.027* | 0.016* | 0.162 | 0.161 | 0.138 | 0.048* | 0.654 |
| P D/W × Week | 0.118 | < 0.001*** | < 0.001*** | < 0.001*** | 0.004** | < 0.001*** | 0.821 | 0.051 |
| P Nutrient status × Horizon × Week | 0.708 | 0.305 | 0.016* | 0.152 | 0.965 | 0.295 | 0.085 | 0.684 |
| P Nutrient status × D/W × Week | 0.416 | 0.966 | 0.724 | 0.570 | 0.931 | 0.981 | 0.351 | 0.571 |
| P Horizon × D/W × Week | 0.461 | 0.204 | 0.132 | 0.398 | 0.937 | 0.259 | 0.503 | 0.101 |
Statistical significances of the effects of site (Nutrient status of the sites), horizon (Oi, Oe-Oa, and A) and drying-rewetting (D/W) and their interactions on the temporal pattern of C mineralization, DOC, DIN, DON, DIP, DOP mobilization, as well as DOC:DON and DOC:DOP ratios in leachates.
In the linear mixed effects model (lme), time was used as a continuous factor. Significant at
P < 0.05,
P < 0.01,
P < 0.001.
Net N and P Mineralization and Immobilization
Nitrogen and P were primarily released in inorganic form from the moist soil materials (Supplementary Material, Figure 2). On average, release of dissolved inorganic N—or net N mineralization—accounted for 74% of the release of total dissolved N, while net P mineralization contributed 68% to total P release. At the nutrient-rich site BBR, inorganic N was primarily released as nitrate, indicating net nitrification, while at the nutrient-poorer site LUE, no net nitrification occurred in any of the horizons over the entire experimental period (PNutrientstatus < 0.001; data not shown).
Similar as C mineralization, net mineralization of N and P decreased from the Oi to A horizons (Figure 2; Table 3). Net mineralization of N and P normalized to the N and P contents of the soil materials differed significantly among each other (PElement < 0.001), and the effect depended on the horizon (Figure 3; PElement × Horizon < 0.001). In the Oi horizon, net mineralization of P – on average 20% of its P content – was greater than that of N (8% of N content); the mineralization rates in the A horizon were much smaller for P than for N (0.7 vs. 6%). In the Oe-Oa horizon, they were almost similar (Figure 3).
Figure 3
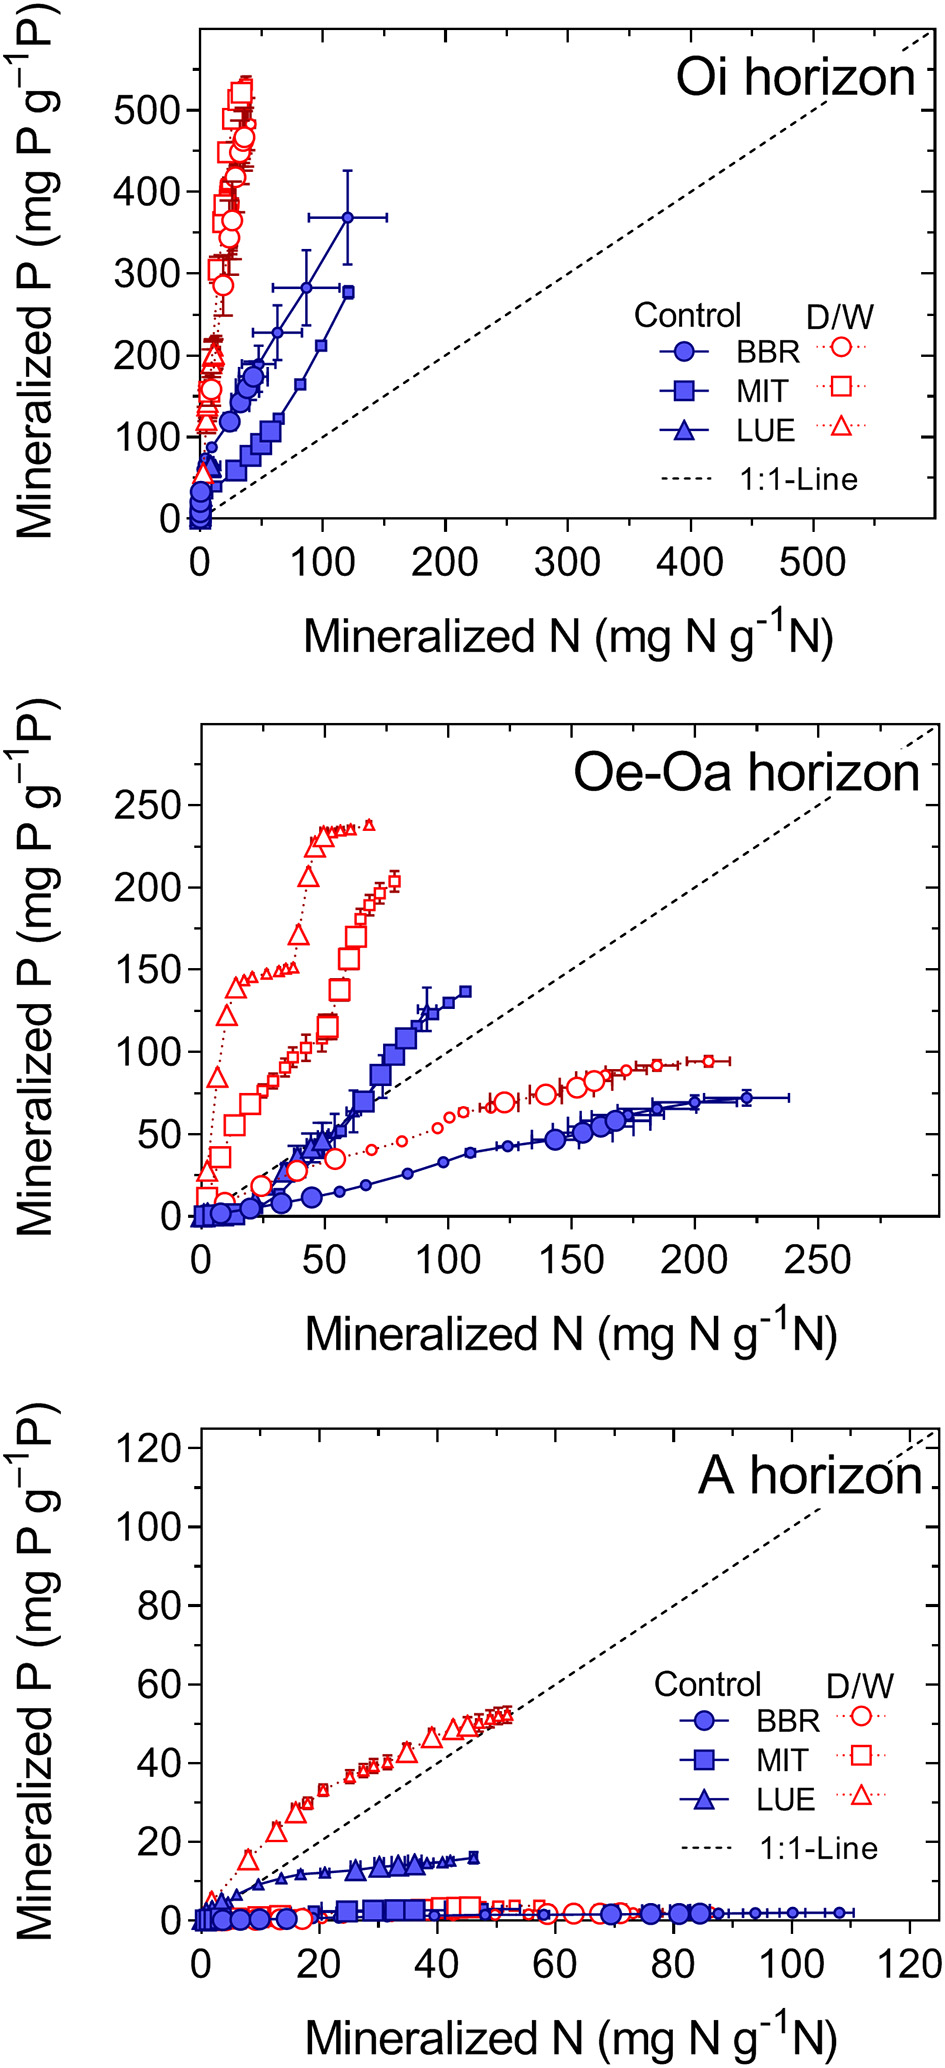
Net P mineralization related to net N mineralization, each normalized to the nutrient contents of the soil. Means and standard errors of four replicates. The D/W-treatment consisted of one short, harsh initial drying and a second moderate, 1 month-long drying.
The patterns of net N and P mineralization also differed among sites (PElement × Nutrientstatus < 0.005). Net N mineralization increased with the nutrient status of the sites in all horizons (PNutrientstatus < 0.05), whereas the site effects on net P mineralization differed among horizons (PNutrientstatus × Horizon < 0.004; Figure 2). In the Oi horizon, net P mineralization increased with nutrient richness of the site but in the Oe-Oa and A horizons, net P mineralization was greater for the nutrient-poor than for the nutrient-rich site.
While we did not measure microbial nutrient immobilization directly (e.g., by using 33P; Pistocchi et al., 2018), N and P immobilization was qualitatively assessed by comparing the net release of DIN and DIP with C mineralization (Figure 2), where smaller net nutrient mineralization per unit nutrient than of C mineralization per unit C is indicative for net nutrient immobilization. In the Oi horizon, cumulative net N mineralization per unit N during the entire 233 day long incubation increased from 3% of C mineralization per unit C at the nutrient-poor site LUE to 25% of C mineralization at the nutrient-rich site BBR. Net P mineralization per unit P ranged between 14% of C mineralization at LUE and 80% at BBR, indicating a smaller P than N immobilization. In the A horizon, N was mineralized at a similar rate as C (96% on average), whilst net P mineralization was only 2.5% of that of C at BBR and 21% at LUE (Figure 2).
Annual C, N, and P Mineralization
To assess the importance of the organic layers and the mineral soil for mineralization, C, N, and P release (Figure 2) was multiplied with the corresponding stock in the horizon (using data from Lang et al., 2017). The resulting “mineralizable nutrient stocks,” expressed on m2-basis (Figure 4), were greatest for N in the A horizon, whereas it was greatest for P in the Oe-Oa horizon (PElement × Horizon < 0.001). For both N and P, the contribution of the organic layer to the total mineralizable nutrient stocks increased from the nutrient-rich site BBR to the nutrient-poor site LUE (PNutrientstatus × Horizon < 0.001). The mineralizable stocks increased, as expected, for N from the nutrient-poor site LUE to the nutrient-rich site BBR (PNutrientstatus < 0.01). Counterintuitively, the mineralizable P stock decreased from LUE to BBR (PNutrientstatus < 0.01).
Figure 4
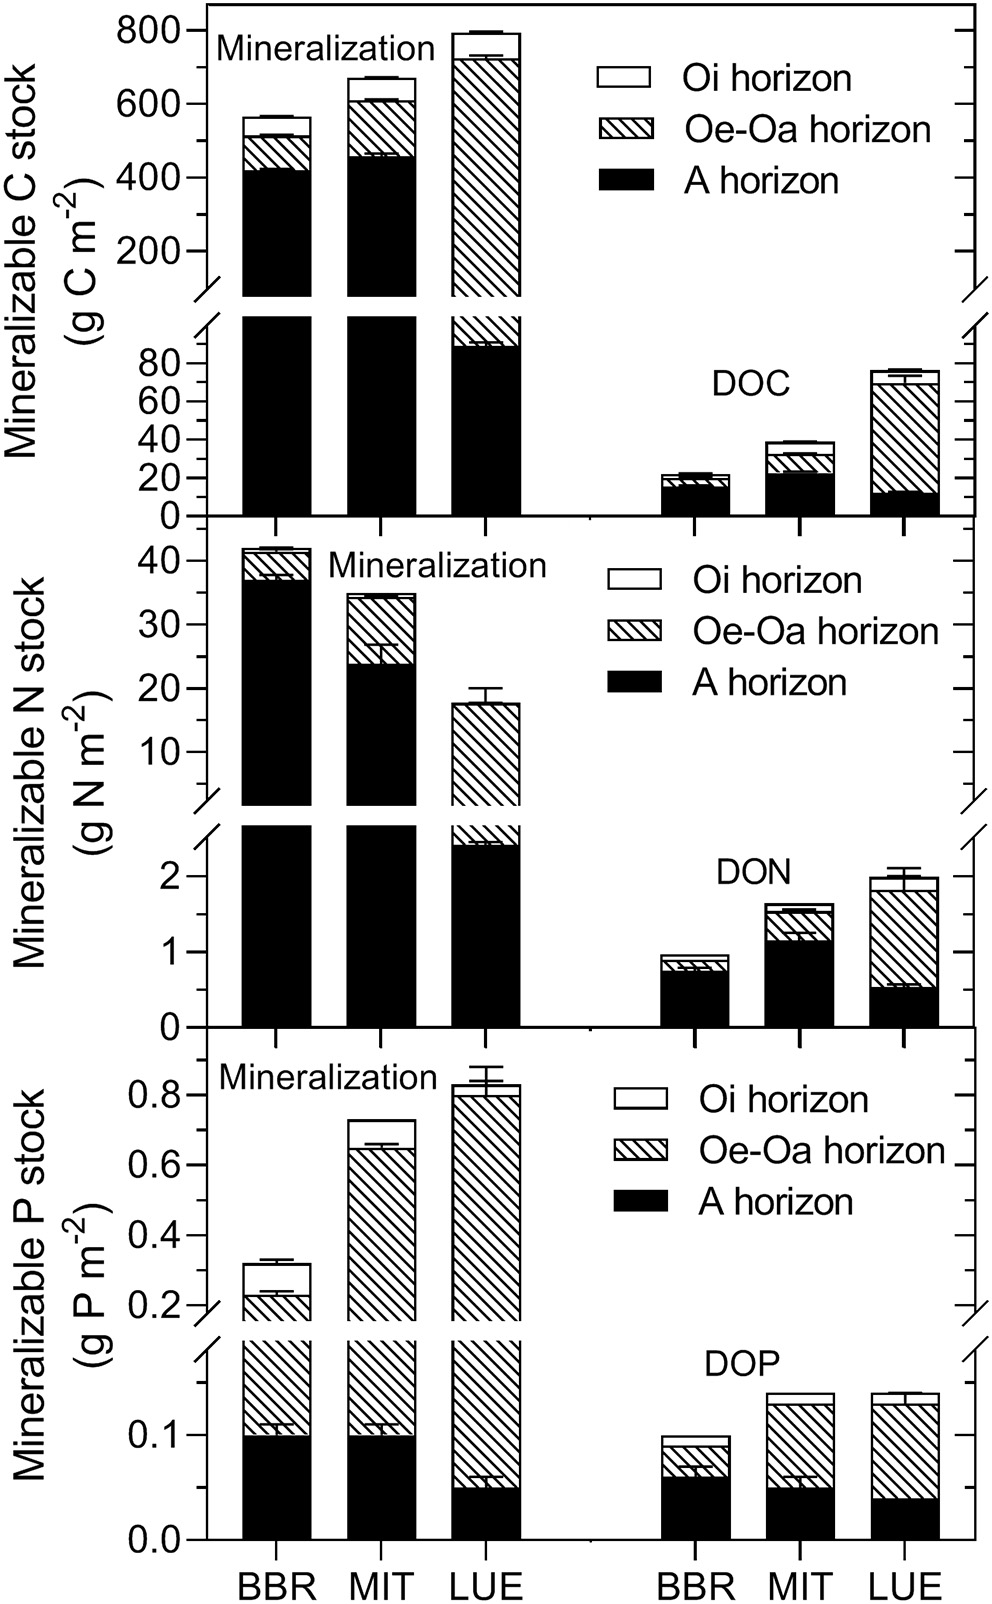
Mineralizable C, N, and P stocks in the Oi, Oe-Oa, and A horizons estimated by multiplying cumulative net mineralization rates with the corresponding soil stocks. Means and standard errors of four replicates of the permanent moist control.
Annual element mineralization was assessed from the mineralizable element stocks by considering the difference between incubation and mean annual temperatures at the sites (Table 1) and assuming that element mobilization follows a typical temperature dependency with a Q10 value of 3 (Conant et al., 2008). The calculations indicated that net C and N mineralization were on average 90 and 230% greater than C and N inputs via annual leaf litterfall, respectively (Table 4). In contrast, for P, average annual net mineralization rates corresponded to those of leaf litterfall.
Table 4
| Net mineralization | DOM mobilization | Leaf - Litterfall | |||||||
|---|---|---|---|---|---|---|---|---|---|
| g C m−2y−1 | g N m−2y−1 | g P m−2y−1 | g DOC m−2y−1 | g DON m−2y−1 | g DOP m−2y−1 | g C m−2y−1 | g N m−2y−1 | g P m−2y−1 | |
| Bad Brückenau | 187 ± 1.5 | 13.9 ± 0.4 | 0.106 ± 0.011 | 7.4 ± 0.3 | 0.32 ± 0.02 | 0.034 ± 0.004 | 101.9 | 3.16 | 0.229 |
| Mitterfels | 193 ± 2.0 | 10.1 ± 0.9 | 0.209 ± 0.005 | 11.2 ± 0.4 | 0.47 ± 0.04 | 0.041 ± 0.003 | 144.0 | 3.62 | 0.213 |
| Lüss | 334 ± 3.8 | 7.5 ± 1.0 | 0.349 ± 0.039 | 32.2 ± 2.1 | 0.84 ± 0.14 | 0.059 ± 0.008 | 131.2 | 2.87 | 0.156 |
Estimates of annual net C, N, and P mineralization and mobilization of DOC, DON, and DOP from the Oi, Oe-Oa, and A horizon by multiplying measured mobilization rates with pool sizes and assuming that mobilization processes follow a typical temperature dependency with a Q10 value of 3 (Conant et al., 2008).
For comparison, annual C, N, and P input through leaf litterfall are shown (data from Lang et al., 2017).
Mobilization of DON and DOP
The mobilization of DON and DOP normalized to respective element mass in soil decreased from the Oi to the A horizon, paralleling the decreasing mobilization of DOC. Released dissolved organic matter was relatively more enriched in P than in N. The DOC:DON and DOC:DOP ratios correlated significantly with the respective element ratios of the parent soil materials (r2 = 0.66 and 0.72, respectively; Figure 5), with the DOC:DON being greater than the soil C:N ratio; the DOC:DOP was close to the C:P of solid soil organic matter. The ratios of DOC:DON and DOC:DOP both increased from the nutrient-rich site BBR to the nutrient-poor site LUE.
Figure 5
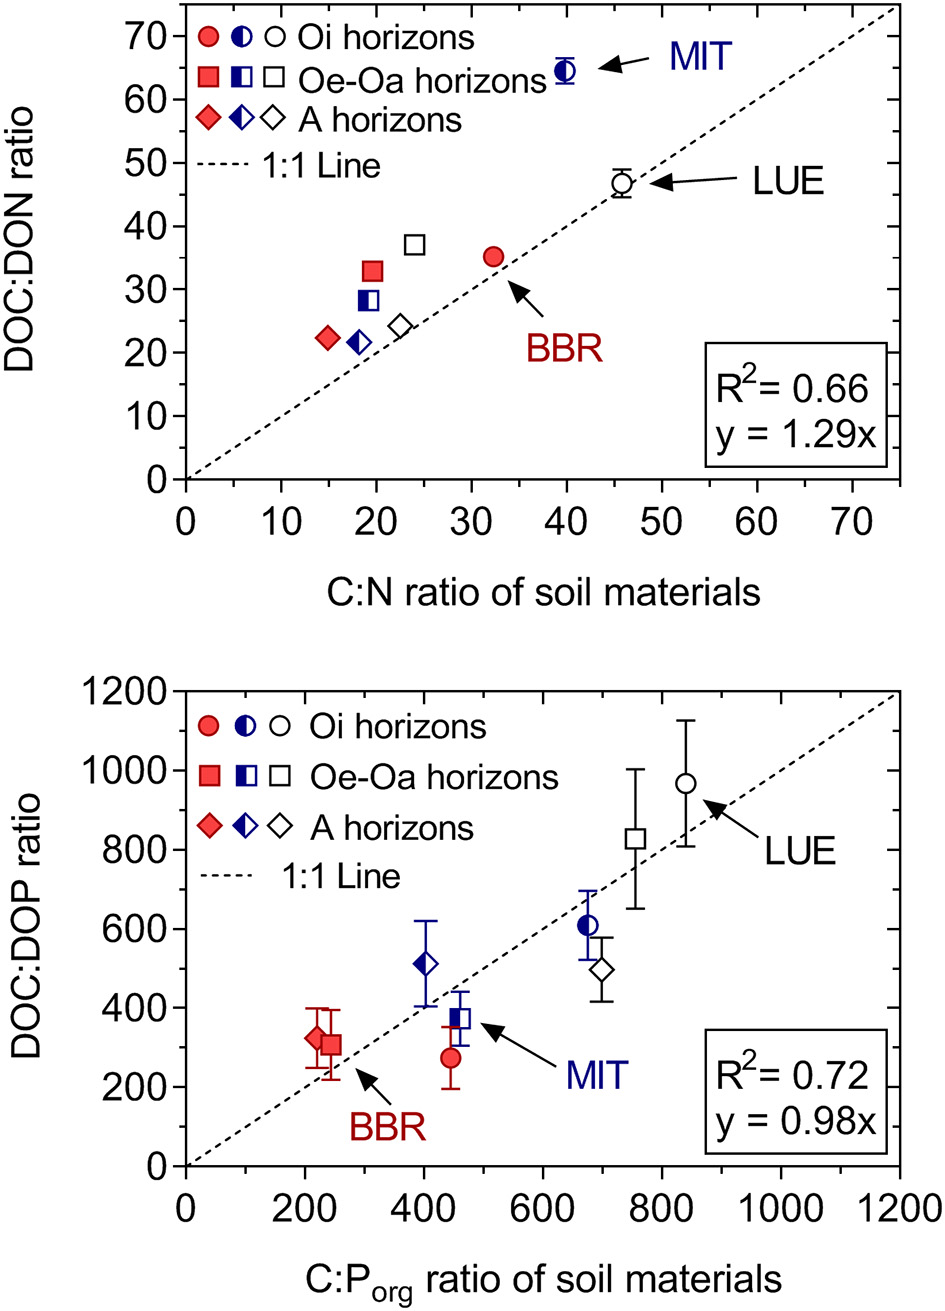
Ratio of mobilized DOC:DON and DOC:DOP (averaged over 33 weeks) related to C:N and C:Porg ratios of initial soil materials for the permanent moist control treatment. While DOC:DON ratios are greater than soil C:N ratios, the DOC:DOP ratios and soil C:Porg ratios are similar. Means and standard errors of four replicates.
Controls on C, N, and P Mobilization
In the permanent moist control treatment, net N and P mineralization were poorly correlated, while DOC, DON, and DOP mobilization were well-correlated with C mineralization (Table 5). Mobilization of DOC, DON, and DOP, the DOC:DON ratio and, to lesser extent, net P mineralization were correlated to indicators of SOM degradability, such as the ratios of C:N and lignin:N as well as hot water-soluble C, which all declined with soil depth.
Table 5
|
N mineralization
(mg g−1 N) |
P mineralization
(mg g−1 P) |
DOC mobilization
(mg g−1 C) |
DON mobilization
(mg g−1 N) |
DOP mobilization
(mg g−1 P) |
DOC:DON | DOC:DOP | |
|---|---|---|---|---|---|---|---|
| C mineralization | 0.03 | 0.66 | 0.84** | 0.87** | 0.88** | 0.74* | 0.27 |
| N mineralization | 1.00*** | 0.30 | −0.18 | −0.29 | 0.04 | −0.17 | −0.62 |
| DOC mobilization | −0.18 | 0.48 | 1.00*** | 0.97*** | 0.85** | 0.96*** | 0.57 |
| DON mobilization | −0.29 | 0.43 | 0.97*** | 1.00*** | 0.83** | 0.89** | 0.55 |
| Total Corg | 0.16 | 0.74* | 0.66 | 0.58 | 0.79* | 0.71* | 0.24 |
| C:N ratio |
−0.31 | 0.50 | 0.98*** | 0.98*** | 0.86** | 0.93*** | 0.60 |
| C:Porg ratio |
−0.63 | 0.14 | 0.66 | 0.68* | 0.46 | 0.66 | 0.77* |
| Lignin:N ratio |
−0.23 | 0.55 | 0.95*** | 0.89** | 0.83** | 0.96*** | 0.64 |
| Water-soluble phenolics | 0.01 | 0.72* | 0.90*** | 0.81** | 0.91*** | 0.89** | 0.36 |
| Hot water -soluble C |
0.11 | 0.73* | 0.81** | 0.75* | 0.88** | 0.83** | 0.29 |
| Klason Lignin | 0.23 | 0.68* | 0.48 | 0.39 | 0.64 | 0.58 | 0.18 |
Pearson correlation coefficients (r), between cumulative C mineralization, N-mineralization, P mineralization, DOC mobilization, DON mobilization, DOP mobilization, DOC:DON, and DOC:DOP ratios in leachates, and chemical characteristics of the nine soil horizons.
Significant correlations are marked by asterisks. Significant at
P < 0.05,
P < 0.01,
P < 0.001.
Drying–rewetting
During the first initial dry-spell of the drying and rewetting (D/W) experiment, gravimetric water contents (GWC) in the two organic horizons averaged 25% under drought ad 76% in the moist control. In the A horizons, GWC ranged between 24 and 56% in the control and 1–11% in the drought treatment (Table 2). Rewetting increased soil moisture immediately to identical values as in the control. During the moderate second dry spell with a 4 weeks long drying in a climate chamber, soil moisture contents decreased to similar values as after the first dry spell (PD/W < 0.001; Table 2), and increased again following rewetting.
Drying–rewetting affected net C, N, and P mineralization but had substantially greater effects on the release of P than of C and N (PElement × D/W < 0.001; Figure 6). In the first week after rewetting following drought, C mineralization increased in the harsh first D/W cycle (+142%; PD/W = 0.05) as well as in the second moderate D/W cycle (+17% on average; PD/W = 0.38). The flush in C mineralization was only short-lived and due to the reduced C mineralization during drought; D/W even decreased total C mineralization over the entire experimental period by 19%, but this decline was not significant (PD/W = 0.32). Mobilization of DOC increased during the first weeks of rewetting (PD/W = 0.05 in the first D/W cycle; PD/W = 0.28 in the second D/W cycle), but overall, D/W did not alter DOC mobilization (Supplementary Material, Figure 2).
Figure 6
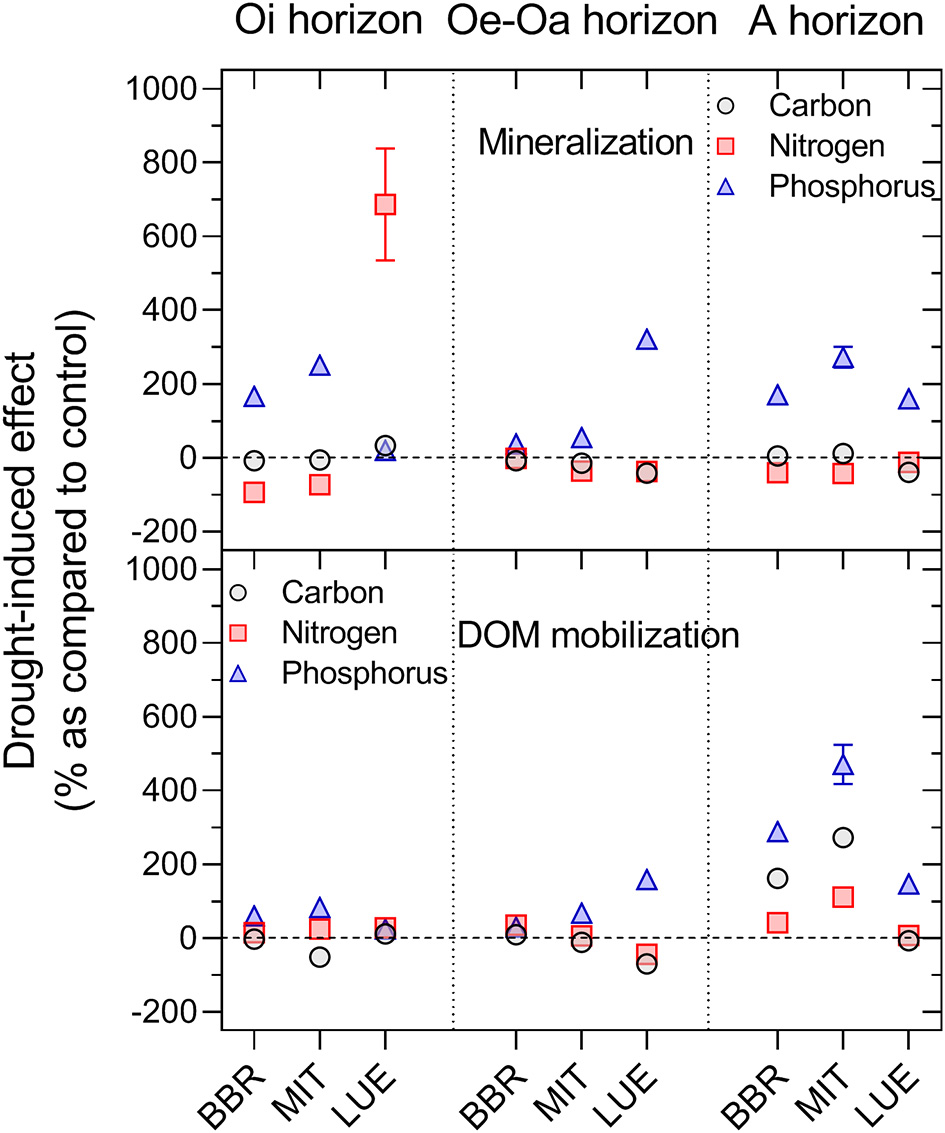
Effects of the drying-rewetting on the net mineralization of C, N, and P (upper panel) and mobilization of C, N, and P in dissolved organic matter (lower panel). Here, only data from the first 4 leaching cycles after the second dry spell are shown. Means and standard errors of four replicates.
With respect to N, D/W only showed enhanced net N mineralization during rewetting after the first dry spell (PD/W < 0.001, Figure 1). Rewetting after the second dry spell even decreased net N mineralization, leading to an overall smaller cumulative net N mineralization (−40% in 8 out of 9 tested soil materials; Figure 6), but again the effect was not significant. Ammonium was the dominating form of N released during the first weeks of rewetting, while nitrate dominated in the following weeks except at LUE (data not shown). The Oi horizon at the nutrient-poor site LUE showed a different pattern than all other materials. Here, net N mineralization was smaller than in the Oi horizons of the other sites, but D/W enhanced net N mineralization by factor of 7 (Figure 6).
Phosphorus showed a significantly greater response to D/W than C and N (PElement × D/W < 0.001; Figure 6). Rewetting following the initial drying caused a strong pulse in the release of DIP and DOP (PD/W × Week < 0.001), and thus, increased the total P release more than tenfold as compared to the permanent moist control during the first month after rewetting (Figure 1). The D/W effect was smaller in the second, more moderate dry spell, but still total P release was on average 180% greater than that in the permanent moist control treatment (Figure 6). Over the entire experimental period, D/W approximately doubled total P release even when including the drought period without P leaching (PD/W < 0.05; Table 3). The effects of D/W were greater for net P mineralization than for DOP mobilization in the organic layer but smaller in the A horizon (Figure 6). The D/W effect was particularly strong in the nutrient-poorest site LUE. Following the peaking net P release with rewetting, the P release rates of the D/W treatment dropped to the level of the permanent moist control.
Similarly as P, the ratios of DON/DOC and DOP/DOC declined strongly with rewetting following drought, indicating that D/W altered the composition of dissolved organic matter (Figure 7; PD/W < 0.001) (Figures 6, 7).
Figure 7
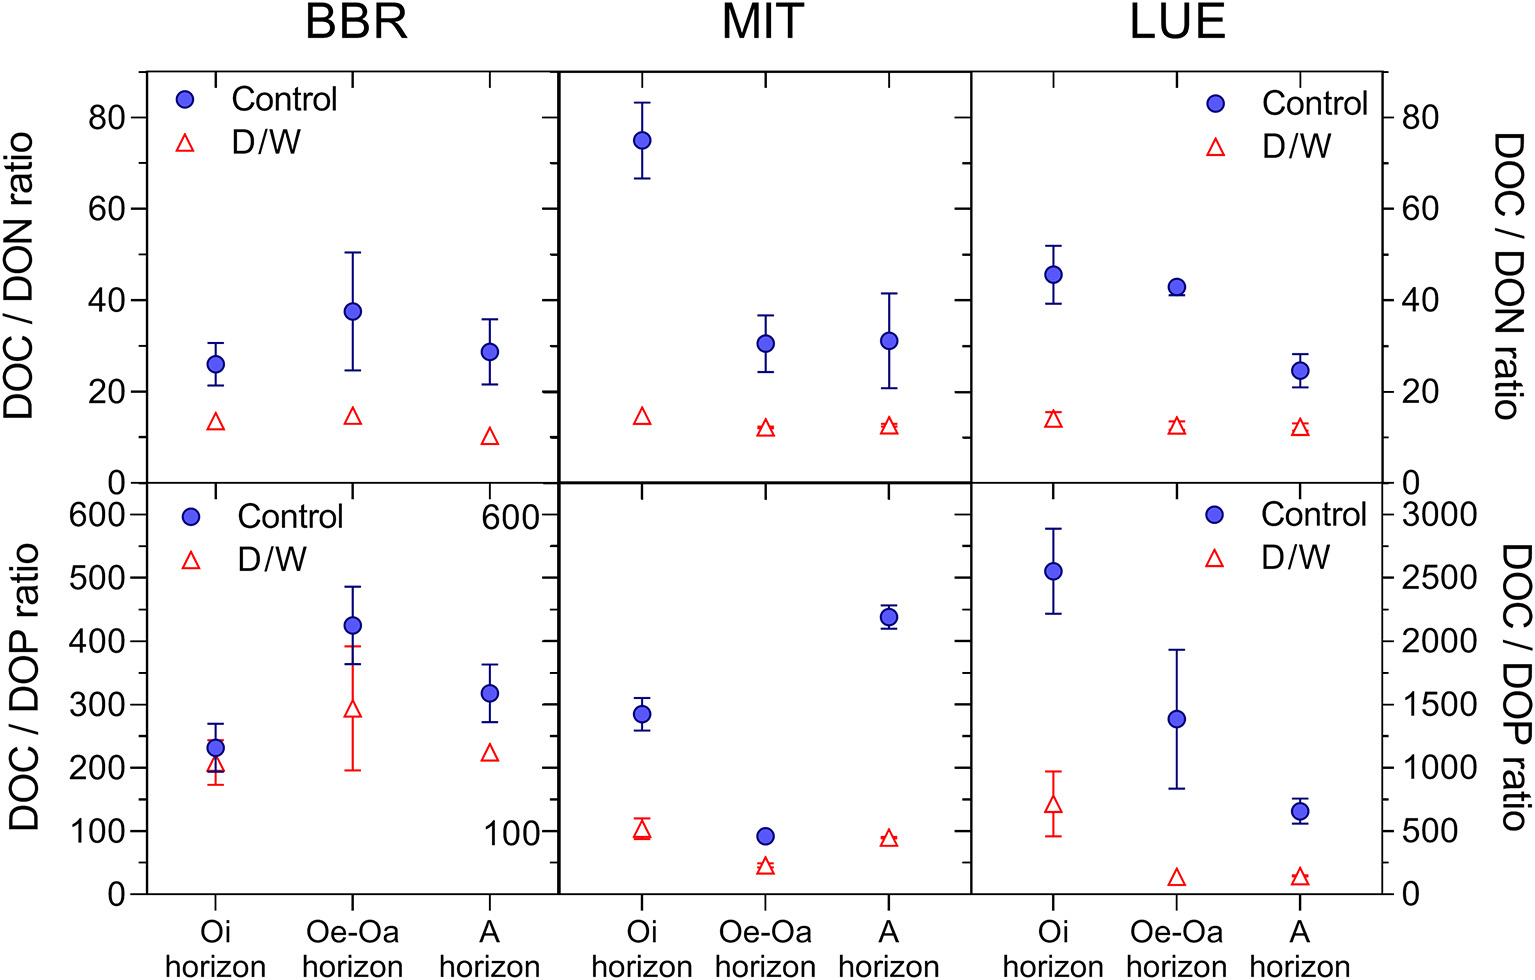
Effects of the drying-rewetting on DOC:DON ratios and DOC:DOP ratios in leachates collected after the second dry spell in week 19. Means and standard errors of four replicates.
Sorption of Released C, N, and P Forms
Our assessment of the affinity of released C, N, and P forms in leachates from the Oe-Oa horizons sampled after 19 weeks to goethite showed that DIP was most strongly sorbed (98%), followed by DOP (85%), DOC (81%), DON (40%), (4%), and (0%) (Figure 8). While drying and rewetting did not affect the sorption of dissolved inorganic N and P, it slightly increased the sorptivity of DOC and DOP, but increased it strongly for DON to 69%.
Figure 8

Sorption of inorganic and organic C, N, and P in leachates to goethite. Data shown here are based on leachates from the Oe-Oa horizon collected after 19 weeks of incubation in the permanent moist control treatment and during rewetting following drought (D/W). Means and standard errors of four replicates.
Discussion
Decoupling of C, N, and P Mineralization
Although C, N, and P mineralization are driven by the same process—microbial decomposition of soil organic matter—they are surprisingly decoupled in the forested organic surface layers and mineral topsoils studied here (Figure 9). Net mineralization rates of the three elements showed strongly divergent patterns with soil depth and along the tested soil fertility gradient. They also responded differently to drying and rewetting (Figure 7). The decrease in C mineralization with soil depth from the Oi to the A horizon reflects the loss of labile components (e.g., carbohydrates) during the initial phase of decomposition, enrichment in refractory components (e.g., aliphatic compounds) with progressing SOM transformation in the deeper organic layers, and SOM stabilization by the interaction with reactive mineral surfaces in the A horizons (Berg and Matzner, 1997; Kaiser and Guggenberger, 2000; Colman and Schimel, 2013). The declining SOM bioavailability with soil depth is not paralleled by a similar decline in net N and P mineralization, possibly due to partial immobilization of N and P released from decomposing SOM (Figure 9). Nutrient immobilization may shift from biotic processes, i.e, incorporation into microbial biomass in the organic layer (Mooshammer et al., 2014) to abiotic processes, such as sorption to mineral phases in the A horizon, with the importance of these processes differing between N and P. For instance, in the Oi horizon, the substantially smaller net mineralization of N than of P (Figures 2, 3) could partly reflect the lower bioavailability of organic N than organic P. While P is primarily ester-bonded, organic N is directly C-bonded, and hence, more difficult to mineralize than P (Vitousek and Howarth, 1991; Bol et al., 2016). However, net mineralization under permanent moist conditions was 3 to 300 times smaller for N than for C mineralization in the litter layer, pointing to an extraordinary strong N immobilization during decomposition. The reduction in net mineralization relative to the mineralization of C was two to five times smaller for N than for P, which suggests that other factors than differences bioavailability affect the mineralization of organically bound nutrients in the Oi horizons (Figure 2). Most likely, the differences reflect the greater demand of soil microorganisms for N than for P during litter decomposition, causing preferential N over P incorporation into microbial biomass to meet the relatively strict homoscedasticity in microbial biomass (Manzoni et al., 2010; Xu et al., 2013; Mooshammer et al., 2014). In result, net mineralization of P exceeds that of N. Along the soil fertility gradient, net mineralization of N and P in the Oi horizon increased expectedly from the nutrient-poor site LUE to the nutrient-rich site BBR, while C mineralization did not follow this pattern (Figure 2). Consequently, N and P immobilization inferred from the comparison of net mineralization of nutrients with that of C increased with increasing C:nutrient ratios in decomposing litter materials. The C:N ratios of the Oi horizon ranged between 32 and 45, which was clearly above the critical threshold C:N ratio of ca. 18 (mass:mass) for net N mineralization (Heuck and Spohn, 2016). In comparison, C:P ratios of the soil materials studied here exceeded the C:P threshold ratio of 560 only in the Oi horizon at the nutrient-poorest site LUE that indeed showed the strongest P immobilization, and thus, also the smallest net P mineralization. The findings of our microcosm study are supported by 33P labeling experiments revealing a stronger microbial P immobilization in the organic layer of the nutrient-poor site than at the nutrient-rich site, accounting for 95% of P gross mineralization (Pistocchi et al., 2018).
Figure 9
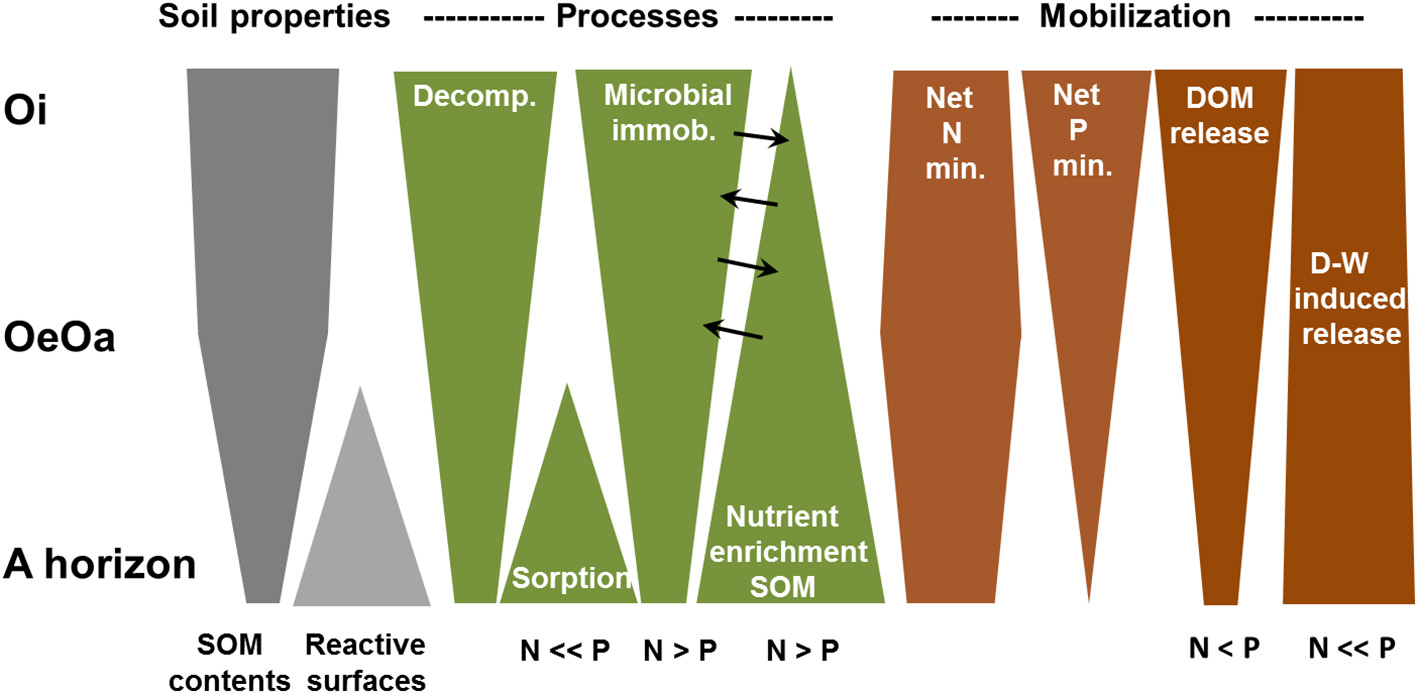
Schematic representation of processes leading to a divergent release of C, N, and P in the Oi, Oe-Oa, and A horizons of forest soils.
In comparison to the organic layers, net N and P mineralization in the A horizons showed opposite trends. Here, net N mineralization per unit N was close to the amount of C mineralized per unit C (Figure 2), indicating negligible N immobilization. In contrast, net P mineralization was only 5 to 20% of that of C, indicating strong retention of mineralized P. It seems unlikely that the P retention in the A horizon was caused by microbial immobilization as the C/P ratios of soil materials decreased toward the A horizon (Table 2) and the C/P ratio of microbial biomass in surface soils of Northern Germany decreases from the Oi to the A horizon (Zederer et al., 2017), implying that the microbial P demand became smaller toward the mineral soil. Instead, our sorption experiment shows that the pronounced differences in N and P immobilization in the A horizon is primarily caused by the stronger sorption of mineralized than of mineralized or (Figure 8; Barrow, 1983; Celi et al., 2003). The lacking sorption of to positively charged goethite demonstrates that despite its negative charge, is very mobile in the soils studied. For , however, we might have underestimated the possible retention in our sorption test with positively charged goethite at low pH values (Figure 8). For instance, can be sorbed to clay minerals and dissociated carboxyl groups of soil organic matter. However, was rapidly nitrified in the clayey soil of BBR and N immobilization was negligible in the mineral soils (Figure 2). This strongly suggest that sorption of was—in contrast to phosphate, DOC, DON, and DOP—quantitatively not important.
The differential sorptivity of inorganic N and P forms also affect the patterns of net mineralization along the fertility gradient. While net N mineralization increased toward the more fertile soils with decreasing C:N ratios, reflecting an enhanced N availability, net P mineralization increased with increasing C:P ratios, and thus, showed the opposite pattern than one would expect based on stoichiometry (Figure 2). The P-poor soil at the site (LUE) developed from sands from the Pleistocene and has smaller contents of Fe and Al oxides, and thus, less reactive surfaces than the soil from the P-rich site BBR developed from basalt (Lang et al., 2017). Consequently released reactive anions, either phosphate or components of dissolved organic matter, likely become immediately sorbed at BBR but not at LUE. In agreement, 33P labeling experiments indicate a greater P flux to the mineral phase and a smaller microbial P immobilization at BBR than at LUE (Pistocchi et al., 2018; Spohn et al., 2018). Despite the strong P retention at BBR, trees are better supplied with P because of P released from the P-rich parent material (Bünemann et al., 2016). The overriding effect of sorption in mineral soils strongly suggests that N and P mineralization in forest soils are not as closely coupled as suggested by previous N and P mineralization studies restricted to litter or the organic layer (Manzoni et al., 2010; Heuck and Spohn, 2016; Marklein et al., 2016). Our results lend support for the global survey by Augusto et al. (2017), indicating that parent material plays a dominant role for P availability, while larger scale patterns of N availability are determined by climate.
Organic Layer, Key Source of P but Not of N
In undisturbed soils with a continuous forest cover, element stocks are assumed to be in a quasi-steady state, and thus, inputs from plants and outputs of elements are almost balanced (Davies et al., 2016). Our rough estimates of annual C mineralization (by linking incubation data with measured soil C stocks) exceed C input via leaf litterfall by 30 to 150% (Table 4). However, other components of litterfall (e.g., twigs and fruits) provide similarly high C input into soils as leaves (Neumann et al., 2018), which suggests that the magnitudes of these two C fluxes are in fact rather similar. In comparison, estimates of annual net N mineralization are about three fold greater than N inputs with leaf litter. Since our study considered surface soils only, we likely underestimated the contribution of N mineralization in deeper mineral soils. The discrepancy is probably related to the long lasting deposition of N from the atmosphere, exceeding N inputs with litterfall (e.g., Borken and Matzner, 2004). The amount of N mineralized (7.5 to 14 g N m−2y−1) corresponds to the N requirement of temperate deciduous forests (6–13 g N m−2y−1; Cole and Rapp, 1981; Rennenberg and Dannenmann, 2015). In contrast to N, net P mineralization of 0.1 and 0.35 g P m−2y−1 was smaller than P requirements of temperate deciduous forests, which range between 0.5 and 1.1 g P m−2y−1 (Cole and Rapp, 1981). This suggests that a substantial fraction of the forest's P supply derives from P released from rocks or secondary minerals (Uhlig and von Blanckenburg, 2019). Unexpectedly, our study revealed that net P mineralization increases toward the P-poor site LUE, indicating that the importance of P mineralization increases with P impoverishment. Mineralized P derived almost entirely from the organic layer at LUE, in particular from the thick Oe-Oa horizon, suggesting that the greatest amount of P is not released from fresh litter but from the larger stocks of degraded organic materials, which in addition, were found to be less prone to microbial P immobilization. This finding implies that losses of the organic layer at nutrient-poor sites, e.g., by soil disturbances or increased decomposition in a warming climate, would deteriorate forest's P supply. The impact of organic layer losses would be less severe for N, as the greatest amount of N is mineralized in the mineral soil, except for nutrient-poor sites such as LUE with low SOM contents in the upper mineral soils. Moreover, the sustained high atmospheric deposition provides ample—if not excess—N for tree growth (Borken and Matzner, 2004).
Dissolved Organic C, N, and P
In contrast to the divergent mineralization patterns, the mobilization of dissolved organic forms of C, N, and P were all significantly correlated (Table 5). Relationships of DOP with DOC and DON were less tight than that of DON with DOC, which we attribute to the low accuracy in measuring DOP at very low P concentrations. The significant correlation between C:N and C:P ratios in dissolved and total SOM indicates that the stoichiometry of the parent material is imprinted on the DOM. In relative terms, DOM is more enriched in P than in N, possibly due to microbial metabolites with small N:P ratios contributing to DOM. This strongly suggests that DOM is more important for the leaching of P than of N but there are too few in situ measurements of DOP fluxes to support this conclusion (Qualls and Haines, 1991; Kaiser et al., 2003; Bol et al., 2016). In soil profiles, DOM leached was found to become increasingly enriched in N and P with soil depth, which was related to preferential sorption of compounds depleted in N and P (Kaiser et al., 2003). In support, our sorption experiment indicate a weaker sorption of DON to goethite than DOC, possibly due to a low reactivity of amino and amid groups. In contrast, DOP was sorbed similarly than DOC. Microbial processing during the downward migration of organic matter may contribute to the enrichment of DON and DOP with depth (Kaiser and Kalbitz, 2012; Hagedorn et al., 2015). Our finding of DOM and SOM stoichiometry being interrelated is congruent with the latter idea, since the decrease in C to nutrient ratios in SOM with soil depth (Lang et al., 2017) would be associated with a production of DOM that becomes increasingly enriched in N and P with soil depth.
Drying and Rewetting
Severe drought and subsequent rewetting cause lysis of microbial cells as well as disruption of aggregates, both potentially inducing large releases of C and nutrients (Borken and Matzner, 2009; Schimel, 2018). The pronounced decline of DOC:DON and DOC:DOP ratios with rewetting to <50% of the ratios in SOM (Figure 7) indicates a source with high nutrients contents, which strongly points at a strong contribution from lysed microbial biomass with tight C:N:P ratio.
Our results show that effects of D/W were much greater for P than for C and N (Figures 1, 3, 6), for which D/W induced only a small and short-lived flush that was compensated by the smaller release rates during drought. In contrast to net N mineralization, D/W suppressed net nitrification, and thus, favored the production of over that of , very likely due to the high sensitivity of ammonium oxidizers to drought (Stark and Firestone, 1995). The strikingly greater impact of D/W on the mobilization of P than of C and N is probably related to the tight C:P and N:P ratios in microbial cells, which are prone to lysis upon rewetting (Mooshammer et al., 2014; Hömberg and Matzner, 2018). While N is primarily stored in structural microbial compounds, there is evidence for specific P storage of inorganic polyphosphates in granules of some bacteria (Nikel et al., 2013) and soil fungal tissue (Bünemann, 2008; Cheesman et al., 2012). Lysis of fungal tissues might have also been contributed to the exceptionally high N release from the Oi horizon at LUE in the D/W treatment (Figures 1, 6) because the decomposing beech litter was visibly colonized by Xylaria filiformis and fungi have on average greater N:P ratios than bacteria (7 vs. 4; Cleveland and Liptzin, 2007; Zhang and Elser, 2017). In agreement, Dinh et al. (2017) observed that drought-induced P release may strongly differ between fungal and bacterial strains.
Conclusion
Our results show that, despite being driven by SOM decomposition, patterns of net C, N, and P mineralization in forest surface soils are not directly linked but considerably decoupled. Mobilization of DOC, DON, and DOP is more closely related to SOM degradability and reflects the C:N:P ratios of the parent organic materials. Reasons for the divergence in net mineralization seem the stronger microbial immobilization of N than of P in decomposing litter and organic horizons and the pronounced retention of released phosphate by sorption in mineral soils. We suggest that studies on nutrient cycling in soils need to place more emphasis on interactions with minerals as they will not only constrain the net release of nutrients but also the bio-availability of organically bound nutrients. Consequently, interactions of SOM with mineral surfaces seem at least as important in controlling nutrient supply as stoichiometry. Ideally, these studies are combined with functional assessments of soil microbial communities, allowing for disentangling the relative importance of SOM composition, soil mineralogy, and microbial communities for nutrient cycling in soils.
Drying and rewetting has also divergent impacts on element mobilization. It enhances the mobilization of P more strongly than that of N and C, most likely due to lysis of microbial biomass with tight C:N:P ratios. These effects are only short-lived and might, thus, be of little relevance for acute forest nutrition. At longer time scales, however, repeated D/W may enhance P leaching losses, and thus, contribute to the progressing P depletion of ecosystems.
The decoupling of N and P mineralization observed here may also contribute to the increasing imbalances among nutrients in forested ecosystems (Peñuelas et al., 2013; Talkner et al., 2015). The greatest amounts of N are mineralized in the mineral soil, which, in conjunction with the continuous high atmospheric N deposition, provides ample or even excessive N supply to trees. In contrast, mineralized P derives almost entirely from the organic layer, especially in already nutrient-poor soils. A loss of the organic layer, e.g., upon soil disturbances or increased decomposition in a warming climate, would deteriorate P supply and induce increasing imbalances between N and P nutrition.
Statements
Data availability statement
The datasets [Data Broedlin CNP.] for this study can be found in the [EnviDat] [doi: 10.16904/envidat.78].
Author contributions
FH, DB, and KK designed the study. DB has set up the microcosm experiment, collected samples, and has analyzed solute samples together with KK. DB and FH performed data analysis and wrote the manuscript, with strong inputs from KK.
Funding
We gratefully acknowledge the financial support by the Swiss National Science Foundation (SNF, project 200021E-149133) and German Research Foundation (DFG, project KA1673/9-1) as part of the 1685 priority program (Ecosystem nutrition: Forest strategies for limited phosphorus resources, SPP 1685).
Acknowledgments
We are grateful to A. Kessler for his support in the soil sampling and setting up of the microcosm experiment. We also thank the WSL forest soil laboratory (N. Hajjar, A. Zürcher, D. Christen, M. Walser) for their technical support and conducting chemical analyses, the WSL central laboratory (A. Schlumpf, K. V. Känel, J. Bollenbach, U. Graf, D. Pezzotta) for analyzing samples and A. Boritzki at the Halle soil laboratory for P measurements.
Conflict of interest
The authors declare that the research was conducted in the absence of any commercial or financial relationships that could be construed as a potential conflict of interest.
Supplementary material
The Supplementary Material for this article can be found online at: https://www.frontiersin.org/articles/10.3389/ffgc.2019.00066/full#supplementary-material
References
1
Achat D. L. Bakker M. R. Zeller B. Pellerin S. Bienaimé S. Morel C. (2010). Long-term organic phosphorus mineralization in Spodosols under forests and its relation to carbon and nitrogen mineralization. Soil Biol. Biochem.42, 1479–1490. 10.1016/j.soilbio.2010.05.020
2
Anderson D. W. (1988). The effect of parent material and soil development on nutrient cycling in temperate ecosystems. Biogeochemistry5, 71–97. 10.1007/BF02180318
3
Augusto L. Achat D. L. Jonard M. Vidal D. Ringeval B. (2017). Soil parent material—A major driver of plant nutrient limitations in terrestrial ecosystems. Global Change Biol.23, 3808–3824. 10.1111/gcb.13691
4
Barrow N. J. (1983). A mechanistic model for describing the sorption and desorption of phosphate by soil. J. Soil Sci.34, 733–750. 10.1111/j.1365-2389.1983.tb01068.x
5
Berg B. Matzner E. (1997). Effect of N deposition on decomposition of plant litter and soil organic matter in forest systems. Environ. Rev.5, 1–25. 10.1139/a96-017
6
Birch H. F. (1958). The effect of soil drying on humus decomposition and nitrogen availability. Plant Soil10, 9–31. 10.1007/BF01343734
7
Bol R. Julich D. Brödlin D. Siemens J. Kaiser K. Dippold M. A. et al . (2016). Dissolved and colloidal phosphorus fluxes in forest ecosystems—an almost blind spot in ecosystem research. J. Plant Nutr. Soil Sci.179, 1–14. 10.1002/jpln.201600079
8
Borken W. Matzner E. (2004). Nitrate leaching in forest soils: an analysis of long-term monitoring sites in Germany. J. Plant Nutr. Soil Sci.167, 277–283. 10.1002/jpln.200421354
9
Borken W. Matzner E. (2009). Reappraisal of drying and wetting effects on C and N mineralization and fluxes in soils. Global Change Biol.15, 808–824. 10.1111/j.1365-2486.2008.01681.x
10
Brödlin D. Kaiser K. Kessler A. Hagedorn F. (2019). Drying and rewetting foster phosphorus depletion of forest soils. Soil Biol. Biochem.128, 22–34. 10.1016/j.soilbio.2018.10.001
11
Bünemann E. K. (2008). Enzyme additions as a tool to assess the potential bioavailability of organically bound nutrients. Soil Biol. Biochem.40, 2116–2129. 10.1016/j.soilbio.2008.03.001
12
Bünemann E. K. Augstburger S. Frossard E. (2016). Dominance of either physicochemical or biological phosphorus cycling processes in temperate forest soils of contrasting phosphate availability. Soil Biol. Biochem.101, 85–95. 10.1016/j.soilbio.2016.07.005
13
Bünemann E. K. Keller B. Hoop D. Jud K. Boivin P. Frossard E. (2013). Increased availability of phosphorus after drying and rewetting of a grassland soil: processes and plant use. Plant Soil370, 511–526. 10.1007/s11104-013-1651-y
14
Celi L. De Luca G. Barberis E. (2003). Effects of interaction of organic and inorganic P with ferrihydrite and kaolinite-iron oxide systems on iron release. Soil Sci.168, 479–488. 10.1097/01.ss.0000080333.10341.a4
15
Cheesman A. W. Turner B. L. Ramesh Reddy K. (2012). Soil phosphorus forms along a strong nutrient gradient in a tropical ombrotrophic wetland. Soil Sci. Soc. Am. J.76, 1496. 10.2136/sssaj2011.0365
16
Cleveland C. C. Liptzin D. (2007). C:N:P stoichiometry in soil: is there a Redfield ratio for the microbial biomass?Biogeochemistry85, 235–252. 10.1007/s10533-007-9132-0
17
Cole D. W. Rapp M. (1981). Elemental cycling, in Dynamic Properties of Forest Ecosystems, ed ReichleD. E. (London: Cambridge University Press), 341–409.
18
Colman B. P. Schimel J. P. (2013). Drivers of microbial respiration and net N mineralization at the continental scale. Soil Biol. Biochem.60, 65–76. 10.1016/j.soilbio.2013.01.003
19
Conant R. T. Drijber R. A. Haddix M. H. Parton W. J. Paul E. A. Plante A. F. et al . (2008). Sensitivity of organic matter decomposition to warming varies with its quality. Global Change Biol.14, 868–877. 10.1111/j.1365-2486.2008.01541.x
20
Davies J. A. C. Tipping E. Rowe E. C. Boyle J. F. Graf Pannatier E. Martinsen V. (2016). Long-term P weathering and recent N deposition control contemporary plant-soil C, N and P. Glob. Biochem. Cycles231–249. 10.1002/2015GB005167
21
Dinh M.-V. Guhr A. Spohn M. Matzner E. (2017). Release of phosphorus from soil bacterial and fungal biomass following drying/rewetting. Soil Biol. Biochem.110, 1–7. 10.1016/j.soilbio.2017.02.014
22
Dinh M.-V. Schramm T. Spohn M. Matzner E. (2016). Drying—rewetting cycles release phosphorus from forest soils. J. Plant Nutr. Soil Sci.179, 670–678. 10.1002/jpln.201500577
23
Fanin N. Fromin N. Buatois B. Hättenschwiler S. (2013). An experimental test of the hypothesis of non-homeostatic consumer stoichiometry in a plant litter—microbe system. Ecol. Lett.16, 764–772. 10.1111/ele.12108
24
Hagedorn F. Bruderhofer N. Ferrari A. Niklaus P. A. (2015). Tracking litter-derived dissolved organic matter along a soil chronosequence using 14C imaging: biodegradation, physico-chemical retention or preferential flow?Soil Biol. Biochem.88, 333–343. 10.1016/j.soilbio.2015.06.014
25
Hagedorn F. Bucher J. B. Schleppi P. (2001). Contrasting dynamics of dissolved inorganic and organic nitrogen in soil and surface waters of forested catchments with Gleysols. Geoderma100, 173–192. 10.1016/S0016-7061(00)00085-9
26
Hagedorn F. Saurer M. Blaser P. (2004). A 13C tracer study to identify the origin of dissolved organic carbon in forested mineral soils. Eur. J. Soil Sci.55, 91–100. 10.1046/j.1365-2389.2003.00578.x
27
Heim A. Frey B. (2004). Early stage litter decomposition rates for Swiss forests. Biogeochemistry70, 299–313. 10.1007/s10533-003-0844-5
28
Heuck C. Spohn M. (2016). Carbon, nitrogen and phosphorus net mineralization in organic horizons of temperate forests: stoichiometry and relations to organic matter quality. Biogeochemistry131, 229–242. 10.1007/s10533-016-0276-7
29
Hömberg A. Matzner E. (2018). Effects of drying and rewetting on soluble phosphorus and nitrogen in forest floors: an experiment with undisturbed columns. J. Plant Nutr. Soil Sci.181, 177–184. 10.1002/jpln.201700380
30
Kaiser K. Guggenberger G. (2000). The role of DOM sorption to mineral surfaces in the preservation of organic matter in soils. Organ. Geochem.31, 711–725. 10.1016/S0146-6380(00)00046-2
31
Kaiser K. Guggenberger G. Haumaier L. (2003). Organic phosphorus in soil water under a European beech (Fagus sylvatica L.) stand in northeastern Bavaria, Germany: seasonal variability and changes with soil depth. Biogeochemistry66, 287–310. 10.1023/B:BIOG.0000005325.86131.5f
32
Kaiser K. Kalbitz K. (2012). Cycling downwards—dissolved organic matter in soils. Soil Biol. Biochem.52, 29–32. 10.1016/j.soilbio.2012.04.002
33
Kaiser K. Zech W. (1997). Competitive sorption of dissolved organic matter fractions to soils and related mineral phases. Soil Sci. Soc. Am. J.61, 64–69. 10.2136/sssaj1997.03615995006100010011x
34
Kleber M. Eusterhues K. Keiluweit M. Mikutta C. Mikutta R. Nico P. S. (2015). Mineral–organic associations: formation, properties, and relevance in soil environments. Adv. Agronomy130, 1–140. 10.1016/bs.agron.2014.10.005
35
Lang F. Krüger J. Amelung W. Willbold S. Frossard E. Bünemann E. K. et al . (2017). Soil phosphorus supply controls P nutrition strategies of beech forest ecosystems in Central Europe. Biogeochemistry136, 5–29. 10.1007/s10533-017-0375-0
36
Lilienfein J. Qualls R. G. Uselman S. M. Bridgham S. D. (2004). Adsorption of dissolved organic and inorganic phosphorus in soils of a weathering chronosequence. Soil Sci. Soc. Am. J.68, 620–628. 10.2136/sssaj2004.6200
37
Manzoni S. Jackson R. B. Trofymow J. A. Porporato A. (2008). The global stoichiometry of litter nitrogen mineralization. Science321, 684–687. 10.1126/science.1159792
38
Manzoni S. Trofymow J. A. Jackson R. B. Porporato A. (2010). Stoichiometric controls on carbon, nitrogen, and phosphorus dynamics in decomposing litter. Ecol. Monogr.80, 89–106. 10.1890/09-0179.1
39
Marklein A. R. Winbourne J. B. Enders S. K. Gonzalez D. J. X. van Huysen T. L. Izquierdo J. E. et al . (2016). Mineralization ratios of nitrogen and phosphorus from decomposing litter in temperate versus tropical forests. Glob. Ecol. Biogeogr.25, 335–346. 10.1111/geb.12414
40
Michalzik B. Kalbitz K. Park J. Solinger S. Matzner E. (2001). Fluxes and concentrations of dissolved organic carbon and nitrogen—a synthesis for temperate forests. Biogeochemistry52, 173–205. 10.1023/A:1006441620810
41
Michalzik B. Matzner E. (1999). Dynamics of dissolved organic nitrogen and carbon in a Central European Norway spruce ecosystem. Eur. J. Soil Sci.50, 579–590. 10.1046/j.1365-2389.1999.00267.x
42
Mooshammer M. Hofhansl F. Frank A. H. Wanek W. Hämmerle I. Leitner S. et al . (2017). Decoupling of microbial carbon, nitrogen, and phosphorus cycling in response to extreme temperature events. Sci. Adv.3:e1602781. 10.1126/sciadv.1602781
43
Mooshammer M. Wanek W. Zechmeister-Boltenstern S. Richter A. (2014). Stoichiometric imbalances between terrestrial decomposer communities and their resources: mechanisms and implications of microbial adaptations to their resources. Front. Microbiol.5:22. 10.3389/fmicb.2014.00022
44
Murphy J. Riley J. (1962). A modified single solution method for the determination of phosphate in natural waters. Anal. Chim. Acta27, 31–36. 10.1016/S0003-2670(00)88444-5
45
Neff J. C. Chapin F. S. Vitousek P. M. (2003). Breaks in the cycle: dissolved organic nitrogen in terrestrial ecosystems. Front. Ecol. Environ.1, 205–211. 10.1890/1540-9295(2003)001[0205:BITCDO]2.0.CO;2
46
Neumann M. Ukonmaanaho L. Johnson J. Benham S. Versterdal L. Novotný R. et al . (2018). Quantifying carbon and nutrient input from litterfall in European forests using field observations and modeling. Glob. Biochem. Cycles32, 784–798. 10.1029/2017GB005825
47
Nikel P. I. Chavarría M. Martínez-García E. Taylor A. C. de Lorenzo V. (2013). Accumulation of inorganic polyphosphate enables stress endurance and catalytic vigour in Pseudomonas putida KT2440. Microb. Cell Factories12, 1–14. 10.1186/1475-2859-12-50
48
Peñuelas J. Poulter B. Sardans J. Ciais P. van der Velde M. Bopp L. et al . (2013). Human-induced nitrogen–phosphorus imbalances alter natural and managed ecosystems across the globe. Nat. Commun.4:2934. 10.1038/ncomms3934
49
Pistocchi C. Mészáros É. Tamburini F. Frossard E. Bünemann E. K. (2018). Biological processes dominate phosphorus dynamics under low phosphorus availability in organic horizons of temperate forest soils. Soil Biol. Biochem.126, 64–75. 10.1016/j.soilbio.2018.08.013
50
Qualls R. G. Haines B. L. (1991). Geochemistry of dissolved organic nutrients in water percolating through a forest ecosystem. Soil Sci. Soc. Am. J.55:1112. 10.2136/sssaj1991.03615995005500040036x
51
R Core Team (2019). R: A Language and Environment for Statistical Computing. Vienna: R Foundation for Statistical Computing. Available online at: https://www.R-project.org/
52
Rennenberg H. Dannenmann M. (2015). Nitrogen nutrition of trees in temperate forests—The significance of nitrogen availability in the pedosphere and atmosphere. Forests6, 2820–2835. 10.3390/f6082820
53
Schimel J. P. (2018). Life in dry soils: effects of drought on soil microbial communities and processes. Annu. Rev. Ecol. Evol. Syst.49, 409–432. 10.1146/annurev-ecolsys-110617-062614
54
Schimel J. P. Bennett J. B. (2004). Nitrogen mineralization: challenges of a changing paradigm. Ecology85, 591–602. 10.1890/03-8002
55
Spohn M. Widdig M. (2017). Turnover of carbon and phosphorus in the microbial biomass depending on phosphorus availability. Soil Biol. Biochem.113, 53–99. 10.1016/j.soilbio.2017.05.017
56
Spohn M. Zavišić A. Nassal P. Bergkemper F. Schulz S. Marhan S. Schloter M. Kandeler E. Polle A. (2018). Temporal variations of phosphorus uptake by soil microbial biomass and young beech trees in two forest soils with contrasting phosphorus stocks. Soil Biol. Biochem.117, 191–202. 10.1016/j.soilbio.2017.10.019
57
Stark J. M. Firestone M. K. (1995). Mechanisms for soil moisture effects on activity of nitrifying bacteria. Appl. Environ. Microbiol.61, 218–221.
58
Swain T. Hillis W. E. (1959). The phenolic constituents of Prunus domestica. I. The quantitative analysis of phenolic constituents. J. Sci. Food Agric.10, 63–68. 10.1002/jsfa.2740100110
59
Talkner U. Meiwes K. J. Potočić N. Seletković I. Cools N. De Vos B. et al . (2015). Phosphorus nutrition of beech (Fagus sylvatica L.) is decreasing in Europe. Ann. Forest Sci.72, 919–928. 10.1007/s13595-015-0459-8
60
Turner B. L. Condron L. M. Richardson S. J. Peltzer D. A. Allison V. J. (2007). Soil organic phosphorus transformations during pedogenesis. Ecosystems10, 1166–1181. 10.1007/s10021-007-9086-z
61
Uhlig D. von Blanckenburg F. (2019). How slow rock weathering balances nutrient loss during fast forest floor turnover in montane, temperate forest ecosystems. Front. Earth Sci.7:159. 10.3389/feart.2019.00159
62
Vitousek P. M. Howarth R. W. (1991). Nitrogen limitation on land and in the sea: how can it occur?Biogeochemistry13, 87–115. 10.1007/BF00002772
63
Walker T. W. Syers J. K. (1976). The fate of phosphorus during pedogenesis. Geoderma15, 1–19. 10.1016/0016-7061(76)90066-5
64
Wollum A. G. Gomez J. E. (1970). A conductivity method for measuring microbiallly evolved carbon dioxide. Ecology51, 155–156. 10.2307/1933610
65
Xu X. Thornton P. E. Post W. M. (2013). A global analysis of soil microbial biomass carbon, nitrogen and phosphorus in terrestrial ecosystems. Glob. Ecol. Biogeogr.22, 737–749. 10.1111/geb.12029
66
Zederer D. P. Talkner U. Spohn M. Joergensen R. G. (2017). Microbial biomass phosphorus and C/N/P stoichiometry in forest floor and A horizons as affected by tree species. Soil Biol. Biochem.111, 166–175. 10.1016/j.soilbio.2017.04.009
67
Zhang J. Elser J. J. (2017). Carbon:nitrogen:phosphorus stoichiometry in fungi: a meta-analysis. Front. Microbiol.8, 1–9. 10.3389/fmicb.2017.01281
Summary
Keywords
drying-rewetting, dissolved organic matter, immobilization, mineralization, nutrient availability, stoichiometry, sorption, temperate beech forest
Citation
Brödlin D, Kaiser K and Hagedorn F (2019) Divergent Patterns of Carbon, Nitrogen, and Phosphorus Mobilization in Forest Soils. Front. For. Glob. Change 2:66. doi: 10.3389/ffgc.2019.00066
Received
12 July 2019
Accepted
11 October 2019
Published
31 October 2019
Volume
2 - 2019
Edited by
Nicolas Fanin, INRA Centre Bordeaux-Aquitaine, France
Reviewed by
Alexander Guhr, University of Bayreuth, Germany; Kazumichi Fujii, Forestry and Forest Products Research Institute, Japan
Updates
Copyright
© 2019 Brödlin, Kaiser and Hagedorn.
This is an open-access article distributed under the terms of the Creative Commons Attribution License (CC BY). The use, distribution or reproduction in other forums is permitted, provided the original author(s) and the copyright owner(s) are credited and that the original publication in this journal is cited, in accordance with accepted academic practice. No use, distribution or reproduction is permitted which does not comply with these terms.
*Correspondence: Frank Hagedorn frank.hagedorn@wsl.ch
This article was submitted to Forest Soils, a section of the journal Frontiers in Forests and Global Change
Disclaimer
All claims expressed in this article are solely those of the authors and do not necessarily represent those of their affiliated organizations, or those of the publisher, the editors and the reviewers. Any product that may be evaluated in this article or claim that may be made by its manufacturer is not guaranteed or endorsed by the publisher.