 Julia Drewer1*
 Jun Zhao2
 Melissa M. Leduning3Peter E. Levy1
 Justin Sentian3
 Cécile Gubry-Rangin2
 Ute M. Skiba1
- 1UK Centre for Ecology and Hydrology, Bush Estate, Penicuik, United Kingdom
- 2School of Biological Sciences, University of Aberdeen, Aberdeen, United Kingdom
- 3Faculty of Science and Natural Resources, Universiti Malaysia Sabah, Jalan UMS, Kota Kinabalu, Malaysia
Current understanding of greenhouse gas (GHG) fluxes associated with land-use change from forest to oil palm on mineral soil is not sufficient to provide reliable estimates of emission rates or advice on GHG mitigation strategies. Monocultures of oil palm have expanded in Southeast Asia, mostly replacing tropical forests. The limited data available have indicated that the land-use conversion is associated with a potentially aggravated GHG burden, including nitrous oxide (N2O) and nitric oxide (NO) emissions, with unclear underlying biological mechanisms. In this study, we investigated N2O and NO emission potentials of tropical soils with different land-uses from Sabah, Malaysian Borneo, under laboratory incubation. Under similar controlled conditions, logged forest and oil palm soils showed high and similar potentials of N2O and NO emissions following increase in soil moisture, while the emissions were negligible in a riparian reserve soil irrespective of moisture conditions. Soil N2O and NO emission rates from logged forest soils and oil palm (OP) plantations were of similar magnitude, with average fluxes over the 35 and 22 day incubation periods, respectively, of 11.5 and 1.6 ng N g−1 h−1 (OP) and 15.6 and 6.0 ng N g−1 h−1 (logged forest). Contrarily, the riparian reserve soil did not respond to rewetting and nitrogen application and fluxes were negligible. Furthermore, N2O fluxes were on average about 10 times higher than NO fluxes. The fact that forest soils also have the potential to emit large amounts of N2O and NO, has important implications for land-use change scenarios in the tropics, especially as some scenarios suggest atmospheric N deposition is likely to drastically increase in tropical regions due to biomass burning, increased N-fertilizer use and fossil fuel consumption. Quantification of related gene transcripts implied that Proteobacterial nirS and AniA-nirK (betaproteobacterial clade of Neisseria) containing denitrifiers might continuously contribute to the N2O emissions, while the nitrifiers (ammonia oxidizing archaea in this study) are conditionally active to produce N2O. This study therefore provides some evidence for N2O and NO emissions associated with phylogenetically diverse groups of microorganisms, which might be of importance in modulating the GHG emissions under different land-uses and field conditions.
Introduction
Increasing expansion of secondary forests, plantation mosaics and other human-modified habitats has changed the tropical landscape, which was once dominated by primary forests in Southeast Asia, and this might consequently jeopardize ecosystem service provision at local, regional, and global scales. For example, deforestation for oil palm (OP) agriculture, due to its high profitability, has become one of the world's most rapidly expanding cropping trend in tropical areas (Dislich et al., 2017). Asia-Pacific palm oil and forestry products each accounted for around a third of the embodied deforestation (Pendrill et al., 2019). As tropical forests represent a crucial ecosystem for global carbon (C) and nitrogen (N) cycles (Galloway et al., 2004; Bonan, 2008; Hedin et al., 2009), a better understanding of the effect of land-use conversion (from deforestation to oil palm plantation) on the key biogeochemical processes, including greenhouse gas (GHG) emissions, is required. Particularly, the fertilization regime for oil palm growth can result in low N use efficiency, resulting in common over-use of chemical fertilizers (Drewer et al., 2018). High levels of ammonium () and nitrate (NO3−) fertilizers associated with oil palm agriculture will potentially increase nitrous oxide (N2O) and nitric oxide (NO) emissions over time (Fowler et al., 2011), and modify the community structure of associated key soil microorganisms which play a central role in the N cycle, e.g., nitrifiers and denitrifiers.
N2O has a much larger global warming potential than carbon dioxide (CO2); 298 times larger on a 100-year time horizon (Myhre et al., 2013). Nitric oxide (NO) plays a major role in the formation of tropospheric ozone (O3) which in itself is an important GHG (Lammel and Graßl, 1995). Tropical forest soils are known to be major sources of N2O and NO (Werner et al., 2007; Liu et al., 2016), but relatively little is known of the impact of land-use and land-use-change on their fluxes and associated soil microbial communities in the tropics. These knowledge gaps make it difficult for tropical countries to determine their annual GHG emission inventories and develop effective mitigation strategies. The need to study GHG fluxes from forests and land converted from forests to agricultural use has been recognized (Van Lent et al., 2015). Due to growing concern of converting peatland to plantations and the associated negative environmental impacts due to soil subsidence and fires (nutrient depletion, soil erosion, destabilization of soil structure), increasingly plantations are established on mineral soil (Shanmugam et al., 2018). Much more attention has been given to studying carbon fluxes and storage from peatlands (Germer and Sauerborn, 2008; Hassler et al., 2015). Recent reviews of the non-CO2 GHG emissions from tropical forests and their conversion to agricultural and plantation crops, especially from Malaysia, is distinctively lacking (Van Lent et al., 2015; Shanmugam et al., 2018). There are insufficient number of studies of N2O emissions from mineral soils to draw firm conclusions of the increase of N2O emissions after land-use change from secondary forest to oil palm plantations (and also other plantations). The only field study including NO emissions as well as N2O emissions was carried out in Sumatra, Indonesia (Hassler et al., 2017).
In terrestrial systems, heterotrophic denitrification and nitrification-related pathways are the primary sources of N2O and NO production (Hu et al., 2015; Medinets et al., 2015). Soil denitrifiers, whose activity is dependent of different oxygen levels, can incompletely reduce nitrate (NO3−) and nitrite (NO2−) through nitrite reductase (encoded by nirK or nirS genes) to NO, which can be further reduced by nitric oxide reductase to N2O as an end-product. Under limited oxygen conditions, N2O can be catalyzed to N2 by nosZ gene encoding the nitrous oxide reductase, responsible for mitigation of a large amount of N2O produced from deeper soil layers (Clough et al., 2005). The abundance and expression of nirS, nirK, and nosZ genes are commonly used to indicate the denitrification-derived N2O emissions in soils (Morales et al., 2010; Dandie et al., 2011; Krause et al., 2017). However, these studies usually used conventional primers targeting only Proteobacterial nir genes, which ignored highly diversified denitrifier communities from other bacterial phyla such as Nitrospirae, Actinobacteria and Firmicutes as well as archaeal and eukaryotic denitrifiers (Graf et al., 2014). Recent phylogenetic analysis also revealed novel clade II nosZ distinct to typical clade I nosZ denitrifiers, which might be responsible for an unaccounted N2O sink in soils (Sanford et al., 2012; Jones et al., 2013). Nitrification-related N2O and NO are mainly emitted by ammonia oxidizers in soils, including ammonia oxidizing archaea (AOA) and bacteria (AOB) (Bollmann and Conrad, 1998; Hink et al., 2017, 2018) and potentially by recently discovered complete ammonia oxidizers (comammox) (Kits et al., 2019). The relative contribution of denitrifiers and nitrifiers to N2O and NO emissions varies in different ecosystems and largely depends on environmental conditions. Soil moisture is considered a critical factor determining the relative activity of denitrification and nitrification. It was observed that under 60% water-filled pore space (WFPS), N2O was produced mainly from nitrification due to sufficient oxygen, while more anoxic soils with higher water content could stimulate the denitrification-derived N2O (Bollmann and Conrad, 1998; Bateman and Baggs, 2005). However, the relative contribution of nitrification and denitrification to N2O emissions can be quite variable under similar WFPS conditions (Liu et al., 2016), as emissions are potentially driven by different communities of nitrifiers and/or denitrifiers in distinct land-use soils. The type of N applied and its availability are also crucial parameters influencing both the microbial activity (Hink et al., 2018) and the GHG production (Cowan et al., 2019). Indeed, high NO3− concentration favors denitrification pathways and results in N2O emissions (Wang et al., 2013). There is also evidence that AOA prefer ammonium coming from mineralization of organic N, while AOB growth is preferential under high levels of inorganic ammonium supply (Di et al., 2009; Verhamme et al., 2011; Levičnik-Höfferle et al., 2012). In addition, N2O yield (ratio of N2O to consumed) is higher in AOB than AOA (Hink et al., 2017, 2018), resulting in different amounts of N2O emission under various fertilization strategies. It is therefore important to predict and identify the biological production of N2O and NO emissions in tropical soils of different land uses, particularly with different soil moisture and nitrogen supply conditions. This can be achieved by targeting the activity of diverse groups of denitrifiers and nitrifiers using clade specific primers, in order to gain a comprehensive understanding of their activity and potential contributions to the GHG emissions.
To fill these knowledge gaps, we have carried out laboratory studies to investigate the soil N2O and NO emission potentials and their underlying microbial processes in tropical forests and nearby oil palm plantations of different ages and a riparian reserve in Malaysian Borneo, Sabah within the Stability of Altered Forest Ecosystems (SAFE) project landscape (Ewers et al., 2011).
The specific objectives of the laboratory study were to investigate:
1) The impact of simulated rainfall events on dry soil on rates of N2O and NO fluxes from logged tropical forest, riparian reserve, and oil palm plantation soil;
2) The N fertilization effects on soil N2O and NO fluxes from oil palm and riparian soils.
3) The role of nitrifiers and denitrifiers in the production of N2O and NO in the different land-use systems and under different N rates and moisture conditions.
Materials and Methods
Site Description
This study was carried out within the Stability of Altered Forest Ecosystems (SAFE) project in Malaysian Borneo (4°49′N, 116°54′E). The SAFE project was set up in Sabah in 2011 in a secondary forest area designated by the Malaysian government for conversion to plantations for palm oil production (4°49′N, 116°54′E). It is a long-term landscape-scale experiment designed to study the effects of anthropogenic activity related to deforestation and oil palm agriculture on the ecosystem as a whole (Ewers et al., 2011). The soils at SAFE are classed as orthic Acrisols or Ultisols (Riutta et al., 2018). The climate in Malaysian Borneo is wet tropical with a typical wet season from November to March and a dry season from April to October. Average monthly temperatures of 32.5°C and average monthly rainfall was 164.1 mm (climate-data.org, 2019). At SAFE, the mean monthly rainfall during the 2 years of study period (2015 and 2016) was 190 mm (Walsh, unpublished data). Annual rainfall was 1,927 mm in 2015 and 2,644 mm in 2016.
For this study, we have selected logged forest soils from two different locations, two oil palm plantations of different ages, and a riparian area. All sites were within a 15 km radius. Soils were collected in November 2016, at the end of 2 years of in situ soil GHG flux measurements (Drewer et al., 2019a). At the start of the in situ measurements, we selected a young plantation, around 2 years old at the time we started the project (OP2) and another young to medium aged oil palm plantation, around 7 years old at the start of the project (OP7). So effectively, the plantations were 4 and 9 years old when the soils were collected for this study. However, for consistency with other publications in preparation, we will refer to these plantations as OP2 and OP7. The riparian area was adjacent and down slope from OP7. The general oil palm management was application of 2 kg N per palm three times per year in form of ammonium sulfate.
Experimental Setup
Soil was collected in November 2016 from the top 10 cm at randomized locations at each site and collected as a bulk sample, after brushing away any loose organic matter (leaf litter, twigs), of the logged forest, oil palm plantations, and riparian reserve. The soil was air-dried in the laboratory, then passed through a 2 mm sieve to remove large stones and twigs, and transported by air to the UK Center for Ecology and Hydrology, Edinburgh, Scotland, where the experiments were conducted following a similar protocol of previously published studies on dried, sieved and re-packed soil (Dick et al., 2001, 2006; Sanchez-Martin et al., 2010). It was not possible to conduct these experiments on fresh soil as these sites were very remote without permanent electricity and soils could not be kept cool after sampling. We carried out two experiments. Experiment 1 comprised oil palm soil from two oil palm plantations OP2 and OP7, and Experiment 2 incorporated logged forest soil from sites E and LFE. The common soil used in both experiments was from the riparian reserve (RR) adjacent to OP7. Details of the soil bulk density and pH values as well as total C and N of these sites are shown in Table 1. For the two experiments, 170 g of dry soil was placed into 5 cm diameter Perspex tubes (each land-use in triplicate), packed to approximately field bulk density and incubated at 25°C. An ammonium nitrate (NH4NO3) solution was applied to simulate rainfall (5 kg N ha−1 y−1, J. Sentian pers.com.) to both experiments: Experiment 1: oil palm (OP2, OP7) and riparian reserve (RR) (objective 1) and Experiment 2: logged forest (LFE, E,) and riparian reserve (RR) (objective 1). In Experiment 1, 14 days after the addition of the low N dose, a second dose of NH4NO3 solution was added to simulate a typical N fertilization rate of 50 kg N ha−1 y−1 to OP2, OP7, and RR (objective 2). The soil was left to dry naturally over time (Figure 1). Cores were reweighed daily to monitor weight loss as a proxy for changes in soil moisture. The conversion from weight loss to soil moisture throughout the study period was inferred from the moisture content measured at the start and end of the incubation period. For Experiment 1 (oil palm soil), fluxes of NO, N2O, CH4, CO2 were measured on days 0, 1, 2, 4, 7, 11, 14, 15, 16, 18, 21, 24, 36 with the fertilization event on day 14. For Experiment 2 (forest soil), fluxes were measured on days 0, 1, 3, 6, 7, 8, 9, 15, 17, 22. Soil mineral N concentrations (, ) and samples for microbial analysis were taken from separate cores treated identically to the cores used for flux measurements, in order not to disturb the soil profile of the flux cores. Subsamples were taken from identical “clone” cores for pH, KCl extractable N (, ) and microbial analysis and stored at −20 and −80°C, respectively.
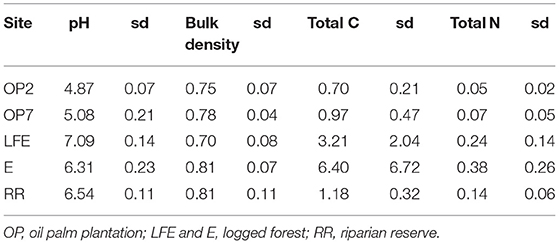
Table 1. Soil properties from soil taken from the top 10 cm including mean pH, bulk density (g cm−3), total Carbon (C) and total Nitrogen (N) in %, sd is standard deviation of n = 3.
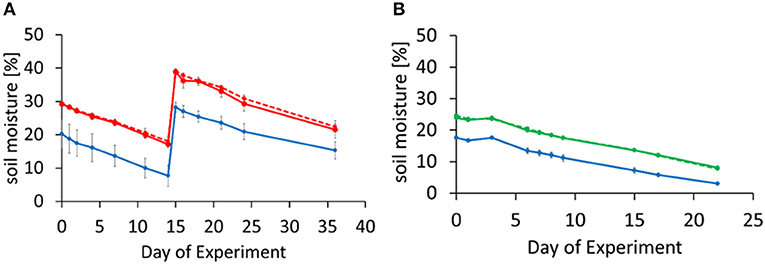
Figure 1. Temporal change in volumetric soil moisture during the incubation for Experiment 1 (A) and Experiment 2 (B). Soils were rewetted at day-0 (for all soils in both experiments) and day-14 [for oil palm and riparian reserve soils in Experiment 1 (A)] and the moisture decreased with time. Error bars represent standard deviation of means from triplicate incubations. (A) OP2, 2 year old oil palm plantation (solid red circles, solid red line), OP7, 7 year old oil palm plantation (solid red circles, dashed red line); (B) LFE, logged forest (solid green circles, dashed green line), E, logged forest (solid green circles, solid green line); (A,B) RR, riparian reserve (solid blue circles, solid blue line).
All experiments were carried out at 25°C reflecting average field conditions (soil temperature) in Sabah. On the first day the applications of N were staggered, in order to observe the immediate response (~0.5 h after application) of NO and GHG (N2O, CH4, CO2) fluxes and mineral N (, ) concentrations. On all subsequent measurement days, samples for GHG analysis were collected within 1 h from all treatments and before starting with the NO flux measurements, which took between 20 and 30 min for each core.
NO and N2O Flux Measurements
Nitric oxide (NO) fluxes were measured from the soil cores using a gas flow-through system, as used in previous studies (Dick et al., 2006; Drewer et al., 2015). Ambient air, filtered through charcoal and aluminum/KMnO4 to remove O3 and NOx, was passed over the headspace of the core into the analyzers (flow rate 15 ml min−1) to measure NO by using a chemiluminescent analyzer (42C NO-NO2-NOx, Thermo Environmental Instruments Inc., Franklin, MA, USA) and O3 using a UV photometric O3 analyzer (49C Thermo Environmental Instruments Inc., Franklin, MA, USA). As the NOx and O3 analyzer each require a flow rate of 1 l min−1, filtered laboratory air, to take out NOx and O3, was added to make up the volume. The NOx and O3 analyzers were calibrated against a zero air standard before starting this study. Ozone concentrations were only measured to ensure that concentrations were sufficiently low (<4 ppb) to avoid reactions with NOx. The flow rates through the core and into the analyzer were monitored using mass flow meters (Aera FC 7700C; Advanced Energy Industries Inc., Fort Collins, CO, USA). NO and O3 concentrations, air temperature and flow rates were recorded at 10 s intervals using a 21× data logger (Campbell Scientific, Shropshire, UK). Typically, measurements from each core lasted ~20–30 min and until the NO concentration reached equilibrium. These measurements were interspersed with NO concentration measurements from empty control cores, in order to take into account reactions with chamber walls and lids. The NO flux (ng N g−1 h−1) was calculated as the product of the flow rate of the air stream through the repacked soil core, the increase in NO concentration above the control (empty core) and the dilution rate, by supplying additional air to the analyzer, divided by the soil dry weight (170 g).
GHG fluxes were always measured within 4 h of measuring the NO fluxes. The cores were sealed with a rubber bung for a period of 20 min, and air samples were extracted from the headspace at time 0, 10, and 20 min, using 10 ml syringes fitted with a luer lock. The extracted gas samples were analyzed within 4 h by gas chromatography (GC). The samples and three sets of four certified standard concentrations (N2O, CH4 in N2 with 20% O2) were analyzed using a GC (Agilent GC7890B; Agilent, Santa Clara, California) with micro electron capture detector (μECD) for N2O analysis and methanizer and flame ionization detector (FID) for CH4 and CO2 analysis. These detectors were setup in parallel, allowing the analysis of all three GHGs at the same time. The limit of detection was 5 ppb for N2O, 40 ppb for CH4 and 5 ppm for CO2. Peak integration was carried out with OpenLab© Software Suite (Agilent, Santa Clara, California). The GHG flux was calculated as the product of the increase in concentration over time and volume of the headspace in the repacked soil core, divided by the time the core was sealed and the soil dry weight.
Soil Nutrient Analysis
To determine soil mineral N (, ) content, 6 g of soil was extracted with 20 ml of 1 M KCl solution for 1 h at 100 rpm on an orbital shaker (Stuart Orbital Shaker SSL1 Barloworld Scientific Ltd.). The extract was filtered through Whatman No 42 filter paper and frozen until analysis. Concentrations of and were analyzed by colorimetric methods (Harwood and Huyser, 1970; Henriksen and Selmer-Olsen, 1970) using the SEAL AQ2 discrete analyzer. Gravimetric soil moisture contents were determined by drying approximately 10 g of soil at 105°C until constant weight, usually for 24 h. Moisture content of the individual cores was calculated from the weight difference between the wet and oven dried soils.
Bulk density was measured from samples directly taken in the field at the time of collecting the soil for the incubations. Soil samples were collected one-off using a galvanized iron ring (98.17 cm3) with a sharp edge that was inserted in the upper soil layer with a hammer to 5 cm depth without compaction. Samples were oven-dried at 105°C until constant weight (usually 48 h) and bulk density (g cm−3) was calculated based on the dry weight occupying the volume of the ring. Soil pH was measured using a MP 220 pH meter (Mettler Toledo GmbH, Schwerzenbach, Switzerland) from soil solutions of a 1:2 ratio, consisting of 10 g of soil and 20 ml of deionized water. Total C and N in soil was analyzed by high temperature combustion gas chromatography (Vario El III C/N analyzer; Elementar, Stockport, UK) using 30 mg of soil.
Soil Microbial Analysis
Even though sub-samples for microbial analysis were taken every time a flux measurement was carried out, resources were limited and we had to select a subset of samples for analysis. N2O fluxes were used as selection criterion in order to be able to determine potential processes leading to N2O emissions. For each soil (including all three replicates), five time points during incubation were used for downstream transcript-based analysis, including day-0, the time point with highest N2O emission, two intermediate time points and the incubation endpoint. Consequently, we selected samples from day-0, 1, 4, 7, and 14 for OP2 and OP7 soils, and day-0, 1, 3, 6, and 15 for RR, LFE, and E soils. Only one set of RR soils (from experiment 2) was used for microbial analysis as in both experiments fluxes from the RR soil were very low and did not show any discernible trend.
Soil RNA Extraction and cDNA Synthesis
The RNA extractions were performed using RNeasy PowerSoil Total RNA Kit (QIAGEN) from 2 g of each soil sample. The nucleic acid extracts were further treated with TURBO DNA-free™ Kit (Thermo Scientific) to eliminate DNA residuals. Reverse transcription was performed using random hexamer primers and Maxima Reverse Transcriptase (Thermo Scientific) following manufacturer recommendations. RNA without reverse transcription step was used as a negative control by PCR of target genes to ensure complete removal of genomic DNA.
Quantitative Reverse Transcription PCR
The presence of ammonia monooxygenase subunit A (both archaeal and bacterial amoA), nitrite reductase (nirS and nirK) and nitrous oxide reductase (nosZ) genes from the N2O producing and reducing microbes were tested by using specific primers targeting diverse groups of ammonia oxidizers and denitrifiers. In particular, for the nitrite reductase gene, we attempted to cover phylogenetically diverse clades (based on currently known diversity) for the quantitative analysis. To achieve this, we selected multiple clade specific primers for both nirS and nirK genes based on an in silico evaluation of different primer pairs (Bonilla-Rosso et al., 2016). Two nosZ primer pairs were used to cover both conventional clade I (Henry et al., 2006) and newly established clade II lineages. All selected primer pairs were tested using DNA extracts from soil samples, based on the theoretical melting temperature of the primers. Consequently, seven primer pairs resulting in clear target PCR fragments visualized from agarose gel electrophoresis were used for quantitative reverse transcription PCR (RT-qPCR) assay, including bacterial amoA, archaeal amoA, Proteobacteria nirS, Proteobacteria nirK, AniA-affiliated nirK, clade I, and clade II nosZ genes (Table S1).
Abundance of target gene transcripts were determined on a Mastercycler RealPlex2 (Eppendorf, Germany). Each quantitative reverse transcription PCR reaction was performed in a 20 μL mixture containing 10 μL of QuantiFastTM qPCR master mix (Qiagen, UK), 0.2 mg mL–1 bovine serum albumin (BSA), 0.6 μM of each primer and 2.5 μL of cDNA (2.5-fold diluted). The primers and cycling-parameters for archaeal and bacterial amoA genes were used as previously described (Hink et al., 2017). Transcript abundance of proteobacterial nirS was determined by primer pair NirS1F/R3cd, with following cycling-parameters: 5 min at 95°C, 40 cycles of 15 s at 95°C, 30 s at 56°C, 45 s at 72°C and a plate read after incubation for 15 s at 80°C. Proteobacterial nirK transcript abundance was quantified using primer pair Cunir3F/nirK5R and the cycling-parameters as following: 5 min at 95°C, 40 cycles of 15 s at 95°C, 30 s at 62°C, 45 s at 72°C and a plate read after incubation for 15 s at 80°C. For AniA-affiliated nirK transcript, the primers were nirKA2_4F/nirKA2_4R and the cycling-parameters were: 5 min at 95°C, 40 cycles of 15 s at 95°C, 30 s at 52°C, 45 s at 72°C and a plate read after incubation for 15 s at 80°C. The primers and cycling-parameters for quantification of clade I and clade II nosZ genes were described previously (Henry et al., 2006; Jones et al., 2013). Standard templates with dilution series containing 101-107 copies of target genes were used. For bacterial and archaeal amoA transcript quantification, standards were used as previously described (Hink et al., 2017). For nirS, nirK, and nosZ transcripts, standards were established from clone plasmids inserted with target gene fragments amplified by corresponding primers. Amplification efficiencies ranged from 82 to 98%, with R2 values >0.99. Melting curve analysis and standard agarose gel electrophoresis were always performed after each qPCR run to assess amplification specificity.
Statistical Analysis
We used linear regression to analyze the relationship between the qPCR results and the fluxes of N2O and NO. The model included the abundance of the five gene transcripts plus soil moisture, which varied as the cores dried, the effect of which we wanted to remove. We log-transformed the fluxes and the gene abundance data, as they varied over several orders of magnitude. All statistical analyses were conducted in R version 3.5.1 (R Core Team, 2017).
For each soil, one-way ANOVA was performed for comparison of transcript abundances at different time points for nirS, AniA-nirK, archaeal amoA, and clade I nosZ genes, respectively. Clade II nosZ transcript abundances were mostly lower than detection limit in soils, thus were precluded for statistical analysis.
Results
Soil Properties
The two oil palm soils were more acidic, with a pH around 5, compared to the logged forest or riparian soils, which were between pH 6.5 and 7 (Table 1). Bulk density was similar at all sites. The percentages of total C and total N were much larger in the forest soils compared to the oil palm and riparian soils. Rewetting the soils with equal volumes of water on day-0 of the respective experiments resulted in the oil palm soils reaching a volumetric soil moisture content of around 30%, forest soils around 25%, and riparian soils around 20% (Figures 1A,B). All soils dried out at the same rate.
Nitrogen Fluxes (N2O and NO)
Although we measured the three greenhouse gases nitrous oxide (N2O), methane (CH4) and carbon dioxide (CO2), we will only present the N2O results in relation to the nitric oxide (NO) fluxes and microbial analysis which links to nitrification and denitrification processes. The microbial results would not be able to explain the carbon fluxes. Methane fluxes fluctuated around zero for all land-uses with no discernible trend whilst CO2 showed an initial pulse and then decreased over time. The results for CH4 and CO2 are available in Figures S1, S2.
In Experiment 1, both oil palm soils (OP2, OP7) showed peak emissions after rewetting the soil with the equivalent of 5 kg N ha−1 as ammonium nitrate solution. Highest measured mean N2O fluxes of around 130 ng N g−1 h−1 for OP2 were measured on day-1, whilst highest N2O fluxes for OP7 were measured at day-3 with an average of 45 ng N g−1 h−1, however, the emission peak was prolonged over a few days whilst for OP2, fluxes were down to single digits after the initial pulse (Figure 2A). This was also notable in NO fluxes, where the peak for OP2 at day-3 reached a mean of 12 ng N g−1 h−1 and for OP7 only 2 ng N g−1 h−1. Generally, NO fluxes were a factor of 10 lower than N2O fluxes (Figure 2B). After the initial peak, fluxes of N2O and NO decreased substantially. Fluxes of N2O and NO from the riparian soil (RR) were barely above zero. The fertilization event on day 14 resulted in only slightly elevated N2O fluxes from the oil palm and riparian soils (15 and 20 ng N g−1 h−1), within the first 3 days after N application. The effect of applying 50 kg N ha−1 on N2O was a lot smaller than the initial re-wetting with a N concentration ten times lower. The fertilization event did not increase NO emissions from the OP and RR soils.
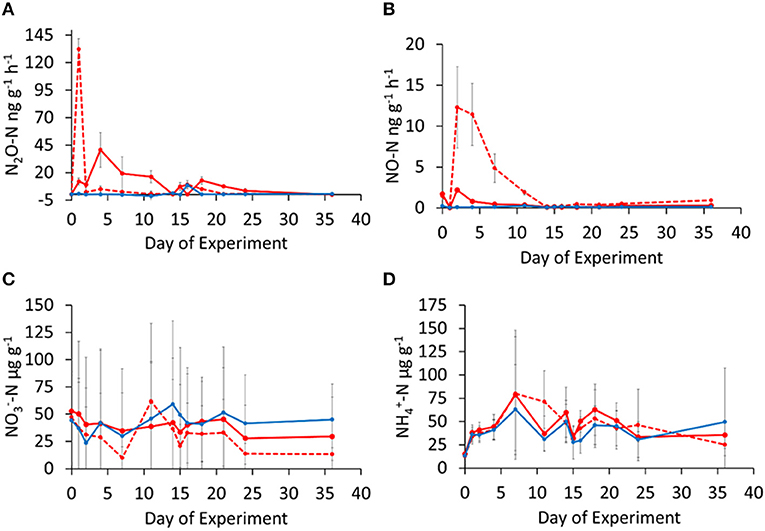
Figure 2. Temporal changes in N2O (A) and NO (B) emission rates and soil (C) and (D) concentrations in oil palm (OP2: solid red circles, solid red line and OP7: solid red circles, dashed red line) and riparian reserve (RR: solid blue circles, solid blue line) soils. Error bars represent standard deviation of means from triplicate incubations. Soils were rewetted at day-0 with N supply at 5 kg N ha−1 equivalent to field N deposition condition, and at day-14 with NH4NO3 amendment at 50 kg N ha−1 simulating a field N fertilization.
Soil mineral N concentrations in Experiment 1 did not show a discernible trend over the duration of the experiment and the standard deviation of the three replicates was high, especially for (Figure 2C). Mean values were around 50 μg -N g−1 of dry soil for oil palm and riparian soil alike. concentrations increased from around 20 μg -N g−1 of dry soil on day-0 to about 75 μg -N g−1 of dry soil on day-7 and then decreased again (Figure 2D). Standard deviation of the three replicates was, however, too large to identify differences amongst the OP and RR soils.
In Experiment 2, comparing logged forest soils (LFE, E) with riparian (RR) soil, N2O fluxes also peaked on day-1 at a mean of 95 ng N g−1 h−1 for LFE and 145 for E, whilst fluxes from the riparian soil were barely above zero (Figure 3A). Similar to experiment 1, NO fluxes were about a factor of 10 smaller and peaked slightly later (day-4) with 25 ng N g−1 h−1 for LFE and 5 ng N g−1 h−1 for E (Figure 3B). Again, fluxes from the riparian soil (RR) were barely above zero for the entire duration of the experiment. Mineral N concentrations were higher than from the oil palm soil, increased from around 100–300 μg N g−1 of dry soil with no discernible difference between forest and riparian soil (Figure 3C), increased from about 50–200 μg N g−1 of dry soil on day-9, again with high variability within the three replicates of each land-use (Figure 3D).
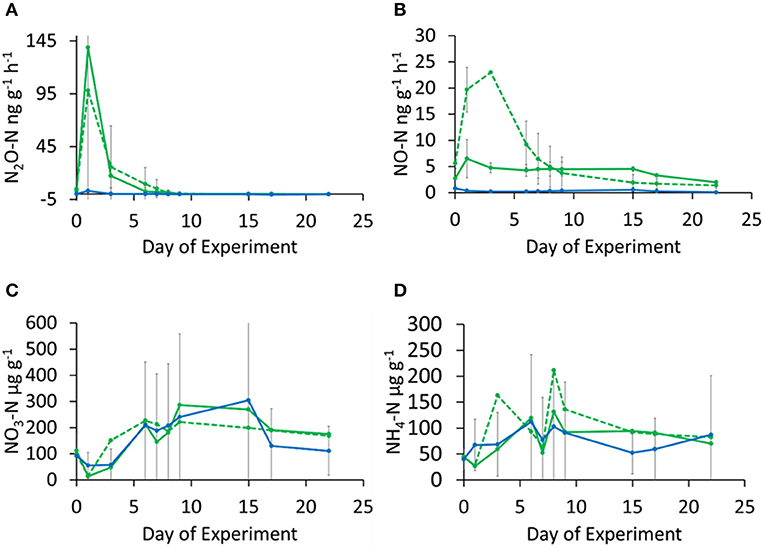
Figure 3. Temporal changes in N2O (A) and NO (B) emission rates and soil (C) and (D) concentrations in logged forest (LFE: solid green circles, dashed green line and E: solid green circles, solid green line) and riparian reserve (RR: solid blue circles, solid blue line) soils. Error bars represent standard deviation of means from triplicate incubations. Soils were rewetted at day-0 with N supply at 5 kg N ha−1 equivalent to field N deposition condition.
Abundance of the Gene Transcripts
The transcript abundances of genes related to N2O production and reduction were quantified over time to identify the potential pathways and organisms responsible for NO and N2O emission during the incubation. Gene transcript abundances (Table 2) are displayed as mean values of three replicates per soil and date along with their standard error, which was usually quite high. The proteobacterial nirS transcripts were continuously detected but displayed no significant changes throughout the incubation in most of the soils, except for the OP2 soil where the transcript abundance was highest at day-7. The expression of denitrifier nirK genes was not detected throughout incubation in any of the soils by conventional primers targeting mainly Proteobacteria clades. Surprisingly, the transcripts of AniA-nirK gene, which encodes copper-containing nitrite reductase from the Neisseria betaproteobacterial clade, were detected abundantly in all soils using the newly developed primers specific to this clade. In most soils, however, the transcript abundance did not change significantly during incubation, except for logged forest E soil. Notably, despite large variability among replicates, AniA-nirK transcript abundance in OP2 soil was highest during the earliest period of incubation (day 1–4), which was consistent with the pulse of N2O emission. In addition, the transcript abundance in LFE soil peaked at day-1 and then sharply decreased, displaying a similar trend to the N2O emissions. For ammonia oxidizers, archaeal amoA transcripts were below detection limit in OP7 and E soils during the earliest period of incubation (day 0–4), but highly increased after 7 days of incubation (p < 0.05 for OP7). Additionally, archaeal amoA transcripts were only detected in LFE soils between days 3 and 6, indicating stimulation of archaeal ammonia oxidation during this period. However, their transcripts were not detected in OP2 and RR soils throughout the incubation time, implying either absence or very low AOA activity. Similarly, the bacterial amoA transcript abundances were below detection limit in all soils, suggesting absence of bacterial ammonia oxidation activity in these soils under such conditions. Low abundance of clade I and II nosZ transcripts were detected in a few time points in several soils, although genes from clade I were more frequently transcribed than clade II. Interestingly, expression of clade I nosZ genes was detected in RR, LFE and OP2 soils at day-1 when the N2O emissions were highest. This suggested that the balance between N2O emission and reduction is toward the net production in such experimental design under aerobic conditions.
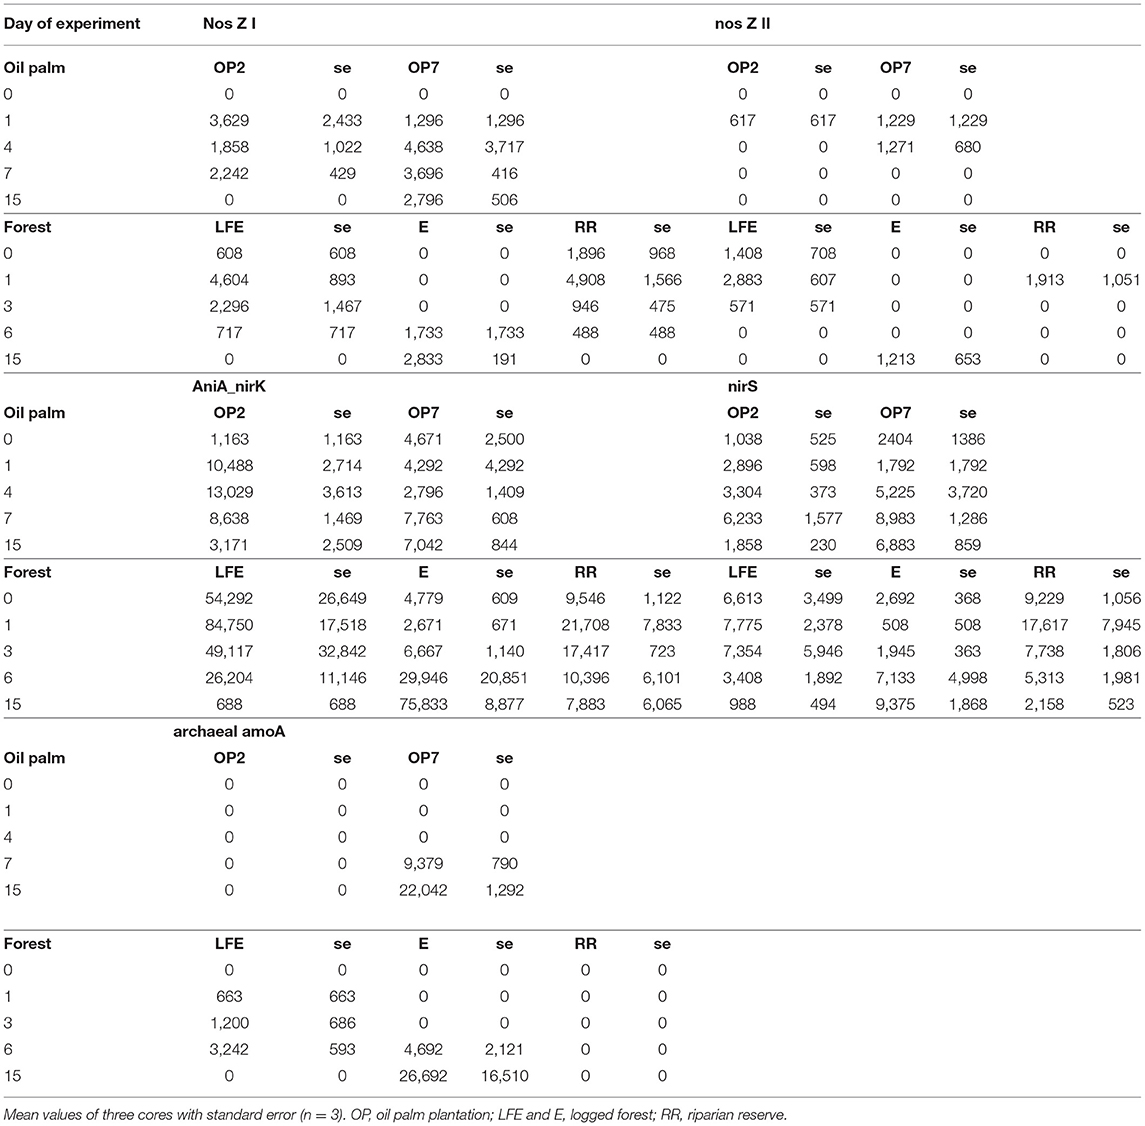
Table 2. Mean gene transcript abundance from selected days of the incubation experiments with oil palm and forest soil from Sabah.
Statistical Analysis
Based on the adjusted r2, the linear model explained 48% of the variation in the log N2O flux. N2O flux increased with AniA-nirK and nosZ-I genes, as well as soil moisture (p < 0.03), and decreased with the Proteobacteria-nirS gene. The effects of archaeal-amoA and nosZ-II were inconsistent. The residual standard error was 1.7 on 18 degrees of freedom. Applying the same model to fluxes of NO showed no consistent effects of any variable. Figures 4, 5 show the N2O and NO data plotted, respectively, with lines fitted with separate slopes and intercepts for each gene in each land-use type. This shows some differences across land-use types, but the sample size in these combinations is too small to draw strong conclusions.
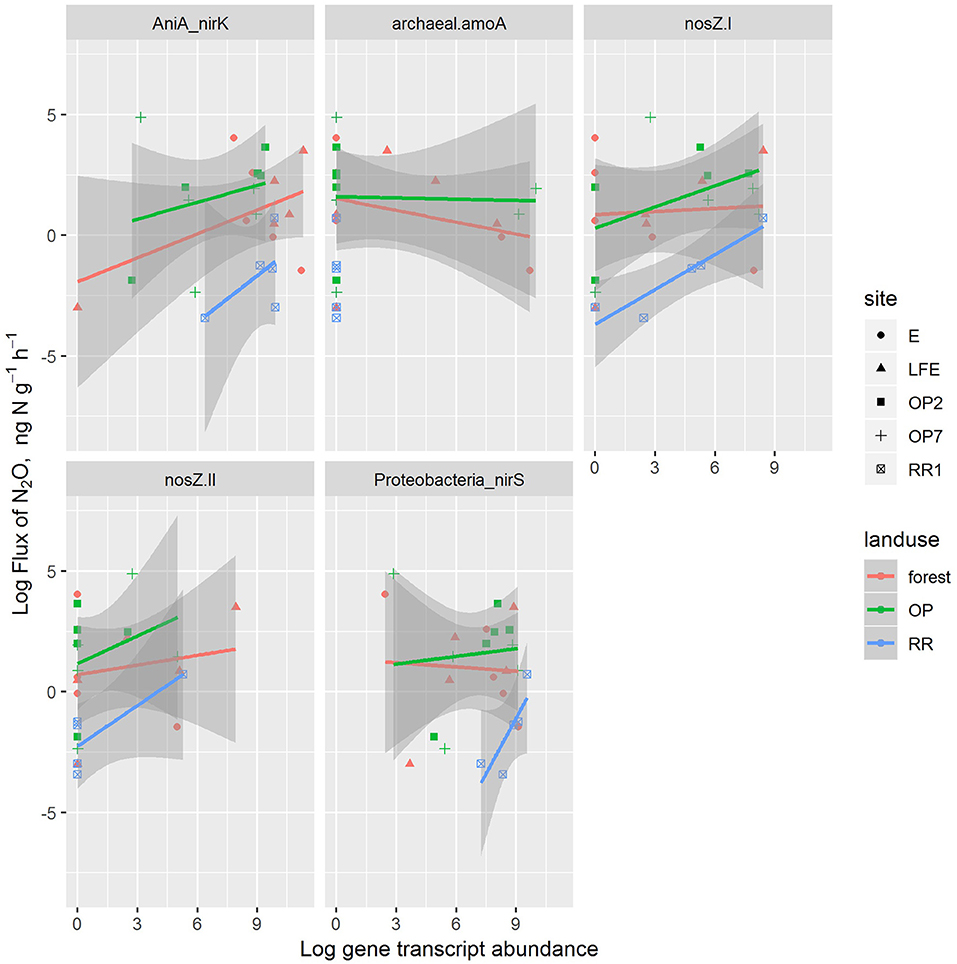
Figure 4. The correlations between N2O fluxes with and transcript abundances of denitrifier and nitrifier genes in different land-use soils [red: oil palm (OP), green: logged forest (forest), blue: riparian reserve (RR)]. For site identification, E and LFE are logged forest, OP2 and OP7 are oil palm plantations and RR1 is riparian soil.
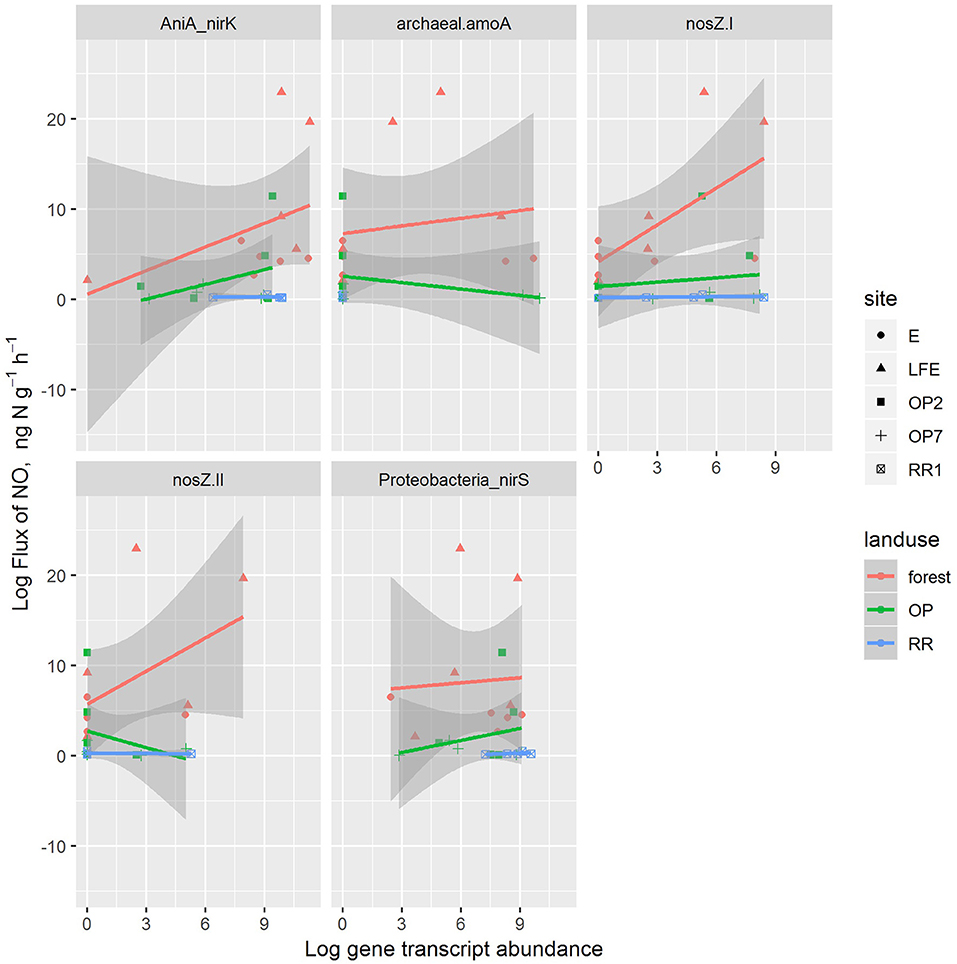
Figure 5. The correlations between NO fluxes with and transcript abundances of denitrifier and nitrifier genes in different land-use soils [red: oil palm (OP), green: logged forest (forest), blue: riparian reserve (RR)]. For site identification, E and LFE are logged forest, OP2 and OP7 are oil palm plantations and RR1 is riparian soil.
Discussion
N2O and No Fluxes
This experiment was designed to identify the emission potential of N2O and NO, with focus on the important drivers of microbial nitrification and denitrification rates, soil moisture and nitrogen additions. The focus of this study lies on potential emissions as a result of the pulsing effect and N fertilizer additions. The pulsing effect, also known as the Birch effect, is the burst of soil microbial activity after rewetting dry soil. The onset of a rain event re-activates dormant microorganisms and stimulates soil organic matter turnover, fueled by nutrient accumulation from the drought-induced death of microorganisms and fine roots (Borken and Matzner, 2009). In our study, the pulsing effect significantly stimulated N2O and NO emissions for both, the forest and oil palm soil. Drying and sieving soil can cause loss of aggregate structure, which could affect the denitrification rate (i.e., can increase the capacity to denitrify nitrate) or nitrate ammonification by reducing the overall abundance of anaerobic microsites in the soil (Patten et al., 1980; Sexstone et al., 1985). Consequently, the nitrous oxide fluxes observed in our experiment may be conservative, because they represent the lower limit of what is possible. Interestingly, the magnitudes of N2O and NO fluxes were very similar for the oil palm and forest soils. In fact, the highest fluxes were measured from the forest soil and not the oil palm as might have been expected from field measurements (Drewer et al., 2019a). As the incubations were carried out in a controlled environment, we conclude that soils of both land-uses (logged forest and oil palm plantation) have the same potential for N2O and NO emissions. The forest soils had much larger total C and N concentrations compared to the oil palm soils (Table 1). The wet and warm climate of tropical forests is conducive to fast mineralization rates of organic matter, and consequently large sources of N2O emissions. Not surprisingly, tropical forests are the largest natural source of N2O (Zhang et al., 2019). The riparian soil did not respond to wetting and added nitrogen with increased fluxes of either N2O or NO. In both sets of experiments, which included the riparian soil as the common soil, the riparian soil did not respond to wetting or nitrogen addition through increased N2O or NO fluxes. Only a small N2O peak was measured after addition of 50 kg N ha–1 and such low N2O fluxes may be due to complete denitrification to N2, but this could not be tested in our study. The oil palm plantations sampled for this study were still quite immature. In this area in Sabah, the soil was terraced before planting which is adding another level of disturbance to the soil after logging. Especially in the very young plantation (OP2) the soil was still very disturbed at the time of sampling and had no visible layer of organic matter yet. The slightly older OP7 plantation had a small visible layer of organic matter in the top soil but a lot less than the logged forest soil.
Field measurements of soil N2O emissions, using static chambers at the same locations where the soil for the incubations was taken from, also showed occasional high N2O emissions from the logged forest, however, usually fluxes were higher from oil palm and riparian reserve than logged forests (Drewer et al., 2019a). However, it is difficult to compare actual magnitudes of fluxes due to the nature of artificial conditions in the laboratory incubation with small amounts of soil only. The only other study in southeast Asia that reported both N2O and NO fluxes from oil palm plantations in Indonesia, also reported higher N2O than NO fluxes, but with varying ratios from 3 to 10 (Hassler et al., 2017), of which our study would be at the high end. Their reported study was carried out in the field whilst ours was carried out under controlled conditions in the laboratory, preventing direct comparison. Spatial variability in the field was also quite high as typical for this kind of studies. Our measured N2O fluxes from the logged forest soil after the relatively short-lived rewetting pulse (<1 week) were in the range of 2-200 μg m−2 h−1 (when converting units using the diameter of the packed soil cores as surface area) and therefore not dissimilar to other reported field studies from tropical forests summarized by Castaldi et al. (2013) with 10–85 μg m−2 h−1. This strengthens the fact that the forest soils from Sabah used in our study have the potential to emit substantial amounts of N2O under certain conditions. Forest soil and oil palm soil showed similar trends under the same conditions. In contrast, the riparian soil did not show elevated emissions (of NO or N2O) after rewetting and N application. This could not be explained by any other measured parameters such as soil properties, mineral N availability and microbial activity (see below). Currently there is a distinct lack of N2O measurements from riparian areas (Luke et al., 2019) and more research is needed to understand these processes.
Diversity and Activity of Denitrifiers
Our study tested multiple primer pairs covering phylogenetically diverse denitrifier clades to provide a comprehensive evaluation of potential activities of denitrifiers, including archaea and eukaryotes, which were overlooked from most previous studies using conventional Proteobacteria nirS and nirK primers. After testing different primers DNA samples from our soils, we detected the presence of Proteobacteria and AniA-related denitrifiers, which potentially contributed to the NO and N2O emission in the soils. The proteobacterial nirS genes were transcribed throughout the incubation, while conventional proteobacterial nirK transcripts were undetected, although a DNA-based approach demonstrated presence of nirK genes in 4 of the soils (based on standard PCR with gel electrophoresis, data not shown). Therefore, despite being present, the nirK-containing denitrifiers were not active under these incubation conditions. This is in accordance with previous studies, where stimulation of nirK-containing microbes only occurred following amendment of carbon substrates such as leaf residues (Liu et al., 2010; Wertz et al., 2016), while nirS transcripts were always detected irrespective of nutrient conditions. This suggests that the activity of nirK-containing denitrifiers is conditional and likely limited by carbon sources while nirS-containing denitrifiers may play a ubiquitous role in the N2O production under different environments and conditions. The transcripts of Neisseria-affiliated nirK gene (AniA-nirK gene) were abundantly detected in all soils, with highest level of transcription in OP2 and LFE soils when N2O emission reached a peak (Figure 4), resulting in a positive correlation between AniA-nirK transcription and soil N2O emissions (Figure 5). AniA-nirK gene encodes an outer membrane lipoprotein with significant homology to the copper-containing nitrite reductases (Mellies et al., 1997). Despite being classified as Proteobacteria, phylogeny of AniA-nirK genes placed Neisseria as a distant outgroup from conventional clades of nirK-containing proteobacteria (Sharma et al., 2005; Graf et al., 2014; Wertz et al., 2016), suggesting that the physiology of Neisseria as denitrifiers might be distinct from other nirK-containing proteobacteria. The role of Neisseria to N2O production has not been identified in many ecosystems (including soils), but their denitrification activities were confirmed in pure isolate, with aerobic denitrification being an alternative pathway possibly enhancing the growth of pathogen Neisseria meningitides (Anjum et al., 2002; Rock et al., 2005). In addition, detection of AniA-nirK transcripts in our soils suggest that this clade might be responsible for some N2O emission in soils, which has been neglected in previous studies.
Nitrification vs. Denitrification Implication in N2O Production
The rewetting of soils led to an immediate pulse of the N2O emission on day-1 of the incubation (except for OP2 for which the emission peaked at day-4). The transcriptional activity of genes related to N2O production indicated denitrification rather than ammonia oxidation as the main contributor to the N2O pulse emission. The nitrite reductase genes (AniA-nirK and nirS) were constantly transcribed throughout the incubation in all soils, indicating that the denitrification enzymes might be constitutionally expressed and rapidly activated in response to favorable condition, such as increased water content, which allows for more available substrates. Additionally, the N2O emissions after the N fertilization were lower than those after the first rewetting event (with low N supply) in oil palm soils (Figure 2), suggesting that the higher emissions were mainly attributed to sufficient water availability rather than soil inorganic N amendment after the first rewetting event. The constitutional expression of nitrite reductase genes may lead to continuous presence of denitrifiers in soils, as suggested by previous study (Liu et al., 2010), which might be activated immediately after enhanced water availability, contributing to the immediate pulse emission of NO and N2O during the incubation.
At the later period of the incubation, the amoA abundance either increased or was detected, indicating that ammonia oxidation activity might also have contributed to soil N2O emissions. As these transcripts were only stimulated at the later period of the rewetted incubation in three of the soils, a longer adaptation of these organisms to environmental condition might occur before their enzymatic activation. The relative contribution of denitrification vs. ammonia oxidation was difficult to estimate based on gene transcription only, especially as different soil core replicates were used for gas fluxes and transcription microbial analysis (as the flux cores could not be destructively sampled) and due to high measurement variability both for gas fluxes and gene transcript abundances.
NH4NO3 fertilization to oil palm soils on day-14 stimulated a second pulse of N2O emission, however, smaller than the first one. The NH4NO3 fertilizer serves as both and sources that can be converted to N2O by both nitrification and denitrification pathways. Ammonia oxidizers use carbon dioxide for biomass synthesis and previous studies demonstrated enhanced nitrification-based N2O production upon ammonium-based fertilization (Hink et al., 2017, 2018). Therefore, ammonia oxidation could have contributed to the second N2O emission pulse after N fertilization in the oil palm soils. However, the second N2O pulse was lower compared to the first one both for OP2 (at day-4) and OP7 (at day-1), and this was likely caused by the restricted denitrification activity. In addition, there was no increase in the riparian soil that received the same treatment. Since the nitrogen source was sufficiently applied, we suspect that the depleted organic carbon might be the limiting factor affecting the denitrification-related N2O production in our soils during this period.
Conclusions
Our study established that under controlled laboratory incubations logged forest and oil palm soils have equally high potential for N2O and NO emissions following an increase in soil moisture, while riparian reserve soil releases constantly lower rates of N2O and NO independently of soil moisture condition. The nitrogen based mineral fertilization induced the N2O emission in soils, suggesting enhanced GHG emission potential after conversion of forest land for agriculture use. Proteobacterial nirS and AniA-nirK containing denitrifiers and archaeal ammonia oxidizers appeared to be the main contributors to N2O emissions, with their activity differed under different conditions. Although it is difficult to make precise estimations on the GHG emissions and the relative contributions of different microbial communities to the emissions due to high variability among replicates, the present study suggests intensified N2O and NO emissions and impaired ecosystem functioning stability against environmental perturbation following deliberate anthropogenic exploitation of tropical forests.
Data Availability Statement
The datasets generated/analyzed for this study can be found in https://doi.org/10.5281/zenodo.3614876 (Drewer et al., 2019b).
Author Contributions
JD and US have designed the experiment, in collaboration with ML and JS. ML carried out the laboratory experiment. JD analyzed the flux and soil data. CG-R designed the microbial analysis. JZ and CG-R analyzed the soil microbial transcript activity. PL advised on statistical analysis. JD, JZ, CG-R, and US wrote the manuscript.
Funding
This project was funded as LOMBOK (Land-use Options for Maintaining BiOdiversity and eKosystem functions) by the NERC Human Modified Tropical Forest (HMTF) research programme (NE/K016091/1). CG-R was funded by a University Royal Society Fellowship (UF150571).
Conflict of Interest
The authors declare that the research was conducted in the absence of any commercial or financial relationships that could be construed as a potential conflict of interest.
Acknowledgments
We thank the NERC LOMBOK field assistants for their help with soil sampling, especially Lawlina Mansul and Arnold James. We also thank Graeme Nicol for initial discussions in this project.
Supplementary Material
The Supplementary Material for this article can be found online at: https://www.frontiersin.org/articles/10.3389/ffgc.2020.00004/full#supplementary-material
References
Anjum, M. F., Stevanin, T. M., Read, R. C., and Moir, J. W. (2002). Nitric oxide metabolism in neisseria meningitidis. J. Bacteriol. 184, 2987–2993. doi: 10.1128/JB.184.11.2987-2993.2002
Bateman, E. J., and Baggs, E. M. (2005). Contributions of nitrification and denitrification to N2O emissions from soils at different water-filled pore space. Biol. Fert. Soils 41, 379–388. doi: 10.1007/s00374-005-0858-3
Bollmann, A., and Conrad, R. (1998). Influence of O2 availability on NO and N2O release by nitrification and denitrification in soils. Glob. Change Biol. 4, 387–396. doi: 10.1046/j.1365-2486.1998.00161.x
Bonan, G. B. (2008). Forests and climate change: forcings, feedbacks, and the climate benefits of forests. Science 320, 1444–1449. doi: 10.1126/science.1155121
Bonilla-Rosso, G., Wittorf, L., Jones, C. M., and Hallin, S. (2016). Design and evaluation of primers targeting genes encoding NO-forming nitrite reductases: implications for ecological inference of denitrifying communities. Sci. Rep. 6:39208. doi: 10.1038/srep39208
Borken, W., and Matzner, E. (2009). Reappraisal of drying and wetting effects on C and N mineralization and fluxes in soils. Glob. Change Biol. 15, 808–824. doi: 10.1111/j.1365-2486.2008.01681.x
Castaldi, S., Bertolini, T., Valente, A., Chiti, T., and Valentini, R. (2013). Nitrous oxide emissions from soil of an African rain forest in Ghana. Biogeosciences 10, 4179–4187. doi: 10.5194/bg-10-4179-2013
Clough, T. J., Sherlock, R. R., and Rolston, D. E. (2005). A review of the movement and fate of N2O in the subsoil. Nutr. Cycl. Agroecosyst. 72, 3–11. doi: 10.1007/s10705-004-7349-z
Cowan, N., Levy, P., Drewer, J., Carswell, A., Shaw, R., Simmons, I., et al. (2019). Application of Bayesian statistics to estimate nitrous oxide emission factors of three nitrogen fertilisers on UK grasslands. Environ. Int. 128, 362–370. doi: 10.1016/j.envint.2019.04.054
Dandie, C. E., Wertz, S., Leclair, C. L., Goyer, C., Burton, D. L., Patten, C. L., et al. (2011). Abundance, diversity and functional gene expression of denitrifier communities in adjacent riparian and agricultural zones. FEMS Microbiol. Ecol. 77, 69–82. doi: 10.1111/j.1574-6941.2011.01084.x
Di, H. J., Cameron, K. C., Shen, J. P., Winefield, C. S., O'callaghan, M., Bowatte, S., He, J. Z., et al. (2009). Nitrification driven by bacteria and not archaea in nitrogen-rich grassland soils. Nature Geosci. 2, 621–624. doi: 10.1038/ngeo613
Dick, J., Skiba, U., Munro, R., and Deans, D. (2006). Effect of N-fixing and non N-fixing trees and crops on NO and N2O emissions from Senegalese soils. J. Biogeogr. 33, 416–423. doi: 10.1111/j.1365-2699.2005.01421.x
Dick, J., Skiba, U., and Wilson, J. (2001). The effect of rainfall on NO and N2O emissions from Ugandan agroforest soils. Phyton. 41, 73–80.
Dislich, C., Keyel, A. C., Salecker, J., Kisel, Y., Meyer, K. M., Auliya, M., et al. (2017). A review of the ecosystem functions in oil palm plantations, using forests as a reference system. Biol. Rev. 92, 1539–1569. doi: 10.1111/brv.12295
Drewer, J., Braban, C. F., Tang, Y. S., Anderson, M., Skiba, U. M., Dragosits, U., et al. (2015). Surface greenhouse gas fluxes downwind of a penguin colony in the maritime sub-Antarctic. Atmos. Environ. 123, 9–17. doi: 10.1016/j.atmosenv.2015.10.062
Drewer, J., Howard, D., and McNamara, N. (2018). “Chapter 6 - Greenhouse gas (GHG) and biogenic volatile organic compound (bVOC) fluxes associated with land-use change to bioenergy crops,” in Greenhouse Gas Balances of Bioenergy Systems, eds P. Thornley and P. Adams (Academic Press), 77–96.
Drewer, J., Leduning, M., Sentian, J., and Skiba, U. (2019a). Soil Greenhouse Gas Fluxes and Associated Parameters From Forest and Oil Palm in the SAFE Landscape. doi: 10.5281/zenodo.3251900
Drewer, J., Leduning, M., Zhao, J., Gubry-Rangin, C., and Skiba, U. (2019b). Linking Potential Greenhouse Gas and NO Fluxes to Soil Microbial Communities in Incubation Experiments with Soil From the SAFE Landscape. doi: 10.5281/zenodo.3258082
Ewers, R. M., Didham, R. K., Fahrig, L., Ferraz, G., Hector, A., Holt, R., et al. (2011). A large-scale forest fragmentation experiment: the stability of altered forest ecosystems project. Philos. Trans. R. Soc. B 366, 3292–3302. doi: 10.1098/rstb.2011.0049
Fowler, D., Nemitz, E., Misztal, P., Di Marco, C., Skiba, U., Ryder, J., et al. (2011). Effects of land use on surface–atmosphere exchanges of trace gases and energy in Borneo: comparing fluxes over oil palm plantations and a rainforest. Philos. Trans. R. Soc. London B 366, 3196–3209. doi: 10.1098/rstb.2011.0055
Galloway, J. N., Dentener, F. J., Capone, D. G., Boyer, E. W., Howarth, R. W., Seitzinger, S. P., et al. (2004). Nitrogen cycles: past, present, and future. Biogeochemistry, 70, 153–226. doi: 10.1007/s10533-004-0370-0
Germer, J., and Sauerborn, J. (2008). Estimation of the impact of oil palm plantation establishment on greenhouse gas balance. Environ. Dev. Sustain. 10, 697–716. doi: 10.1007/s10668-006-9080-1
Graf, D. R., Jones, C. M., and Hallin, S. (2014). Intergenomic comparisons highlight modularity of the denitrification pathway and underpin the importance of community structure for N2O emissions. PLoS ONE 9:e114118. doi: 10.1371/journal.pone.0114118
Harwood, J. E., and Huyser, D. J. (1970). Automated analysis of ammonia in water. Water Res. 4, 695–704. doi: 10.1016/0043-1354(70)90031-X
Hassler, E., Corre, M. D., Kurniawan, S., and Veldkamp, E. (2017). Soil nitrogen oxide fluxes from lowland forests converted to smallholder rubber and oil palm plantations in Sumatra, Indonesia. Biogeosciences 14, 2781–2798. doi: 10.5194/bg-14-2781-2017
Hassler, E., Corre, M. D., Tjoa, A., Damris, M., Utami, S. R., and Veldkamp, E. (2015). Soil fertility controls soil–atmosphere carbon dioxide and methane fluxes in a tropical landscape converted from lowland forest to rubber and oil palm plantations. Biogeosciences 12, 5831–5852. doi: 10.5194/bg-12-5831-2015
Hedin, L. O., Brookshire, E. N. J., Menge, D. N. L., and Barron, A. R. (2009). The nitrogen paradox in tropical forest ecosystems. Ann. Rev. Ecol. Evol. Syst. 40, 613–635. doi: 10.1146/annurev.ecolsys.37.091305.110246
Henriksen, A., and Selmer-Olsen, A. R. (1970). Automatic methods for determining nitrate and nitrite in water and soil extracts. Analyst 95, 514–518. doi: 10.1039/an9709500514
Henry, S., Bru, D., Stres, B., Hallet, S., and Philippot, L. (2006). Quantitative detection of the nosZ gene, encoding nitrous oxide reductase, and comparison of the abundances of 16S rRNA, narG, nirK, and nosZ genes in soils. Appl. Environ. Microbiol. 72, 5181–5189. doi: 10.1128/AEM.00231-06
Hink, L., Gubry-Rangin, C., Nicol, G. W., and Prosser, J. I. (2018). The consequences of niche and physiological differentiation of archaeal and bacterial ammonia oxidisers for nitrous oxide emissions. ISME J. 12, 1084–1093. doi: 10.1038/s41396-017-0025-5
Hink, L., Nicol, G. W., and Prosser, J. I. (2017). Archaea produce lower yields of N2O than bacteria during aerobic ammonia oxidation in soil. Environ. Microbiol. 19, 4829–4837. doi: 10.1111/1462-2920.13282
Hu, H. W., Chen, D., and He, J. Z. (2015). Microbial regulation of terrestrial nitrous oxide formation: understanding the biological pathways for prediction of emission rates. FEMS Microbiol. Rev. 39, 729–749. doi: 10.1093/femsre/fuv021
Jones, C. M., Graf, D., Bru, D., Philippot, L., and Hallin, S. (2013). The unaccounted yet abundant nitrous oxide-reducing microbial community: a potential nitrous oxide sink. ISME J. 7, 417–426. doi: 10.1038/ismej.2012.125
Kits, K. D., Jung, M. Y., Vierheilig, J., Pjevac, P., Sedlacek, C. J., Liu, S., et al. (2019). Low yield and abiotic origin of N2O formed by the complete nitrifier Nitrospira inopinata. Nat. Commun. 10:1836. doi: 10.1038/s41467-019-09790-x
Krause, H. M., Thonar, C., Eschenbach, W., Well, R., Mäder, P., Behrens, S., et al. (2017). Long term farming systems affect soils potential for N2O production and reduction processes under denitrifying conditions. Soil Biol. Biochem. 114, 31–41. doi: 10.1016/j.soilbio.2017.06.025
Lammel, G., and Graßl, H. (1995). Greenhouse effect of NOX. Environ. Sci. Pollut. Res. 2, 40–45. doi: 10.1007/BF02987512
Levičnik-Höfferle, Š., Nicol, G. W., Ausec, L., Mandić-Mulec, I., and Prosser, J. I. (2012). Stimulation of thaumarchaeal ammonia oxidation by ammonia derived from organic nitrogen but not added inorganic nitrogen. FEMS Microbiol. Ecol. 80, 114–123. doi: 10.1111/j.1574-6941.2011.01275.x
Liu, B., Mørkved, P. T., Frostegård, Å., and Bakken, L. R. (2010). Denitrification gene pools, transcription and kinetics of NO, N2O and N2 production as affected by soil pH. FEMS Microbiol. Ecol. 72, 407–417. doi: 10.1111/j.1574-6941.2010.00856.x
Liu, R., Hu, H., Suter, H., Hayden, H. L., He, J., Mele, P., et al. (2016). Nitrification is a primary driver of nitrous oxide production in laboratory microcosms from different land-use soils. Front. Microbiol. 7, 1373–1373. doi: 10.3389/fmicb.2016.01373
Luke, S. H., Slade, E. M., Gray, C. L., Annammala, K. V., Drewer, J., Williamson, J., et al. (2019). Riparian buffers in tropical agriculture: Scientific support, effectiveness and directions for policy. J. Appl. Ecol. 56, 85–92. doi: 10.1111/1365-2664.13280
Medinets, S., Skiba, U., Rennenberg, H., and Butterbach-Bahl, K. (2015). A review of soil NO transformation: associated processes and possible physiological significance on organisms. Soil Biol. Biochem. 80, 92–117. doi: 10.1016/j.soilbio.2014.09.025
Mellies, J., Jose, J., and Meyer, T. F. (1997). The Neisseria gonorrhoeae gene aniA encodes an inducible nitrite reductase. Mol. Gen. Genet. 256, 525–532. doi: 10.1007/s004380050597
Morales, S. E., Cosart, T., and Holben, W. E. (2010). Bacterial gene abundances as indicators of greenhouse gas emission in soils. ISME J. 4, 799–808. doi: 10.1038/ismej.2010.8
Myhre, G. D., Shindell, D., Bréon, F.-M., Collins, W., Fuglestved, J., Huang, J., et al. (2013). “Anthropogenic and natural radiative forcing,” in: Climate Change 2013: The Physical Science Basis. Contribution of Working Group I to the Fifth Assessment Report of the Intergovernmental Panel on Climate Change, eds T. F. Stocker, D. Qin, G. K. Plattner, M. Tignor, S. K. Allen, J. Boschung, et al. (Cambridge; New York, N. Y.: Cambridge University Press).
Patten, D. K., Bremner, J. M., and Blackmer, A. M. (1980). Effects of drying and air-dry storage of soils on their capacity for denitrification of nitrate1. Soil Sci. Soc. Am. J. 44, 67–70. doi: 10.2136/sssaj1980.03615995004400010015x
Pendrill, F., Persson, U. M., Godar, J., and Kastner, T. (2019). Deforestation displaced: trade in forest-risk commodities and the prospects for a global forest transition. Environ. Res. Lett. 14:055003. doi: 10.1088/1748-9326/ab0d41
R Core Team (2017). “R: A language and environment for statistical computing,” in: R Foundation for Statistical Computing, ed Team RC (Vienna: R Core Team).
Riutta, T., Malhi, Y., Kho, L. K., Marthews, T. R., Huaraca Huasco, W., Khoo, M., et al. (2018). Logging disturbance shifts net primary productivity and its allocation in Bornean tropical forests. Glob. Change Biol. 24, 2913–2928. doi: 10.1111/gcb.14068
Rock, J. D., Mahnane, M. R., Anjum, M. F., Shaw, J. G., Read, R. C., and Moir, J. W. (2005). The pathogen Neisseria meningitidis requires oxygen, but supplements growth by denitrification. Nitrite, nitric oxide and oxygen control respiratory flux at genetic and metabolic levels. Mol. Microbiol. 58, 800–809. doi: 10.1111/j.1365-2958.2005.04866.x
Sanchez-Martin, L., Dick, J., Bocary, K., Vallejo, A., and Skiba, U. M. (2010). Residual effect of organic carbon as a tool for mitigating nitrogen oxides emissions in semi-arid climate. Plant Soil 326, 137–145. doi: 10.1007/s11104-009-9987-z
Sanford, R. A., Wagner, D. D., Wu, Q., Chee-Sanford, J. C., Thomas, S. H., Cruz-García, C., et al. (2012). Unexpected nondenitrifier nitrous oxide reductase gene diversity and abundance in soils. Proceedings of the National Academy of Sciences, 109, 19709–19714. doi: 10.1073/pnas.1211238109
Sexstone, A. J., Revsbech, N. P., Parkin, T. B., and Tiedje, J. M. (1985). Direct measurement of oxygen profiles and denitrification rates in soil aggregates. Soil Sci. Soc. Am. J. 49, 645–651. doi: 10.2136/sssaj1985.03615995004900030024x
Shanmugam, S., Dalal, R. C., Joosten, H., Raison, R. J., and Joo, G. K. (2018). SOC stock changes and greenhouse gas emissions following tropical land use conversions to plantation crops on mineral soils, with a special focus on oil palm and rubber plantations. Agriculture 8:133. doi: 10.3390/agriculture8090133
Sharma, S., Aneja, M. K., Mayer, J., Munch, J. C., and Schloter, M. (2005). Diversity of transcripts of nitrite reductase genes (nirK and nirS) in rhizospheres of grain legumes. Appl. Environ. Microbiol. 71, 2001–2007. doi: 10.1128/AEM.71.4.2001-2007.2005
Van Lent, J., Hergoualc'h, K., and Verchot, L. V. (2015). Reviews and syntheses: Soil N2O and NO emissions from land use and land-use change in the tropics and subtropics: a meta-analysis. Biogeosciences 12, 7299–7313. doi: 10.5194/bg-12-7299-2015
Verhamme, D. T., Prosser, J. I., and Nicol, G. W. (2011). Ammonia concentration determines differential growth of ammonia-oxidising archaea and bacteria in soil microcosms. ISME J. 5, 1067–1071. doi: 10.1038/ismej.2010.191
Wang, R., Feng, Q., Liao, T., Zheng, X., Butterbach-Bahl, K., Zhang, W., et al. (2013). Effects of nitrate concentration on the denitrification potential of a calcic cambisol and its fractions of N2, N2O and NO. Plant Soil 363, 175–189. doi: 10.1007/s11104-012-1264-x
Werner, C., Butterbach-Bahl, K., Haas, E., Hickler, T., and Kiese, R. (2007). A global inventory of N2O emissions from tropical rainforest soils using a detailed biogeochemical model. Glob. Biogeochem. Cycles 21:18. doi: 10.1029/2006GB002909
Wertz, S., Goyer, C., Zebarth, B. J., Tatti, E., Burton, D. L., Chantigny, M. H., et al. (2016). The amplitude of soil freeze-thaw cycles influences temporal dynamics of N2O emissions and denitrifier transcriptional activity and community composition. Biol. Fert. Soils 52, 1149–1162. doi: 10.1007/s00374-016-1146-0
Keywords: logged tropical forest, riparian areas, greenhouse gases, nitrification-denitrification, AniA, nirK and nirS, amoA, nosZ
Citation: Drewer J, Zhao J, Leduning MM, Levy PE, Sentian J, Gubry-Rangin C and Skiba UM (2020) Linking Nitrous Oxide and Nitric Oxide Fluxes to Microbial Communities in Tropical Forest Soils and Oil Palm Plantations in Malaysia in Laboratory Incubations. Front. For. Glob. Change 3:4. doi: 10.3389/ffgc.2020.00004
Received: 16 October 2019; Accepted: 10 January 2020;
Published: 30 January 2020.
Edited by:
Yit Arn Teh, Newcastle University, United KingdomReviewed by:
Norliyana Zin Zawawi, Malaysian Palm Oil Board, MalaysiaGuntars O. Martinson, University of Göttingen, Germany
Alexander Krichels, University of California, Riverside, United States
Muhammad Firdaus Abdul Karim, Universiti Malaysia Kelantan, Malaysia
Copyright © 2020 Drewer, Zhao, Leduning, Levy, Sentian, Gubry-Rangin and Skiba. This is an open-access article distributed under the terms of the Creative Commons Attribution License (CC BY). The use, distribution or reproduction in other forums is permitted, provided the original author(s) and the copyright owner(s) are credited and that the original publication in this journal is cited, in accordance with accepted academic practice. No use, distribution or reproduction is permitted which does not comply with these terms.
*Correspondence: Julia Drewer, anVld0BjZWguYWMudWs=