 John S. Gunn
 Mark J. Ducey1
 Ethan P. Belair
- 1Department of Natural Resources and the Environment, University of New Hampshire, Durham, NH, United States
- 2University of New Hampshire Agricultural Experiment Station and UNH Cooperative Extension, Durham, NH, United States
- 3Spatial Informatics Group, LLC, Pleasanton, CA, United States
- 4Gund Institute for Environment, University of Vermont, Burlington, VT, United States
The next major eastern spruce budworm (Choristoneura fumiferana) outbreak is likely to begin impacting the forests of the northeastern US over the next few years. More than 4.7 million ha of forest and 94.8 million Mg of carbon in spruce (Picea spp.) and balsam fir (Abies balsamea) are at risk. Vegetation shifts in at-risk forest stands are likely to occur as a direct result of mortality caused by spruce budworm and through post-outbreak salvage harvest operations designed to minimize economic impact. Management interventions have short-term and long-term consequences for the terrestrial carbon budget and have significant implications for the role of the region's forests as a natural climate solution. We used regional forest inventory data and 40 years growth and harvest simulations from the USDA Forest Service Forest Vegetation Simulator to quantify a range of forest carbon outcomes for alternative silvicultural interventions in the northeastern US. We performed a life cycle assessment of harvested wood products, including bioenergy, to evaluate the full greenhouse gas (GHG) emissions consequences of salvage and business as usual silvicultural scenarios across a range of stand risk profiles in the presence and absence of spruce budworm attack. Salvaging dead trees in the most at-risk stands tends to produce net emissions of carbon dioxide for at least 10 years compared to a baseline where dead trees are left standing. In most scenarios, GHG emissions reached parity with the baseline by year 20. Changes in forest carbon stocks were the biggest driver of net emission differences between salvage and no salvage scenarios. A benchmark scenario without timber harvesting or the occurrence of a spruce budworm outbreak had the greatest net carbon sequestration profile after 40 years compared to all other scenarios. Salvaging trees killed by a severe and widespread insect infestation has potential negative short-term implications for GHG emissions, but long-term resilience of these climate benefits is possible in the absence of future outbreaks or subsequent harvest activities. The results provide guidance on silvicultural interventions to minimize the impact of spruce budworm on forest carbon.
Introduction
Within the next decade, an outbreak of eastern spruce budworm (SBW; Choristoneura fumiferana) in eastern Canada is expected to begin affecting the forest in the states of Maine, New Hampshire, Vermont, and northern New York (hereafter “northeastern US”). The last outbreak persisted over two decades, peaked in the late 1970's, and affected more than 52 million ha of forests in Canada and the United States (Blais, 1983). The current outbreak is affecting over eight million ha in eastern Canada (Maine Forest Service, 2019) and will likely have dramatic impacts on forest product flows and yields as well as carbon (C) storage (Wagner et al., 2016). There are currently about 4.7 million ha of the most susceptible forest type in the northeastern US (Table 1), though other stands may be vulnerable to mortality if the proportions of balsam fir (Abies balsamea) or white spruce (Picea glauca), the preferred foods of SBW, are sufficiently high. Forest management decisions to salvage mortality have important implications for the potential resilience of the climate benefits provided by forest ecosystems. In particular, the decision to salvage mortality can lead to short- or long-term losses of C from the forest to the atmosphere depending upon how the wood is used and how the residual forest responds through growth and regeneration. Understanding the timing of the resilience of forest C stocks in the presence or absence of salvage harvests can provide insight to support policy and management decisions regarding this forest management practice.
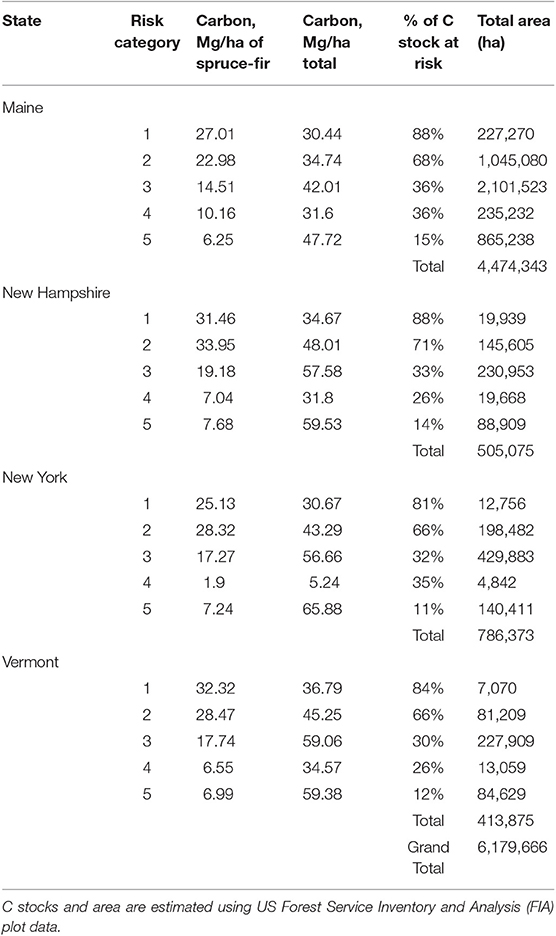
Table 1. Mean forest carbon (C) stocks and area allocated by SBW risk category (see Table 2).
In the United States, forests play a critical role in mitigating climate change, sequestering the equivalent of 10–20% of domestic greenhouse gas (GHG) emissions (Woodall et al., 2015; US Environmental Protection Agency, 2017). The forest of the northeastern US has historically served as an important C sink, with gains offsetting losses due to harvest and natural disturbance even without accounting for wood-in-use pools (Zheng et al., 2011; Gunn and Buchholz, 2018). The important role of forests as a natural climate solution is becoming clear, but significant natural disturbances, including insect outbreaks, have the potential to substantially reduce regional forest C pools (Williams et al., 2016; Fei et al., 2019). SBW is perhaps the most damaging insect pest in the northeastern US feeding primarily on current year foliage of balsam fir, white spruce, and red spruce (Picea rubens) and can cause widespread mortality of those species (Solomon et al., 2003). In the northeastern US, as in adjacent areas of Canada, the volume losses associated with SBW-related mortality could have substantial impacts on forests both economically and ecologically (Hennigar and MacLean, 2010; Hennigar et al., 2011; Wagner et al., 2016). The forest management response to such widespread actual or anticipated mortality can potentially help or hinder the resilience of the forest C sink.
Mortality from SBW occurs in host species after trees are defoliated several years in a row (Solomon et al., 2003). Dead trees can remain standing while decomposing, with small branches falling to the ground first, followed by larger branches and eventually parts of the bole breaking off or the entire bole falling to the ground (e.g., Maser et al., 1979). This process of decay results in the gradual release of greenhouse gases to the atmosphere and the transfer of a portion of the tree's C to the litter and soil. Mortality and growth loss reduce net primary productivity for a period of time but can be mitigated somewhat by fast growing regeneration or growth in subdominant trees released by the mortality of adjacent trees.
The salvage of dead or dying trees is a forest management response intended to limit the economic losses resulting from a natural disturbance by harvesting some of the value before the quality of the wood is diminished beyond utility. Salvage harvesting has also been suggested as a tool to increase resilience of stands in some forest ecosystems by focusing on future stand conditions as an outcome rather than mitigating economic losses (O'Hara and Ramage, 2013). Mortality from SBW salvaged after an outbreak can still be used for lumber, pulp, or as bioenergy feedstocks 3–4 years after death (Barrette et al., 2015). But salvaging dead trees is not without risk since harvest operations may also remove undamaged trees along with dead or dying trees (Foster and Orwig, 2006) and negatively impact biodiversity (Thorn et al., 2018). Removal of dead trees can also mitigate potential future disturbance risk in some forest ecosystems (Hood et al., 2017; Dobor et al., 2019). Thus, the decision to salvage should be informed by knowledge of the potential risks and benefits.
Hennigar et al. (2011) found that over four million hectares of Maine's forest are vulnerable to the coming outbreak, and that an outbreak of moderate to severe intensity would reduce inventories of spruce and fir by 20–30%. Wagner et al. (2016) suggest a volume loss of 21–43 million cubic meters over the next 40 years for a moderate to severe outbreak. Such volume reductions could have immediate and direct impacts on regional forest C budgets: direct C losses in stemwood alone could be as much as 8 Tg C, with substantial additional losses expected in crown and belowground pools. By comparison, total accumulation in recent years was 3.2 Tg/yr C (including above- and belowground pools, but not including wood-in-use and landfill sinks; Zheng et al., 2011); some of that net accumulation reflects recovery of growing stock following the last SBW outbreak and its associated harvest activities. At a larger scale, Dymond et al. (2010) suggest that growth loss and mortality leading to reduced net primary productivity from recent and ongoing widespread insect outbreaks could change Canadian forests from a C sink to a source over time. The most recent “State of Canada's Forests” report (Canadian Forest Service, 2018) indicates that natural disturbances have indeed contributed to Canada's forests becoming a net source of C as of 2016. The same concern applies to the northeastern US given the predicted potential spatial extent of an outbreak in this region.
Assessing the C resilience of forests following salvage harvesting requires a comprehensive life-cycle analysis that includes changes over time in forest C stocks (including living and dead trees, and coarse woody material), harvest and manufacturing GHG emissions, wood product fate, and final disposition (e.g., Gunn and Buchholz, 2018). Resilience in this context is measured in terms of the recovery of forest ecosystem and harvested wood C stocks over time following harvest. Here we employ forest growth and mortality projections and a full life-cycle analysis to evaluate the forest and wood-in-use C impacts of potential SBW attack and of silvicultural strategies to mitigate or avoid economic losses. We hypothesized that just as with silvicultural mitigation of commercial wood losses, silviculture to reduce potential SBW impacts can also facilitate the resilience of the forest C balance by shifting C to long-lived pools and displacing fossil-fuel energy use. We also hypothesized that lack of management, or overly intensive management that targets less susceptible stands will increase the probability of persistent C emissions.
Materials and Methods
Stand Data and Harvest Simulations
We used regional forest inventory data from the USDA Forest Service Forest Inventory and Analysis program (FIA) to establish baseline forest stand conditions for subsequent growth and harvest simulations. We used FIA data from 4,926 plots across the northeastern US (Figure 1). These plots represent the 2015 evaluation group for the states of New York, Vermont, New Hampshire, and Maine. Within the FIA annualized design, these plots were measured between 2010 and 2016. Where area-weighted calculations were needed, the appropriate sampling weights were applied based on tables in the FIA database (Bechtold and Patterson, 2015). The plots were classified according to their risk for SBW defoliation (Table 2). The risk assessment is based only on stand characteristics and does not incorporate spatial constraints such as proximity to SBW source population and dispersal dynamics. However, higher risk plots (Categories 1–4; Figure 1) generally occurred within the geographic range of the previous outbreaks between 1954 and 1988 (Kucera and Orr, 1981; Williams and Birdsey, 2003).
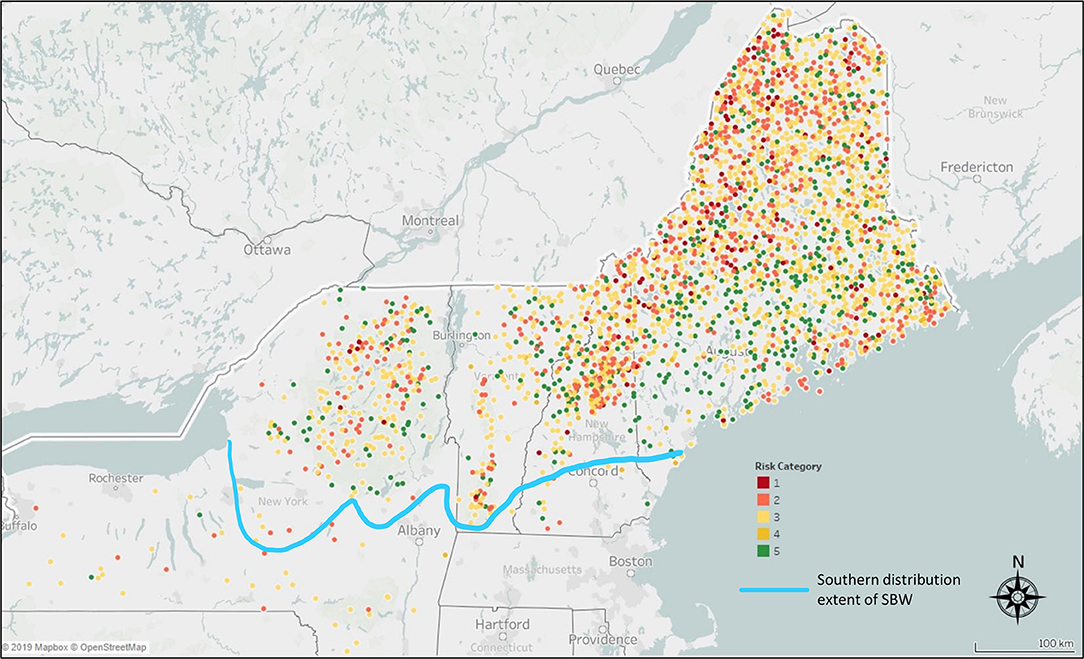
Figure 1. Approximate location of US Forest Service Forest Inventory and Analysis (FIA) plots in the northeastern United States. Colors indicate Risk Category determined by criteria described in Table 2. Southern range distribution line is adapted from Natural Resources Canada.
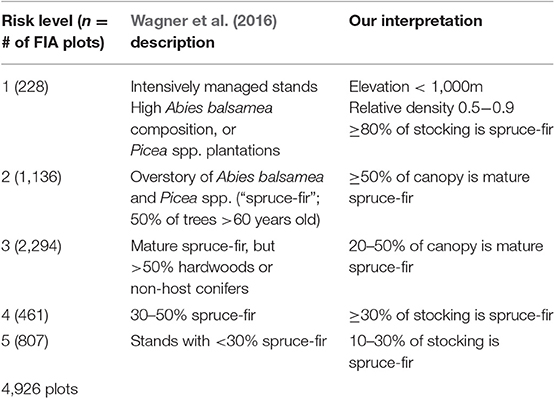
Table 2. Spruce budworm risk categorization of US Forest Service Forest Inventory and Analysis (FIA) plots.
We used the USDA Forest Service Forest Vegetation Simulator (FVS) Northeast Variant to simulate future forest C and product yields for FIA plots over 40 years. FVS is an individual tree, distance independent growth model, built using FIA data, which simulates forest vegetation change in response to a wide range of user-defined natural disturbances and management scenarios (Dixon, 2002). FVS has numerous variants intended for use in different geographic regions of the US; we used the Northeast Variant of FVS. FVS is limited by its empirical underpinnings to use within the approximate timeframe of FIA data (ca. 30 years; Yaussy, 2000), but within that timeframe it is widely accepted as the premier forest growth simulator for use in US forests (Yaussy, 2000; Dixon, 2002) including for use in modeling carbon dynamics (Nunery and Keeton, 2010; Hoover and Rebain, 2011). Since FVS is a deterministic model, it provides no information about the range of potential outcomes for forested stands and relies instead on the users' ability to define the range of initial conditions, as well as potential management decisions. As such, we used FIA plots from across the region to provide a range of initial forest stand conditions to model in response to silvicultural treatments (including salvage harvests). The Fire and Fuels Extension to FVS tracks living and non-living biomass derived from aboveground sources in the plot data (Rebain, 2015). The model simulates decay based on four species-specific rates (Rebain, 2015). Pools such as root biomass and leaf litter are a function of the aboveground tree data (Rebain, 2015).
Within FVS, we developed a range of business-as-usual harvesting treatments based on harvest types common in Northeastern forests based on Belair and Ducey (2018). We sought to combine Belair and Ducey's harvest types where possible to constrain the number of necessary simulations. After exploratory analysis of potential groupings, we identified five harvesting groups to use in FVS simulations based on similarity in percent of basal area removed across four diameter (dbh) classes. We then used the same plots analyzed by Belair and Ducey (2018) to determine the average percent of basal area removed by dbh class within our five harvest groups. Finally, we used these data to develop “marking guides” for use in FVS (Table 3) which were applied in the simulations to remove trees in a manner that mirrored current harvesting practice in the region (Belair and Ducey, 2018).
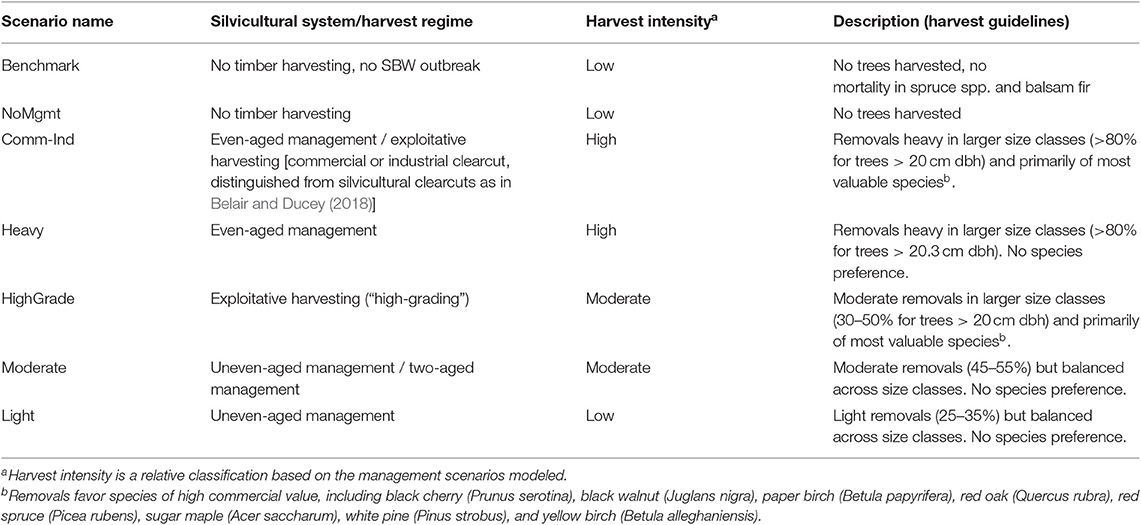
Table 3. Management scenario descriptions and Forest Vegetation Simulator (FVS) model harvest guidelines.
We then evaluated reports from past SBW infestations (Mattson et al., 1988; Solomon et al., 2003; Spence and MacLean, 2012) to develop novel treatments within FVS to mimic the damage caused by this pest. Based on these past reports we assumed mortality rates for all spruce species would be substantially lower than for balsam fir (45% for spruce, 95% for balsam fir; Solomon et al., 2003). We set salvage rates at 90% (assuming some inaccessibility) for all spruce and fir species following simulated SBW-related mortality. In summary, our simulations included six business as usual harvesting treatments (1 no harvest and 5 harvest treatments), two SBW scenarios (infested and not infested), and two salvage treatments (salvaged and not salvaged).
For each simulation, the baseline harvesting scenario was applied to each of the FIA plots analyzed during the 1st year of the simulation. If the simulation included SBW infestation, those impacts were applied immediately subsequent to the baseline harvest also in the 1st year of the simulation. If the simulation included salvage harvesting, salvage of standing dead trees was performed in year two of the simulation once the trees had “succumbed” to SBW in year one. Plots were then allowed to grow in the absence of additional harvest interventions or disturbance for the remainder of the 40 years timeline of the simulation. Each simulation was applied identically to all of the 4,926 FIA plots used, resulting in a dataset that represented the range of future conditions across the landscape, given each combination of initial harvest, SBW infestation, and salvage harvesting. This approach allowed us to pair harvest and salvage treatments at each plot for comparisons.
Forest Carbon Life Cycle Assessment
We tracked forest C stocks (e.g., live and dead trees, belowground roots, and leaf litter as modeled in FVS) and life cycle GHG emissions of harvested wood products for 40 years using model outputs derived from FVS scenarios. Forest sector life-cycle emissions used assumptions developed for the northeastern US by Hennigar et al. (2013) and further modified by Gunn and Buchholz (2018) and Buchholz et al. (2017). Life-cycle forest-sector C pools include the following: storage in above- and belowground live biomass and dead organic matter components (Total Stand Carbon); storage in forest products in use and in landfills; and forest-sector emissions by harvest, transport, and manufacturing or avoided emissions (e.g., when wood is used to substitute for fossil fuels for energy production). We assumed that harvest residues (unmerchantable tops and limbs) would be left in the forest. For the biomass energy scenarios, we analyzed the carbon implications if 30% of pulp-quality wood would be used for energy (mostly electricity generation) instead, which is consistent with current estimates for the region (Maine Forest Service, 2016). The C fate for in-use and disposed harvested wood products was based on Smith et al. (2006) (Table S1). To explore the implications of replacing pulp production with biomass-based electricity production using the same feedstock, we used the 2017 grid electricity mix as baseline emissions and adjusted C disposition rates from Smith et al. (2006) using paper product related carbon life cycle assessment (CLCA) parameters as outlined in Table 4. Table 5 provides sources to calculate C emissions from wood products manufacturing (baseline scenario) vs. a biomass electricity scenario. CLCA results are generally presented in terms of “net sequestration,” which represents the overall net C stocks after all emissions are accounted for.
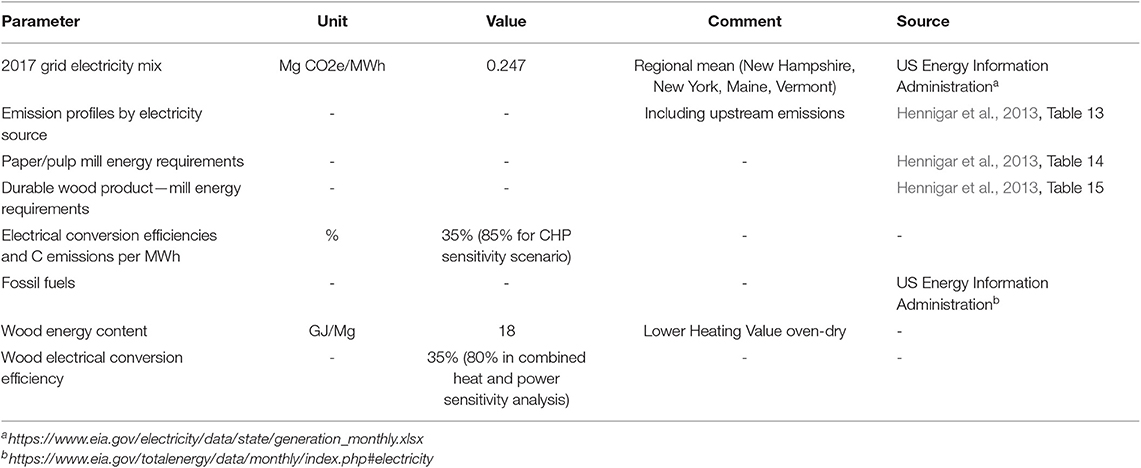
Table 4. Carbon life cycle assessment input parameters for electricity generation from pulp wood.
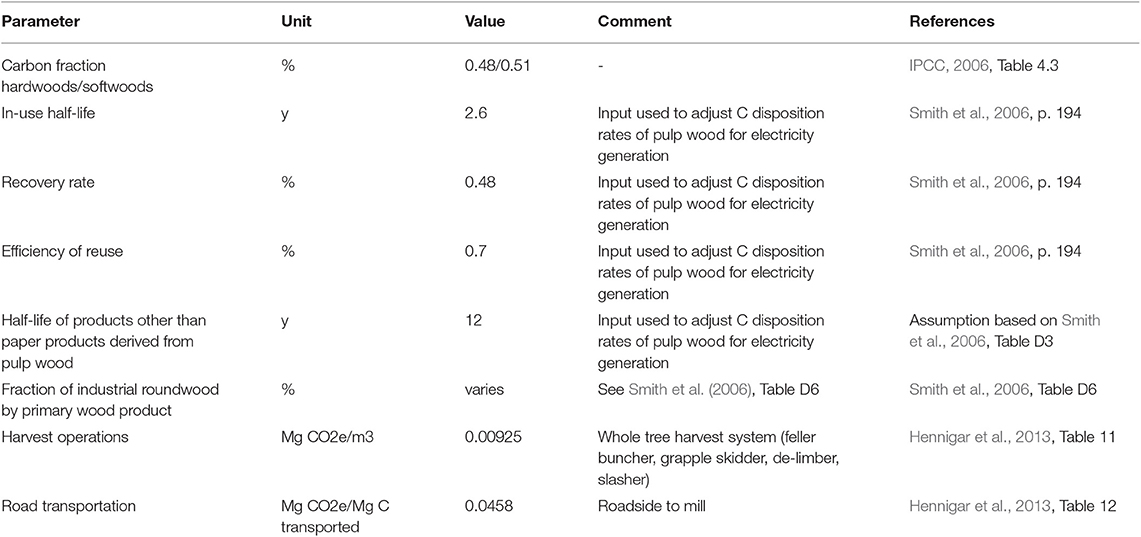
Table 5. Input parameter for harvested wood products carbon life cycle assessment including bioenergy.
From prior work, we know that forest CLCA systems are sensitive to assumptions about end use of harvested wood (Buchholz et al., 2017; Gunn and Buchholz, 2018). We developed two additional CLCA modifications to test the sensitivity of results to assumptions related to energy use and wood product substitution. First, we held all other assumptions constant and modified the biomass energy use to combined heat and power (CHP) instead of electricity only. This increases the efficiency of wood use (i.e., lower carbon dioxide emissions per volume of wood combusted) and changes the energy baseline comparison. Second, we added a term to attribute substitution benefits for solid wood products that would be used to displace more fossil fuel intensive products such as concrete and steel as building materials. The appropriate displacement factor is unknown, particularly given the high proportion of construction in the region that already uses wood vs. non-wood materials (Gustavsson et al., 2006). Therefore, we chose midpoint value of 50% of the solid wood products would displace fossil fuel intensive products (compared to 0% in the baseline CLCA).
Statistical Analyses
For each scenario (salvage – no salvage + harvest regime) we calculated the net cumulative emissions to the atmosphere of all forest-sector life-cycle C pools at each 10 years time step (0, 10, 20, 30, and 40 years post treatment). We then calculated the difference between paired no salvage-salvage and harvest treatment combinations (e.g., no salvage-high grade minus salvage-high grade) at each time step. For each paired salvage vs. no salvage and time step comparison, we performed a one sample t-test using JMP Pro 14.2.0 (SAS Institute Inc, 2018), where we defined the null hypothesis (H0) to be that the difference between the true mean (μ) and the comparison value (m0 = net cumulative emissions difference at each time step) is equal to zero. Positive net cumulative emissions difference values indicate the salvage scenario results in an emission to the atmosphere compared to the no salvage scenario; conversely, negative net cumulative emissions difference values mean greater sequestration relative to the no salvage scenario.
In addition to salvage-no salvage comparisons, we were interested in assessing differences in the overall net carbon emissions within scenarios and compared to a benchmark C trajectory without harvest or SBW mortality. We focused on outcomes at the end of the modeling time horizon (year 40) to reduce the complexity of this comparison. We used JMP Pro 14.2.0 (SAS Institute Inc, 2018) to conduct an analysis of variance (ANOVA) and paired t-test post-hoc tests to compare the year 40 net cumulative C emissions within all 13 scenarios (including the Benchmark scenario).
Results
Salvage harvesting in nearly every comparison produced greater initial net emissions through year 10, but generally improved to parity with the baseline or net sequestration by year 20. However, there were a few exceptions. Risk Category 5 stands that have low volume of host tree species achieved parity between 0 and 10 years, but not in the Light or NoMgmt harvest regimes (Figure 2). Also, when the baseline harvest regime was a commercial clearcut (Comm-Ind), parity occurred before year 10 (except in Risk Category 1). Conversely, the NoMgmt and Light harvest regimes in Risk Category 1 and 2 stands did not reach parity until between year 20 and 30. Risk Category 2 stands in the Light harvest regime reached parity by year 30.
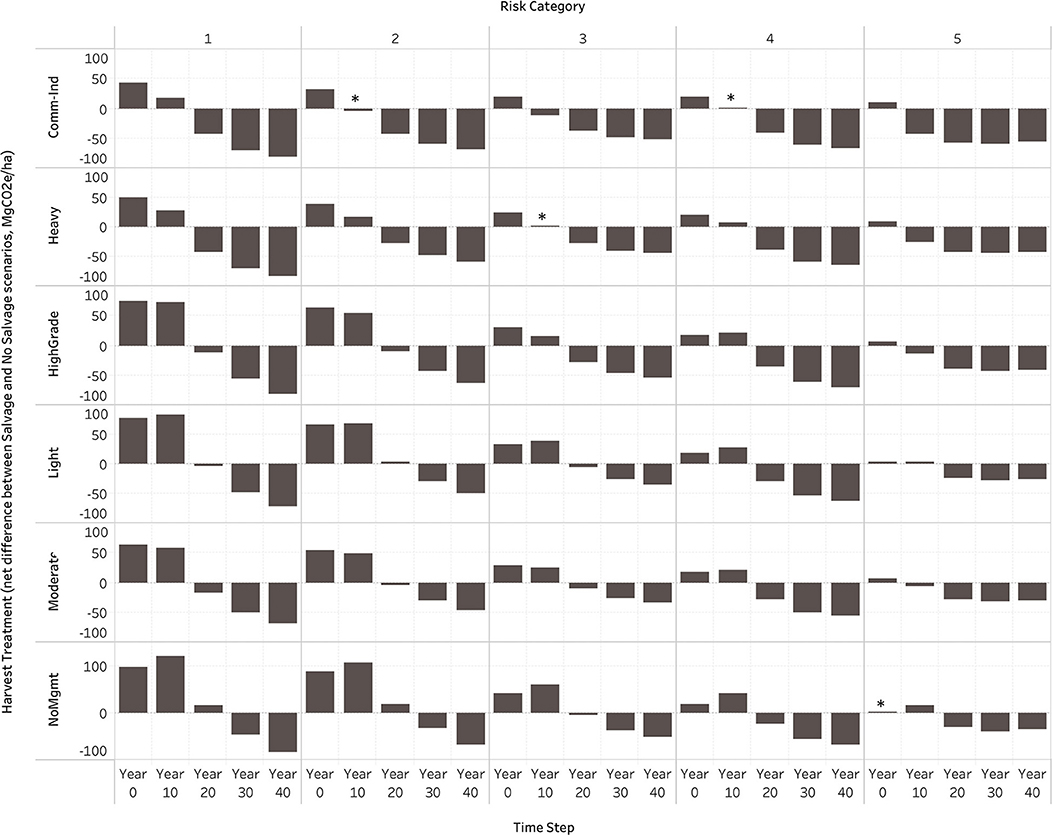
Figure 2. Mean difference between net cumulative emissions of Salvage vs. No Salvage comparisons for each forest management scenario (at 10 years time steps). *Indicates not significantly different from 0 (p > 0.01). All other comparisons are significantly different from 0 (p ≤ 0.01).
Changes in forest C stocks were the biggest driver of net cumulative emissions differences. Operations emissions (harvest, transport, pulp mill, and sawmill) are a minor component of overall emissions when considered relative to the forest C pool (Figure 3). Mean harvest volumes in each treatment and Risk Category were quite variable because harvests were initiated regardless of starting condition or stand age (Figure 4). As expected, Comm-Ind treatments removed the greatest mean volume and Light treatments were the least intense in terms of volume per ha (Figure 4). The pattern was reversed when considering the volume removed from salvage activities (with smaller differences in Category 4 and 5 stands that had the smallest volume of host species; Figure 5). The ratio of sawlogs to low grade quality wood removed varied by treatment (Figure 6A). Overall, 77% was low grade and 23% sawlog quality. HighGrade harvests, as expected by the model's harvest rules, had the highest proportion of sawlogs removed (29%), the other treatments ranged from 19–23%. The volume of spruce and fir salvaged was similar to the overall average (81% low grade/19% sawlog; Figure 6B).
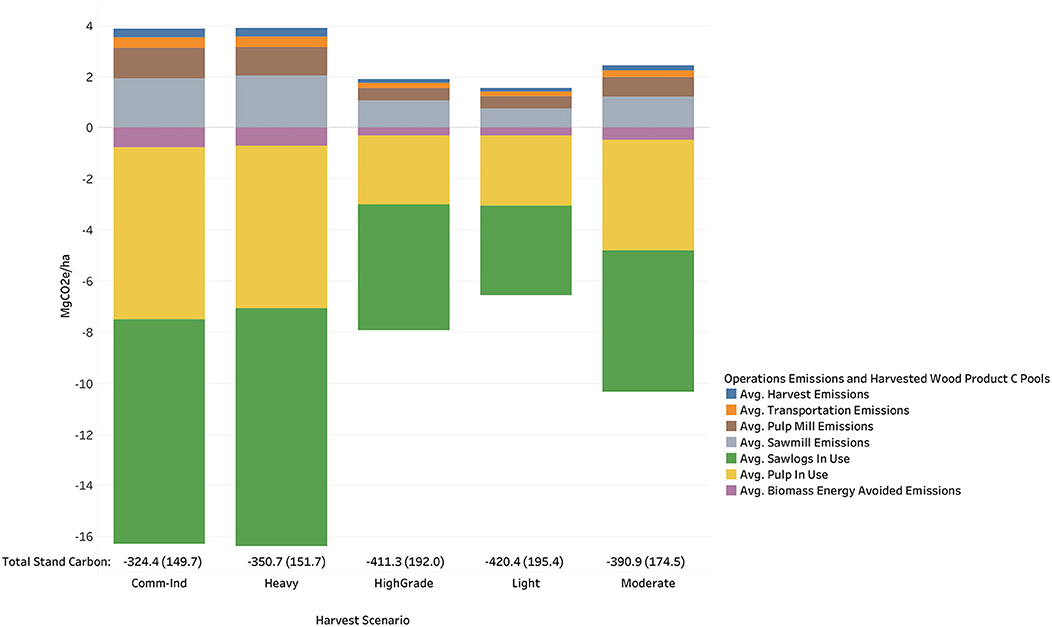
Figure 3. Post-harvest C pools at year 0 for each harvest scenario and risk category (n = 4926 for each scenario). Positive values denote C emissions, negative values denote C sequestered. Total stand carbon is presented as the mean value with SD in brackets and includes the following pools calculated in FVS: live trees (including stems, branches, and foliage, but not including roots), belowground live (the roots of live trees), belowground dead (the roots of dead and cut trees), standing dead (dead trees, including stems, and any branches, and foliage still present, but not including roots), forest down dead wood (all woody material, regardless of size), forest floor (litter and duff), and herbs and shrubs. Note: soil carbon is not included in this value since FIA data do not include this parameter.
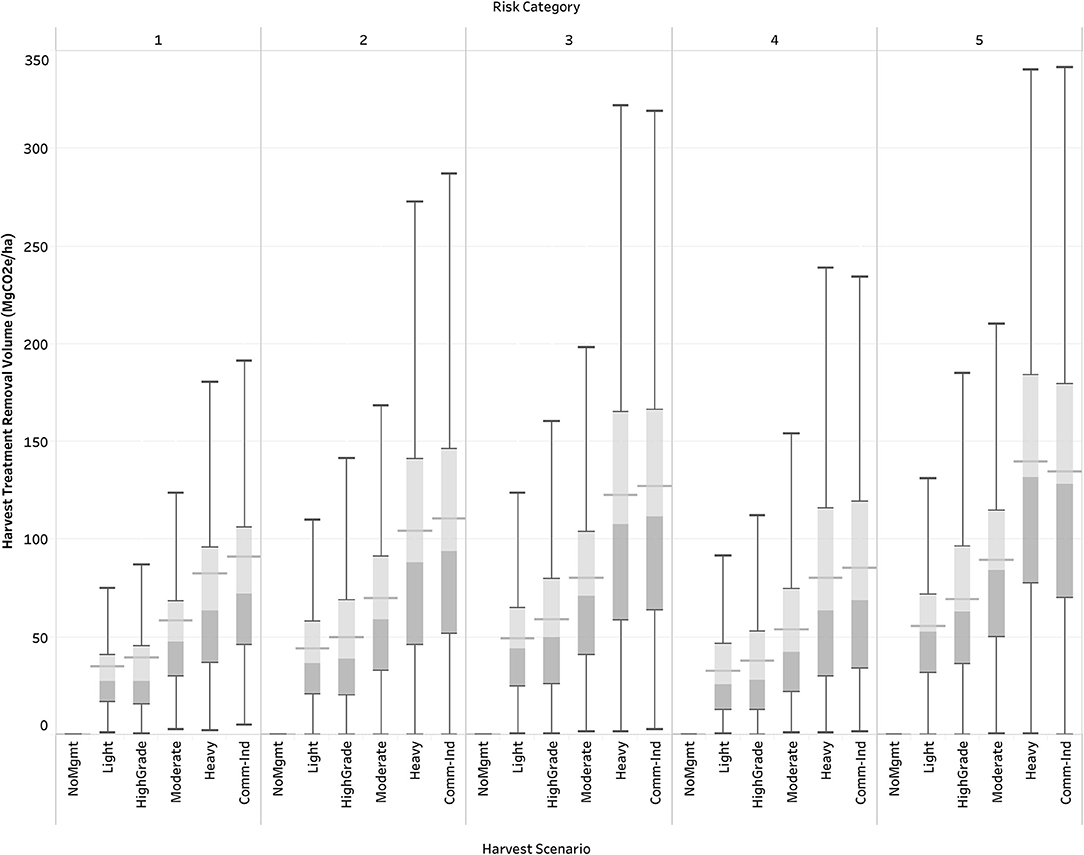
Figure 4. Modeled harvest removal volume (in MgCO2e/ha) for all management scenarios (excluding salvage volume). Mean is indicated by horizontal bar. Light gray color indicates upper hinge (75th percentile, Tukey's inclusionary hinge), dark gray indicates 25th lower hinge (25th percentile, Tukey's inclusionary hinge). Whiskers denote all data points within 1.5 times the interquartile range.
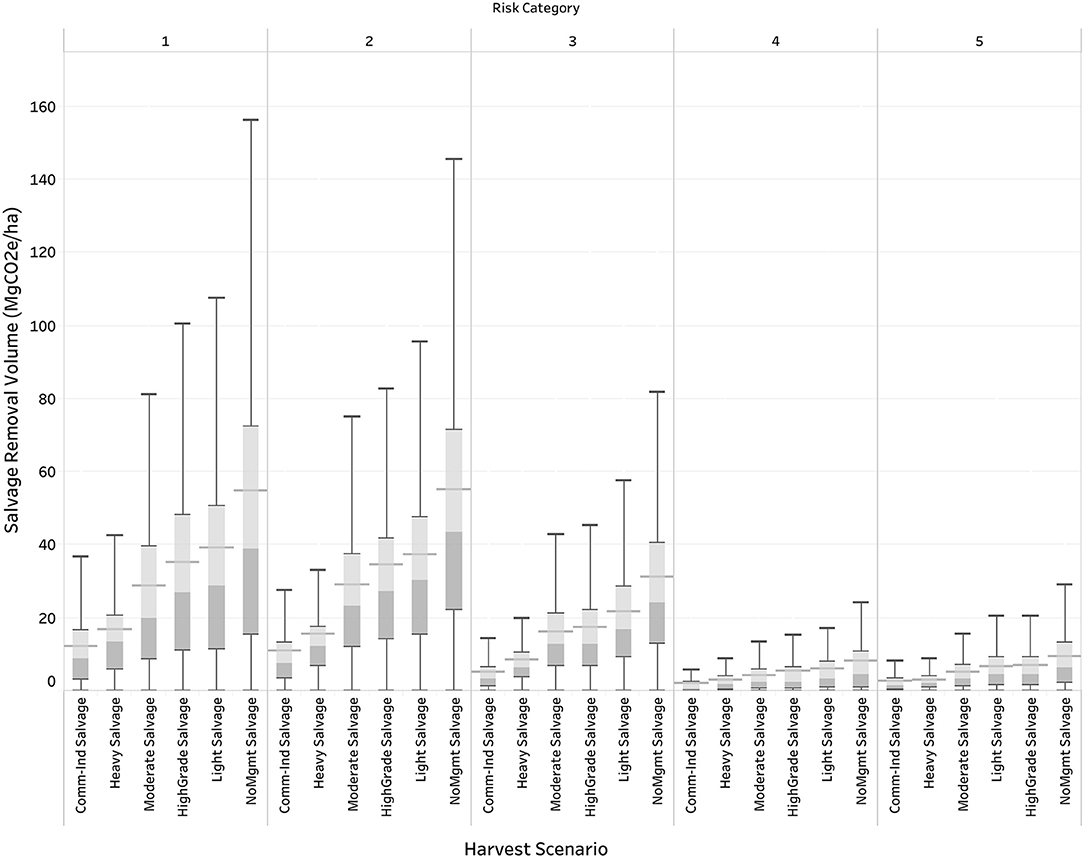
Figure 5. Modeled salvage harvest removal volume (in MgCO2e/ha) for all management scenarios (excluding harvest volume prior from baseline harvest scenario). Mean is indicated by horizontal bar. Light gray color indicates upper hinge (75th percentile, Tukey's inclusionary hinge), dark gray indicates 25th lower hinge (25th percentile, Tukey's inclusionary hinge). Whiskers denote all data points within 1.5 times the interquartile range.
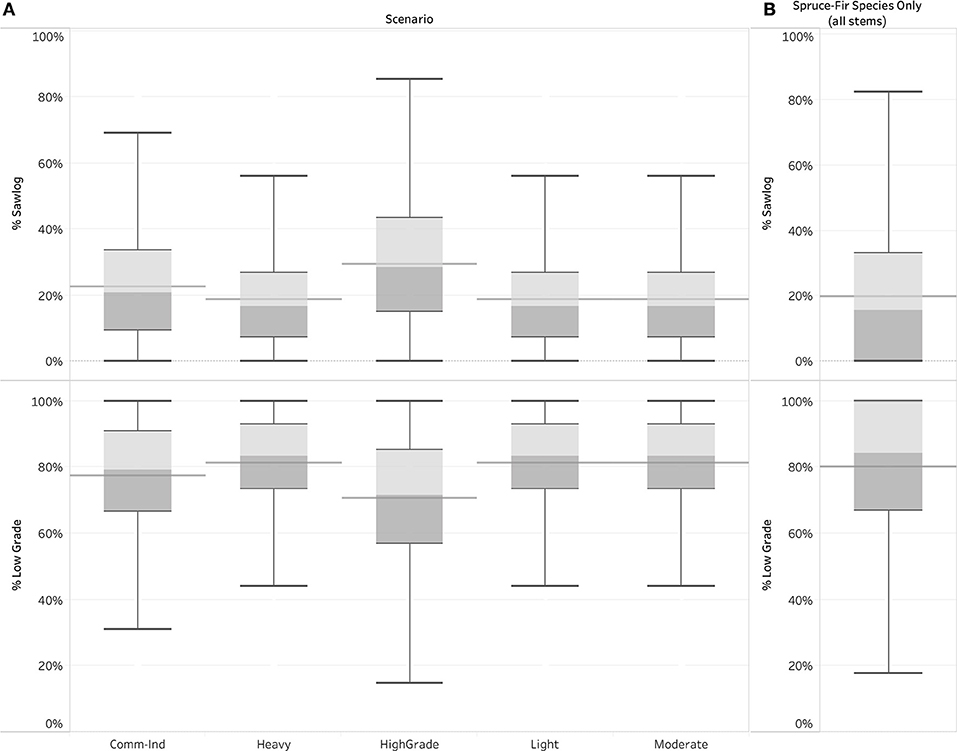
Figure 6. (A) Ratio of sawlog to low-grade quality wood removed in each harvest scenario (all species). (B) Ratio of sawlog to low-grade quality wood for spruce-fir species (calculated from all the standing stems at year 0 prior to any harvest).
In the sensitivity analyses where assumptions were modified to reflect an energy use of low-grade material that produced heat in addition to electricity, the Heavy and Comm-Ind salvage scenarios were the only scenarios with minor different outcomes. In Category 1, Comm-Ind parity was reduced from 20 to 10 years, and in Categories 2 and 4, the Heavy salvage scenario time to parity was also reduced from 20 to 10 years (Figure S1). We also detected a similar result when we attributed substitution benefits to 50% of the solid wood products (Figure S2). In addition to the changes detected in the energy assumptions, inclusion of wood product substitution benefits reduced parity time in the Heavy salvage scenario from 20 to 10 years (Figure S2). In both the Heavy and Comm-Ind scenarios, salvage harvesting results in a small reduction of forest carbon stocks, so the impacts of how wood is used is greater relative to forest stock change. Changing these energy usage assumptions from electricity-only to heat and electricity production also made a small difference for the Light scenario in Category 2, shortening the time to parity year 30 to 20 (Figures S1, S2). These scenarios were already at or close to parity over the same time span in the baseline scenario (Figure 2).
The comparisons above focus on the differences within a specific treatment of a baseline and alternative scenario. However, differences in long-term carbon sequestration emerge when we consider differences between the scenarios. For additional context on the capacity for stands to accumulate carbon, we modeled a “Benchmark” scenario where no harvests or SBW outbreak mortality occurred. Overall the C balance (net sequestration) at year 40 was greatest in the Benchmark scenario (no harvest, no SBW outbreak), though the difference diminishes in Risk Categories 4 and 5 (Figure 7). The Benchmark C stocks at year 40 are significantly different from all scenarios (paired t-test, p < 0.001) except NoMgmt Salvage in Risk Category 5 (p = 0.18 paired t-test).
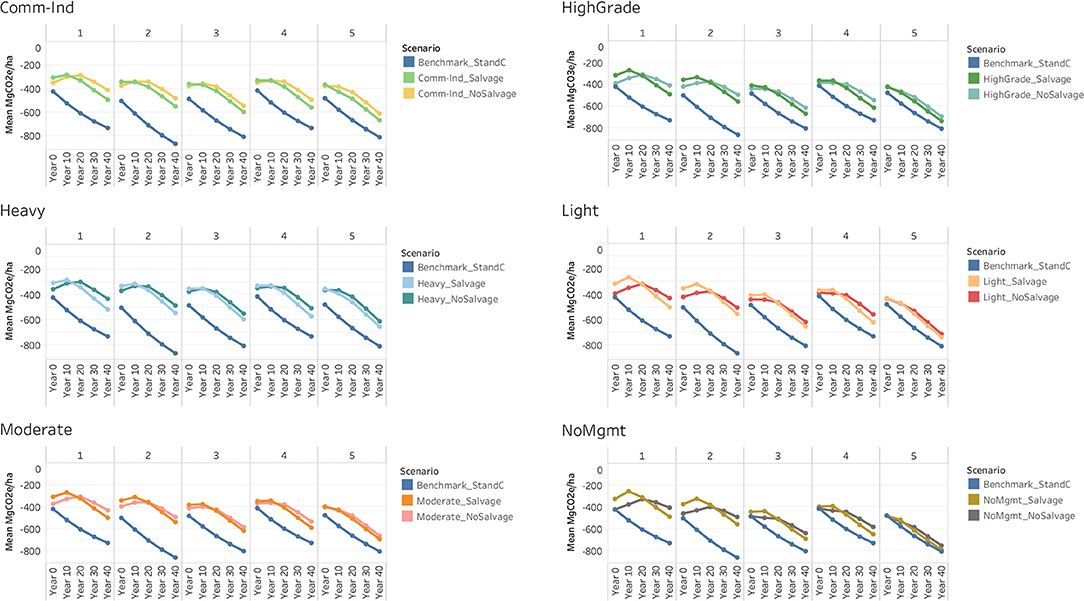
Figure 7. Mean total net greenhouse gas emissions balance (negative values = sequestration) for all management scenarios (Salvage and No Salvage) compared to benchmark scenario with no harvesting and no SBW outbreak.
Discussion
We found that forest management actions such as salvage harvesting designed to mitigate pest impacts over time can have positive impacts on overall C balances by reducing the risk of catastrophic loss in susceptible stands and landscapes and by shifting C from at-risk or dying trees to wood used as building materials or displacing fossil-fuel intensive energy sources. However, this C resilience comes at a short-term cost to the atmosphere that can last up to 20 years. Therefore, the resilience is dependent upon the recovery of the forest C stocks in the absence of subsequent natural or anthropogenic disturbances. If forest management interventions or large-scale mortality interrupt the growth response of the post salvage forest, then there is likely to be a longer period of time required to reach parity with the baseline scenarios.
Our findings resemble the patterns observed in studies of the GHG emissions implications of switching from fossil fuel energy to forest-derived woody biomass energy. The pattern documented in two recent meta-analyses (Buchholz et al., 2016; Bentsen, 2017) shows that switching to woody biomass energy creates a period of net emissions to the atmosphere followed by the achievement of parity (or better) in the future. The length of time to parity depends on many factors such as type of feedstock and forest management practices but is largely driven by changes in the forest C stocks as a result of increased harvest volumes (e.g., Walker et al., 2013). In part, this reflects the fact that much of the harvested volume is in low-grade material that enters product pools that are short-lived, relative to standing dead trees. Based on our CLCA model results, changes in forest C stocks are indeed the big driver when trees are salvaged following a natural disturbance event. This is illustrated by the NoMgmt salvage vs. no salvage scenarios, where a salvage harvest results in the greatest removal of carbon relative to any other treatment (Figure 5) and time to parity is the most extended (i.e., beyond 20 years; Figure 2). Conversely, the Comm-Ind and Heavy harvest treatments had the least net difference between the salvage and no salvage scenarios and tended to reach parity sooner. In those harvest treatments, the residual standing volume is low and thus the total removed C during a salvage harvest is the least (Figure 5). Adding salvage harvest to an intensive harvest baseline only marginally reduces forest C stocks and the forest growth response mitigates the loss quickly. However, these treatments rank lowest in terms of overall net carbon storage benefits over the 40 years period (Figure 7).
In empirical studies, Raymer et al. (2013) concluded that the gradual loss of eastern hemlock (Tsuga canadensis) from stands via hemlock wooly adelgid (Aldeges tsugae) mortality simulated through girdling and leaving onsite did not reduce total ecosystem C stocks but rather shifted stocks to CWD pools and was further mitigated by fast-growing black birch (Betula lenta) in the replacement stand. Krebs et al. (2017) similarly found that allowing a hemlock wooly adelgid outbreak to progress without salvaging (in models) resulted in greater net C sequestration and net storage over the long term in the northeastern US. Dobor et al. (2019) observed similar modeled outcomes for ecosystem C stocks following salvage harvesting in European Norway spruce (Picea abies) forests. Our results are consistent with these studies representing similar ecosystem dynamics. The overall implication is that salvage harvesting does not necessarily enhance the resilience of forest C stocks without a short-term cost and some risk that stocks will not recover if subsequent disturbances are likely in the near term (i.e., within 20 years). However, the long-term C benefits could be significant in the absence of natural or anthropogenic disturbances.
There are several strategies proposed to minimize risk of commercial timber loss due to SBW prior to an outbreak (Sainte-Marie et al., 2015). Such strategies include shifting species composition toward less susceptible commercial species like spruce (Picea spp.) and shade tolerant hardwoods or reducing average stand age on the landscape (MacLean, 1996; Hennigar and MacLean, 2010). But once an outbreak has occurred, landowners must face the decision of whether or not to harvest the most susceptible or already succumbed trees. This salvage of affected trees is typically intended to minimize commercial losses but can also be justified to slow the rate of spread and nominally to reduce fire risk, though this risk is low in spruce-fir ecosystems of the northeastern US (e.g., Lorimer, 1977). Decisions to salvage dead or dying trees should weigh the climate change implications of near-term net emissions and economic benefits vs. potential long-term resilience of forest ecosystem carbon. However, the resilience of C stocks is not the only concern to consider when deciding to salvage tree mortality. The ecological risks and the potential interaction with other natural and anthropogenic disturbance agents must also be considered (D'Amato et al., 2011; Leverkus and Castro, 2017; Leverkus et al., 2018).
Data Availability Statement
The datasets generated for this study are available on request to the corresponding author.
Author Contributions
JG and MD conceived of the study. JG, MD, and TB designed the study. EB provided database management, input on design of silvicultural treatments, and conducted forest growth and harvest models. JG wrote the first draft of the manuscript. MD, TB, and EB wrote sections of the manuscript and provided editorial comments on the entire manuscript. All authors approved the submitted version.
Funding
This project was supported by the Northeastern States Research Cooperative (NSRC) through funding made available by the USDA Forest Service. The conclusions and opinions in this paper are those of the authors and not of the NSRC, the Forest Service, or the USDA. Partial funding was provided to JG and MD by the New Hampshire Agricultural Experiment Station. This is Scientific Contribution Number 2847. This work was supported by the USDA National Institute of Food and Agriculture McIntire-Stennis Projects #1010675 (JG) and #1020142 (MD).
Conflict of Interest
TB was employed by the company Spatial Informatics Group, LLC.
The remaining authors declare that the research was conducted in the absence of any commercial or financial relationships that could be construed as a potential conflict of interest.
Acknowledgments
Three reviewers improved this manuscript through thoughtful comments and suggested edits.
Supplementary Material
The Supplementary Material for this article can be found online at: https://www.frontiersin.org/articles/10.3389/ffgc.2020.00014/full#supplementary-material
References
Barrette, J., Thiffault, E., Saint-Pierre, F., Wetzel, S., Duchesne, I., and Krigstin, S. (2015). Dynamics of dead tree degradation and shelf-life following natural disturbances: can salvaged trees from boreal forests “fuel” the forestry and bioenergy sectors? Forestry 88, 275–290. doi: 10.1093/forestry/cpv007
Bechtold, W. A., and Patterson, P. L. (2015). The Enhanced Forest Inventory and Analysis Program—National Sampling Design and Estimation Procedures, Gen. Tech. Rep. SRS-80. Asheville, NC: U.S. Department of Agriculture, Forest Service, Southern Research Station. p. 85. doi: 10.2737/SRS-GTR-80
Belair, E. P., and Ducey, M. J. (2018). Patterns in forest harvesting in New England and New York: using FIA data to evaluate silvicultural intent. J. For. 116, 273–282. doi: 10.1093/jofore/fvx019
Bentsen, N. S. (2017). Carbon debt and payback time—lost in the forest? Renew. Sustain. Energy Rev. 73, 1211–1217. doi: 10.1016/j.rser.2017.02.004
Blais, J. R. (1983). Trends in the frequency, extent, and severity of spruce budworm outbreaks in eastern Canada. Can. J. For. Res. 13, 539–547. doi: 10.1139/x83-079
Buchholz, T., Gunn, J. S., and Saah, D. S. (2017). Greenhouse gas emissions of local wood pellet heat from northeastern US forests. Energy 141, 483–491. doi: 10.1016/j.energy.2017.09.062
Buchholz, T., Hurteau, M. D., Gunn, J., and Saah, D. (2016). A global meta-analysis of forest bioenergy greenhouse gas emission accounting studies. GCB Bioenergy 8, 281–289. doi: 10.1111/gcbb.12245
Canadian Forest Service. (2018). The State of Canada's Forests. Annual Report 2018. Ottawa, ON. Available online at: http://cfs.nrcan.gc.ca/pubwarehouse/pdfs/39336.pdf (accessed October 10, 2019).
D'Amato, A. W., Fraver, S., Palik, B. J., Bradford, J. B., and Patty, L. (2011). Singular and interactive effects of blowdown, salvage logging, and wildfire in sub-boreal pine systems. For. Ecol. Manage. 262, 2070–2078. doi: 10.1016/j.foreco.2011.09.003
Dixon, G. E. (2002). Essential FVS: A User's Guide to the Forest Vegetation Simulator. Internal Rep. Fort Collins, CO: U. S. Department of Agriculture, Forest Service, Forest Management Service Center. p. 226.
Dobor, L., Hlásny, T., Rammer, W., Zimov,á, S., Barka, I., and Seidl, R. (2019). Is salvage logging effectively dampening bark beetle outbreaks and preserving forest carbon stocks? J. Appl. Ecol. 57, 67–76. doi: 10.1111/1365-2664.13518
Dymond, C. C., Neilson, E. T., Stinson, G., Porter, K., MacLean, D. A., Gray, D. R., et al. (2010). Future spruce budworm outbreak may create a carbon source in eastern Canadian Forests. Ecosystems 13, 917–931. doi: 10.1007/s10021-010-9364-z
Fei, S., Morin, R. S., Oswalt, C. M., and Liebhold, A. M. (2019). Biomass losses resulting from insect and disease invasions in US forests. Proc. Natl. Acad. Sci. U. S. A. 116, 17371–17376. doi: 10.1073/pnas.1820601116
Foster, D. R., and Orwig, D. A. (2006). Preemptive and salvage harvesting of New England forests: when doing nothing is a viable alternative. Conserv. Biol. 20, 959–970. doi: 10.1111/j.1523-1739.2006.00495.x
Gunn, J. S., and Buchholz, T. (2018). Forest sector greenhouse gas emissions sensitivity to changes in forest management in Maine (USA). Forestry. 91, 526–538. doi: 10.1093/forestry/cpy013
Gustavsson, L., Madlener, R., Hoen, H. F., Jungmeier, G., Karjalainen, T., Klöhn, S., et al. (2006). The role of wood material for greenhouse gas mitigation. Mitig. Adapt. Strateg. Glob. Chang. 11, 1097–1127. doi: 10.1007/s11027-006-9035-8
Hennigar, C., Amos-binks, L., Maclean, D. A., Cameron, R., Gunn, J., and Twery, M. (2013). ForGATE - A Forest Sector Greenhouse Gas Assessment Tool for Maine: Calibration and Overview Gen. Tech. Rep. NRS-116. Newtown Square, PA: U.S. Department of Agriculture, Forest Service, Northern Research Station. p. 54.
Hennigar, C. R., and MacLean, D. A. (2010). Spruce budworm and management effects on forest and wood product carbon for an intensively managed forest. Can. J. For. Res. 40, 1736–1750. doi: 10.1139/X10-104
Hennigar, C. R., Wilson, J. S., MacLean, D. A., and Wagner, R. G. (2011). Applying a spruce budworm decision support system to Maine: projecting spruce-fir volume impacts under alternative management and outbreak scenarios. J. For. 109, 332–342. doi: 10.1093/jof/109.6.332
Hood, P. R., Nelson, K. N., Rhoades, C. C., and Tinker, D. B. (2017). The effect of salvage logging on surface fuel loads and fuel moisture in beetle-infested lodgepole pine forests. For. Ecol. Manage. 390, 80–88. doi: 10.1016/j.foreco.2017.01.003
Hoover, C. M., and Rebain, S. A. (2011). Forest Carbon Estimation Using the Forest Vegetation Simulator: Seven Things You Need to Know. Gen. Tech. Rep. NRS-77. Newtown Square, PA: U.S. Department of Agriculture, Forest Service, Northern Research Station. p. 16.
IPCC (2006). “2006 IPCC guidelines for National Greenhouse Gas Inventories,” in Volume 4: Agriculture, Forestry and Other Land Use, eds H. S. Eggleston, L. Buendia, K. Miwa, T. Ngara, and K. Tanabe (Hayama: IPCC).
Krebs, J., Pontius, J., and Schaberg, P. G. (2017). Modeling the impacts of hemlock woolly adelgid infestation and presalvage harvesting on carbon stocks in northern hemlock forests. Can. J. For. Res. 47, 727–734. doi: 10.1139/cjfr-2016-0291
Kucera, D. R., and Orr, P. W. (1981). Spruce Budworm in the Eastern United States. Forest Insect & Disease Leaflet 160. Broomall, PA: U.S. Department of Agriculture, Forest Service, Northern Area State & Private Forestry.
Leverkus, A. B., and Castro, J. (2017). An ecosystem services approach to the ecological effects of salvage logging: valuation of seed dispersal. Ecol. Appl. 27, 1057–1063. doi: 10.1002/eap.1539
Leverkus, A. B., Lindenmayer, D. B., Thorn, S., and Gustafsson, L. (2018). Salvage logging in the world's forests: interactions between natural disturbance and logging need recognition. Glob. Ecol. Biogeogr. 27, 1140–1154. doi: 10.1111/geb.12772
Lorimer, C. G. (1977). The presettlement forest and natural disturbance cycle of Northeastern Maine. Ecology 58, 139–148. doi: 10.2307/1935115
MacLean, D. A. (1996). Forest management strategies to reduce spruce budworm damage in the Fundy Model Forest. For. Chron. 72, 399–405. doi: 10.5558/tfc72399-4
Maine Forest Service. (2016). 2015 Silvicultural Activities Report. Augusta, ME. Available online at: http://www.maine.gov/tools/whatsnew/attach.php?id=723278&an=1 (accessed October 10, 2019).
Maine Forest Service. (2019). Spruce Budworm in Maine 2018. Augusta, ME. Available online at: https://www.sprucebudwormmaine.org/wp-content/uploads/2019/06/MFS_2018_SpruceBudwormMaineReport.pdf (accessed October 10, 2019).
Maser, C., Anderson, R., Cromack, K. Jr., Williams, J., and Martin, R. E. (1979). “Dead and down woody material,” in Wildlife Habitats in Managed Forests, the Blue Mountains of Oregon and Washington, ed J. W Thomas (Washington, DC: USDA Forest Service), 79–85.
Mattson, W. J., Simmons, G. A., and Witter, J. A. (1988). “The spruce budworm in Eastern North America,” in Dynamics of Forest Insect Populations, ed A. A. Berryman (Boston, MA: Springer), 309–330. doi: 10.1007/978-1-4899-0789-9_16
Nunery, J. S., and Keeton, W. S. (2010). Forest carbon storage in the northeastern United States: net effects of harvesting frequency, post-harvest retention, and wood products. Forest Ecol. Manag. 259, 1363–1375. doi: 10.1016/j.foreco.2009.12.029
O'Hara, K. L., and Ramage, B. S. (2013). Silviculture in an uncertain world: utilizing multi-aged management systems to integrate disturbance. Forestry 86, 401–410. doi: 10.1093/forestry/cpt012
Raymer, P. C. L., Orwig, D. A., and Finzi, A. C. (2013). Hemlock loss due to the hemlock woolly adelgid does not affect ecosystem C storage but alters its distribution. Ecosphere 4, 1–16. doi: 10.1890/ES12-00362.1
Rebain, S. A. (2015). The Fire and Fuels Extension to the Forest Vegetation Simulator: Updated Model Documentation. Internal Rep. Fort Collins, CO: U. S. Department of Agriculture, Forest Service, Forest Management Service Center. p. 403.
Sainte-Marie, G. B., Kneeshaw, D. D., Maclean, D. A., and Hennigar, C. R. (2015). Estimating forest vulnerability to the next spruce budworm outbreak: will past silvicultural efforts pay dividends? Can. J. For. Res. 324, 314–324. doi: 10.1139/cjfr-2014-0344
Smith, J. E., Heath, L. S., Skog, K. E., and Birdsey, R. (2006). Methods for calculating forest ecosystem and harvested carbon with standard estimates for forest types of the United States. USDA North. Res. Stn. NE-343, 1–216. doi: 10.2737/NE-GTR-343
Solomon, D. S., Zhang, L. J., Brann, T. B., and Larrick, D. S. (2003). Mortality patterns following spruce budworm infestation in unprotected spruce-fir forests in Maine. North. J. Appl. For. 20, 148–153. doi: 10.1093/njaf/20.4.148
Spence, C. E., and MacLean, D. A. (2012). Regeneration and stand development following a spruce budworm outbreak, spruce budworm inspired harvest, and salvage harvest. Can. J. For. Res. 42, 1759–1770. doi: 10.1139/x2012-121
Thorn, S., Bässler, C., Brandl, R., Burton, P. J., Cahall, R., Campbell, J. L., et al. (2018). Impacts of salvage logging on biodiversity: a meta-analysis. J. Appl. Ecol. 55, 279–289. doi: 10.1111/1365-2664.12945
US Environmental Protection Agency (2017). Inventory of U.S. Greenhouse Gas Emissions and Sinks: 1990–2015. Washington, DC: U.S. Environmental Protection Agency.
Wagner, R. G., Bryant, J., Burgason, B., Doty, M., Roth, B. E., Strauch, P., et al. (2016). Coming Spruce Budworm Outbreak: Initial Risk Assessment and Preparation & Response Recommendations for Maine's Forestry Community. Orono, ME: Cooperative Forestry Research Unit, University of Maine, 77.
Walker, T., Cardellichio, P., Gunn, J. S., Saah, D. S., Hagan, J. M., David, S., et al. (2013). Carbon accounting for woody biomass from Massachusetts (USA) managed forests : a framework for determining the temporal impacts of wood biomass energy on atmospheric greenhouse gas levels. J. Sustain. For. 32, 130–158. doi: 10.1080/10549811.2011.652019
Williams, C. A., Gu, H., MacLean, R., Masek, J. G., and Collatz, G. J. (2016). Disturbance and the carbon balance of US forests: a quantitative review of impacts from harvests, fires, insects, and droughts. Glob. Planet. Change 143, 66–80. doi: 10.1016/j.gloplacha.2016.06.002
Williams, D. W., and Birdsey, R. A. (2003). Historical Patterns of Spruce Budworm Defoliation and Bark Beetle Outbreaks in North American Conifer Forests:\nAn Atlas and Description of Digital Maps. Gen. Tech. Rep. NE-308. Newtown Square, PA: U. S. Department of Agriculture Forest Service. p. 35. doi: 10.2737/NE-GTR-308
Woodall, C. W., Walters, B. F., Coulston, J. W., D'Amato, A. W., Domke, G. M., Russell, M. B., et al. (2015). Monitoring network confirms land use change is a substantial component of the forest carbon sink in the Eastern United States. Sci. Rep. 5:17028. doi: 10.1038/srep17028
Yaussy, D. A. (2000). Comparison of an empirical forest growth and yield simulator and a forest gap simulator using actual 30-year growth from two even-aged forests in Kentucky. For. Ecol. Manage. 126, 385–398. doi: 10.1016/S0378-1127(99)00111-5
Keywords: spruce budworm, forest carbon, salvage harvesting, life cycle assessment, resilience
Citation: Gunn JS, Ducey MJ, Buchholz T and Belair EP (2020) Forest Carbon Resilience of Eastern Spruce Budworm (Choristoneura fumiferana) Salvage Harvesting in the Northeastern United States. Front. For. Glob. Change 3:14. doi: 10.3389/ffgc.2020.00014
Received: 11 October 2019; Accepted: 30 January 2020;
Published: 18 February 2020.
Edited by:
Thomas Cordonnier, National Research Institute of Science and Technology for Environment and Agriculture (IRSTEA), FranceReviewed by:
Thomas J. Dean, Louisiana State University, United StatesMatija Klopčič, University of Ljubljana, Slovenia
Mark E. Harmon, Oregon State University, United States
Copyright © 2020 Gunn, Ducey, Buchholz and Belair. This is an open-access article distributed under the terms of the Creative Commons Attribution License (CC BY). The use, distribution or reproduction in other forums is permitted, provided the original author(s) and the copyright owner(s) are credited and that the original publication in this journal is cited, in accordance with accepted academic practice. No use, distribution or reproduction is permitted which does not comply with these terms.
*Correspondence: John S. Gunn, am9obi5ndW5uQHVuaC5lZHU=