 James W. Roche
 Qin Ma2,3
 Roger C. Bales
- 1National Park Service, Torrey, UT, United States
- 2Department of Forestry, Mississippi State University, Starkville, MS, United States
- 3Sierra Nevada Research Institute, University of California, Merced, Merced, CA, United States
- 4School of Engineering, University of California, Merced, Merced, CA, United States
We assessed the response of densely forested watersheds with little apparent annual water limitation to forest disturbance and climate variability, by studying how past wildfires changed forest evapotranspiration and what past evapotranspiration patterns imply for the availability of subsurface water storage for drought resistance. We determined annual spatial patterns of evapotranspiration using a top–down statistical model, correlating measured annual evapotranspiration from eddy-covariance towers across California with normalized difference vegetation index (NDVI) measured by satellite and with annual precipitation. The study area was the Yuba and American River watersheds, two densely forested watersheds in the northern Sierra Nevada. Wildfires in the 1985–2015 period resulted in significant post-fire reductions in evapotranspiration for at least 5 years and in some cases for more than 20 years. The levels of biomass removed in medium-intensity fires (25–75% basal area loss), similar to magnitudes expected from forest treatments for fuel reduction and forest health, reduced evapotranspiration by as much 150–200 mm year−1 for the first 5 years. Rates of recovery in post-wildfire evapotranspiration confirm the need for follow-up forest treatments at intervals of 5–20 years to sustain lower evapotranspiration, depending on local landscape attributes and interannual climate. Using the metric of cumulative precipitation minus evapotranspiration (P-ET) during multiyear dry periods, we found that forests in the study area showed little evidence of moisture stress during the 1985–2018 period of our analysis, owing to relatively small reliance on interannual subsurface water storage to meet dry-year evapotranspiration needs of vegetation. However, more severe or sustained drought periods will push some lower-elevation forests in the area studied toward the cumulative P-ET thresholds previously associated with widespread forest mortality in the southern Sierra Nevada.
Introduction
Understanding and predicting how forests respond to disturbance is important for managing source-water areas, particularly in semiarid climates, which have a high ratio of evapotranspiration to precipitation. This is an immediate concern where a combination of a warming climate and past management has contributed to: (i) high wildfire extent and intensity (McKenzie et al., 2004; Westerling, 2006; North et al., 2015a), (ii) drought-related forest mortality (Allen et al., 2010; Anderegg et al., 2013, 2015; Bales et al., 2018), and (iii) reduced runoff (Barnett et al., 2005; Goulden and Bales, 2014). The response of evapotranspiration to disturbance and interannual changes in temperature and precipitation is relatively muted compared to runoff, making it a potentially convenient metric for changes in water balance from forest management. Thus, it is urgent to improve our understanding and accurate mapping of evapotranspiration response to changes in forest vegetation, which dominates that response (Bosch and Hewlett, 1982; Naudts et al., 2016; Saksa et al., 2017).
As forests are dynamic systems, water use by forests can respond in multiple ways to reductions in biomass (Tague et al., 2018). For example, Saksa et al. (2019) reported a significant reduction in evapotranspiration following fuel treatment in a densely forested central Sierra Nevada area but no significant reduction in a comparable but more water-limited southern Sierra area. In the southern site, reductions in forest biomass apparently stimulated growth of remaining vegetation. Forest regrowth following disturbance is also quite variable (Tague et al., 2013; Roche et al., 2018; Tague and Moritz, 2019).
While multiple interacting and non-linear factors affect evapotranspiration, as reflected in physics-based models (Running et al., 1987; Chen et al., 2005) and bottom–up modeling blended with remote-sensing data (Mu et al., 2011; Baldocchi et al., 2019), it is also possible to consider their net effects in top–down approaches, particularly over multiyear timescales (Sivapalan et al., 2003). With the advent of high-confidence spatial-evapotranspiration estimates driven by a robust empirical relation between satellite-derived estimates of vegetation greenness, represented by normalized difference vegetation index (NDVI), and point measurements of evapotranspiration in a variety of ecosystems (Goulden et al., 2012; Goulden and Bales, 2019), it is possible to estimate the water balance with high spatial resolution across forested mountain landscapes. In the context of forest management, this tool permits estimation of evapotranspiration change resulting from past fuel treatments and wildfire (Roche et al., 2018), and projecting changes from future treatments and disturbance. This data-driven, top–down statistical approach complements more-detailed bottom–up hydrologic modeling, which generally uses precipitation and streamflow as the main state variables to infer changes in evapotranspiration as forest vegetation changes (Zierl et al., 2007). The empirical–statistical approach is also attractive for basin-scale or smaller studies, where remote-sensing-based evapotranspiration products that were largely designed for global and large regional applications perform poorly (Goulden et al., 2012).
Furthermore, extending the work of Fellows and Goulden (2017), it is possible to map the spatial variability in the amount of subsurface water storage required to sustain evapotranspiration during both dry seasons and during multiyear droughts, thereby identifying areas with greater or lesser drought resistance and/or potential benefit from thinning treatments (Klos et al., 2018; Rungee et al., 2019).
Forest management for fuel treatments in the Sierra Nevada and other overstocked forests is widely regarded as a necessary step to reduce the probability of high-intensity wildfire, restore forest health, and return forests to a more-sustainable condition following a century of fire suppression (Miller et al., 2012; North et al., 2015a). While fuels and forest-health concerns may be the primary drivers for fuel treatments, other benefits can be important contributors to the collaborations needed to implement forest-restoration projects. Valuing and monetizing water-related benefits requires credible, accessible metrics for both planning and verification.
The aim of the research reported here is to assess the response of densely forested mountain watersheds with little apparent annual water limitation to forest disturbance and climate variability. Two questions motivated this work. First, what changes in evapotranspiration and water balance across these densely forested areas have occurred from historical disturbances by wildfire and post-fire regrowth. Second, what magnitude of subsurface water storage have these forests historically used to continue growth during seasonally and multiyear dry periods, and what future vulnerabilities do the spatial patterns of these water balances reveal.
Methods
In the analysis of water-balance changes from wildfire, we focused on evapotranspiration (ET) patterns in the Yuba and American River watersheds (Figure 1), two densely forested basins with significant annual runoff and multiple downstream services that depend on that runoff, yet high potential for severe wildfire and disruption of those services. Vegetation in the study area goes from grassland and oak savannah at lower elevations, through pine-oak forest, mixed-conifer forest, and subalpine at higher elevations. The 4,825 km2 American basin experienced five wildfires over 4,000 ha (9,884 ac) in area during our 1985–2018 study period, with the largest being the 2014 King Fire (37,315 ha) (Tables S1, S2). Much of the area burned in these large fires was in dense, productive mixed-conifer forests, with overall wildfire elevations spanning 600–2,200 m. Only one fire over 4,000 ha occurred in the 2,870 km2 Yuba, the 1999 Pendola Fire (4,408 ha, 467–1,028 m elevation). There were several smaller fires in both watersheds. Using California Wildlife Habitat Relationship System data (https://wildlife.ca.gov/Data/CWHR), 77% of burned area may be classed as mixed conifer (Sierra mixed conifer, white fir, Jeffrey pine, ponderosa pine, montane-hardwood-conifer, montane chaparral), 15% is montane hardwood, and 3% is perennial grasslands (Figure 1).
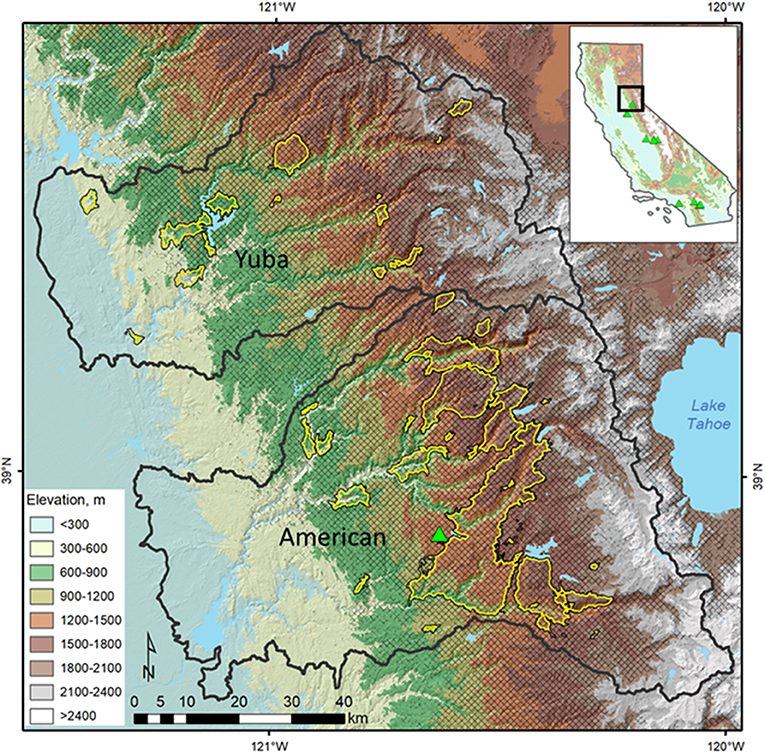
Figure 1. Study area shaded by 300-m elevation bands. Fire perimeters (yellow–black outlines) are all fires to occur in the Yuba and American watersheds >50 ha (1985–2017). Cross-hatching indicates the extent of mixed conifer forest. Inset depicts the study location within the state of California, USA. Green triangles on insert and main map show locations of flux towers used in this study.
We determined annual spatial patterns of evapotranspiration using a top–down statistical model (Goulden and Bales, 2014, 2019) and used published gridded data for precipitation (P). Using a pixel-by-pixel annual water balance (P = ET + Q – ΔS), we evaluated spatial values of P – ET to estimate gridded runoff (Q) and change in annual subsurface storage (ΔS) following Bales et al. (2018). We evaluated the basin-scale water balance by summing P – ET across each basin and comparing with published values of whole-basin runoff.
We examined the impact that wildfire has had on evapotranspiration using the methods of Roche et al. (2018) and estimated the spatial patterns of subsurface water demand using the methods of Fellows and Goulden (2017). Finally, we show how this approach can be used to project potential evapotranspiration reductions for the level of fuel treatments proposed to restore forests to a more-sustainable state.
Gridded Evapotranspiration
To prepare components of the water balance for the Yuba-American region, we first assembled water-year (October–September) annual means of NDVI from Landsat data for 1985–2018. Annual means incorporated US Geological Survey (USGS) Landsat Collection 1 Tier 1 surface-reflectance data (30-m resolution) from Landsat 5 (1985–2011), Landsat 7 (2012–2013), and Landsat 8 (2014–2018) missions, filtered for clouds, cloud shadows, water, and snow. Additional filtering for shadows was accomplished by masking pixels for which values in the red, shortwave infrared 1, and shortwave infrared 2 bands were <1%, and values in the infrared band were <5% reflectance. All NDVI grids derived from Landsat 7 (L7ETM+) and Landsat 8 (L8OLI) were then homogenized to Landsat 5 Thematic Mapper (L5TM) using the methods of Su et al. (2017), by the following equations:
Assembling the NDVI means and homogenization was completed in the Google Earth Engine cloud-computing environment (Gorelick et al., 2017), and products were exported for further processing as described below.
Annual mean NDVI raster datasets were converted to estimates of annual evapotranspiration building on the methods of Goulden et al., who provide rationale for using a statistical vs. energy-balance approach to extrapolate ET in complex terrain like that found in the Sierra Nevada (Goulden et al., 2012). They note that previous investigators have shown that in semiarid regions, a site's water balance, leaf area index (LAI), primary production, and annual ET are tightly correlated through a series of feedbacks, with a high LAI both driving a high annual ET and symptomatic of a location with a high ET (Grier and Running, 1977; Gholz, 1982). They also note that LAI has been shown to be well-correlated with NDVI (Carlson and Ripley, 1997), creating a tight relationship between NDVI and ET, with previous studies confirming a strong correlation between annual ET and NDVI across semiarid landscapes (Groeneveld et al., 2007). Goulden et al. (2012) further note that, alternatively, physically based approaches to scaling ET require spatially resolved radiation, temperature, humidity, wind speed, and other attributes that vary markedly over small distances, making extrapolation of montane meteorological conditions to fine scale highly uncertain. We thus use their simpler approach of regressing ET against a vegetation index.
Because our focus is on wetter regions than most of the calibration data used in previous studies, we extended the calibration to include three sites with higher precipitation that are in or near the study area (see Supplement Material for details). Specifically, we evaluated two calibrations: (i) an extension of the two-parameter exponential regression used previously (Bales et al., 2018; Roche et al., 2018) that has been applied previously for disturbance analysis and (ii) a multiple regression using NDVI and precipitation aimed at better representing basin-wide water balance. Using leave-one-out cross-validation to assess the model temporal sensitivity, we found that most predictions fall within ±100 mm year−1 of measurements, with the main exceptions being points at high NDVI where saturation is an issue (see Figures S1, S2 for data and calibrations).
Eddy covariance is a well-accepted measurement method, yet it remains important to consider uncertainties. Analysis of cumulative ET and carbon dioxide (CO2) fluxes shows that there is no single definition or single cause of uncertainty (Goulden, 1996). The uncertainty in ET fluxes, estimated to be up to 10%, is driven by uncertainty in the assumption that the Bowen ratio is correct, uncertainty in soil and other heat-storage terms, and to a lesser extent, net radiation. Sampling uncertainty should be ~5%, similar to that estimated for CO2. Thus, the uncertainty of annual ET from an individual tower is as much as 15%. This uncertainty should be random from tower to tower and, to a lesser extent, year to year, so the overall uncertainty should be less for the full dataset. Calibration with NDVI may introduce another 5%, leading to an overall uncertainty in the model of at least 10% but <20%.
Fire Effects on Evapotranspiration
Using the estimate of annual ET derived above, we estimated the elevational and cumulative ET effects of large fires, >50 ha, as assembled by Region 5 of the US Forest Service (1990–2017; https://www.fs.usda.gov/Internet/FSE_DOCUMENTS/fseprd596284.zip) in these watersheds using the methods of Roche et al. (2018). Fire statistics are shown in Tables S1, S2. We chose to examine the impacts of fires for 1990–2013 in order to incorporate a 5-years-before-fire estimate of ET from the Landsat record, which begins in 1985, and similarly estimate the 5-years-post-fire mean ET (up to the year 2018). Given that overlapping fire perimeters accounted for <2% of the area burned, we combined all fire polygons into a single layer, attributing overlap areas with information pertaining to the earliest fire to occur in the 1985–2017 period. This layer was overlain with a 100-m grid that was buffered from the fire perimeters by 75 m to minimize the influence of partially burned grid cells. Each grid cell was additionally attributed with the year of the fire, mean elevation, mean percent change in basal area 1-year post-fire using Miller et al. (2009) and Miller and Quayle (2015) (https://www.fs.usda.gov/Internet/FSE_DOCUMENTS/fseprd596279.zip), and mean estimated ET for each water year. We created a similar database of unburned 100 × 100 m polygons that comprised 20% of forested area in each watershed over the period 1985–2018. A polygon was designated “forested” if the majority of 30-m grid cells intersected by the polygon were classified as forest (deciduous, evergreen, or mixed-forest classes) in the 2011 USGS National Land Cover Database (Homer et al., 2015). The actual change in ET for each grid cell was estimated for each year post-fire until post-fire ET equaled or exceeded pre-fire ET, or until 2018:
Estimates of the unburned control ET were a mean of all unburned polygons in a 500-m elevation band centered on each burned grid cell in each major watershed.
Using this dataset, we then estimated changes in evapotranspiration by forest basal area reduction (burn severity) class (0–25%, 25–50%, 50–75%, and 75–100%) and elevation (by 100-m elevation band) by comparing the 5-year post-fire mean ET with the 5-year pre-fire mean ET. We also estimated net annual evapotranspiration change across all burned areas for the period 1990–2018 as well as recovery rates by burn-severity class as reported by the US Forest Service (USFS).
Subsurface Water Balance
In order to estimate the amount of soil water extracted from storage each year, we used the methods of Fellows and Goulden (2017), which follows methods outlined by Lutz et al. (2010). The steps are as follows: (i) estimate monthly water input to the soil water index using monthly 800-m parameter-elevation relationships on independent slopes model (PRISM Climate Group, 2019) precipitation data and an estimate of snowmelt (see Lutz et al., 2010), (ii) calculate monthly potential evaporation (PET) using monthly mean temperature from PRISM and the modified Hamon (1963) method employed by Lutz et al. (2010), and (3) combining estimates of actual evapotranspiration from NDVI regression with water indices and PET, by subtracting the annual sum of monthly minimums of water indices and PET from ET values. All calculations were done at 30-m resolution. We used the time series of PRISM precipitation data at a resolution of 800 m for the study period. We downsampled these layers to 30 m by nearest-neighbor interpolation, summed by water year, and aligned the resulting grids with the above ET raster. We averaged daily minimum and maximum temperature using 800-m PRISM data, then created monthly means, and finally downsampled the monthly temperature layers to 30 m by nearest-neighbor interpolation. Estimates of PET using the method of Hamon as outlined in Dingman (2002) were modified as follows:
where 1.265 is a tuning factor used by Fellows and Goulden (2017) to minimize bias between PET and ET datasets. Snowpack was set to zero each year, i.e., no year-to-year carryover of snowpack storage. Finally, we determined the maximum withdrawal from storage for each grid cell over the 1985–2018 period, which may be considered the minimum amount of subsurface water-storage capacity.
Basin-Scale Annual and Interannual Water Balance
We derived annual rasters of P-ET, an estimate of the amount of water available for runoff or storage recharge (excess) or the amount of water required from storage (deficit) to maintain estimated annual ET. Starting with the 1985 P-ET grid, we then tracked interannual use of water in storage by summing P-ET in each cell year by year. Negative values of P-ET, which indicate withdrawal from storage, were retained in any given year, and positive values, indicating no withdrawal, were set to zero. In order to estimate a maximum amount of storage water used in any pixel during the 1985–2018 period, we extracted the lowest negative P-ET value from all storage-water-use grids.
We compared water-balance components using the above grids with full natural flow for the Yuba (Yuba River at Smartville, ID=YRS, California Data Exchange Center, 2019) and American (American River at Folsom, ID=AMF, California Data Exchange Center, 2019) River watersheds using the methods of Bales et al. (2018). For each watershed, we extracted annual P, ET, and depth of water extracted from soil storage (ΔS). The latter was determined as the mean of all grid cells where P-ET was negative. These components were compared to full natural flow (Q), using the annual water balance: P = ET+Q−S.
Results
ET and Precipitation by Elevation Band
Evapotranspiration values peak in the Yuba and American at 700–800 mm year−1 around the 1,100–1,200 m elevation, whereas precipitation peaks at elevations closer to 1,600–2,000 m (Figure 2). Average precipitation (±stdev) is higher in the Yuba (1,479 ± 500), peaking near 1,800 mm year−1 at 2,000 m elevation, compared to the American (1,228 ± 430 mm year−1), peaking near 1,500 mm year−1 at 1,700 m elevation. Volumetric runoff was calculated based on area per elevation band times runoff depth and comes mainly from 800 to 2,100 m elevation in the Yuba and 500–2,100 m in the American (Figure 2). Evapotranspiration varied little between wet vs. dry years, averaging about 675 ± 57 mm across the Yuba and 619 ± 54 mm in the American. The large interannual differences in precipitation, indicated by the coefficient of variation (CV) were amplified to give even larger relative interannual differences in P-ET. CV averaged 0.35 for precipitation and 0.63 for P-ET across the two basins, whereas ET is similar in wet vs. dry years (CV = 0.09) (see also Figures S4, S5).
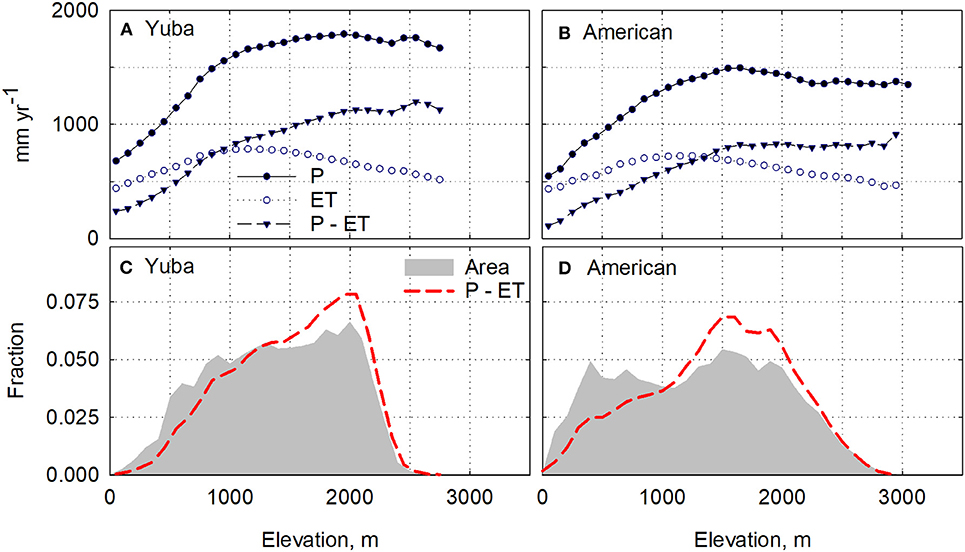
Figure 2. Elevational distribution of mean precipitation (P) and evapotranspiration (ET), and P-ET in the (A) Yuba and (B) American River watersheds by 100-m elevation bin for the period 1985–2018. Basin-area fraction and volume fraction of P-ET in each 100-m band are shown on (C,D). Volume fraction was calculated from depth and area fractions on (A,B) see Figure S5 for annual values for an average, wet, and dry year.
Effect of Fire on ET
Reduced evapotranspiration due to all forest fires in the study area between 1990 and 2013 varied with respect to elevation and basal area change (Figure 3). The mean annual ET during the 5 years post-fire was reduced approximately 30–100 mm year−1 for each additional 25% reduction in basal area, between 750 and 2,100 m elevation. This is most apparent in the American watershed, which had over four times the area burned as did the Yuba (42,299 vs. 9,850 ha) during this period (Tables S1, S2). Note that ET reduction varies within each burn-severity class, as illustrated for the 50–75% basal area reduction class.
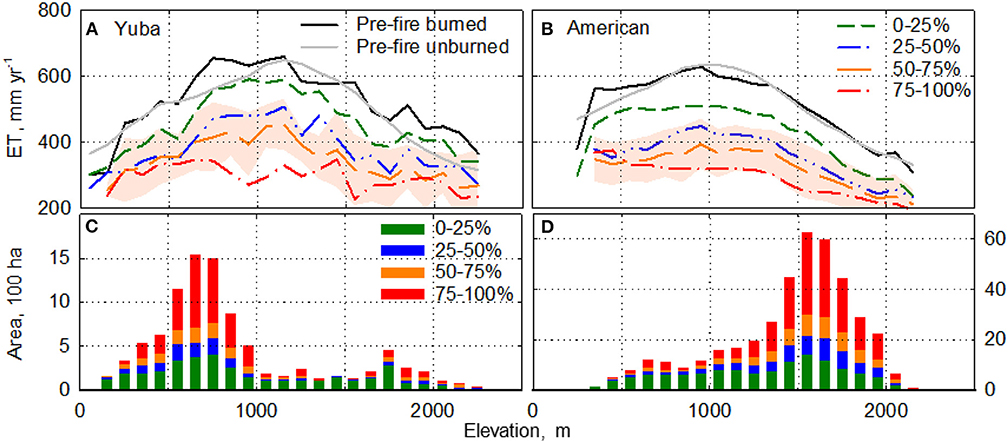
Figure 3. Elevational dependence of 5-year mean evapotranspiration (ET) post-forest fire, for fires in the period 1990–2013, categorized by basal area reduction (fire-severity class): (A) Yuba and (B) American watersheds. Solid black line is pre-fire ET, and solid gray line is control (unburned) area. Shaded area illustrates the standard deviation around the 50–75% basal area reduction line. Other standard deviations are similar. Panels (C) Yuba and (D) American depict the burned area by basal area reduction quartile class (note the different ordinate scales).
Post-fire recovery rates of ET were most rapid in the first 5 years, with approximate rates of 7–10 mm year−1, 7–13 mm year−1, and 9–13 mm year−1 for 0–25, 25–75, and 75–100% basal area reduction, respectively (Figure 4). Evapotranspiration rates stabilized after 12 years in the Yuba and 15 years in the American. At 20 years post-fire, there remained 50–90 mm year−1 ET reduction in the higher burn-severity classes in the American, while little post-fire effect was evident in the Yuba. Note that this analysis aggregated results over all fires analyzed; and variability in recovery rates within a severity class is quite large.
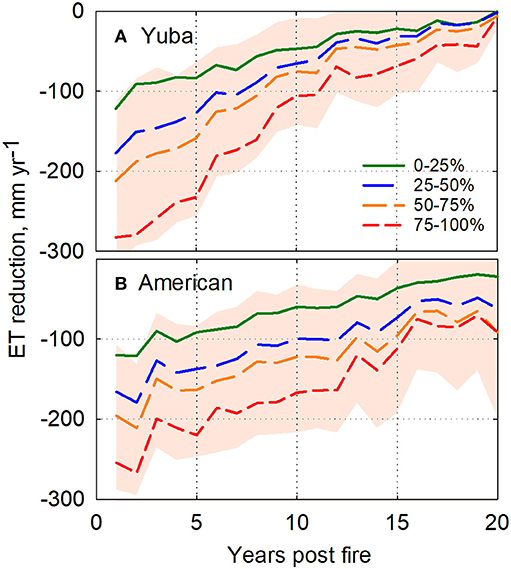
Figure 4. Time series of mean post-fire evapotranspiration (ET) reduction by fire-severity class or post-fire response of ET, for the (A) Yuba and (B) American, 1990–2018. Plus and minus one standard deviation is shown for the 50–75% basal area-reduction class. Other standard deviations are similar.
Differences in evapotranspiration reduction by fire and post-fire recovery between fires are illustrated for four large fires on Figure 5. The high severity of the Pendola fire did not translate to above-average ET reduction, which was 50–200 mm year−1, increasing with severity class. The area experienced a moderately long period to recover to pre-fire ET levels, with an average of 10.75 years. The percent area recovered was very high, averaging 78%. The area of the Star Fire had similar ET reduction and has also experienced a high percentage of recovery, averaging 50%. This recovery took an average of 13 years, which is also comparatively high. Of particular note is that these recovery metrics are relatively consistent across severity classes, i.e., ET in areas burned at low severity did not recover at a faster rate than did those experiencing higher-severity fire. We hypothesize that this is due to the forest in areas experiencing lower severity being less dense to start with. For the American fire, the ET reduction was similar, and there was a consistently shorter period to recovery, under 5 years across all severity classes. The area recovered is also very low, with a maximum of 12%, and decreases with increasing severity class. The much larger King Fire had a very significant 5-year reduction in evapotranspiration, above 280 mm across all severity classes. It took 2 years to recovery for some areas in all severity classes, which is low. The area recovered is relatively high in the 25% severity class and decreases with increasing severity.
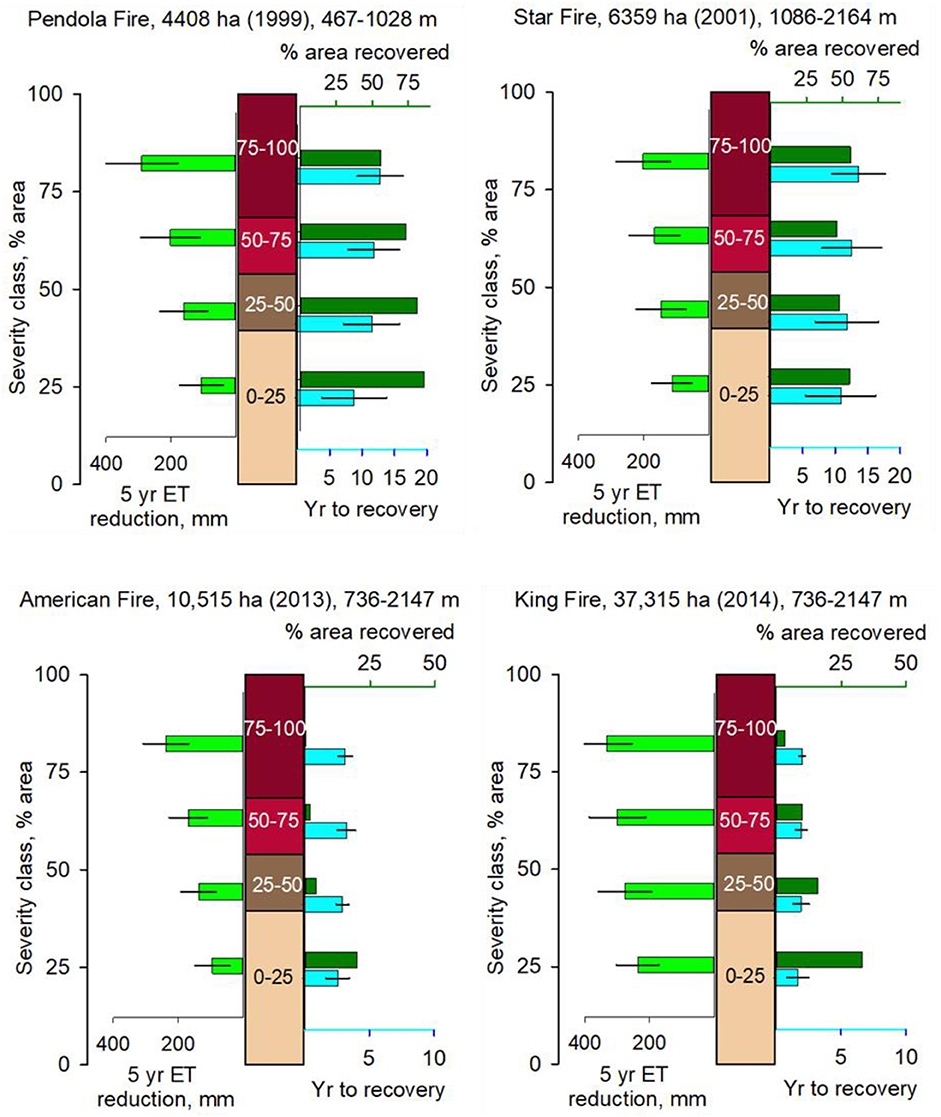
Figure 5. Evapotranspiration (ET) reduction and recovery to pre-fire levels for four large fires that burned with a range of severity classes. Center, vertical bar shows percent area of fire in each of the four severity classes. Bars on the left show ET reduction by fire (mean and standard deviation), averaged over 5 years post-fire, by severity class (highest bar is highest severity class). The four pairs of bars on right also correspond to the four severity classes, with the upper bar being area recovered and lower bar in each pair being years to recovery of pre-fire ET levels (mean and standard deviation); the number of years to recovery refers only to those grid cells where net ET change is greater than or equal to zero relative to pre-fire and unburned grid cell ET values (see Equation 5). The remaining grid cells had not recovered as of 2018. The proportion of mixed conifer for each fire is 73% (Pendola), 80% (Star), 83% (King), and 95% (American).
Summing total ET reduction from one year post fire until recovery to pre-fire levels, we estimated the cumulative ET reduction for the period 1986–2018 for areas that burned 1985–2013, by fire by severity class. While the data are somewhat noisy, even after aggregating to 500-m elevation bands, given lack of uniform fire coverage by severity class within each basin, it is apparent that cumulative ET reduction generally exceeds 1,200 mm for moderate fire severity (25–75% basal area reduction) in both basins and across a broad elevation range (500–2,200 m) (Figure 6). Values are generally higher in the American across all severity classes except in the 750-m band in the highest severity class, which is the result of a single large fire.
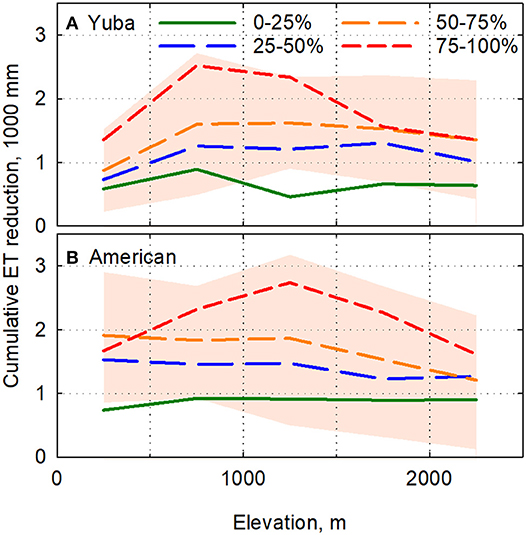
Figure 6. Cumulative evapotranspiration (ET) reduction by fire-severity class and 500-m elevation bins for the (A) Yuba and (B) American watersheds for fires 1985–2013. Plus and minus one standard deviation is shown for the 50–75% basal area reduction class. Other standard deviations are similar.
Summed over the whole basin, the cumulative volumetric evapotranspiration reduction due to fires in the American watershed is more than 15 times that in the Yuba due to the extensive area burned in the American, particularly since 2013 (Figure 7A). Prior to 2013, ET reduction in the American peaked in 2009 at just over 40 million m3 per year. This number more than tripled by 2015 due several large fires, including the American and King fires. The effect of the 2014 King Fire (largest polygon on Figure 1, running SSW to NNE in the center of the basin), is quite visible on the ET and P-ET maps for 2015 (Figure S4). The Yuba watershed exhibited about 5–10 million m3 reduction per year. The net ET reduction for burned areas ranged between 50 and 240 mm year−1 depending on the size, basal area reduction, and time since fire in each watershed (Figure 7B).
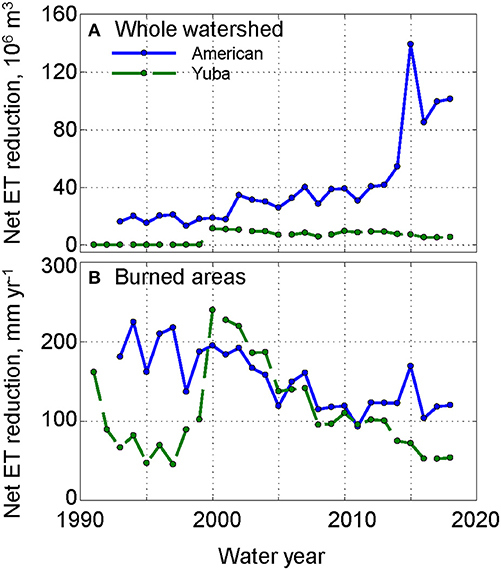
Figure 7. Change in evapotranspiration (ET): (A) net whole-basin volumetric change and (B) depth of ET reduction in burned areas (1990–2017) for each watershed.
Maximum Annual Soil Water Use for Evapotranspiration
Much of the forested area in the watershed apparently has historically used 450–600 mm year−1 of subsurface water during the summer dry season each year to meet annual ET demand (Figure 8). Forests in the north Yuba access greater than 600 mm year−1, while forests at the highest elevations in both watersheds access less subsurface water due to a limited growing season. Lower values of subsurface water use at lower elevations reflect less vegetation and drier conditions.
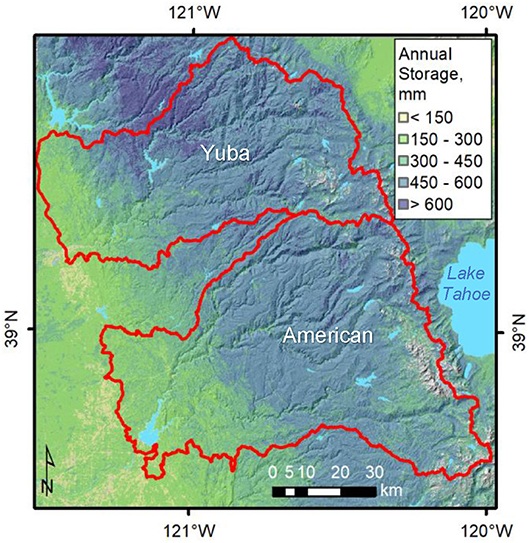
Figure 8. Maximum seasonal amount of subsurface water storage used for evapotranspiration in a single year for the period 1985–2018. Gray area is no data.
Annual and Interannual Water Balance
The maximum cumulative subsurface water accessed for evapotranspiration for any consecutive multiyear period (1985–2018) is depicted in Figure 9. A broad belt of substantial interannual subsurface use (200–300 mm year−1) is evident in the middle elevations of the American River watershed (~800–1,300 m), which is largely absent in the Yuba. Upper elevations of both watersheds exhibit little subsurface water accessed for evapotranspiration.
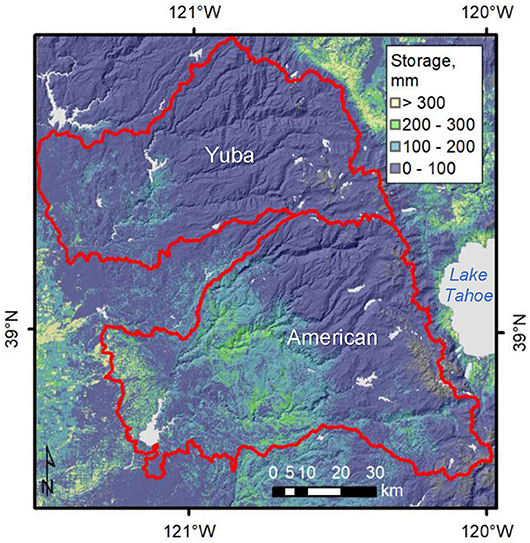
Figure 9. Maximum cumulative (interannual) evapotranspiration supplied by subsurface water storage for the study period (1985–2018), which is the maximum accumulated negative value of annual P-ET. Dark and light gray areas indicate no data and lakes, respectively.
Discussion
Disturbance and Management Effects on Water Balance
Declines in evapotranspiration make a greater fraction of annual precipitation available for runoff from source-water watersheds to downstream users. Disturbance by wildfire, managed fire, or mechanical thinning lowers evaporative demand, which is proportional to biomass amount, i.e., forest density. The amount that evaporative demand decreases, and the rate of growth in demand as vegetation regrows, also depends on the interaction of climate and geology. While reported fire severity, represented by basal area reduction, varies from fire to fire (Figure 5); these two densely forested watersheds give 5-year post-fire average values of about 65 ± 32 mm year−1 reduction (mean ± standard deviation) in ET for each 25% increase in basal area reduction class (Figure 3). The variability around the mean, shown for the 50–75% line, is expected given the heterogeneity in vegetation density, forest structure, species mix, and thus fire response across the basin. Differences in weather between different wildfires, plus landscape attributes, also contribute to the observed variability in wildfire response.
The lowest fire-intensity class, 0–25% reduction in basal area, may be considered equivalent to a relatively light management treatment but one that is realistic for areas where infrastructure or habitat limit actions. A fire in the two medium-intensity classes (25–75%) includes the range considered for restoration treatments. Our data reflect a 5-year mean decrease in ET of ~85 mm year−1 for 0–25% basal area removal vs. ~175 mm year−1 for a 25–75% basal area reduction (Figure 3). Again, variability across forest stands with different elevations, precipitation, subsurface-water storage, and pre-fire density, plus interannual variability in climate, give a standard deviation of ~50% of the mean. Still, these values provide planning scenarios rooted in historical data.
For comparison, it is useful to consider some broader assessments of data from other regions that reported changes in evapotranspiration with reductions in forest density. The broad synthesis of data by Zhang et al. (2001), using the Budyko framework, provides an indication of the potential water impacts of forest management. Using Equation 8 in Zhang et al. (2001) with the average annual precipitation for the two basins for the study period (1,479 mm for the Yuba and 1,228 mm for the American), a 50% reduction in forest cover, replaced by grassland vegetation, gives a 167 and 136 mm reduction in annual ET, respectively. Each 25% reduction in forest density provides about a 77-mm reduction in annual ET. These numbers are remarkably similar to the averages apparent in our data (Figure 3), which give an average of 68 mm year−1 across the study area, and ~83 mm year−1 for the elevations having the most area burned.
The large variability in rates of post-fire recovery of evapotranspiration toward pre-fire levels is also expected, given the variability of wildfire patterns across the different fires aggregated in this analysis, the interannual variability in climate following the different fires, and the heterogeneity of landscape attributes across the steep gradients in mountains such as the Sierra Nevada. While individual wildfires showed a range of ET recovery rates and amounts (Figure 5), an overall examination of post-fire evapotranspiration recovery amounts suggests little influence of precipitation and temperature (elevation), at least for the first 5 years post-fire (data not shown). Nevertheless, the consistency in rates for the two medium-intensity classes, especially in the American, 6.4 mm year−1, provide planning values based on past climate (Figure 4). Values in the Yuba were higher, 8.8–10.5 mm year−1, but dominated by one large lower-elevation fire in an area with higher precipitation. The future rate of post-fire recovery will depend on the sequence of wet and dry years, particularly for areas with higher dependence on interannual subsurface water storage (Figure 9).
The net observed changes in ET over the two basins, when expressed as changes in P-ET, are relatively small compared to the whole-basin discharge. The net reduction in the American basin for the decade ending in 2013, before the 2014 King Fire, averaged about 40 million m3 year−1 (Figure 7A), compared to an average annual basin discharge over that period of 2,849 million m3 year−1. Even the value of about 100 million m3 year−1 in 2018 is still under 4% and not detectable in flow measured at the basin outlet.
The Yuba and American watersheds have higher P, ET, and P-ET values compared to areas further south in the Sierra Nevada (Bales et al., 2018), suggesting that there is significant potential for higher gains in P-ET and thus runoff from forest management. For example, sustained ET reductions at the level shown on Figure 6, averaging over 50 mm year−1 for 25–75% basal area reduction for the 1985–2013 period, could have a significant impact if extended over a larger areas. Sustaining that amount, over 50% of the American and Yuba basins would reduce evapotranspiration and provide potential runoff by about 121 and 72 million m3 year−1 in the two basins, respectively, or ~4% of each basin's average discharge over our 1985–2008 study period. Applying the higher average amounts of ET reduction observed in both basins in the 25-year period shown on Figure 7B, 131 mm year−1, would give about reductions in ET and potential runoff of ~10% of the period-average discharge, totaling about 0.5 billion m3 year−1 for the two basins. It is acknowledged, however, that extending treatments over large areas of the Sierra Nevada is constrained by multiple factors (North et al., 2015b).
Subsurface Storage and Resistance to Dry Periods
In California's Mediterranean climate, both snowpack and subsurface water storage provide the water needed to sustain ecosystems during the summer–fall dry period. For higher elevations which are also cold during the wet winter season, the dry period is the main period of growth. Vegetation densities are thus controlled in part by climate, i.e., temperature and precipitation, and also by the interaction of climate with weathered bedrock over geologic time. The vulnerability of forests to drought then occurs with a shortage of precipitation, warmer temperatures, and limited subsurface storage.
In a multiyear drought, precipitation may be less than the level of evapotranspiration needed to sustain a forest, with multiyear subsurface storage making up the difference. However, there is a limit to how many years and how much water deficit can be met from storage before root-zone water storage is depleted (Klos et al., 2018). As temperature warms, the evaporative demand of existing vegetation can increase (Goulden and Bales, 2019). Warmer temperatures also shift precipitation from snow to rain, and melt snow earlier in the year, resulting in longer reliance on subsurface water storage for the growing season. Thus, subsurface storage is expected to support less summer evaporative demand by vegetation as climate warms, vs. in the past.
Broad areas of the upper Yuba appear to have substantial annual subsurface storage (Figure 8) and during the period of analysis drew upon minimal interannual (over-year) subsurface storage (Figure 9). That is, current forest water use is well within precipitation amounts at all elevations, and forests are able to tap substantial subsurface water storage during warm and dry periods each summer. Interannual storage is more important at lower elevations where there is less rain; however, these areas also have low ET values (Figure 2 and Figure S4).
The main area exhibiting potential vulnerability to multiyear dry periods is the broad middle portion of the American River basin (Figure 9), in the 600–1,200 m elevation range (Figure 1). A cumulative interannual deficit of 300 mm in subsurface storage should not affect the seasonal demand to sustain summer evapotranspiration, provided root-accessible water is greater than the sum of the interannual deficit and the seasonal ET supported by storage, on the order of 600 mm. As reported for the further-south Kings River basin, the forest at 1,160 m elevation had a P-ET deficit approaching 1,500 mm when tree mortality became widespread (Goulden and Bales, 2019). Indications are that moisture stress may have started when the P-ET deficit surpassed 1,000 mm. Thus, the American basin has some additional resilience, but should see greater drought stress for a more-sustained, warmer or drier drought than in the period fall 2011 to fall 2015.
It is also important to emphasize that for projecting drought stress, cumulative P-ET deficit (Figure 9) has been shown to be well correlated with indices of drought stress and tree mortality such as satellite-derived normalized difference moisture index (NDMI) and aerial surveys done by the US Forest Service (Goulden and Bales, 2019). Traditional indices such as Standardized Precipitation Index (SPI), Standardized Precipitation Evapotranspiration Index (SPEI), and Palmer Drought Severity Index (PDSI) were not well-correlated with forest stress or mortality in the Sierra Nevada during the recent 4-year drought. When used together with seasonal demand for subsurface water to support evapotranspiration (Figure 8), cumulative P-ET deficit (Figure 9) can be applied more broadly to anticipate drought stress and focus forest-management priorities.
Water-Balance Uncertainty
As a check on the water balance, we summed total annual runoff (P-ET) per basin, which compared well with full natural flow values from the California Department of Water Resources (Figure 10). The P-ET values exhibit a median bias of ~130 mm for the Yuba and 40 mm for the American. These values, about 5% of precipitation or 10% of full natural flow, are within the expected uncertainty of the analysis. Note that annual values of P-ET do not account for ΔS, which is reflected in dry years having slightly higher runoff than would occur in the absence of multiyear storage to support ET. Conversely, in wet years some precipitation will go to replenishing over-year storage deficits, especially when following multiyear dry periods (Bales et al., 2018). However, in these basins, interannual ΔS during the study period was relatively small (Figure 9).
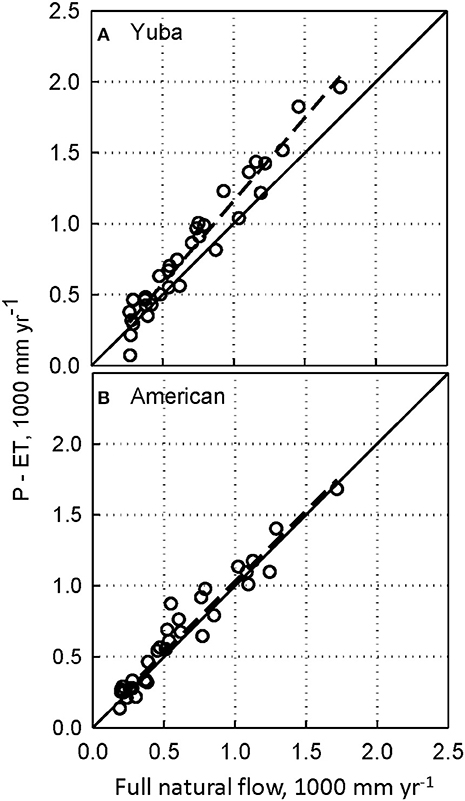
Figure 10. Water balance for the (A) Yuba and (B) American watersheds (1985–2018). Full natural flow is for the respective USGS stream gage.
In the current analysis, we used the two-variable model (NDVI and precipitation) for scaling the analysis of drought stress and continue the NDVI-only model for assessing response to disturbance. The two variables in our additive model are weakly correlated in the calibration data (r2 = 0.33). Given the weighting between the additive terms in the two-variable model, the ET response to NDVI changes is muted compared to the one-variable model.
In prior analyses, the NDVI-only model worked well for water balance in the southern Sierra (Bales et al., 2018) and provided an index for projecting forest drought stress (Goulden and Bales, 2019). Yet, in the current water-balance analysis, it underestimates evapotranspiration across higher-precipitation basins, giving median bias values of 300 and 170 mm for P-ET vs. full-natural flow for the Yuba and American, respectively. The two-variable additive model (NDVI and precipitation) gave respective average ET values for the two watersheds of 668 and 610 mm year−1 vs. 461 and 432 for the NDVI-only model. These latter values are essentially the same as those from a large-scale blended satellite-data and bottom–up modeling approach, which reported evaporation estimates across California (Baldocchi et al., 2019). Their average ET values for the two watersheds were 460 and 454 mm year−1, respectively. Another difference between the results from Baldocchi et al. (2019) vs. our statistical approach is the pattern of ET. Their results show less difference in modeled ET across areas with different NDVI, precipitation, and temperature compared to our statistical approach.
The basin water balance in Figure 10 shows that P-ET values during dry years have a relatively small bias compared to flow measured at the basin outlet, reflecting evapotranspiration in drier parts of the basin depending on multiyear subsurface water storage to make up for deficits in precipitation. In wet years, the bias in P-ET relative to full natural flow is larger, part of which should reflect replenishment of subsurface storage that was drawn down in wetter years. Overall, however, there is little evidence for water limitation basin wide. The implication for forest restoration is that reductions in forest density by management actions or wildfire should reduce forest evapotranspiration, as remaining vegetation is not water limited (Saksa et al., 2019). Forest treatments, therefore, will not only increase runoff by reducing ET but also have the potential to increase subsurface storage of water in dry years. This increase should lead to increases in runoff in current or subsequent years, increase minimum flows, and increase forest water availability.
Limitations of Analysis
An interesting result of this work is that net evapotranspiration change due to fire in the American River watershed was ~20% less than that reported by Roche et al. (2018). This is the result of (i) using the USGS Tier 1 Collection 1 of Landsat data vs. the precollection data, and (ii) using a normalization that is more representative of the entire vegetation range of California than that of Su et al. (2017). While there may be an impact to the annual NDVI average due to variable snow and cloud cover filtering of mid- and high-elevation areas, the improved regression results relative to that used earlier gives us confidence in the current results. Note that the current regression has additional years of data not available for the earlier analysis. Additional work is needed to characterize the difference between an unweighted mean NDVI as used here vs. a smoothed and month-centered NDVI average as used in Roche et al. (2018).
This analysis assumed that all unburned forested polygons represented control conditions even though some proportion had been logged or mechanically thinned during the analysis period. The effect of this known issue would be to reduce the estimate of evapotranspiration reduction due to fire. With respect to these limitations, it can then be stated that the results should represent conservative estimates of potential ET reductions due to forest thinning through fire.
An additional limitation is the neglect of net lateral subsurface flow between cells. Subsurface redistribution of water would result in some cells having more and some less water for evapotranspiration than indicated by annual precipitation. While a comprehensive spatial analysis of the question has yet to be reported for Sierra Nevada basins, both measurements and modeling point to the effect being relatively small across most of the landscape. This does not rule out local hotspots where lateral redistribution is important, given its importance in sustaining baseflow in streams and dry-season evapotranspiration. In a southern Sierra headwater catchment, Oroza et al. (2018) found topographic wetness index (TWI) to be an explanatory variable for spatial patterns of soil–water storage only during the dry summer period, after drawdown of soil water following the wet winter and spring periods. Similarly, across a broad area of the southern Sierra, Su et al. (2017) found that TWI was not a good predictor of patterns in moisture stress (NDMI) or greenness (NDVI) from Landsat. Using a rich suite of soil–moisture data from headwater catchments in the American and Merced River basins, Saksa et al. (2017) modeled catchment-scale water balances, with no significant lateral redistribution. This is also consistent with extensive subsurface measurements focusing on the 2012–2015 drought in the southern Sierra, which showed limited evidence of lateral redistribution (Bales et al., 2018). Lateral redistribution is an inherent limitation in any hydrologic model that accounts for significant amounts of stored water to meet evaporative demands (see Figure 8). Lundquist and Loheide (2011) estimated lateral transfer of subsurface water from high to low elevations to be ~10% of the water balance for the Upper Merced River watershed in the Central Sierra Nevada Mountains of California. Broader and more-thorough examination of when and where this component of the water balance could be important could build on these several studies, particularly the rich spatial data sets now available in the Sierra Nevada.
Finally, while the findings reported here can be used to predict ET response to wildfire and regrowth in these and nearby watersheds, they represent mean historical behavior across several disturbance events. Averaged over longer times and areas, these predictions can provide useful guides for assessing water-balance response to disturbance and recovery. These top–down modeling results can serve as evaluation data for more process-based, bottom–up modeling. Predictions based on the results presented here also provide important data for resource-management planning and scenario analysis.
Conclusions
We found that historical wildfire has made significant post-fire reductions in evapotranspiration for at least 5 years in northern Sierra forested watersheds and in some cases for more than 20 years. However, as the areas affected by wildfire were only a fraction of the larger watersheds in which the fires occurred, the effect on runoff in the two basins studied was somewhat limited. Based on the response of evapotranspiration to the levels of biomass removed in medium-intensity fires (25–75% basal area loss), widespread management actions involving mechanical thinning and controlled burns can have significant local effects on evapotranspiration, with reductions as much as 150–200 mm year−1 for the first 5 years. For the two basins studies, this represents 25–30% of average annual evapotranspiration in productive forests and has the potential to increase runoff by measurable amounts if extended over as much of the watershed as can be treated. Rates of regrowth in post-wildfire evapotranspiration confirm the need for follow-up forest treatments at intervals of 5–20 years to sustain lower evapotranspiration, depending on local landscape attributes and interannual climate.
The northern Sierra watersheds studied have experienced little moisture stress during the 1985–2018 period of our analysis, owing to relatively small reliance on interannual subsurface water storage to meet dry-year evapotranspiration needs of vegetation. The cumulative interannual deficits that we found were up to 300 mm year−1, which are on the order of 25% of the deficits observed in the southern Sierra before widespread tree mortality occurred. However, longer dry periods will push parts of the American River basin toward the thresholds that resulted in widespread forest mortality in the Southern Sierra Nevada. Use of cumulative precipitation minus evapotranspiration (P-ET) provides a good index for planning and assessment.
Data Availability Statement
All data used in this analysis are included in the Supplementary Material or are publicly available. Questions regarding the datasets should be directed to Roger Bales, cmJhbGVzQHVjbWVyY2VkLmVkdQ==.
Author Contributions
JWR carried out most of the analysis and wrote parts of the manuscript. QM developed the spatial data products. JR developed the datasets used to develop the spatial data. RB supervised the work and prepared the final manuscript. All authors edited the manuscript.
Funding
This research was supported by a USDA Small Business Innovation Research grant to Blue Forest Conservation, with supplemental support from the National Science Foundation through the Southern Sierra Critical Zone Observatory (EAR-1331939), from the Nature Conservancy, and from the California Strategic Growth Council through the Innovation Center for Ecosystem Climate Solutions.
Conflict of Interest
The authors declare that the research was conducted in the absence of any commercial or financial relationships that could be construed as a potential conflict of interest.
Acknowledgments
The authors wish to acknowledge constructive comments from the reviewers, which guided improvements to the manuscript. Eddy-covariance data are available at https://ameriflux.lbl.gov/. PRISM data are accessible at http://www.prism.oregonstate.edu/. Landsat data are available at https://www.usgs.gov/land-resources/nli/landsat/landsat-collection-1-surface-reflectance. Unimpaired runoff data are accessible at https://cdec.water.ca.gov/. SRTM data were used for elevations and are available at https://www2.jpl.nasa.gov/srtm/.
Supplementary Material
The Supplementary Material for this article can be found online at: https://www.frontiersin.org/articles/10.3389/ffgc.2020.00069/full#supplementary-material
References
Allen, C. D., Macalady, A. K., Chenchouni, H., Bachelet, D., McDowell, N., Vennetier, M., et al. (2010). A global overview of drought and heat-induced tree mortality reveals emerging climate change risks for forests. For. Ecol. Manag. 259, 660–684. doi: 10.1016/j.foreco.2009.09.001
Anderegg, W. R. L., Hicke, J. A., Fisher, R. A., and Allen, C. D. (2015). Tree mortality from drought, insects, and their interactions in a changing climate. N. Phytol. 208, 674–683. doi: 10.1111/nph.13477
Anderegg, W. R. L., Kane, J. M., and Anderegg, L. D. L. (2013). Consequences of widespread tree mortality triggered by drought and temperature stress. Nat. Clim. Change. 3, 30–36. doi: 10.1038/nclimate1635
Baldocchi, D., Dralle, D., Jiang, C., and Ryu, Y. (2019). How much water is evaporated across California? A multiyear assessment using a biophysical model forced with satellite remote sensing data. Water Resour. Res. 55, 2722–2741. doi: 10.1029/2018WR023884
Bales, R. C., Goulden, M. L., Hunsaker, C. T., Conklin, M. H., Hartsough, P. C., O'Geen, A. T., et al. (2018). Mechanisms controlling the impact of multi-year drought on mountain hydrology. Sci. Rep. 8:690. doi: 10.1038/s41598-017-19007-0
Barnett, T. P., Adam, J. C., and Lettenmaier, D. P. (2005). Potential impacts of a warming climate on water availability in snow-dominated regions. Nature 438, 303–309. doi: 10.1038/nature04141
Bosch, J. M., and Hewlett, J. D. (1982). A review of catchment experiments to determine the effect of vegetation changes on water yield and evapotranspiration. J. Hydrol. 55, 3–23. doi: 10.1016/0022-1694(82)90117-2
California Data Exchange Center (2019). Available online at: http://cdec.water.ca.gov/dynamicapp/selectQuery (accessed October 6, 2019).
Carlson, T. N., and Ripley, D. A. (1997), On the relation between NDVI, fractional vegetation cover, leaf area index. Remote Sens. Environ. 62, 241–252. doi: 10.1016/S0034-4257(97)00104-1
Chen, J. M., Chen, X., Ju, W., and Geng, X. (2005). Distributed hydrological model for mapping evapotranspiration using remote sensing inputs. J. Hydrol. 305, 15–39. doi: 10.1016/j.jhydrol.2004.08.029
Fellows, A. W., and Goulden, M. L. (2017). Mapping and understanding dry season soil water drawdown by California montane vegetation. Ecohydrol. 10:e1772. doi: 10.1002/eco.1772
Gholz, H. L. (1982), Environmental limits on above-ground net primary production, leaf-area, and biomass in vegetation zones of the pacific northwest. Ecology 63, 469–481. doi: 10.2307/1938964.
Gorelick, N., Hancher, M., Dixon, M., Ilyushchenko, S., Thau, D., and Moore, R. (2017). Google Earth Engine: Planetary-scale geospatial analysis for everyone. Remote Sens. Environ. 202, 18–27. doi: 10.1016/j.rse.2017.06.031
Goulden, M. L. (1996). Carbon assimilation and water-use efficiency by neighboring Mediterranean-climate oaks that differ in water access. Tree Physiol. 16, 417–424. doi: 10.1093/treephys/16.4.417
Goulden, M. L., Anderson, R. G., Bales, R. C., Kelly, A. E., Meadows, M., and Winston, G. C. (2012). Evapotranspiration along an elevation gradient in California's Sierra Nevada. J. Geophys. Res. Biogeosci. 117, 1–13. doi: 10.1029/2012JG002027
Goulden, M. L., and Bales, R. C. (2014). Mountain runoff vulnerability to increased evapotranspiration with vegetation expansion. Proc. Natl. Acad. Sci. U.S.A. 111, 14071–14075. doi: 10.1073/pnas.1319316111
Goulden, M. L., and Bales, R. C. (2019). California forest die-off linked to multi-year deep soil drying in 2012–2015 drought. Nat. Geosci. 12, 632–637. doi: 10.1038/s41561-019-0388-5
Grier, C. C., and Running, S. W. (1977), Leaf area of mature northwestern coniferous forests - relation to site water-balance. Ecology 58, 893–899. doi: 10.2307/1936225
Groeneveld, D. P., Baugh, W. M., Sanderson, J. S., and Cooper, D. J. (2007), Annual groundwater evapotranspiration mapped from single satellite scenes. J. Hydrol. 344, 146–156. doi: 10.1016/j.jhydrol.2007.07.002
Hamon, W. R. (1963). Computation of direct runoff amounts from storm rainfall. Int. Assoc. Sci. Hydrol. Publ. 63, 52–62.
Homer, C. G., Dewitz, J., Yang, L., Jin, S., Danielson, P., Xian, C. J., et al. (2015). Completion of the 2011 national land cover database for the conterminous united states – representing a decade of land cover change information. Photogramm. Eng. Remote Sens. 81, 345–353. doi: 10.14358/PERS.81.5.345
Klos, P. Z., Goulden, M. L., Riebe, C. S., Tague, C. L., O'Geen, A. T., Flinchum, B. A., et al. (2018). Subsurface plant-accessible water in mountain ecosystems with a mediterranean climate. WIRES Water 5:e1277. doi: 10.1002/wat2.1277
Lundquist, J. D., and Loheide, S. P. (2011). How evaporative water losses vary between wet and dry water years as a function of elevation in the Sierra Nevada, California, and critical factors for modeling. Water Resour. Res. 47:02. doi: 10.1029/2010WR010050
Lutz, J. A., Van Wagtendonk, J. W., and Franklin, J. F. (2010). Climatic water deficit, tree species ranges, and climate change in yosemite national park. J. Biogeogr. 37, 936–950. doi: 10.1111/j.1365-2699.2009.02268.x
McKenzie, D., Gedalof, Z., Peterson, D. L., and Mote, P. (2004). Climatic change, wildfire, and conservation. Conserv. Biol. 18, 890–902. doi: 10.1111/j.1523-1739.2004.00492.x
Miller, J. D., Collins, B. M., Lutz, J. A., Stephens, S. L., van Wagtendonk, J. W., and Yasuda, D. A. (2012). Differences in wildfires among ecoregions and land management agencies in the Sierra Nevada region, California, USA. Ecosphere 3:art80. doi: 10.1890/ES12-00158.1
Miller, J. D., Knapp, E. E., Key, C. H., Skinner, C. N., Isbell, C. J., Creasy, R. M., et al. (2009). Calibration and validation of the relative differenced normalized burn ratio (RdNBR) to three measures of fire severity in the sierra nevada and klamath mountains, California, USA. Remote Sens. Environ. 113, 645–656. doi: 10.1016/j.rse.2008.11.009
Miller, J. D., and Quayle, B. (2015). Calibration and validation of immediate post-fire satellite derived data to three severity metrics. Fire Ecol. 11, 12–30, doi: 10.4996/fireecology.1102012
Mu, Q., Zhao, M., and Running, S. (2011). Improvements to a MODIS global terrestrial evapotranspiration algorithm. Remote Sens. Environ. 115, 1781–1800. doi: 10.1016/j.rse.2011.02.019
Naudts, K., Chen, Y., McGrath, M. J., Ryder, J., Valade, A., Otto, J., et al. (2016). Europes forest management did not mitigate climate warming. Science 351, 597–600. doi: 10.1126/science.aad7270
North, M. P., Brough, A., Long, J., Collins, B., Bowden, P., Yasuda, D., et al. (2015b). Constraints on mechanized treatment significantly limit mechanical fuels reduction extent in the Sierra Nevada. J. Forest. 113, 40–48. doi: 10.5849/jof.14-058
North, M. P., Stephens, S. L., Collins, B. M., Agee, J. K., Aplet, G., Franklin, J. F., et al. (2015a). Reform forest fire management. Science 349, 1280–1281. doi: 10.1126/science.aab2356
Oroza, C. A., Bales, R. C., Stacy, E. M., Zheng, Z., and Glaser, S. D. (2018). Long-term variability of soil moisture in the southern sierra: measurement and prediction. Vadose Zone J. 17:170178. doi: 10.2136/vzj2017.10.0178
PRISM Climate Group (2019) Oregon State University. Available online at: http://prism.oregonstate.edu (accessed July 2019).
Roche, J. W., Goulden, M. L., and Bales, R. C. (2018). Estimating evapotranspiration change due to forest treatment and fire at the basin scale in the Sierra Nevada, California. Ecohydrol 11:e1978. doi: 10.1002/eco.1978
Rungee, J., Ma, Q., Bales, R., and Goulden, M. (2019). Evapotranspiration response to multiyear dry periods in the semiarid western United States. Hydrol. Process. 32, 182–194. doi: 10.1002/hyp.13322
Running, S. W., Nemani, R. R., and Hungerford, R. D. (1987). Extrapolation of synoptic meteorological data in mountainous terrain and its use for simulating forest evapotranspiration and photosynthesis. Can. J. For. Res. 17, 472–483. doi: 10.1139/x87-081
Saksa, P. C., Bales, R. C., Tague, C. L., Battles, J. J., Tobin, B. W., and Conklin, M. H. (2019). Fuels treatment and wildfire effects on runoff from Sierra Nevada mixed-conifer forests. Ecohydrol 13:2151. doi: 10.1002/eco.2151
Saksa, P. C., Conklin, M. H., Battles, J. J., Tague, C. L., and Bales, R. C. (2017). Forest thinning impacts on the water balance of Sierra Nevada mixed-conifer headwater basins. Water Resour. Res. 53, 5364–5381. doi: 10.1002/2016WR019240
Sivapalan, M., Blöschl, G., Zhang, L, and Vertessy, R. (2003). Downward approach to hydrological prediction. Hydrol. Proc. 17, 2101–2111. doi: 10.1002/hyp.1425
Su, Y., Bales, R. C., Ma, Q., Nydick, K., Ray, R. L., Li, W., et al. (2017). Emerging stress and relative resiliency of giant sequoia groves experiencing multiyear dry periods in a warming climate. J. Geophys. Res. Biogeosci. 122, 3063–3075. doi: 10.1002/2017JG004005
Tague, C. L., McDowell, N. G., and Allen, C. D. (2013). An integrated model of environmental effects on growth, carbohydrate balance, and mortality of pinus ponderosa forests in the southern rocky mountains. PLoS ONE 8:e80286. doi: 10.1371/journal.pone.0080286
Tague, C. L., and Moritz, M. A. (2019). Plant accessible water storage capacity and tree-scale root interactions determine how forest density reductions alter forest water use and productivity. Front. For. Glob. Change 2:36. doi: 10.3389/ffgc.2019.00036
Tague, C. L., Moritz, M. A., and Hanan, E. (2018). The changing water cycle: the eco-hydrologic impacts of forest density reduction in Mediterranean (seasonally dry) regions. WIRES Water 6:e1350. doi: 10.1002/wat2.1350
Westerling, A. L. (2006). Warming and earlier spring increase western U.S. Forest Wildfire Act. Sci. 313, 940–943. doi: 10.1126/science.1128834
Zhang, L., Dawes, W. R., and Walker, G. R. (2001). Responses of mean annual temperature to vegetation changes at catchment scale. Water Resour. Res. 37, 701–708. doi: 10.1029/2000WR900325
Keywords: evapotranspiration, drought, wildfire, forest, Sierra Nevada (CA), California
Citation: Roche JW, Ma Q, Rungee J and Bales RC (2020) Evapotranspiration Mapping for Forest Management in California's Sierra Nevada. Front. For. Glob. Change 3:69. doi: 10.3389/ffgc.2020.00069
Received: 08 March 2020; Accepted: 12 May 2020;
Published: 30 June 2020.
Edited by:
Christina (Naomi) Tague, University of California, Santa Barbara, United StatesReviewed by:
Gabrielle F. S. Boisrame, Desert Research Institute (DRI), United StatesCate Macinnis-Ng, The University of Auckland, New Zealand
Copyright © 2020 Roche, Ma, Rungee and Bales. This is an open-access article distributed under the terms of the Creative Commons Attribution License (CC BY). The use, distribution or reproduction in other forums is permitted, provided the original author(s) and the copyright owner(s) are credited and that the original publication in this journal is cited, in accordance with accepted academic practice. No use, distribution or reproduction is permitted which does not comply with these terms.
*Correspondence: Roger C. Bales, cmJhbGVzQHVjbWVyY2VkLmVkdQ==