 Caroline A. E. Loew
 Helmer Schack-Kirchner
 Siegfried Fink2
- 1Laboratory Soil Ecology, Department of Environment and Natural Resources, Institute of Soil Ecology, Organization Albert-Ludwigs-University Freiburg, Freiburg, Germany
- 2Laboratory Forest Botany, Department of Environment and Natural Resources, Institute of Forest Botany, Organization Albert-Ludwigs-University Freiburg, Freiburg, Germany
Roots are among the major controls of nutrient and C cycles and together with mycorrhizal fungi they are assumed to play a key role especially in the P nutrition of forest ecosystems. Current publications emphasized that the size distribution of fine roots reflects the crucial impact of roots on biogeochemical cycles. However, we know hardly anything about the spatial distribution of fine root size classes and their specific surface as well as the distribution of mycorrhizal fungi among different size classes in undisturbed soils. We used a novel method based on epifluorescence microscopy to analyze fine roots in undisturbed soil samples. We expected that based on these analyses proposed differences between P-rich and P-poor soils get clearer than based on routine methods for fine root analysis. This was examined at two European beech forests in Germany at silicate rock that differ in P supply by the parent material. We analyzed the fine root frequency, size distribution and surface based on resin impregnated cross sections taken from undisturbed soil samples. Fine roots were classified according to their size and morphology of associated ectomycorrhiza (ECM). After staining with acridine orange these root traits were analyzed and quantified with epifluorescence microscopy. We found that more than 82 % of the absorbing surface was associated with roots having a diameter smaller than 100 μm. The fine root surface area present per square meter of soil was 388 m2 at the P-poor site and 220 m2 at the P-rich site. In addition, the percentage of mycorrhization of the fine root surface was 47 % at the P-poor site and only 38 % at the P-rich site. The biggest root length density and the highest absorbing fine root surface with mycorrhization and abundance of extramatrical mycelia (EM) was observed in the forest floor (+4 to 0 cm) at the P-poor site and in the subsoil (−79 to −100 cm) at the P-rich site. Our results confirm that beech trees adapt their root traits according to P availability showing higher absorbing surface at the P-poor site compared to the P-rich site. In contrast, at the soil-profile scale, rooting density (RLD) and mycorrhization increased with P availability thereby showing an efficient way of root and mycorrhizal fungi placement. Overall, distinct differences in fine root traits, between the P-rich and P-poor site were most evident for fine roots smaller than 100 μm.
1. Introduction
Roots are less accessible for researchers than above-ground plant compartments and are widely assumed to bear still a lot of unidentified possibilities of adaptation (Finér et al., 2011). Current papers indicate the prominent role of roots in C sequestration (Ruess et al., 2003; Clemmensen et al., 2013) and nutrient cycling (Johnson and Turner, 2019). The high relevance of roots for phosphorus nutrition of higher plants originates from the low mobility of P in soils (Raghothama and Karthikeyan, 2005). At many sites, P is among the limiting factors of forest growth (Lang et al., 2017). It has been shown that beech forests evolved many mechanisms to adapt to P scarcity. Since declining P leaf contents observed for European beech forests (Jonard et al., 2015; Talkner et al., 2015) might indicate disturbance of those mechanisms they are currently in the center of scientific debate. Lang et al. (2017) found a shift in P nutrition strategies of beech forest ecosystems, depending on the P supply provided by the soils. At sites with low stocks in soil P, beech forests maintain their P supply by recycling of P from organic sources, while the acquisition of P from mineral resources controls P nutrition at high soil P stocks (Raghothama and Karthikeyan, 2005). Till now, it is unknown, if fine root spatial and size distribution as well as mycorrhization reflect nutrition strategies (Lopez-Bucio et al., 2000; Plassard and Dell, 2010; Hauenstein et al., 2018). In general, size distribution and surface area of very small roots (<100 μm) and the morphology of the associated mycorrhizal fungi have hardly been analyzed. This is especially true for samples with undisturbed soil structure. About 95% of all trees in forest ecosystems, especially in boreal and temperate biomes, have ectomycorrhiza symbiosis (Smith and Read, 2009). In terms of P uptake, the extramatrical mycelium (EM) produced by ectomycorrhizal fungi (ECM) is a key factor (Read, 1984; Plassard and Dell, 2010). It improves P uptake by increasing the size of the explored soil volume (Lynch, 1995) whereby the depletion zone may extend far beyond the rhizosphere (Bolan, 1991; Marschner and Dell, 1994; Tibbett and Sanders, 2002) and thus overcomes the limits of the slow diffusion of P in the soil, which is assumed to be not more than a few millimeters (Williamson and Alexander, 1975; Schachtman et al., 1998; Plassard and Dell, 2010; Demand et al., 2017). Furthermore, Nylund and Wallander (1992) determined that the production of the EM for Pinus sylvestris L. is induced by P starvation. Thus, we assume that European beech trees of the above-mentioned recycling and acquiring systems show different rooting density, depth distribution, and mycorrhization depending on P availability.
Most published root data is based on mass or length of washed-out roots (Böhm, 1979; Colpaert et al., 1992; Van Noordwijk et al., 2000). However, this procedure has problems regarding the size distribution of roots in soils. It has been found that especially fine roots (<1 mm) are underestimated (Bengough et al., 1992; Rousseau et al., 1994). The quantification of hyphae spreading out from the Hartig net to build extramatrical mycelium is even more challenging (Colpaert et al., 1992; Rousseau et al., 1994). A variety of methods have been developed to quantify the biomass of extramatrical mycelium in soils, including mini-rhizotrons and in-growth mesh bags. Yet, due to disturbance of soil samples or artificial growing conditions, these methods are inadequate to quantitatively describe roots and their mycorrhizal traits in soils. Consequently, to provide information on the effective absorbing root surface area, multiple studies have requested that roots should be characterized and quantified in undisturbed soil samples (Jones et al., 1990; Rousseau et al., 1994; Hinsinger et al., 2011; Peñuelas et al., 2013). We suggest a micro morphological approach to quantify and characterize fine roots which has also been used by Tippkötter et al. (1986), Altemüller (1989), and Schack-Kirchner et al. (2000). This means, shortly, that roots are left in their soil environment but are analyzed on two-dimensional areas such as thin sections or faces prepared otherwise. Our study aim was to analyze those characteristics of fine roots (<2 mm) with major relevance for P uptake: size distribution, surface area, specific root length, and the mycorrhization as well as the morphology of mycorrhizal fungi within undisturbed soil environment. We compared soils from two European beech forests, one developed from P-rich substrate, the other from P-poor substrate. We expected that based on micro morphological root analyzes proposed differences between P-rich and P-poor soils get more clear than based on routine methods for fine root analysis. Our approach was based on epifluorescence microscopy of resin impregnated polished soil sections taken from undisturbed soil cores. To our knowledge, this study is the first approach of in situ quantification of the absorbing root surfaces in their undisturbed environment.
2. Materials and Methods
Site Characteristics
Soil and stand characteristics including P stocks of the study sites Bad Brueckenau (BBR, P-rich site) and Unterluess (LUE, P-poor site) are reported in Table 1. As a proxy for P availability, citric acid extractable Pinorganic according to Manghabati et al. (2018) is listed per soil horizon in Table 2. The experiment is focused exclusively on four soil horizons per site (Oa, Ah/AhE, Bw/Bsw, and Cw). BBR, is located in the Rhoen mountains in North Bavaria, and LUE, is in the North German lowlands. Both study sites belong to the Level II intensive monitoring plots of the Pan-European International Cooperative Program on assessment and monitoring of air pollution effects for the forests (ICP Forests) under the supervision of UNECE (Lorenz, 1995). Though the stocks and availability of P substantially differ between the two sites, leaf concentrations of P are similar (Lang et al., 2017).
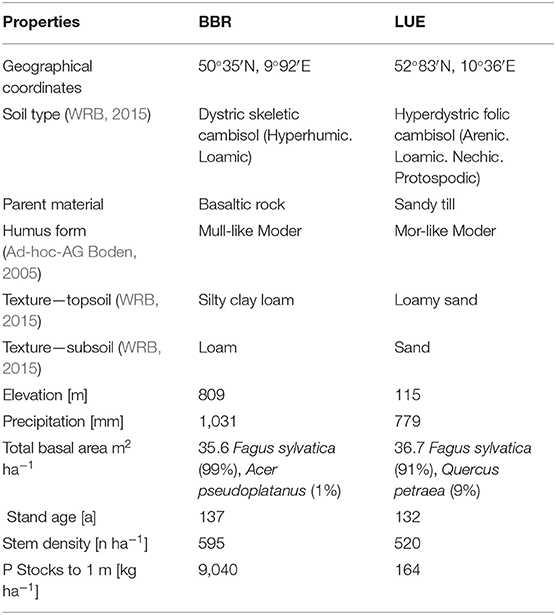
Table 1. Site and stand characteristics of the study sites Bad Brueckenau (BBR) and Unterluess (LUE) (Lang et al., 2017).
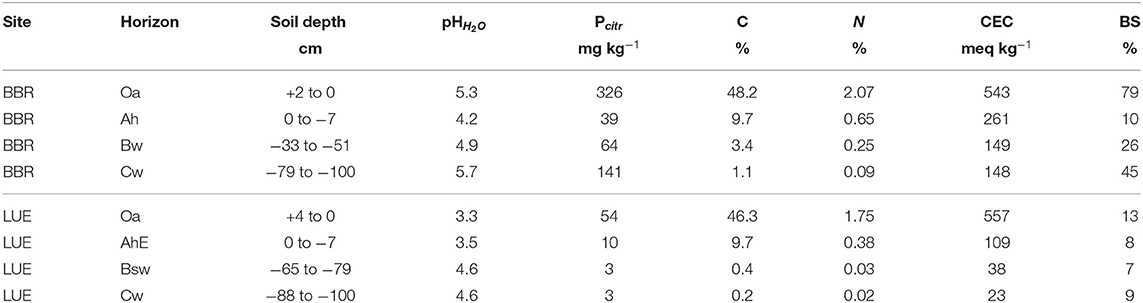
Table 2. The citric acid extractable P for the respective sampled soil horizon (Oh, Ah, Bw, and Cw) of the two study sites Bad Brückenau (BBR) and Unterluess (LUE) (Lang et al., 2017).
2.1. Root-Mycorrhiza Investigations
2.1.1. Root System Sampling and Soil Preparation
For the quantitative investigation of fine roots (<2 mm), we used a three-level hierarchical sampling design (Figure 1). On the first level, we sampled undisturbed soil cores at three sampling points (three beech trees) considered to be representative of the sites BBR and LUE and with low coverage of herbs or shrubs to avoid non-beech roots and at a distance from the next stem of about 1 m. Soil cores with a diameter of 8 cm and a length of 20 cm were taken with a root auger up to 1 m in depth. In BBR, we had to take clods below 40 cm instead of soil cores due to the high stone content. Immediately after sampling, we identified and counted the visible fine roots (1–2 mm) (Kreutzer, 1961) by the core break method (Böhm, 1979). On the second level, we subsampled the surrounding of four randomly chosen visible fine roots (1–2 mm) per analyzed soil horizon with “mini cores” for microscopic analysis.
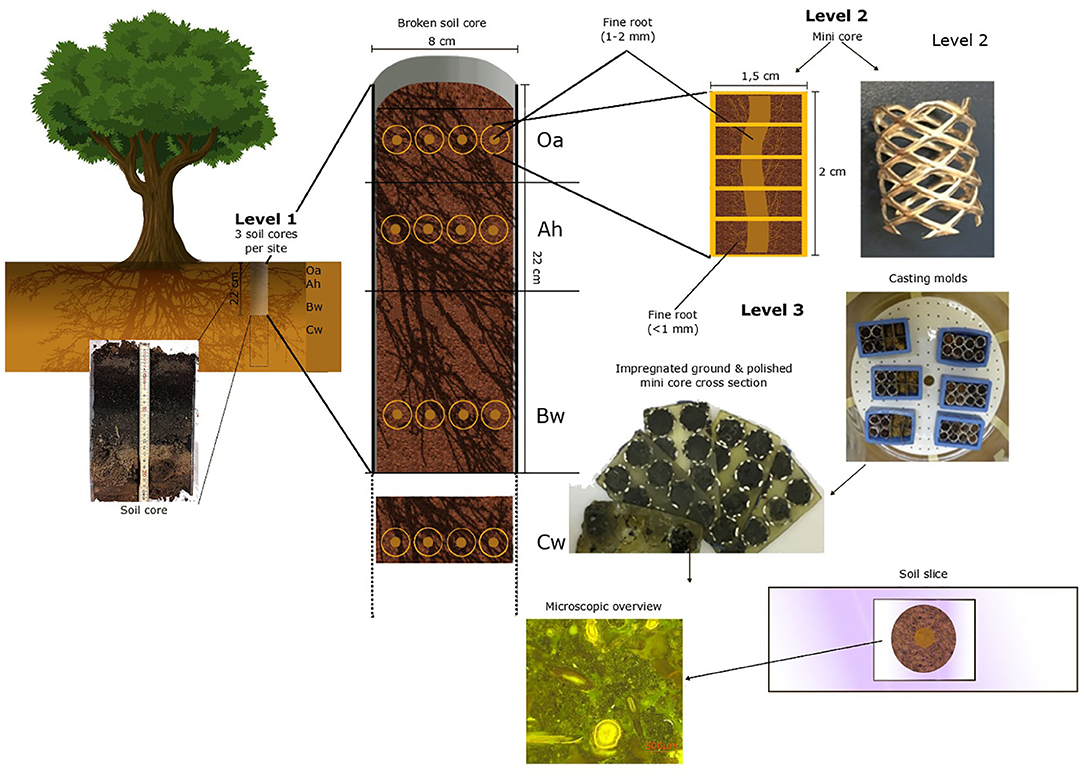
Figure 1. The hierarchical sampling design with each preparation level of the polished soil samples.
These mini cores (Figure 1) are tubes formed out of perforated aluminum plate with a diameter of 1.5 cm and a length of 2 cm. These were pushed into the soil around a fine root (1–2 mm). The mini cores and the Cw clods were next placed in rectangle casting molds (EPDM rectangle mold, 55 × 30 × 22 mm, Buehler, Esslingen am Neckar, Germany).
For the third level, immediately after cutting out and placing the mini cores were fixed in 2.5% glutardialdehyde aqueous solution (Tippkötter et al., 1986) to stop microbial activity and to conserve roots and other biological tissues. Dehydration was then performed using a five-step ascending acetone concentration of 50%, 80%, and three times 100% for 3 days to prevent shrinking or deformation (Tippkötter and Ritz, 1996). The dehydrated soil samples were then embedded in a low viscosity epoxy resin (Serva Electrophoresis GmbH; Heidelberg; Germany, Application note “Modified Spurr,” “Modification E”) (Serva Electrophoresis GmbH, 2007). After complete filling of the pore space, acetone was replaced by resin. The resin content was sequentially increased from 20 to 100% in five steps based on preliminary tests. To ensure that all pores were filled with epoxy resin, the actual impregnation was carried out with 100% epoxy resin under a vacuum for 24 h.
The final polymerization took place for 16 h at 70°C. The cured soil cores were mounted onto aluminum plates with hot melting adhesive and were cut horizontally into three to five 1–2 mm slices using a diamond saw. These slices were ground with sand paper in declining grid size from P320 to P800 and P1200, and finally polished with Al2O3 powder with declining grain size from 5, 1, and 0.3 μm. Low viscosity erosion oil (EDM180 from Ilocut, Diermeier Energie GmbH, Munich, Germany) was used as cutting and grinding fluid to avoid swelling (Schack-Kirchner et al., 2000). The individual soil samples were finally glued onto the microscope slides with a two compound epoxy adhesive glue and cleaned with paraldehyde. Since the soil slices did not perfectly correspond to the mini core surface area, we quantified the soil filled surface area of each soil slice with image analysis (ImageJ, Version1.51f).
The surface of the polished soil slices was stained with acridine orange. According to Schack-Kirchner et al. (2000) for the coloring of hyphae embedded in polyester resin was modified as follows: In preliminary tests we found an optimum staining contrast in epoxy resin specimen by using a mixture of seven parts 0.1% acridine orange in 100% ethanol to three parts 0.1% acridine orange in 10% hydrochloric acid. It was applied for 10 min and the staining was done in closed boxes to prevent the evaporation of ethanol. After the dye was removed with a cloth, the soil slabs were left to stand for a further 20 min before being examined by Zeiss Axio Zoom V16 fluorescence zoom microscope (Carl Zeiss AG; Jena, Germany). For the fluorescence illumination, a HXP 200C illuminator with a mercury short-arc reflector lamp was used. The microscope was equipped with a PlanNeoFluar Z2.3x/0.57 FWD 10.6 mm objective and a filter combination of BP450-490/FT510/LP515.
The digital microscope camera AxioCam HRC (Carl Zeiss AG; Jena, Germany) has a CCD sensor type with a pixel resolution of 1.4 megapixel with 1,388 × 1,040 with a pixel size of 6.45 μm. The pictures were further analyzed with the imaging software ZEN 2012 (Version 1.1.2.0, Carl Zeiss AG; Jena, Germany).
By illumination with blue light, fresh plant material, hyphae, and bacteria fluoresced in a spectrum from yellow to yellow-green. However, a color difference between hyphae and other plant material was not visible. Therefore, roots and fungi were classified and determined by differences in morphology that could be easily distinguished such as diameter, form, or the appearance of hyphae mantle. The respective cell structures of roots and fungi could be clearly distinguished.
A total of 384 microscopic samples distributed evenly over both sites were evaluated. We included only intact roots in our data set. First, we differentiated between fine roots having a diameter of 1–2 mm, and those having a diameter <1 mm in ZEN 2012 (Figure 2). We used a spherical graphic primitive interactively placed into the boundaries of the root cross section to measure the minimum ferret diameter representing the diameter even when roots are cut non-perpendicular to their axis. Second, for each root, the existence of mycorrhization was analyzed based on presence/absence of hyphae mantle. Since melanine hyphae are not stained by acridine orange, whereas hyaline hyphae are, we were able to differentiate between melanine and hyaline hyphae as described in Schack-Kirchner et al. (2000) (Figure 2).
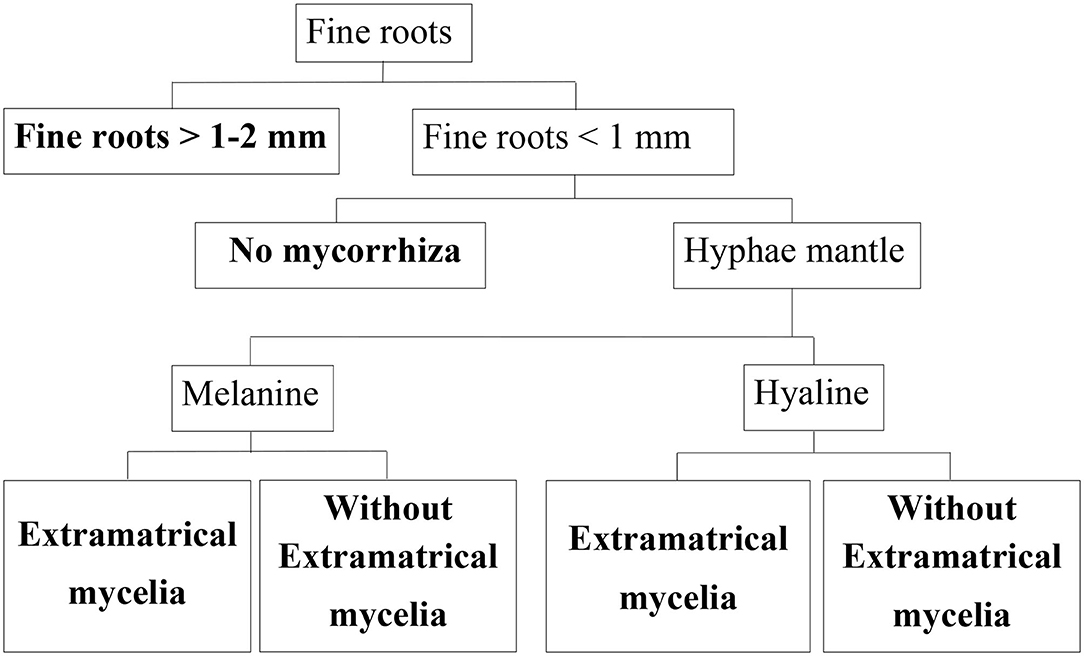
Figure 2. Classification tree for beech fine roots. End members of classification branches (bold letters) are defined below, their abundance was determined in this study.
2.1.2. Classification of Fine Roots
Roots were assigned to different morphological classes according to diameter, existence of a hyphae mantle, type of hyphae, and emanating hyphae as an indication of EM (Figure 2). For this classification, each root cross section on the specimen was assessed. With our microscopic method it is possible to differentiate low order absorptive roots with no secondary development and roots with mainly transport functions based on absence/presence of fully developed cortexes and xylem as suggested by McCormack et al. (2015). Nearly none of our cross sections showed fully developed cortex.
Microscopic images of different fine root classes are shown exemplary in Figure 3.
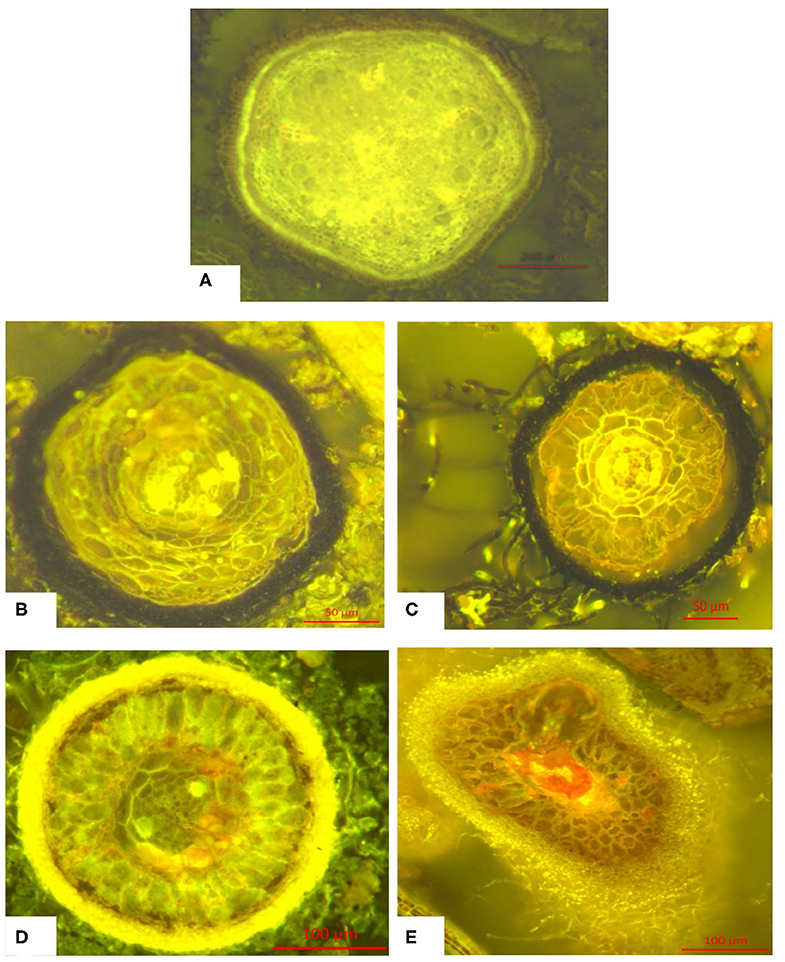
Figure 3. Typical morphology of the classes of fine roots (<1 mm) defined above: (A) Fine root without hyphae mantle (without mycorrhization), (B) Fine root with melanine hyphae mantle, (C) Fine root with hyaline hyphae mantle, (D) Fine root with melanine hyphae mantle and melanine extramatrical mycelium, (E) Fine root with hyaline hyphae mantle and hyaline extramatrical mycelium. Further information can be found in Figure S1.
2.1.3. Calculations
For the first level (Figure 1) the fine root (1–2 mm) frequency per surface area was calculated as:
with AAc as the area of the vertical root-auger core surface and N1−2mm as the number of visible fine roots tips (1–2 mm). For the second level (Figure 1) the fine root (<1 mm) of the mini core cross section were counted to calculate the frequency:
With AMC as the area of mini core surface and N<1mm as the number of fine roots (<1 mm). Finally, the number of fine roots (<1 mm) was averaged across the vertical repetitions of up to five slices. By assuming that the detected cross sections of roots were part of an isotropic multitude of vectors in 3 D space, fine root length densities (RLD/cm cm−3; in Weibel, 1980) were derived from the number of cross sections per area (Weibel, 1980; Schack-Kirchner et al., 2000; Van Noordwijk et al., 2000):
where LR is the root length [cm], VS is the soil volume [cm3], α is the dimensionless factor of isotropy (we assumed complete isotropy with α = 2; Weibel, 1980), NR is the number of the counted fine roots, and AS is the soil area. Based on the specific RLD (LR/VS), thickness of each horizon H and average diameter for each fine root trait per horizon, we calculated the fine root surface area index (RAI/m2 m−3) per soil volume:
The RAI was related to the stand area, separately for each genetic soil horizon, as a proxy for the absorbing fine root surface considering the thickness of each horizon. The calculations were carried out for the different fine root classes.
2.1.4. Statistics
From each mini core we assessed four to five cross sections. The root-observations have been averaged because these samples are not statistically independent. From each soil horizon we obtained 12 averaged mine core data sets of root counts originating from three soil cores. Because variability of root counts within soil cores was much lower than between soil horizons and average results of the respective soil cores individually reflected already the overall horizon pattern, we regarded the averaged mine core results as statistically independent, so we have N = 12. To test the observed differences in medians for statistical significance we used the multiple non-parametric multiple Dunn's test with Bonferroni correction (Kruskal–Wallis-test, p < 0.05) (https://cran.r-project.org/web/packages/dunn.test/dunn.test.pdf).
3. Results
In total, we measured and classified 6,969 fine roots (<1 mm) in BBR and 13,587 fine roots (<1 mm) in LUE. Diameters >500 μm were observed rarely, the frequency maximum was usually below 100 μm. (Figure 4). Roots (d > 1 mm) were found only sporadically. By far the highest number of fine roots were found in the topsoil of LUE.
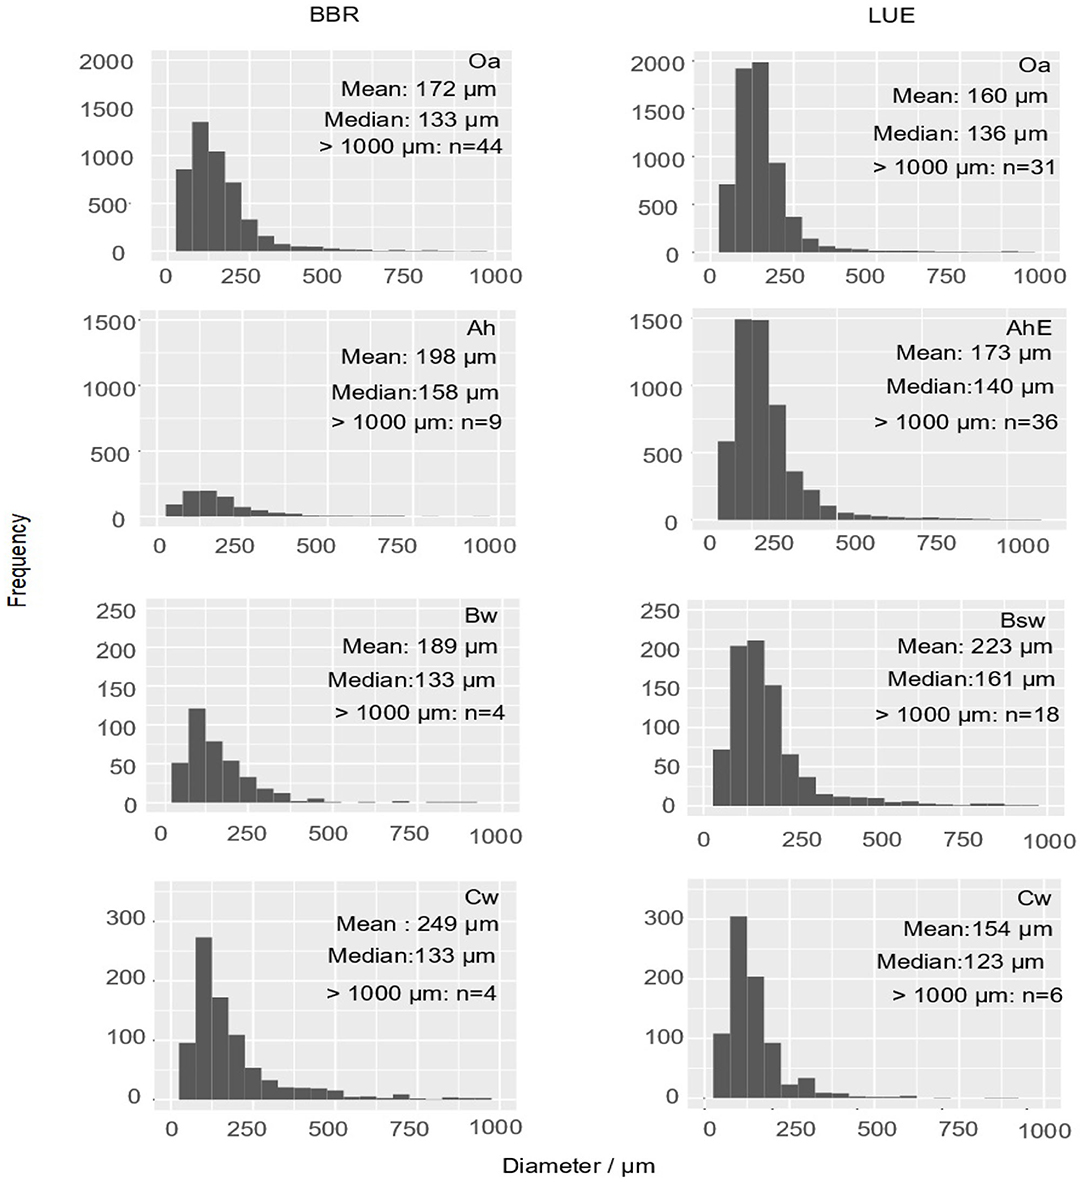
Figure 4. Histograms display the absolute frequency of fine root cross sections (<1,000 μm) as diameter distributions of the mini cores (about 2 cm2) of both sites and each horizon. The arithmetic mean and the median of diameters of the fine roots <1,000 μm as well as the number of roots >1,000 μm are inserted as numbers.
In general, the degree of mycorrhization was lower at BBR than at LUE. The least share of mycorrhizal roots at BBR was observed in the Oa horizon (<9.7%) and at LUE in the Cw horizon (33.1%, Figure 5). In comparison, horizons with the highest portion of mycorrhizal roots were the Cw horizon in BBR (41.5%) and in the Bsw horizon in LUE(>51%).
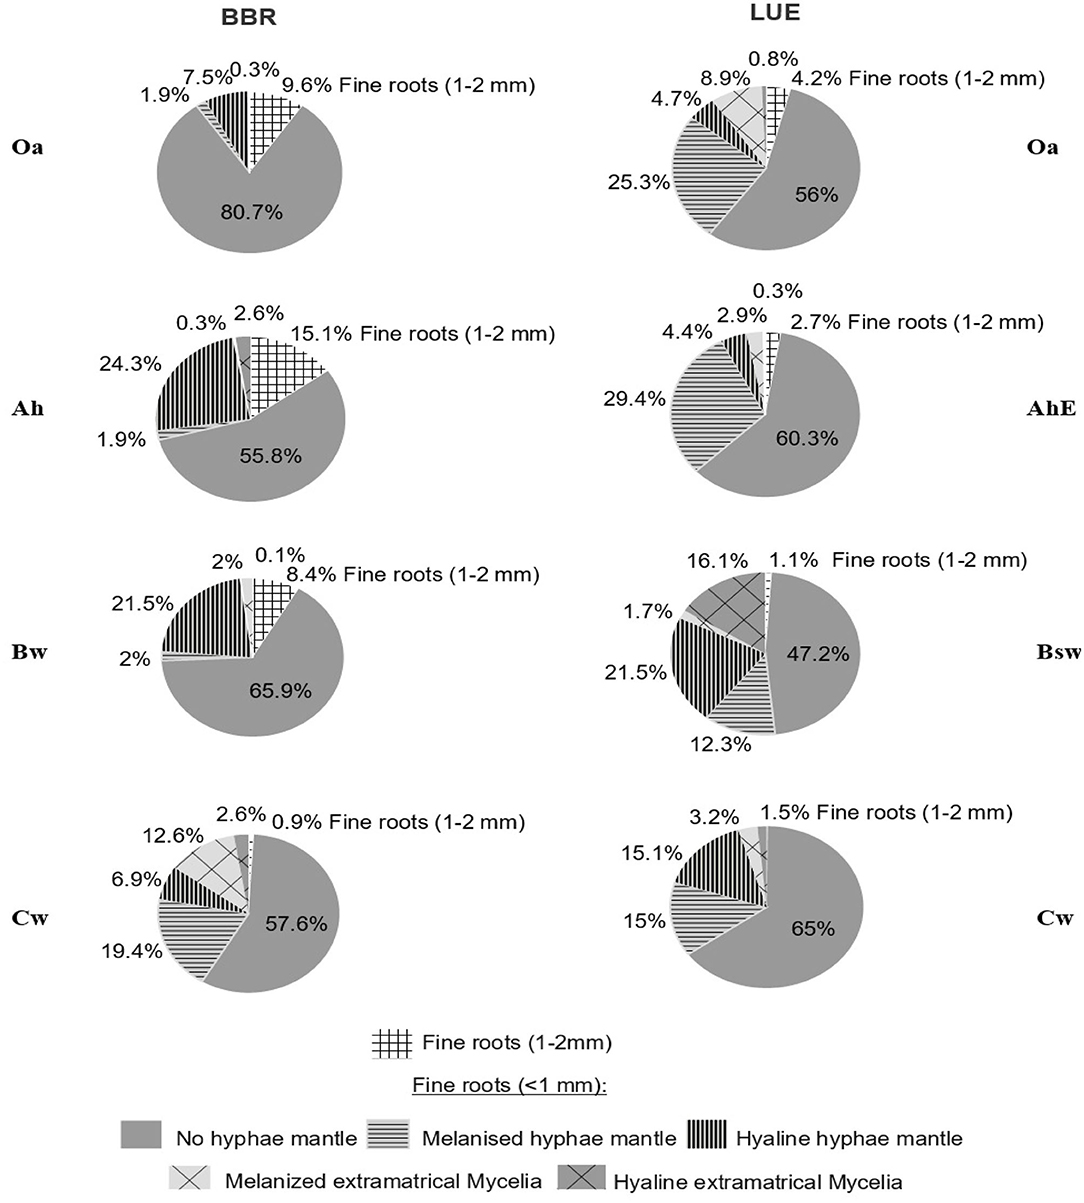
Figure 5. Relative frequency of the different fine root classes per horizons and sites.
The highest portion of fine roots (<1 mm) with extramatrical mycelium was found in the Cw horizon of BBR (13%) and in the Bsw horizon of LUE (16%). In addition, at BBR the portion of hyaline mycelia was higher than at LUE.
The highest relative portion of fine roots (<1 mm) with EM were found in the Cw horizon of BBR (12.6%) and in the Bsw horizon of LUE (16.1%), the lowest portion were in the Oa horizon of BBR (0.3%)and in the AhE and the Bsw horizon of LUE (3.2%). Melanine mycorrhization dominated in the topsoil of LUE and in the Cw horizon of BBR, hyaline mycorrhization dominated in the Ah horizon of BBR and in the Bsw horizon of LUE. In the Oa, AhE, and Cw horizons of LUE and in the Bw and Cw of BBR, the EM was dominated by melanine hyphae, whereas the other horizons of BBR and LUE were dominated by hyaline EM.
In BBR, the RLD1−2mm [cm cm−3] consistently decreased with depth while the RLD<1mm [cm cm−3] decreased from the Oa to the Bw horizon but rose again in the Cw horizon (Table 3). In LUE, both fine root length densities revealed a steady decrease with depth (Table 3). At both sites, the ratio of RLD<1mm to RLD1−2mm increased with depth except the Ah horizon in BBR. However, in LUE this ratio was consistently two to six times higher than in BBR.
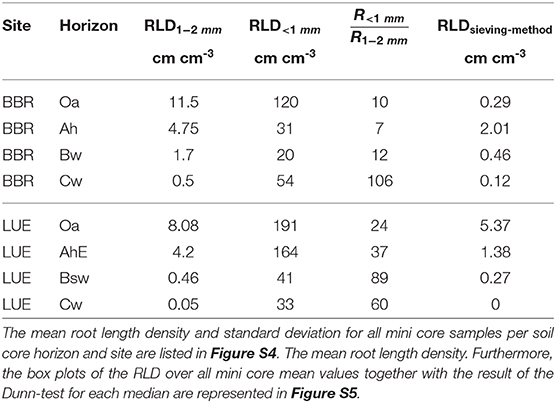
Table 3. The calculated root length density (RLD) and the ratio of root length density (RLD) <1 mm to root length density (RLD) (1–2 mm) are compared to the RLDsieving−scanningmethod of sieving-scanning method of Lang et al. (2017) at the same sites.
From each soil horizon we obtained 12 averaged mine core data sets of root counts originating from 3 soil cores. All soil cores are similar (Figure S4) which is why all mini core samples can be considered as an independent sample (Figure S4). For these we calculated root length density (RLD) and the ratio of root length density (RLD) <1 mm to root length density (RLD) (1–2 mm) are represented. Furthermore, we compared the RLD of our method with the RLDsieving−scanningmethod of a routine sieving-scanning method of Lang et al. (2017) also performed at both sites (Table 3).
In the following it is analyzed whether the horizons within the profiles or whether the same horizons of the different profiles differ (Figure 6). It can be clearly seen that the variability is between the soil cores, which means that the heterogeneity within the horizons is not so significant.
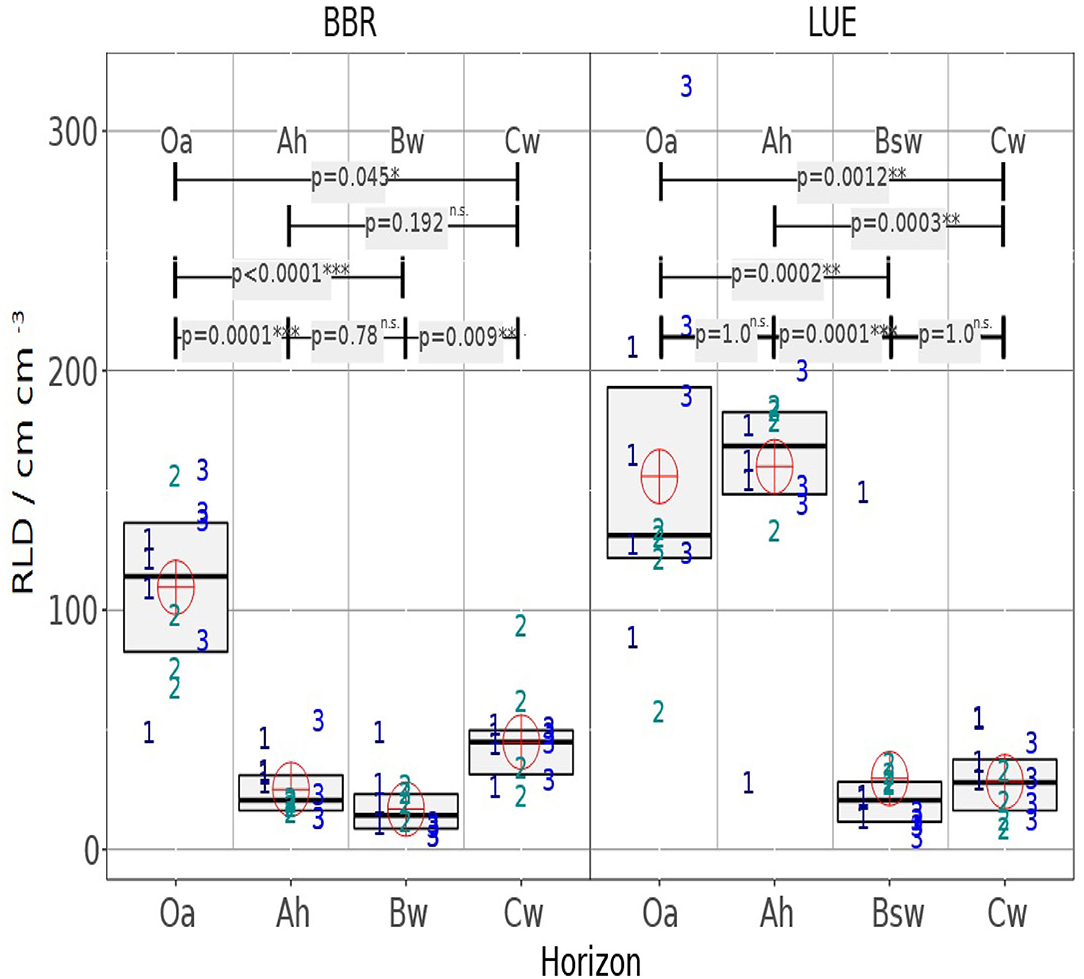
Figure 6. The RLD boxplot chart shows the median and interquartile range (IQR) for four mini cores of three drill cores, each and for the studied horizons. Symbol numbers indicate the drill core number of the analyzed minicore the cross indicates the mean value of all 4 × 3 mini cores per horizon. The upper part of the graph shows the p-value of the Dunn test for the different medians.
Based on the RLD and mean diameter (Figure 5), we calculated a root surface area index (RAI) [m2 m−3], (Figure 7). If RAI is related to the genetic horizon depths up to 1 m soil depth, the weighted RAI is obtained (right bar). We regard this weighted cumulative RAI as a measure of as the potentially absorbing area per stand area. In LUE the total this RAI is almost twice as high and the mycorrhizal RAI almost three times as high as in BBR. The horizon-specific RAIs reveal the disproportionately high contribution of the only 11 cm thick organic topsoils (Oa and AhE) in LUE and the only 2 cm thick Oa horizon and 21 cm Cw horizon in BBR.
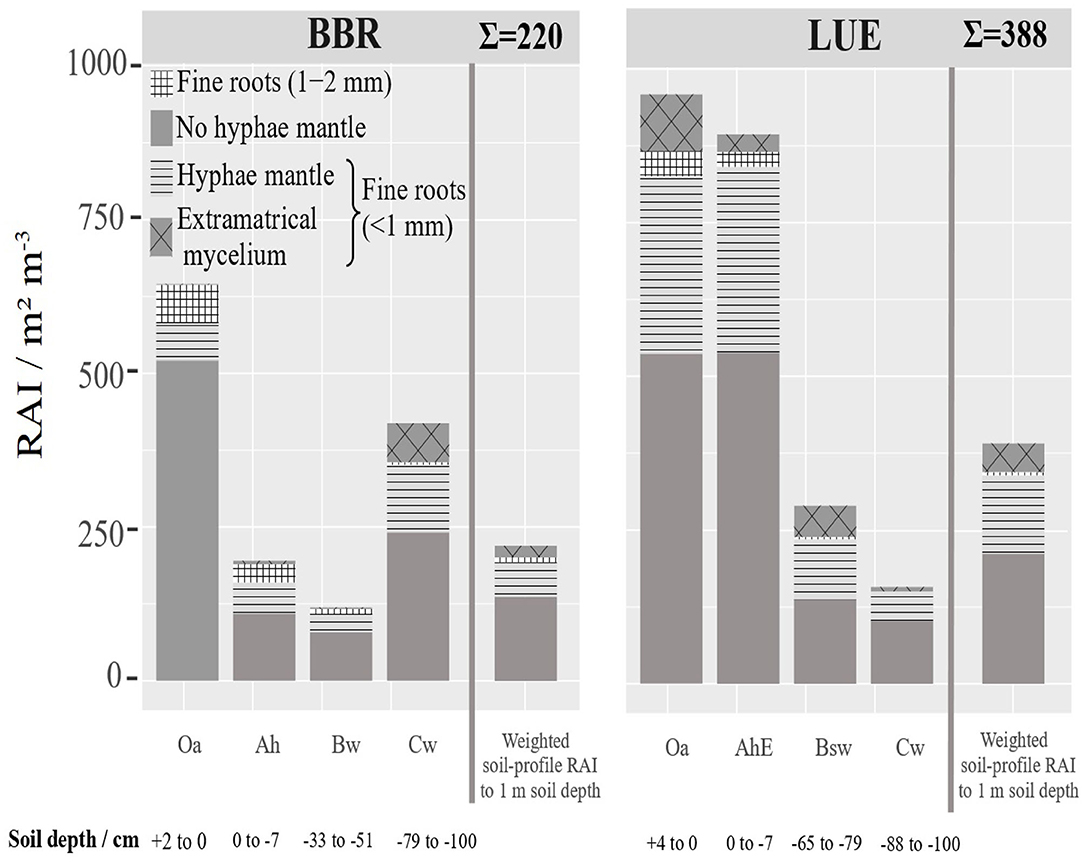
Figure 7. Depth distribution of the root surface area index (RAI) (<2 mm) [m2 m−3] at BBR and LUE separately for the analyzed horizons. The fine root surface area down to 1 m soil depth related to ground area [m2 m−3] was estimated based on the thickness of horizons and is presented as cumulative bar. For LUE the Of horizon was added in fine root surface area index. For error bars see Figure S4. The mean root length density and standard deviation.
In Figure 8, we have related the RLD to the soil concentration of available P, which reaches 300 mgkg−1 in the Oa of BBR and only 50 mgkg−1 in the Oa in LUE. The general pattern at both sites was an increase in total RLD of fine roots <1 mm with P availability regardless of soil depth. However, the total mycorrhizal root length and its share in the total root length do not show a clear pattern. To test the influence of P on the RLD distribution, we tested correlations between the different RLDs and P, soil texture, pH, base cations, etc. for each site separately (Figures S2, S3). However, we could not find any influence on the root length density in our correlations, except the soil P content (Figures S2, S3).
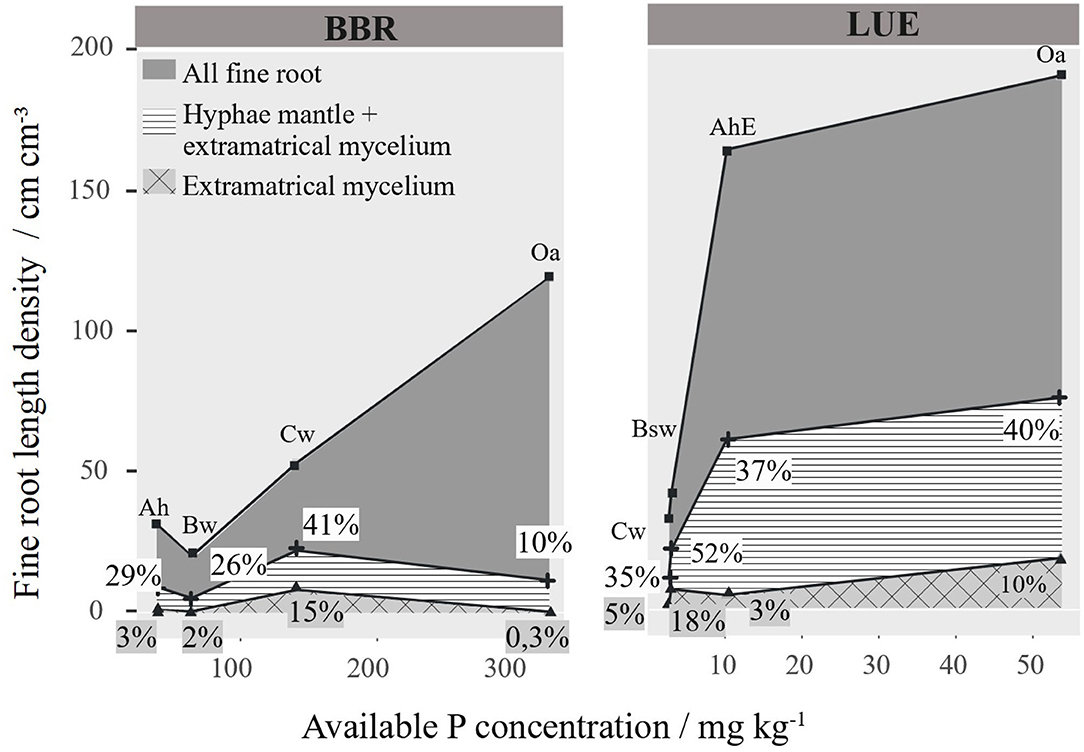
Figure 8. Mycorrhizal and non-mycorrhizal fine root length density (RLD) [cm cm−3] per horizon arranged to site specific available phosphorus. Percentage of the different mycorrhizal root lengths are given as numbers.
4. Discussion
4.1. The Method Applied
We observed that 82% of the absorbing root surface was bound to fine roots having a diameter smaller than 100 μm. These results were in contrast to results reported by Weemstra et al. (2017) that most of the fine roots of European beech were part of the diameter classes 200–750 μm. In agreement, also other studies indicated low abundance of root diameter classes smaller than 500 μm (e.g., Leuschner et al., 2001). A direct comparison of visual and microscopic scanning approaches provided in Table 3 supports that visual methods in particular fail to quantify the roots smaller than 1 mm (Table 3). In agreement, also the roots surface seems to be strongly underestimated by conventional methods (Jackson et al., 1996; Kirfel et al., 2019) sieving-scanning or washing-scanning cause losses especially of small fine roots. Furthermore, picking out roots manually, also results in an underestimation of fine roots since only roots seen by eyes without the support of a microscope, are selected.
Functional traits of roots are in the center of current research (McCormack et al., 2015). An advantage of our method is the possibility to differentiate between absorptive roots and roots with mainly transport functions based on anatomic features (section 2.1.2, Figure 3). Thus, we could verify directly that all cross sections of fine roots corresponded to the morphology of absorptive roots according to McCormack et al. (2015). Furthermore, the distinction between intact roots and those with developed or initial symptoms of decay is easily performed on the cross sections. Using undisturbed soil samples and epifluorescence microscopy, we were able to quantify the absorbing root surface and associated fungi. The method reliably differentiates between hyphae forming a mantel or EM. Based on our results it was possible to calculate the total absorbing root area root-fungi associations, which is a crucial component of plant-uptake models (Schnepf and Roose, 2006).
4.2. Controls of Rooting Density and Abundance of Root Classes
Our results confirm that beech trees adapt their root traits according to P availability, as shown by the efficient way of mycorrhization. This leads to a generally higher absorbing area at the P-poor site compared to the P-rich site, which compensates for the low P fluxes from soil to root surface. Soil texture, pH-value, and other soil chemical parameters can have an influence on fine roots, so many studies address this aspect. In order to test these influences, a correlation of the fine root length density and the absorbing fine root surface per site with the soil chemical parameters (Ca, Fe, K, Mg, Mn, Na) as well as with the soil texture and pH-value was performed. We could only observe a positive correlation between root length density and soil P-content (Figures S2, S3). This indicates that P could have a significant influence on the root length density. However, we cannot claim that only P has an influence on the root length density. The significant negative correlation between the soil pH value and the fine root length density could be linked to an indirect correlation, an inter-correlation with the PO4 content. Thus, it can be excluded that the pH value causes the site specific differences between these two sites. This is in line with Richter et al. (2007, 2013) who show that there is an influence of base saturation and pH values on the fine roots of beech, but that this influence is smaller than expected. Now both LUE and BBR can be assigned to the base saturation group >5%, since for example the AhE horizon of LUE has a base saturation of 7% and the Ah horizon of BBR of 20%.
In our study RLD<1mm was significantly higher at the P-poor site LUE than at the P-rich site BBR, whereas RLD1−2mm showed no significant difference. The maximum ratio between RLD<1mm and RLD1−2mm was two to six times higher at the P-poor site than at the P-rich site.
Thus, the soil profile scale shows that the surface area and mycorrhization of fine roots (<1 mm) increase with P availability. The significant correlation between the ratio of mycorrhizal RLD to citrate-extractable PO4 at both sites (Figures S2, S3) indicated that root growth and mycorrhization is concentrated on horizons with high P availability. In contrast, comparing different sites, Fitter (1985) observed increasing specific root length with decreasing P availability. This is in agreement with our results regarding the comparison of the two different sites. At the P-poor site, LUE, the root length density is much higher than at the P-rich site BBR. Yet, the highest RLD<1mm was found at both sites in the two Oa horizons with the highest concentration of available P (Table 1, Figure 8). This statement is consistent with the observations of with Meier and Leuschner (2008), Meinen et al. (2009a,b) who showed that beech has a flat root system with the majority (approx. 75%) of fine roots in the Oa and in the topsoil (Meier and Leuschner, 2008; Meinen et al., 2009a,b) this is especially true for P-poor sites (Jonard et al., 2015). In agreement, in our study, the depth distribution of fine roots clearly differed at both sites: LUE had most of the fine roots in the forest floor and topsoil horizon, with 88% of the total fine roots occurring in the upper 11 cm of the soil (Figure 4), whereas the root length density of the Cw horizon was much higher at BBR than at LUE (Table 3).
Further, the total mycorrhizal root length density is much higher in BBR the P-rich site than at the P-poor site LUE. According to Tatry et al. (2009) uptake rates in plant parts with ECM are two to three times higher than in root parts without mycorrhizal fungi, which supports the hypothesis that the greater proportion of mycorrhizal root length is found at the P-poor site. Also, Jones et al. (1990) showed that P inflow rates of ECM roots are about two times higher than those of non-mycorrhizal roots. Furthermore, mycorrhizal fungi can store P (Harley, 1989; MacFall and Slack, 1991) and thus possibly buffering phases of P starvation, which may also reflect an adaptation to low P availability. The low degree of mycorrhization in the Oa horizon of BBR and Cw of LUE seems to contradict the 100% mycorrhization for these sites reported by Zavišić et al. (2016). However, their results exclusively referred to the root tips, while our topological cross-sectional method examined the degree of mycorrhization over the entire root length and thus did not contradict his data. Mycorrhizal fungi can extend their RAI and their spatial coverage by forming EM. According to Nylund and Wallander (1992), this is promoted by low P contents. Therefore, the high frequency of mycorrhizal fungi and the high share of extramatrical mycelium, might help sustain sufficient P uptake at the site LUE in spite of low P availability.
The share of melanine and hyaline mycelia is different for different sites and horizons. Nosanchuk and Casadevall (2003) showed that melanin plays a protective role in unfavorable environments. One function of melanin could be the tolerance to water stress (Fernandez and Koide, 2013) and the protection against dehydration through storage of melanin in cell walls that in turn reduces water loss (Kogej et al., 2006). In contrast to hyaline cells, melanine cells have a high biosorptive capacity for numerous ions, which improves plant growth for plants in toxic environments (Fogarty and Tobin, 1996). Also, metal ions bound to melanin protect against toxicity and inhibition of extracellular hydrolytic enzymes (Fogarty and Tobin, 1996). This enables melanin to prevent enzymatic degradation (Nosanchuk and Casadevall, 2003) and makes hyphae more resistant to decay (Fernandez and Koide, 2013). Consequently, these properties increase the lifespan of melanine roots, thereby maintaining the P supply from litter or mineral soil as needed. The differences between both sites can be explained by the rough harsh soil chemical and physical soil properties at LUE with its higher acidity and sandy texture that could trigger water and mechanical stress. In BBR with its higher pH and water holding capacity, the environment for hyphae is probably more favorable. The higher robustness of melanine hyphae could also explain the strong dominance of the melanine hyphae in the EM. Extramatrical mycelium is more vulnerable to extreme conditions than hyphae in the mantle around the root, which is where we observed more hyaline hyphae. Finally, we cannot provide any information on mycorrhizal species composition, since our fine root classes are based on simple morphological characteristics. Such data have been provided for the study sites by Zavišić et al. (2018). Their molecular genetic determination of mycorrhizal fungi identified 14 different fungal morphotypes with 25 taxa by ITS sequencing. He showed that both sites had different taxa, with the greater biodiversity being found at the P-rich site indicating that different morphotypes might be linked to different species composition.
4.3. Root-Mycorrhizal Fungi Associations and P Nutrition Strategies of Beech Forest Ecosystems
As hypothesized we found clear differences between the traits of root/mycorrhizal associations at both sites, which would not have been identified by routine methods for fine root quantification: We found higher RLD on the P-poor than on the P-rich site and a higher portion of mycorrhizal root surface. Within the soil profiles, the plants clearly concentrate non-mycorrhizal roots in the P-rich horizons. In general, the different root morphology would support the different P nutrition strategies assumed for P-poor and P-rich beech forests (Lang et al., 2017). At the P-rich site BBR where the forest ecosystem is assumed to acquire P from mineral resources we observed a high percentage of overall root surface in the Cw subsoil horizon besides the Oa horizon. This intense rooting in the subsoil seems to be mirrored by the concentration of soil organic matter at 1 m soil depth. The Corg content at BBR is still 11 mg C g−1 at this depth, while at the site LUE we only measured 1 mg C g−1. This might indicate, that small fine roots neglected by conventional approaches represent a major source for deep-soil organic matter. In contrast, root length density was extremely high in the Oa and the AhE horizon in the P-poor ecosystem LUE, which is assumed to sustain its P supply by taking up P mobilized from organic matter. The prominent role of the Oa horizon for P uptake at the site LUE is further supported by its extension. Forest floor mass at LUE was five times higher than at site BBR.
5. Conclusion
The results of our quantitative micro morphological cross sections analyzes of undisturbed soil samples, are in agreement with the idea that we could show that beech forest nutrition strategies are reflected in the distribution of fine roots and the associated mycorrhization of European beech forests. The method gives new insights into the distribution and morphological traits of absorptive roots in forest stands including the size of the RAI and the degree and type of mycorrhization. Overall our study indicates, that the major part of fine roots had been overseen by conventional approaches for fine root quantification. Based on the detailed root information provided to confine idea of adaptation to forest ecosystem on P scarcity, which has to be validated by future studies: The depth distribution of the fine roots was controlled by P availability. Intense root growth in regions with high P availability, is compensated by reduced root growth in areas with low P availability. This mechanism would enhance the realization of either recycling or acquiring by European beech. As a consequence, the contrasting overall high rooting density at P-poor sites and the overall low rooting density at high-P sites is unlikely to be directly triggered by soil solution concentrations but seem to be rather the result of long-term adaptation to P scarcity.
Data Availability Statement
The raw data supporting the conclusions of this article will be made available by the authors, without undue reservation.
Author Contributions
CL carried out the experiment, analyses, and wrote the first draft of the manuscript. CL and HS-K performed the statistical analysis. All authors contributed to manuscript revision, read, and approved the submitted version.
Funding
The project was funded by the German Research Foundation (DFG, GZ: LA 1398/12-2 AOBJ: 632054).
Conflict of Interest
The authors declare that the research was conducted in the absence of any commercial or financial relationships that could be construed as a potential conflict of interest.
Acknowledgments
The authors gratefully acknowledge to be part of the priority program 1685 Ecosystem Nutrition: Forest Strategies for limited Phosphorus Resources.
Supplementary Material
The Supplementary Material for this article can be found online at: https://www.frontiersin.org/articles/10.3389/ffgc.2020.00095/full#supplementary-material
References
Ad-hoc-AG Boden (2005). Bodenkundliche Kartieranleitung: Ed.: Bundesanstalt für Geowissenschaften und Rohstoffe in Zusammenarbeit mit den Staatlichen Geologischen Diensten. E. Schweizerbart'sche Verlagsbuchhandlung (Nägele und Obermiller), 5th Edn. Hanover.
Altemüller, H.-J. (1989). Zur Fluoreszenzmikroskopischen Darstellung Biologischer Objekte in Boden-dünnschliffen. Mitteilungen der Deutschen Bodenkundlichen Gesellschaft, 517–522.
Bengough, A. G., Mackenzie, C. J., and Diggle, A. J. (1992). Relations between root length densities and root intersections with horizontal and vertical planes using root growth modelling in 3-dimensions. Plant Soil 145, 245–252. doi: 10.1007/BF00010353
Böhm, W. (1979). Methods of Studying Root Systems, Vol. 33 of Ecological Studies. Berlin: Springer. doi: 10.1007/978-3-642-67282-8
Bolan, N. S. (1991). A critical review on the role of mycorrhizal fungi in the uptake of phosphorus by plants. Plant Soil 134, 189–207. doi: 10.1007/BF00012037
Clemmensen, K. E., Bahr, A., Ovaskainen, O., Dahlberg, A., Ekblad, A., Wallander, H., et al. (2013). Roots and associated fungi drive long-term carbon sequestration in boreal forest. Science 339, 1615–1618. doi: 10.1126/science.1231923
Colpaert, J. V., Van Assche, J. A., and Luijtens, K. (1992). The growth of the extramatrical mycelium of ectomycorrhizal fungi and the growth response of Pinus sylvestris L. New Phytol. 120, 127–135. doi: 10.1111/j.1469-8137.1992.tb01065.x
Demand, D., Schack-Kirchner, H., and Lang, F. (2017). Assessment of diffusive phosphate supply in soils by microdialysis. J. Plant Nutr. Soil Sci. 180, 220–230. doi: 10.1002/jpln.201600412
Fernandez, C. W., and Koide, R. T. (2013). The function of melanin in the ectomycorrhizal fungus cenococcum geophilum under water stress. Fungal Ecol. 6, 479–486. doi: 10.1016/j.funeco.2013.08.004
Finér, L., Ohashi, M., Noguchi, K., and Hirano, Y. (2011). Fine root production and turnover in forest ecosystems in relation to stand and environmental characteristics. For. Ecol. Manage. 262, 2008–2023. doi: 10.1016/j.foreco.2011.08.042
Fitter, A. H. (1985). “Functional significance of root morphology and root system architecture,” in Ecologicai Interactions in Soil, eds A. H. Fitter, D, Atkinson, D. J. Read, and M. B. Usher (Oxford, UK: Blackwell Scientific Publications), 87–106.
Fogarty, R. V., and Tobin, J. M. (1996). Fungal melanins and their interactions with metals. Enzyme Microb. Technol. 19, 311–317. doi: 10.1016/0141-0229(96)00002-6
Harley, J. L. (1989). The significance of mycorrhiza. Mycol. Res. 92, 129–139. doi: 10.1016/S0953-7562(89)80001-2
Hauenstein, S., Neidhardt, H., Lang, F., Krüger, J., Hofmann, D., Pütz, T., et al. (2018). Organic layers favor phosphorus storage and uptake by young beech trees (Fagus sylvatica l.) at nutrient poor ecosystems. Plant Soil 432, 289–301. doi: 10.1007/s11104-018-3804-5
Hinsinger, P., Brauman, A., Devau, N., Gérard, F., Jourdan, C., Laclau, J.-P., et al. (2011). Acquisition of phosphorus and other poorly mobile nutrients by roots. Where do plant nutrition models fail? Plant Soil 348:29. doi: 10.1007/s11104-011-0903-y
Jackson, R. B., Canadell, J., Ehleringer, J. R., Mooney, H. A., Sala, O. E., and Schulze, E. D. (1996). A global analysis of root distributions for terrestrial biomes. Oecologia 108, 389–411. doi: 10.1007/BF00333714
Johnson, D. W., and Turner, J. (2019). Nutrient cycling in forests: a historical look and newer developments. For. Ecol. Manage. 444, 344–373. doi: 10.1016/j.foreco.2019.04.052
Jonard, M., Fürst, A., Verstraeten, A., Thimonier, A., Timmermann, V., Potočič, N., et al. (2015). Tree mineral nutrition is deteriorating in Europe. Glob. Change Biol. 21, 418–430. doi: 10.1111/gcb.12657
Jones, M. D., Durall, D. M., and Tinker, P. B. (1990). Phosphorus relationships and production of extrametrical hyphae by two types of willow ectomycorrhizas at different soil phosphorus levels. New Phytol. 115, 259–267. doi: 10.1111/j.1469-8137.1990.tb00451.x
Kirfel, K., Heinze, S., Hertel, D., and Leuschner, C. (2019). Effects of bedrock type and soil chemistry on the fine roots of European beech-a study on the belowground plasticity of trees. For. Ecol. Manage. 444, 256–268. doi: 10.1016/j.foreco.2019.04.022
Kogej, T., Gorbushina, A. A., and Gunde-Cimerman, N. (2006). Hypersaline conditions induce changes in cell-wall melanization and colony structure in a halophilic and a xerophilic black yeast species of the genus trimmatostroma. Mycol. Res. 110, 713–724. doi: 10.1016/j.mycres.2006.01.014
Kreutzer, K. (1961). Wurzelbildung junger waldbäume auf pseudogleyböden. Forstwiss. Centralbl. 80, 356–392. doi: 10.1007/BF01821447
Lang, F., Krüger, J., Amelung, W., Willbold, S., Frossard, E., Bünemann, E. K., et al. (2017). Soil phosphorus supply controls p nutrition strategies of beech forest ecosystems in central Europe. Biogeochemistry 136, 5–29. doi: 10.1007/s10533-017-0375-0
Leuschner, C., Hertel, D., Coners, H., and Büttner, V. (2001). Root competition between beech and oak: a hypothesis. Oecologia 126, 276–284. doi: 10.1007/s004420000507
Lopez-Bucio, J., de La Vega, O M, Guevara-Garcia, A., and Herrera-Estrella, L. (2000). Enhanced phosphorus uptake in transgenic tobacco plants that overproduce citrate. Nat. Biotechnol. 18, 450–453. doi: 10.1038/74531
Lorenz, M. (1995). International co-operative programme on assessment and monitoring of air pollution effects on forests-icp forests-. Water Air Soil Pollut. 85, 1221–1226. doi: 10.1007/BF00477148
Lynch, J. (1995). Root architecture and plant productivity. Plant Physiol. 109, 7–13. doi: 10.1104/pp.109.1.7
MacFall, J. S., and Slack, S. A. (1991). Effects of hebeloma arenosa on growth and survival of container-grown red pine seedlings (Pinus resinosa). Can. J. For. Res. 21, 1459–1465. doi: 10.1139/x91-205
Manghabati, H., Kohlpaintner, M., Ettl, R., Mellert, K., Blum, U., and Göttlein, A. (2018). Correlating phosphorus extracted by simple soil extraction methods with foliar phosphorus concentrations of Picea abies (l.) h. karst. and Fagus sylvatica (l.). J. Plant Nutr. Soil Sci. 181, 547–556. doi: 10.1002/jpln.201700536
Marschner, H., and Dell, B. (1994). Nutrient uptake in mycorrhizal symbiosis. Plant Soil 159, 89–102. doi: 10.1007/BF00000098
McCormack, M. L., Dickie, I. A., Eissenstat, D. M., Fahey, T. J., Fernandez, C. W., Guo, D., et al. (2015). Redefining fine roots improves understanding of below-ground contributions to terrestrial biosphere processes. New Phytol. 207, 505–518. doi: 10.1111/nph.13363
Meier, I. C., and Leuschner, C. (2008). Belowground drought response of European beech: fine root biomass and carbon partitioning in 14 mature stands across a precipitation gradient. Glob. Change Biol. 14, 2081–2095. doi: 10.1111/j.1365-2486.2008.01634.x
Meinen, C., Hertel, D., and Leuschner, C. (2009a). Biomass and morphology of fine roots in temperate broad-leaved forests differing in tree species diversity: is there evidence of below-ground overyielding? Oecologia 161, 99–111. doi: 10.1007/s00442-009-1352-7
Meinen, C., Leuschner, C., Ryan, N. T., and Hertel, D. (2009b). No evidence of spatial root system segregation and elevated fine root biomass in multi-species temperate broad-leaved forests. Trees 23, 941–950. doi: 10.1007/s00468-009-0336-x
Nosanchuk, J. D., and Casadevall, A. (2003). The contribution of melanin to microbial pathogenesis. Cell. Microbiol. 5, 203–223. doi: 10.1046/j.1462-5814.2003.00268.x
Nylund, J.-E., and Wallander, H. (1992). “Chapter 5: Ergosterol analysis as a means of quantifying mycorrhizal biomass,” in Methods in Microbiology, Vol. 24, eds J. Norris, D. Read, and A. Varma (Sweden: Academic Press), 77–88. doi: 10.1016/S0580-9517(08)70088-6
Pe nuelas, J., Poulter, B., Sardans, J., Ciais, P., van der Velde, M., Bopp, L., et al. (2013). Human-induced nitrogen-phosphorus imbalances alter natural and managed ecosystems across the globe. Nat. Commun. 4:2934. doi: 10.1038/ncomms3934
Plassard, C., and Dell, B. (2010). [duplikat] phosphorus nutrition of mycorrhizal trees. Tree Physiol. 30, 1129–1139. doi: 10.1093/treephys/tpq063
Raghothama, K. G., and Karthikeyan, A. S. (2005). Phosphate acquisition. Plant Soil 274:37. doi: 10.1007/s11104-004-2005-6
Read, D., (ed.). (1984). The Ecology and Physiology of the Fungal Mycelium British Mycological Society Symposium: The Structure and Function of the Vegetative Mycelium of Mycorrhizal Roots, Vol. 8. Cambridge: Cambridge University Press.
Richter, A. K., Hajdas, I., Frossard, E., and Brunner, I. (2013). Soil acidity affects fine root turnover of European beech. Plant Biosyst. 147, 50–59. doi: 10.1080/11263504.2012.742471
Richter, A. K., Walthert, L., Frossard, E., and Brunner, I. (2007). Does low soil base saturation affect fine root properties of European beech (Fagus sylvatica l.)? Plant Soil 298, 69–79. doi: 10.1007/s11104-007-9338-x
Rousseau, J. V., Sylvia, D. M., and Fox, A. J. (1994). Contribution of ectomycorrhiza to the potential nutrient-absorbing surface of pine. New Phytol. 128, 639–644. doi: 10.1111/j.1469-8137.1994.tb04028.x
Ruess, R. W., Hendrick, R. L., Burton, A. J., Pregitzer, K. S., Sveinbjornssön, B., Allen, M. F., et al. (2003). Coupling fine root dynamics with ecosystem carbon cycling in black spruce forests of interior alaska. Ecol. Monogr. 73, 643–662. doi: 10.1890/02-4032
Schachtman, D. P., Reid, R. J., and Ayling, S. M. (1998). Phosphorus uptake by plants: from soil to cell. Plant Physiol. 116, 447–453. doi: 10.1104/pp.116.2.447
Schack-Kirchner, H., Wilpert, K. V., and Hildebrand, E. E. (2000). The spatial distribution of soil hyphae in structured spruce-forest soils. Plant Soil 224, 195–205. doi: 10.1023/A:1004806122105
Schnepf, A., and Roose, T. (2006). Modelling the contribution of arbuscular mycorrhizal fungi to plant phosphate uptake. New Phytol. 171, 669–682. doi: 10.1111/j.1469-8137.2006.01771.x
Smith, S. E., and Read, D. J. (2009). Mycorrhizal Symbiosis, 3rd Edn. Amsterdam: Elsevier; Academic Press.
Talkner, U., Meiwes, K. J., Potočič, N., Seletković, I., Cools, N., de Vos, B., et al. (2015). Phosphorus nutrition of beech (Fagus sylvatica l.) is decreasing in Europe. Ann. For. Sci. 72, 919–928. doi: 10.1007/s13595-015-0459-8
Tatry, M.-V., Kassis, E. E., Lambilliotte, R., Corratgé, C., van Aarle, I., Amenc, L. K., et al. (2009). Two differentially regulated phosphate transporters from the symbiotic fungus Hebeloma cylindrosporum and phosphorus acquisition by ectomycorrhizal Pinus pinaster. Plant J. 57, 1092–1102. doi: 10.1111/j.1365-313X.2008.03749.x
Tibbett, M., and Sanders, F. E. (2002). Ectomycorrhizal symbiosis can enhance plant nutrition through improved access to discrete organic nutrient patches of high resource quality. Ann. Bot. 89, 783–789. doi: 10.1093/aob/mcf129
Tippkötter, R., and Ritz, K. (1996). Evaluation of polyester, epoxy and acrylic resins for suitability in preparation of soil thin sections for in situ biological studies. Geoderma 69, 31–57. doi: 10.1016/0016-7061(95)00041-0
Tippkötter, R., Ritz, K., and Darbyshire, J. F. (1986). The preparation of soil thin sections for biological studies. J. Soil Sci. 37, 681–690. doi: 10.1111/j.1365-2389.1986.tb00396.x
Van Noordwijk, M., Brouwer, G., Meijboom, F., do Rosário G. Oliveira, M., and Bengough, A. G. (2000). “Trench profile techniques and core break methods,” in Root Methods, eds A. L. Smit, A. G. Bengough, C. Engels, M. Noordwijk, S. Pellerin, and S. C. Geijn (Berlin; Heidelberg: Springer Berlin Heidelberg), 211–233. doi: 10.1007/978-3-662-04188-8_7
Weemstra, M., Sterck, F. J., Visser, E. J. W., Kuyper, T. W., Goudzwaard, L., and Mommer, L. (2017). Fine-root trait plasticity of beech (Fagus sylvatica) and spruce (Picea abies) forests on two contrasting soils. Plant Soil 415, 175–188. doi: 10.1007/s11104-016-3148-y
Weibel, E. R. (1980). Theoretical Foundations, Vol. 2 of Stereological Methods. London: Academic Press.
Williamson, B., and Alexander, I. J. (1975). Acid phosphatase localised in the sheath of beech mycorrhiza. Soil Biol. Biochem. 7, 195–198. doi: 10.1016/0038-0717(75)90037-1
WRB, (ed.). (2015). World Reference Base for Soil Resources 2014, Update 2015: International Soil Classification System for Naming Soils and Creating Legends for Soil Maps. World Soil Resources Reports. FAO, Rome.
Zavišić, A., Nassal, P., Yang, N., Heuck, C., Spohn, M., Marhan, S., et al. (2016). Phosphorus availabilities in beech (Fagus sylvatica l.) forests impose habitat filtering on ectomycorrhizal communities and impact tree nutrition. Soil Biol. Biochem. 98, 127–137. doi: 10.1016/j.soilbio.2016.04.006
Keywords: phosphorus-nutrition, fine root length, ectomycorrhiza, beech forests, root size class, epifluorescence microscopy, polished soil sections
Citation: Loew CAE, Schack-Kirchner H, Fink S and Lang F (2020) Fine Root Size and Morphology of Associated Hyphae Reflect the Phosphorus Nutrition Strategies of European Beech Forests. Front. For. Glob. Change 3:95. doi: 10.3389/ffgc.2020.00095
Received: 11 April 2020; Accepted: 10 July 2020;
Published: 19 August 2020.
Edited by:
Andreas Schindlbacher, Austrian Research Centre for Forests (BFW), AustriaReviewed by:
Xiao-Tao Lu, Institute of Applied Ecology (CAS), ChinaJunwei Luan, International Center for Bamboo and Rattan, China
Copyright © 2020 Loew, Schack-Kirchner, Fink and Lang. This is an open-access article distributed under the terms of the Creative Commons Attribution License (CC BY). The use, distribution or reproduction in other forums is permitted, provided the original author(s) and the copyright owner(s) are credited and that the original publication in this journal is cited, in accordance with accepted academic practice. No use, distribution or reproduction is permitted which does not comply with these terms.
*Correspondence: Caroline A. E. Loew, Y2Fyb2xpbmUubG9ld0Bib2Rlbmt1bmRlLnVuaS1mcmVpYnVyZy5kZQ==