 Kelsey R. Carter1,2*
 Tana E. Wood3Sasha C. Reed4Elsa C. Schwartz1Madeline B. Reinsel5Xi Yang5
 Molly A. Cavaleri1
- 1College of Forest Resources and Environmental Science, Michigan Technological University, Houghton, MI, United States
- 2Earth and Environmental Sciences Division, Los Alamos National Laboratory, Los Alamos, NM, United States
- 3U.S. Department of Agriculture, Forest Service, International Institute of Tropical Forestry, Río Piedras, PR, United States
- 4U.S. Geological Survey, Southwest Biological Science Center, Moab, UT, United States
- 5Department of Environmental Sciences, University of Virginia, Charlottesville, VA, United States
Despite the importance of tropical forests to global carbon balance, our understanding of how tropical plant physiology will respond to climate warming is limited. In addition, the contribution of tropical forest understories to global carbon cycling is predicted to increase with rising temperatures, however, in situ warming studies of tropical forest plants to date focus only on upper canopies. We present results of an in situ field-scale +4°C understory infrared warming experiment in Puerto Rico (Tropical Responses to Altered Climate Experiment; TRACE). We investigated gas exchange responses of two common understory shrubs, Psychotria brachiata and Piper glabrescens, after exposure to 4 and 8 months warming. We assessed physiological acclimation in two ways: (1) by comparing plot-level physiological responses in heated versus control treatments before and after warming, and (2) by examining physiological responses of individual plants to variation in environmental drivers across all plots, seasons, and treatments. P. brachiata has the capacity to up-regulate (i.e., acclimate) photosynthesis through broadened thermal niche and up-regulation of photosynthetic temperature optimum (Topt) with warmer temperatures. P. glabrescens, however, did not upregulate any photosynthetic parameter, but rather experienced declines in the rate of photosynthesis at the optimum temperature (Aopt), corresponding with lower stomatal conductance under warmer daily temperatures. Contrary to expectation, neither species showed strong evidence for respiratory acclimation. P. brachiata down-regulated basal respiration with warmer daily temperatures during the drier winter months only. P. glabrescens showed no evidence of respiratory acclimation. Unexpectedly, soil moisture, was the strongest environmental driver of daily physiological temperature responses, not vegetation temperature. Topt increased, while photosynthesis and basal respiration declined as soils dried, suggesting that drier conditions negatively affected carbon uptake for both species. Overall, P. brachiata, an early successional shrub, showed higher acclimation potential to daily temperature variations, potentially mitigating negative effects of chronic warming. The negative photosynthetic response to warming experienced by P. glabrescens, a mid-successional shrub, suggests that this species may not be able to as successfully tolerate future, warmer temperatures. These results highlight the importance of considering species when assessing climate change and relay the importance of soil moisture on plant function in large-scale warming experiments.
Introduction
Tropical forests cycle a disproportionate amount of Earth’s carbon dioxide (CO2) relative to their total land area and have the highest photosynthetic rates and aboveground carbon density of all terrestrial ecosystems (Beer et al., 2010; Pan et al., 2013; Schimel et al., 2015). These critical biomes are expected to approach temperatures outside their historical climate boundaries within the next decade (Diffenbaugh and Scherer, 2011; Mora et al., 2013). However, the magnitude and direction of the effects of climate warming on tropical forest carbon balance are not well constrained (Korner, 2004; Lloyd and Farquhar, 2008; Booth et al., 2012; Wood et al., 2012; Cavaleri et al., 2015). Plant carbon balance is determined by the uptake of CO2 into the system through photosynthesis, and the release of CO2 through respiration, however, these two processes respond differently to changes in temperature. Instantaneous photosynthetic rates increase with increasing temperatures until an optimum is reached, after which net photosynthesis rates decline (Berry and Bjorkman, 1980), whereas respiration rates rise with temperature in an exponential fashion and eventually decline at very high temperatures that cause membrane dysfunction (reviewed in Atkin et al., 2005; O’Sullivan et al., 2013; Heskel et al., 2016). Reduced photosynthesis and increased respiration with warming above photosynthetic optimum temperatures could result in CO2 release exceeding uptake, possibly inducing a positive feedback that would exacerbate climate warming (Cox et al., 2000; Zhang et al., 2014; Drake et al., 2016; Hubau et al., 2020).
Forest upper canopies receive a higher proportion of direct solar radiation; such that, more carbon is cycled in sun leaves than shade leaves (Ellsworth and Reich, 1993). However, even though forest understory layers show lower CO2 uptake rates per unit leaf area compared to upper canopy leaves, shaded leaves absorb the light that is scattered and refracted past the upper leaves, significantly contributing to forest productivity. In fact, due to their high leaf area index, the shaded canopy and understory leaves can contribute more than 50% of gross primary productivity of tropical forests (Chen et al., 2012; He et al., 2018). The role that shaded leaves play in tropical forest carbon cycling may further increase as temperatures rise if upper canopies surpass their thermal thresholds (He et al., 2018; Mau et al., 2018; Pau et al., 2018). Shaded leaves could continue to play an even larger role in forest carbon cycling if elevated CO2 lowers transpiration (Kirschbaum and McMillan, 2018) and, therefore, evaporative cooling in the upper canopy leaves, as this could potentially further increase upper canopy leaf temperatures and reduce photosynthesis (Doughty and Goulden, 2008; Fauset et al., 2019). While some in situ tropical warming studies have focused on upper canopy leaves (Doughty, 2011; Slot et al., 2014), no study - to date - has investigated the physiological responses of tropical understory plants to experimental warming in situ, and rarely do warming experiments in any ecosystem investigate acclimation responses of both photosynthesis and respiration within the same study.
Both photosynthesis and respiration have the capacity to thermally acclimate (i.e., make adjustments to conserve carbon balance), which could mitigate the negative effects of increasing temperatures. Over time periods ranging from days to weeks, photosynthetic thermal acclimation can be measured as an up-regulation of either the optimum temperature of photosynthesis (Topt), the rate of photosynthesis at that optimum temperature (Aopt) (Berry and Bjorkman, 1980; Way and Yamori, 2014), or through a broadened width of the photosynthetic temperature response curve (Ω) (Slot and Winter, 2017; Table 1). Respiratory acclimation to warming, on the other hand, manifests as a down-regulation of either the temperature sensitivity or the basal rate of respiration (Atkin and Tjoelker, 2003). Tropical forests experience more narrow variations in temperature than other latitudinal zones and plant function is determined by their growth environment and evolutionary history. Therefore, tropical species may not have the plasticity necessary to acclimate to climate warming to the same degree as organisms in systems that experience wider diurnal, seasonal, and inter-annual temperature ranges (Janzen, 1967; Cunningham and Read, 2003; Drake et al., 2015). Global meta-analyses (Way and Oren, 2010; Slot and Kitajima, 2015) and an in situ tropical canopy warming experiment (Slot et al., 2014) have shown that tropical plant respiration will likely acclimate to warmer temperatures, however, there is still large uncertainty and conflicting evidence surrounding photosynthetic acclimation (Cunningham and Read, 2003; Slot and Winter, 2017; Smith and Dukes, 2017; Crous et al., 2018). Recent studies on tropical seedlings suggest that some tropical species can photosynthetically up-regulate with increased temperatures (Slot and Winter, 2017; Smith and Dukes, 2017), however, an in situ warming study on tropical canopy leaves resulted in lower photosynthetic rates (Doughty, 2011). Respiration often acclimates even when photosynthesis does not, because a lack of photosynthetic acclimation can lead to less photosynthate available for respiration (Dewar et al., 1999; Atkin and Tjoelker, 2003; Aspinwall et al., 2016), resulting in lower respiration rates due to substrate limitation. There are limited examples of how tropical species will respond to experimental warming in situ (Doughty, 2011; Slot et al., 2014), and to date, no studies have investigated how tropical plants respond to larger-scale, in situ whole-plant warming.
Table 1. Abbreviations and descriptions.
A major consequence of the scarcity of data in tropical forests, particularly for in situ studies, is uncertainty in our capacity to accurately model tropical ecosystem carbon exchange (Cavaleri et al., 2015; Lombardozzi et al., 2015; Mercado et al., 2018). In particular, data that inform models on how vegetation will respond to climate warming are severely lacking for tropical systems (Arneth et al., 2012; Booth et al., 2012; Cernusak et al., 2013; Huntingford et al., 2013; Wood et al., 2019). Although these models are based on the same empirical acclimation functions which were derived mostly from temperate species (Kattge and Knorr, 2007), the degree of this physiological acclimation varies (Lombardozzi et al., 2015; Smith et al., 2016; Mercado et al., 2018). Using a land-surface model, Mercado et al. (2018) recently predicted that photosynthetic capacity will be up-regulated as tropical regions acclimate to warmer temperatures, positively stimulating carbon storage in tropical regions, however, emerging empirical data do not support the idea of increased carbon uptake in African and Amazonian tropical forests (Hubau et al., 2020). To more accurately model future carbon cycling of these key ecosystems, we need to understand if these systems are able to adjust, or acclimate, to warmer temperatures (Huntingford et al., 2013).
To improve the understanding of how tropical understory plant carbon cycling will respond to climate warming, we investigated plant physiological responses of two understory shrubs to elevated temperature using a field-scale warming experiment in a wet tropical forest that heated the understory vegetation and soil using infrared heating panels (Kimball et al., 2018). While we controlled for as much variability as possible, in situ manipulative experiments are inherently variable both spatially and temporally. As a result, treatment differences may be obscured by high environmental variability, especially if sample size is relatively low, as is often the case with time-intensive gas exchange response curve measurements. To address this challenge, in addition to analyzing a binary treatment effect (control vs. warmed), we also assessed plant acclimation capacity by investigating photosynthetic and respiratory responses to daily environmental fluctuations using a more granular statistical approach. Physiological plasticity is directly related to thermal acclimation, as plasticity determines whether a plant has the potential to acclimate (Piersma and Drent, 2003; Atkin et al., 2006; Gunderson et al., 2010). Species that show an ability to adjust in response to environmental variation are likely to perform better under multiple aspects of climate change compared to species with limited physiological plasticity (Nicotra et al., 2010); therefore, assessing plastic responses to environmental variations provide an additional approach for examining plants’ capacity for thermal acclimation.
Based on previous in situ studies showing a lack of up-regulation of net photosynthesis with warming (Doughty, 2011), evidence that tropical plants are operating near physiological thresholds (Doughty and Goulden, 2008; Mau et al., 2018), and the fact that tropical forests have evolved within a very narrow climatic envelope (Janzen, 1967), we expected these tropical shrubs to have limited photosynthetic acclimation potential. We further hypothesized that respiration would acclimate to experimental warming, as respiratory acclimation has been shown in tropical plants developed in situ (Slot et al., 2014).
Materials and Methods
Study Site and Meteorological Variables
This study was conducted at the Tropical Responses to Altered Climate Experiment (TRACE) site located at the USDA Forest Service Sabana Field Research Station, within the Luquillo Experimental Forest (18°18′N, 65°50′W) in northeastern Puerto Rico. This site is located at 100 m elevation in a tropical wet forest, with Ultisol soil classification (Scatena, 1989). Mean annual precipitation during 2014–2016 was 2271 mm, with each month averaging 112–324 mm rainfall. Mean annual temperature is 24°C (Harris et al., 2012). The wet season is May through November, and January through April is drier on average, however, this tropical forest experiences relatively low temperature and precipitation seasonality. In 2016, the site’s basal area of trees >1 cm was 38.76 m2 ha–1 and stand density was 3100 trees ha–1. Canopy height averages ca. 20 m, and light level at mid canopy is approximately 600 μmol m–2 s–1. The site is a secondary forest that, at the time of this study, had been regenerating from abandoned pasture land for approximately 70 years.
Tropical Responses to Altered Climate Experiment is comprised of three heated and three control 4 m-diameter plots located in the forest understory. The heated plots (initiated September 2016) were warmed +4°C using six infrared (IR) heating panels, each positioned in a hexagonal ring and raised approximately 2.6 m above the ground (Figure 1). Control plots had identical infrastructure, but with no electrical power cabling and non-heated black metal panels instead of IR panels. See Kimball et al. (2018) for more detail of experimental design and infrastructure. Plots experienced less than 20% canopy openness (Reed et al., 2020). In August 2017, canopy cover was similar between treatments, where leaf area index was 6.60 ± 0.27 (mean ± sd) in control and 6.34 ± 0.22 in heated plots.
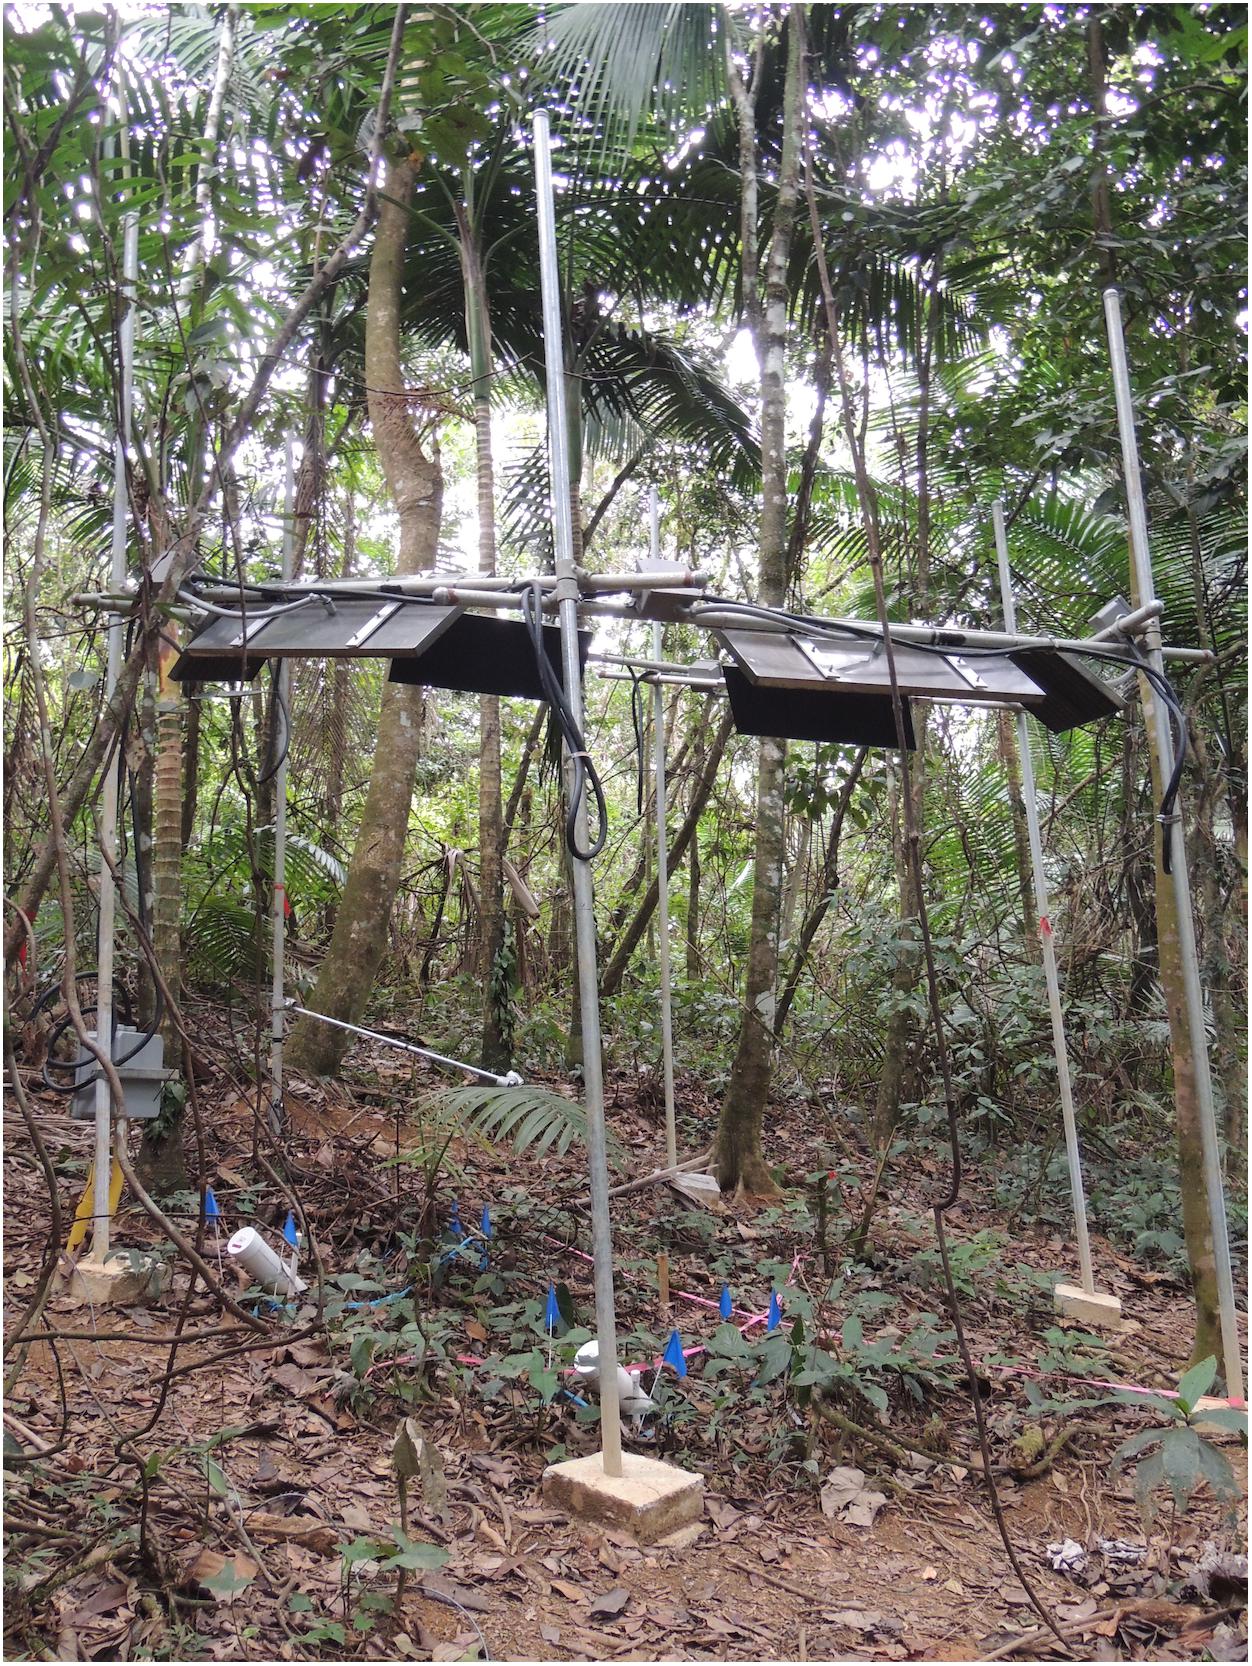
Figure 1. Photograph of one of the experimental warming plots. Photo credit: Aura M. Alonso-Rodríguez.
Above-canopy daily rainfall and air temperatures used to display conditions throughout this study were collected from a 25 m tower weather station located approximately 2 km from the TRACE site (Figure 2A). Daily rainfall (mm) at the tower station was collected using a 10 cm plastic funnel draining into a 180 ml plastic bottle. Surface vegetation temperatures (Tveg) of each plot were monitored using infrared thermometers (SI-121, Apogee Instruments, Logan, UT), which measured vegetation (across multiple plants) and surface soil temperature at the center of each plot with an 18° half angle field of view. Below-canopy air temperature at the study site (CS215, Campbell Scientific, Logan, UT, United States; Supplementary Table S1) and Tveg were recorded using a multiplexer and datalogger (AM16/32, CR1000, Campbell Scientific; Figure 2B). Soil moisture and temperature were measured at the edge, center, and midway between center and edge of each plot at 0–10 cm depth, and additional probes were installed at 20–30 cm depth at the plot center (CS655, Campbell Scientific; Figures 2C,D). Air temperature (Tair) and relative humidity (RH) were measured inside each plot (∼1 m from the ground) using dataloggers (MX2301, Onset Computer Corp., Bourne, MA, United States) from June 20 to August 31, 2017, after the majority of plant gas exchange sampling was completed. Vapor pressure deficit (VPD) was calculated from Tair and RH using the Tetons equation from Monteith and Unsworth (2008).
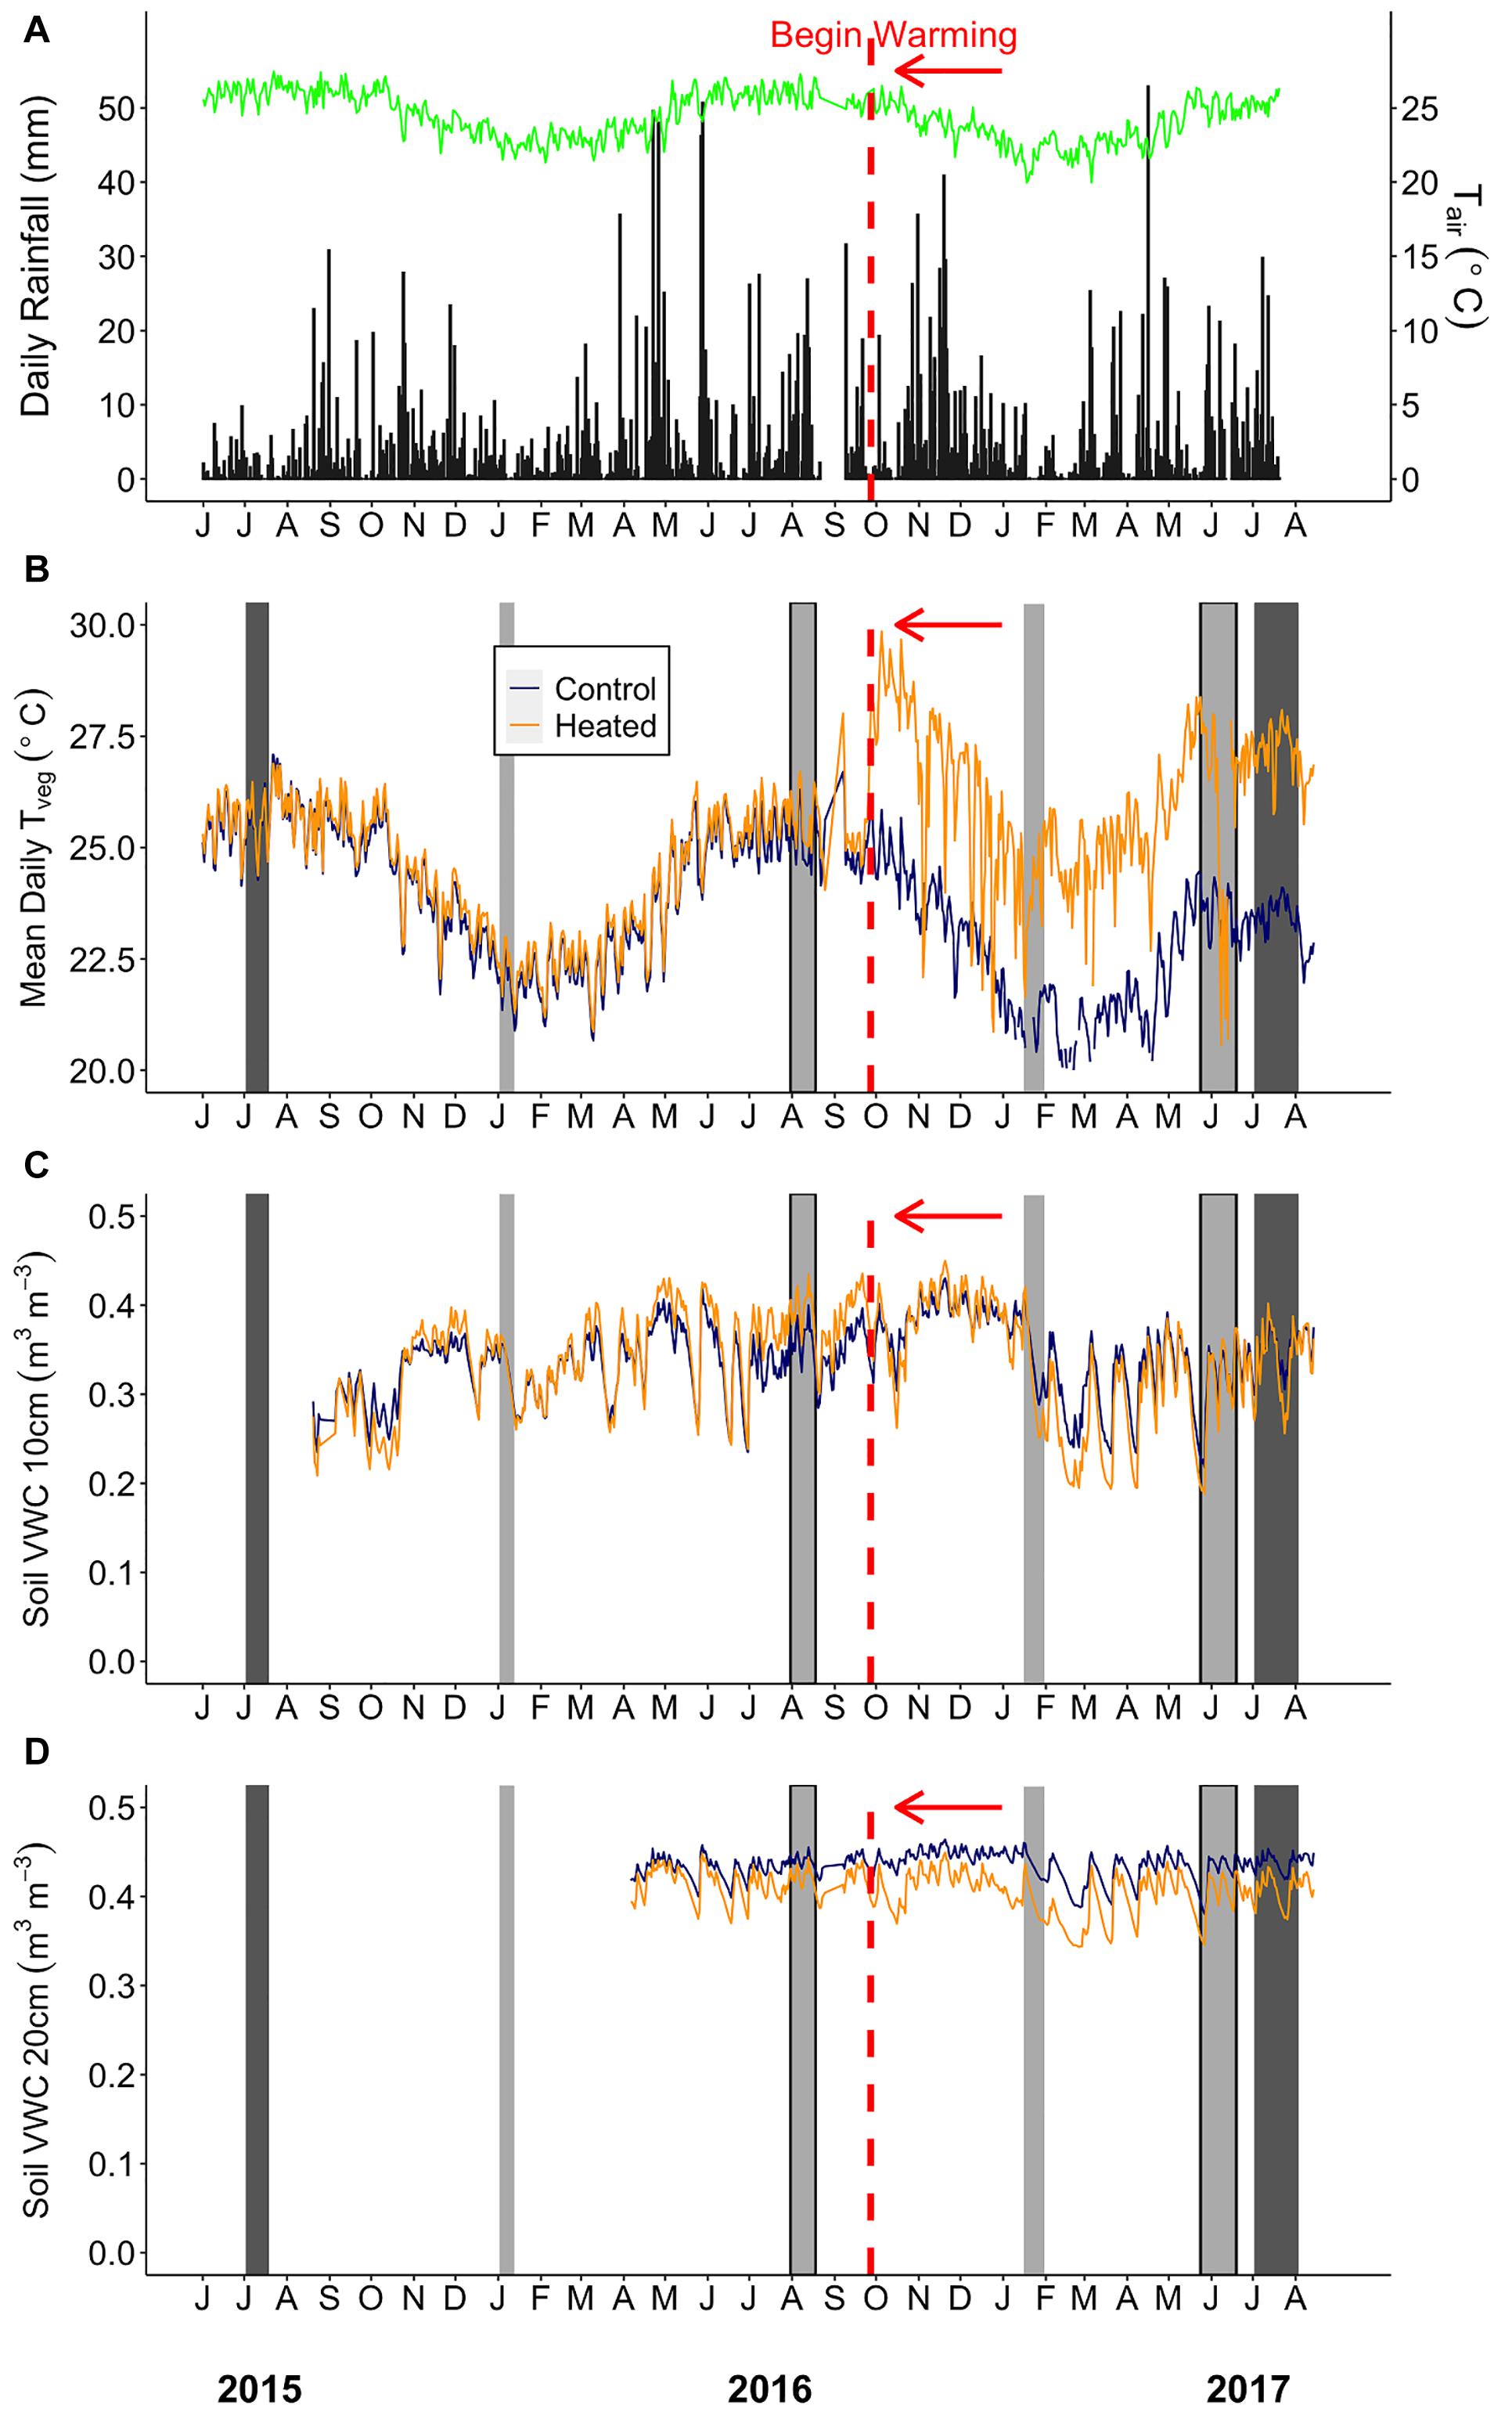
Figure 2. Environmental summaries throughout the duration of the pre-warming and post-warming campaigns. (A) Daily rainfall (black bars) and average daily air temperature (Tair; green line). (B) Mean daily surface vegetation temperature of the heated (orange) and control (dark blue) plots. Mean daily soil moisture at (C) 0–10 cm and (D) 20–30 cm depth for the heated and control plots. The dates shown range from July 1st 2015–August 15th 2017. The vertical red dashed line depicts the beginning of the warming treatment in the heated plots. The light gray bars depict Anet and Rdark sampling campaigns. The sampling campaigns that are light gray bars outlined in black (August 2016 and June 2017) depict campaigns where stomatal size and density was measured. The dark gray bars depict the Vcmax and Jmax sampling campaigns. Rainfall and air temperature were collected from an above canopy weather station. Air temperature (°C) (HMP50-L, Campbell Scientific) was logged using a datalogger (CR1000, Campbell Scientific).
Sampling Design
We measured net photosynthesis, leaf respiration, and stomatal traits during four measurement campaigns: two before and two after the initiation of warming. Pre-warming measurements were taken in January (winter) and August 2016 (summer). Warming was initiated on September 28, 2016, and post-warming measurements were taken in January (winter), after 4 months of warming, and May–June 2017 (summer), after 8 months of warming (Figure 2).
Measurements were conducted on the first fully expanded leaf of the two most common species within the plots: Psychotria brachiata Sw., an early successional shrub that can be prevalent in the shaded understory but performs well in an open canopy environment (Devoe, 1989; Valladares et al., 2000; Pearcy et al., 2004), and Piper glabrescens (Miq.) C. DC., a mid-successional shrub species (Myster and Walker, 1997). Including seedlings under 30 cm height, there were 14–58 individual P. brachiata and 2–84 individual P. glabrescens individuals per plot in 2017. P. brachiata comprised 30% and P. glabrescens comprised 5% of the number of woody plants greater than 30 cm height within the plots. The heights of individuals measured within each plot ranged from 25.5 to 209.0 cm for P. brachiata and 12.0 to 110.0 cm for P. glabrescens. Average stem diameter of individuals measured 2 cm above the soil surface ranged from 3.6 to 37.6 mm for P. brachiata and 3.6 to 10.4 mm for P. glabrescens. Two to four leaves per species per plot were sampled during each campaign from separate individual plants whenever possible (Supplementary Table S2). In the cases where three leaves for a species were not available within a plot, extra leaves were measured from a separate plot. In some instances, there were not enough individual plants throughout the plots to get an adequate samples size; in this case, two leaves from the same individual plant were measured (Supplementary Table S2).
Net Photosynthesis and Stomatal Conductance Response to Temperature
We measured photosynthetic temperature response at 20, 25, 27, 30, 33, 35, 37, and 40°C on attached leaves using an LI6400XT infrared gas analyzer fitted with the 6 cm2 leaf chamber (6400-02B, Li-COR Inc., Lincoln, NE, United States). Temperature was controlled by cycling hot or cold water through the Expanded Temperature Control Kit (6400-88, Li-COR Inc.) using gravity (Mau et al., 2018). Photosynthetic photon flux density was controlled at saturating irradiance (800 μmol m–2 s–1) based on photosynthetic light response curves performed on these understory plants (data not shown), CO2 concentration at 400 ppm, and flow rate between 150 and 500 μmol m–2 s–1 to keep chamber VPD between 1 and 2 kPa. It was sometimes difficult to keep VPD below 2 kPa at temperatures above 35°C, however. Each leaf was allowed approximately 5 min to equilibrate to new chamber conditions. Measurement duration for a single temperature response curve ranged between 40 and 75 min, and measurements were conducted between 8 am and 4 pm. Each measurement campaign lasted 21–35 days. Environmental conditions were variable throughout the day and throughout campaigns.
Net photosynthetic temperature response parameters were extracted using the following equation from June et al. (2004):
where Anet is net assimilation at the instantaneous leaf temperature (Tleaf), and Ω is the difference in Topt and the temperature where photosynthesis is reduced to 37% of Aopt. The parameter Ω is a measure of the width of the temperature response curve, where a larger value of Ω indicates a wider curve, or broader photosynthetic thermal niche. In eight of the 124 curves, Anet peaked outside the range of measured temperatures, and in these instances, Topt and Aopt were determined as the temperature at the maximum rate of photosynthesis, and Ω was not extracted. Therefore, Ω statistical analyses were based on 116 of the 124 temperature response curves. For each curve, we also extracted stomatal conductance at Topt (gs_Opt). The parameter gs_Opt was extracted by fitting linear regressions to each gs - temperature responses and extracting the rate of gs at the photosynthetic optimum temperatures. Before gs_Opt was extracted, gs > 3 standard deviations away from the mean were determined to be outliers outside the range of instrumental error and were removed.
A-Ci Curves
To further investigate mechanisms underlying photosynthetic acclimation, we performed photosynthetic CO2 response curves (A-Ci curves), at multiple temperatures to measure temperature responses of the maximum rates of Rubisco carboxylation (Vcmax) and the maximum rates of electron transport (Jmax). Due to the time intensive nature of performing multiple A-Ci curves across a range of temperatures, only the most common species, P. brachiata, was used for Vcmax and Jmax measurements. Pre-warming measurements were collected in July 2015 and post-warming measurements were taken July–August 2017, after approximately 9 months of warming (Figure 2 and Supplementary Table S2). A-Ci curves were measured on the same leaf at 20, 25, 30, 35, 40°C using a LI6400XT (Li-COR Inc.) fitted with an Expanded Temperature Control Kit (6400-88, Li-COR Inc). Vcmax and Jmax were extracted from each curve constructed from 400, 300, 200, 100, 50, 0, 450, 600, 850, 1000, and 1200 ppm CO2 concentrations, at saturating irradiance (800 μmol m–2 s–1) and a flow adjusted to control chamber VPD from 1 to 2 kPa (A-Ci curves at different temperatures shown in Supplementary Figure S1). Vcmax and Jmax were extracted from the net assimilation rate (Anet) response to internal CO2 concentration (Ci) using the “Ecophys” package (Duursma, 2015) in R version 3.5.0 (R Core Team, 2018), which implements the Farquhar, von Caemmerer, and Berry model (Farquhar et al., 1980; von Caemmerer and Farquhar, 1981). Biochemical parameters were extracted by fitting the Jmax and Vcmax vs. temperature response curves to a peaked Arrhenius function (Medlyn et al., 2002):
where Tk is the measured leaf temperature in Kelvin, (kopt) is the value of Jmax or Vcmax at the optimum temperature (μmol m–2 s–1), Ha is the activation energy, or exponential increase, in an Arrhenius function (kJ mol–1), Hd is the decrease in Jmax or Vcmax after Topt and was held constant at 200 kJ mol–1(Medlyn et al., 2002), and R is the universal gas constant (8.314 JK–1mol–1). Equation 2 was fit as one curve for all measurements made within a single plot; therefore, all measurements collected in one plot were calculated as one sample.
Leaf Dark Respiration
Foliar dark respiration (Rd) was measured on the same leaves that we used to measure net photosynthesis whenever possible. Rd measurements were conducted using a LI6400XT fitted with the 6400-05 conifer chamber head wrapped in aluminum foil and a water jacket (Expanded Temperature Control Kit 6400-088 Li-COR Inc., Lincoln, NE, United States). We used this chamber because it fit larger leaf areas, providing more accurate detection of the low Rd rates. For each measurement, a single leaf was rolled or folded loosely to fit in the chamber and to allow adequate air mixing. Whether or not entire leaves fit inside of the chamber, respiration rates were corrected by the actual leaf area inside the chamber. For respiration – temperature response curves, we measured CO2 efflux rates at 25, 30, 35, 37, and 40°C for each leaf. Measurements began at least 1 h after sunset, from approximately 7:00 pm to no later than 2:00 am. Chamber reference CO2 was controlled at 400 ppm. Each curve took approximately 25–35 min to complete.
Leaf respiration generally declines at temperatures higher than 50°C (O’Sullivan et al., 2017), but shows an exponential increase with temperature below this threshold. We measured the rate of respiration at temperatures up to 40°C; therefore, each respiratory response curve was fitted to the exponential, non-linear equation as in Cavaleri et al. (2008) and Slot et al. (2014):
where Rd is the respiration rate (μmol m–2 s–1) at Tleaf and b0 and b1 are model parameters. The change in respiration rate with every 10°C (Q10) is calculated as:
R25 was calculated using:
where RTleaf is the respiration rate at Tleaf. R25 was calculated for each measurement temperature and then averaged to obtain one value for each leaf.
R:A Ratio
To assess leaf carbon balance, the ratio of leaf respiration to photosynthesis (R:A) was calculated by dividing R25 by the photosynthetic rate at 25°C (A25). A25 was extracted from Eq. 1 by setting Tleaf equal to 25. For the eight curves that would not fit Eq. 1, the actual photosynthetic rate measured at 25°C was used for the values of A25. When respiration and photosynthesis were measured on separate leaves, measurements were matched from the same individual plant.
Stomatal Traits
To provide further mechanistic insight to photosynthetic responses, we measured stomatal size and density during August 2016 (pre-warming) and late June 2017 (post-warming) for P. brachiata only. Stomatal traits were collected on fully expanded leaves that developed during the warming treatment. Stomatal impressions were collected by applying clear nail varnish to the abaxial side of the leaf. Clear cellophane tape was used to remove the dried varnish and mounted to glass microscope slides. Photos of the slides were taken under 20× magnifications using a compound light microscope (Eclipse 400, Nikon Instruments Inc., Melville, NY, United States) and camera (DFC295, Leica Microsystems Inc., Buffalo Grove, IL, United States) fitted with a 55X coupler. Stomatal density was calculated as the number of stomata within the 20× magnified area and divided by total visible area using ImageJ v.1.50. Stomatal size was calculated by multiplying the length and width, including guard cells, of each stoma visible within the magnified area.
Detecting Acclimation by Analyzing Gain Score Treatment Effects
We found differences between plant temperature response parameters in the heated and control plots prior to the initiation of the warming treatment (Figures 3, 4). To account for this natural variation and to avoid spurious treatment effects, the changes in measured physiological parameters (Aopt, Topt, Ω, gs_Opt, Q10, R25, R:A) in response to warming were analyzed using a gain score analysis, rather than simply comparing treatment versus control plants after warming initiation. Gain scores were calculated as the difference between post-warming and pre-warming plot averages, and were analyzed using two-way ANOVAs by treatment, season, and their interaction. Stomatal size and density gain scores were calculated as the difference between post-warming and pre-warming plot averages, measured during summer only, using Student’s t-tests to compare treatments. Jmax and Vcmax data were also only collected once pre- and post- warming (Figures 2B–D); therefore, Student’s t-tests were used to compare differences between the optimum temperature of Vcmax (ToptV), the optimum temperature of Jmax (ToptJ), the rate of Vcmax at ToptV (Vopt), the rate of Vcmax at 25°C, the rate of Jmax at ToptJ (Vopt), and the rate of Jmax at 25°C. Vcmax and Jmax parameters were successfully extracted for two control and three heated plots; therefore, control plot gain scores were analyzed using two of the three control plots.
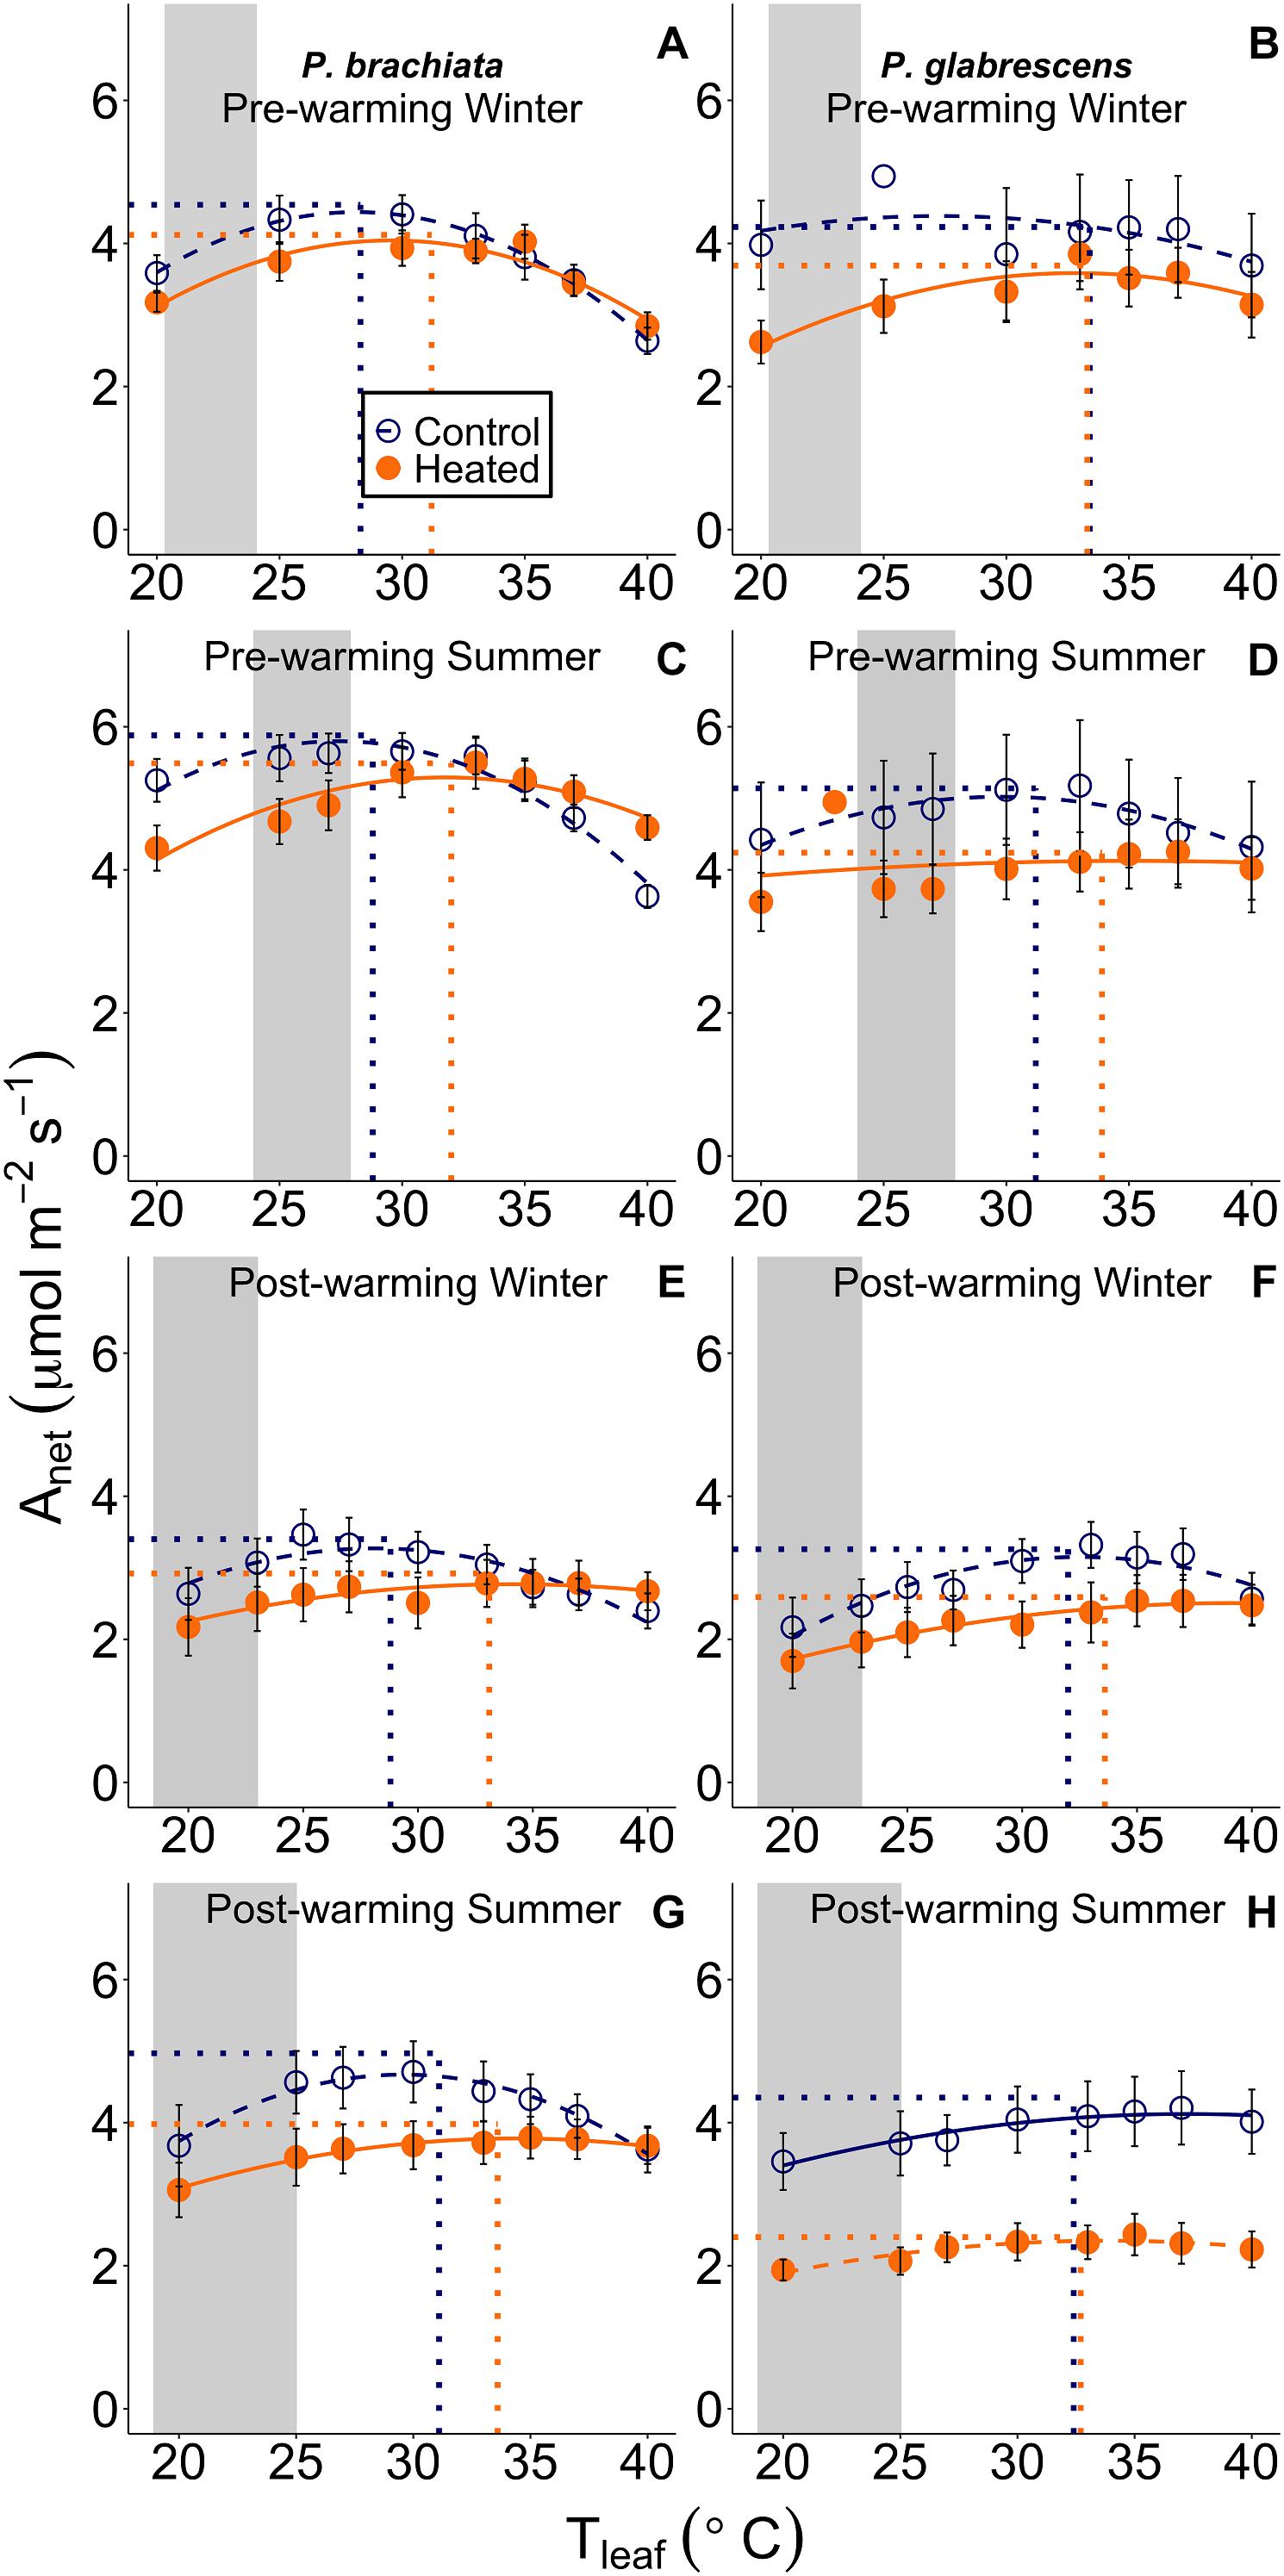
Figure 3. Net photosynthetic (Anet) response to instantaneous leaf temperatures (Tleaf). The relationship between net photosynthesis and temperature was plotted separately for each measurement campaign and species: (A) Psychotria brachiata pre-warming winter season, (B) Piper glabrescens pre-warming winter season, (C) P. brachiata pre-warming summer season, (D) P. glabrescens pre-warming summer season, (E) P. brachiata 4 months post-warming winter season, (F) P. glabrescens 4 months post-warming winter season, (G) P. brachiata 8 months post-warming summer season, (H) P. glabrescens 8 months post-warming summer season. Control plot (dark blue open circles) and heated plot (orange closed circles) are means ± se at each leaf temperature. Lines are fit to each temperature response using the June et al. (2004) method (Eq. 1) for control (dark blue; dashed) and heated (orange; solid) plots separately. Dotted vertical lines represent the optimum temperature for photosynthesis. Dotted horizontal lines represent the rate of photosynthesis at the optimum temperature for plants in control (dark blue) and heated (orange) plots separately. Gray boxes represent the range of the average minimum and maximum daily vegetation temperature observed for the control plots. Average minimum and maximum temperatures are calculated for each measurement campaign separately.
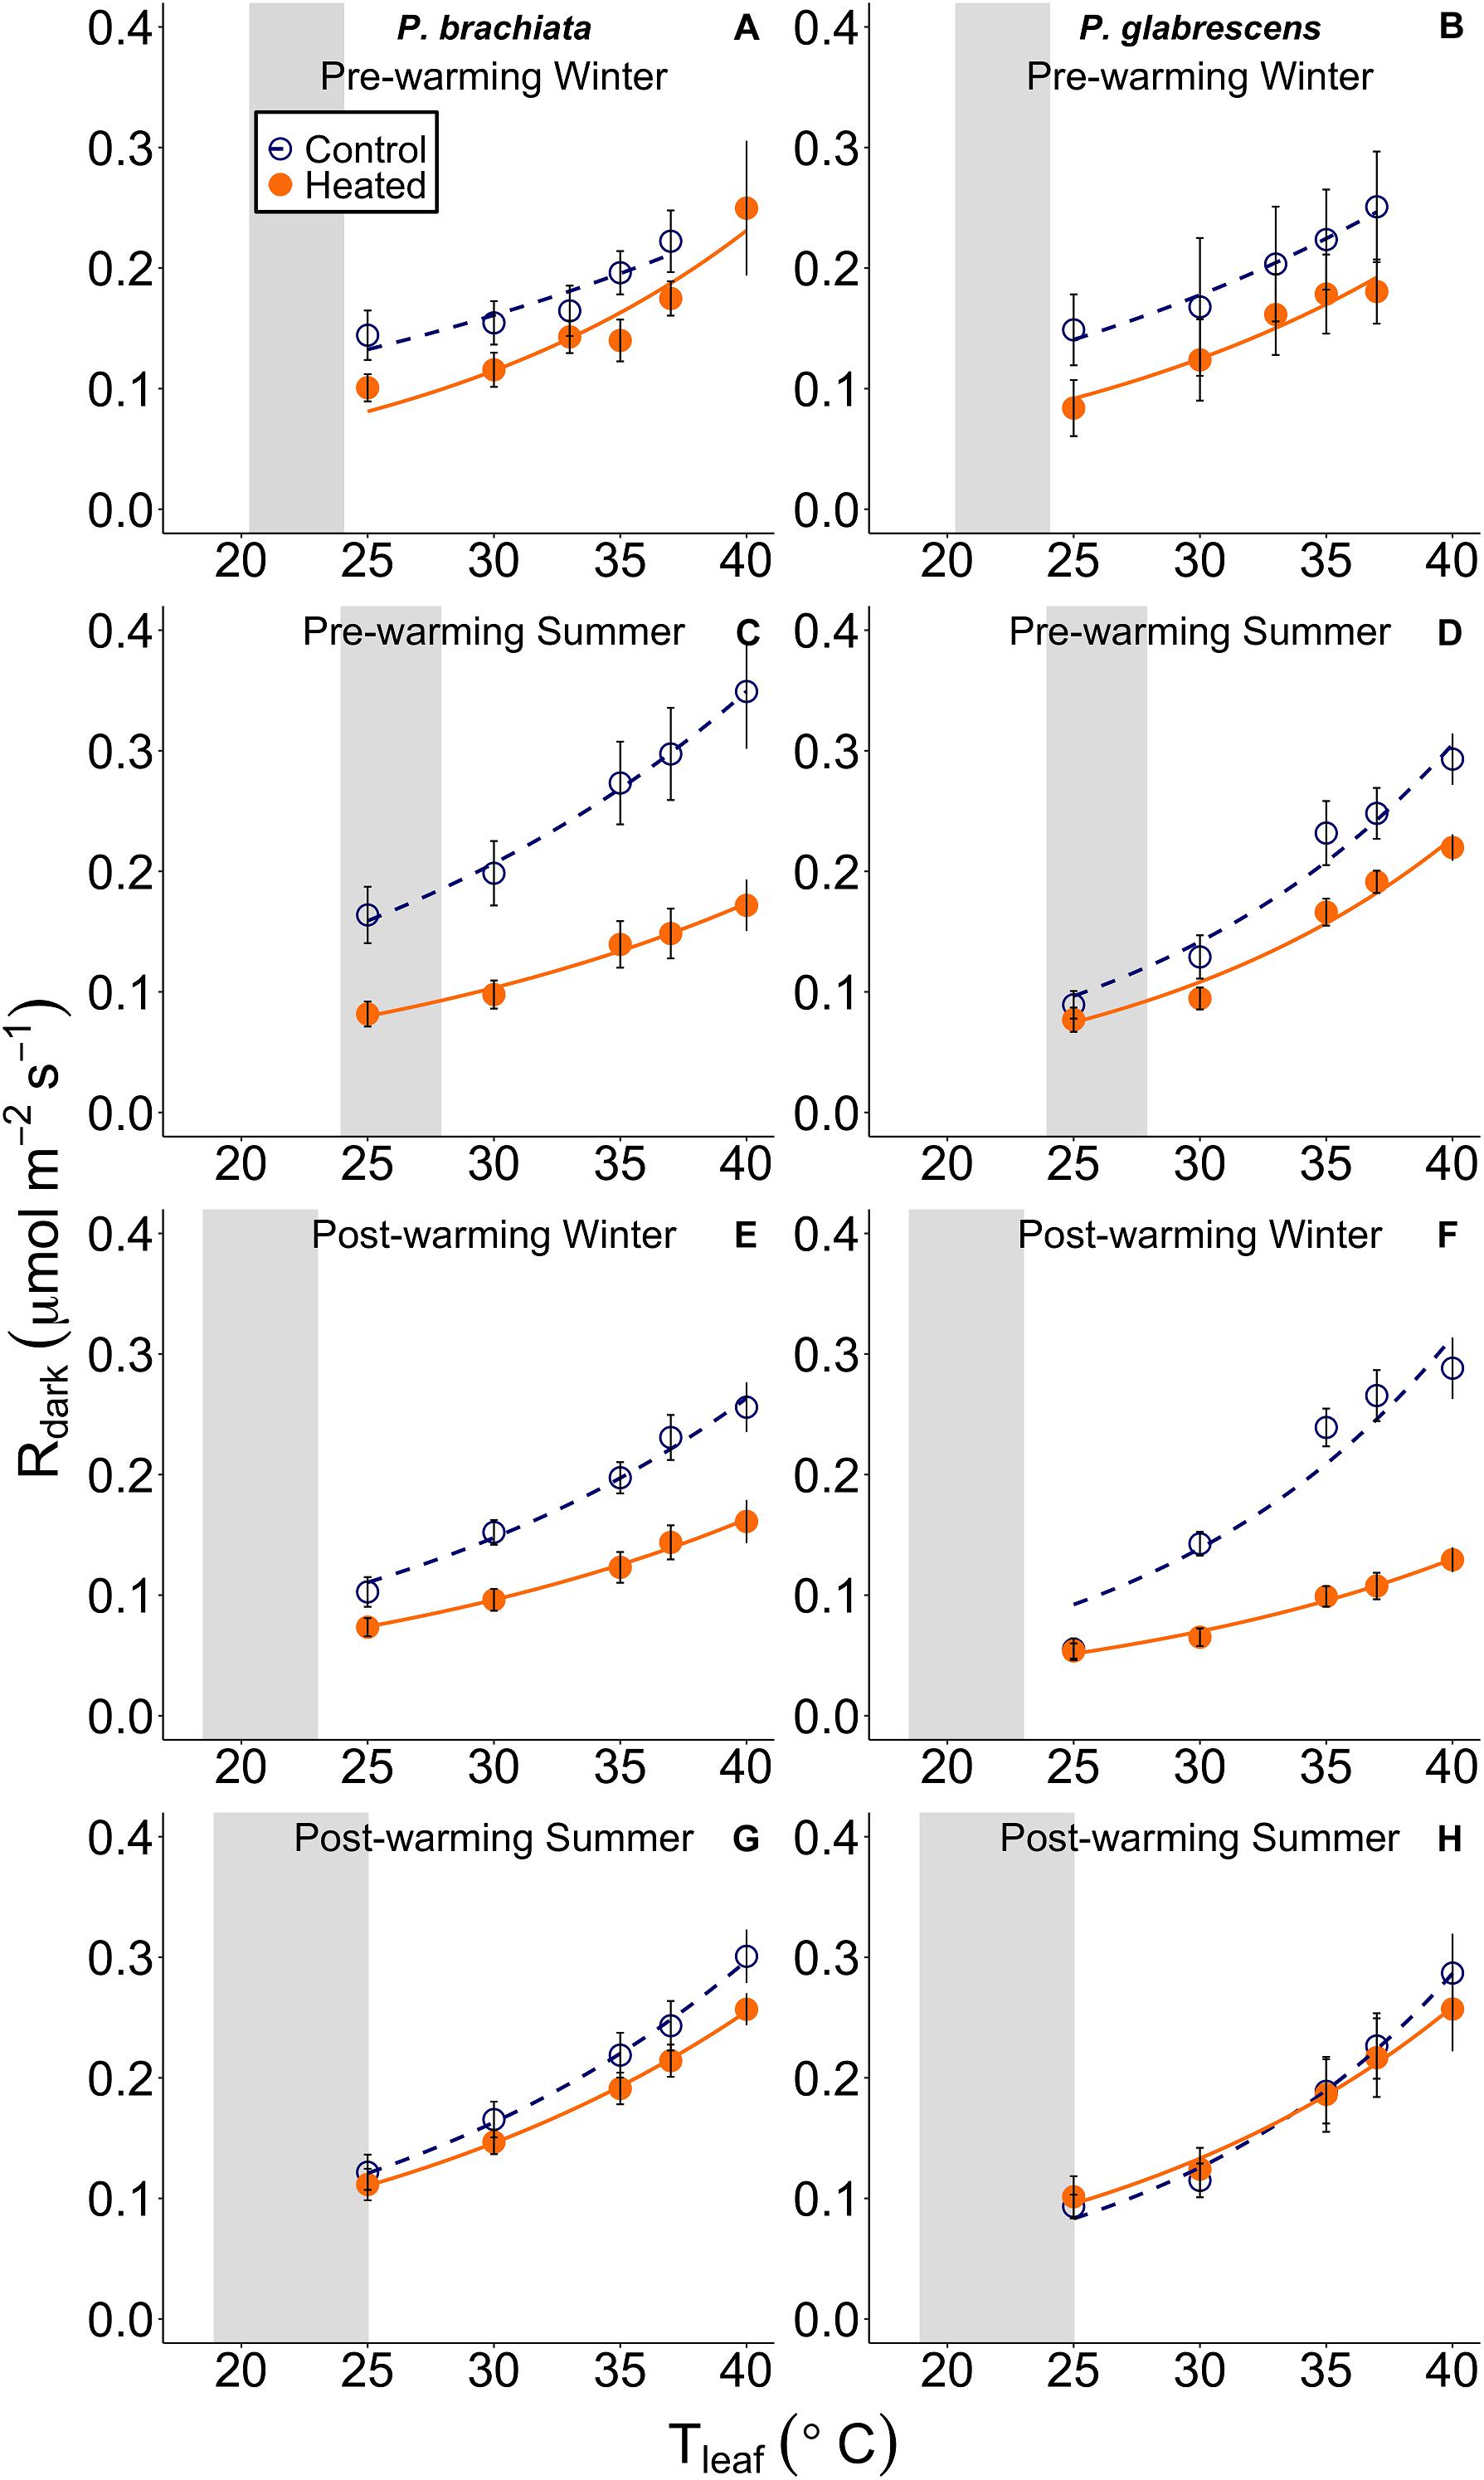
Figure 4. Leaf respiratory (Rdark) response to instantaneous leaf temperatures (Tleaf). The respiratory response to temperature was plotted separately for each measurement campaign and species: (A) Psychotria brachiata pre-warming winter season, (B) Piper glabrescens pre-warming winter season, (C) P. brachiata pre-warming summer season, (D) P. glabrescens pre-warming summer season, (E) P. brachiata 4 months post-warming winter season, (F) P. glabrescens 4 months post-warming winter season, (G) P. brachiata 8 months post-warming summer season, (H) P. glabrescens 8 months post-warming summer season. Control plot (dark blue open circles) points and heated plot (orange; closed) points are means ± se at each leaf temperature. Exponential fit lines were fit to control (dark blue; dashed) and heated (orange; solid) plots separately. Gray boxes represent the range of the average minimum and maximum daily vegetation temperature for the control plots. Average minimum and maximum temperatures are calculated for each measurement campaign separately.
Gain scores were also used to analyze how plot environmental variables [daily maximum (TvegMAX), mean (TvegMEAN), and minimum (TvegMIN) surface vegetation and soil volumetric water content at 10 cm (VWC10)] differed between treatment and season, calculated using dates of measurement campaigns only. Student’s t-tests were used to compare VPD between the heated and control plots using hourly means, then comparing mean VPD between heated and control plots during daytime hours.
Acclimation Effect Size
To assess acclimation potential of the physiological parameters in a synthetic meta-analytic way, we calculated effect size of each gain score for all gas exchange and stomatal traits. Effect size was calculated as in Gurevitch et al. (1992) and Hedges and Olkin (1985):
where d is the effect size, Ye is the mean of the experimental gain score, Yc is the mean of the control gain score, and s is the standard deviation calculated as:
where Ne is the experimental gain score sample size, Nc is the control gain score sample size, se is the standard deviation of the experimental gain score, and sc is the standard deviation of the control gain score.
Jm is a correction for small sample size biases and is calculated as:
Where m is calculated as:
Seasons were pooled for effect size analysis.
Detecting Acclimation by Analyzing Responses to Environmental Variables
The large variation in actual environmental conditions across space and time represented in “warmed” and “control” plots of a large-scale in situ manipulative experiment and the nature of these time-intensive physiological measurements resulted in rather low statistical power for the gain score analysis (i.e., using only binary categorical data). Additionally, we compared plots rather than individual plants across time when calculating gain scores because we did not always measure the same plants in each campaign, which decreased our sample size further for this analysis. To increase our statistical power for detecting acclimation, we took advantage of our rich datasets of actual environmental conditions experienced by these plants and investigated physiological plasticity in response to environmental variables (i.e., using continuous data). First, mixed effects models were used to investigate how photosynthetic temperature response parameters responded to daily values of temperature (TvegMAX, TvegMEAN), and soil volumetric water content at depths of 0–10 and 20–30 cm (VWC10, and VWC20, respectively) for each season. Respiratory temperature response parameters were analyzed in response to TvegMIN, TvegMEAN, VWC10, and VWC20 because respiration was measured at night, when minimum temperatures occur. Models were run for each species separately with plot as the random variable, where individual plant was the sampling unit. In cases where multiple leaves were measured for a single plant, the mean of the dependent parameter of the two leaves were used as a single sample. Two Q10 values > 3 standard deviations from the mean were removed. Environmental variables on the day prior to gas exchange sampling were used because the heaters were turned off for safety during sampling days. Mixed effects models were analyzed using the “lmer” function in the “lme4” package (Bates et al., 2015). P-values were extracted for the mixed effect model using the “Anova” function from the “car” package in R (Fox and Weisberg, 2011), which calculates p-values based on Wald chi-square tests. In addition, we used a hierarchical partitioning approach to quantify the explanatory power of each environmental variable on parameter variance using the “heir-part” package in R (Walsh and Mac Nally, 2013). By using these additional approaches to assess acclimation potential of our study species, we were not only able to capture responses to the high spatial and temporal variability in environmental conditions that were obscured when only comparing binary treatment effects, but we also were able to tease apart the most important environmental drivers.
Results
Environmental Variables
On average, the summer sampling campaigns were both hotter and rainier than the winter campaigns. Average daily precipitation was 3–6 times higher, and average daily below-canopy air temperature (Tair) was ∼3.5°C warmer in summer than winter (Supplementary Table S1 and Figure 2A). Daily average minimum Tair showed slightly less variability between seasons (∼1–4°C), while maximum Tair showed a greater difference between summer and winter (∼3–7°C; Supplementary Table S1). Similarly, control plot mean daily vegetation temperature (TvegMEAN) ranged from 23.5 to 25.3°C during summer and 20.7 to 21.9°C during winter campaigns (Figure 2B).
The infrared warming treatment resulted in hotter vegetation and drier soils compared to the control plots during both seasons. Daily mean, maximum, and minimum vegetation temperature gain scores (i.e., the difference between post- and pre- warming) showed a treatment effect (Supplementary Table S3), where heated leaf TvegMAX was ∼4°C greater, heated leaf TvegMEAN was ∼ 3°C greater, and heated leaf TvegMIN was ∼2°C greater compared to the control plots for both seasons (Supplementary Figures S2A–C). We did find a “seasonal” effect for TvegMEAN, TvegMIN, and VWC10 (Supplementary Figures S2B–D), however, this does not indicate environmental parameter differences between summer and winter. Gain scores measure the change from pre- to post-warming; therefore, a “seasonal” effect indicates that there is more inter-annual variation during one of the seasons compared to the other. Additionally, soil volumetric water content at 0–10 cm (VWC10) gain score was ∼34% lower in the heated plots than the control (Supplementary Table S3 and Supplementary Figure S2D), showing that the warming treatment did significantly alter the heated plants’ growth environment through both higher vegetation temperatures and lower soil moisture (Figures 2B,C) and this treatment effect was consistent across seasons. Environmental gain scores were only calculated during our campaigns; therefore, differences outside of this timeframe could have had higher or lower gain score results.
Vapor pressure deficit (VPD) was not measured in the heated and control plots prior to warming, so we could not calculate gain scores for this variable. From data that coincided with our final measurement campaign only (late summer 2017), heated plots showed a mean daytime VPD of 0.36 ± 0.03 kPa, which was higher than the control plots (control VPD = 0.19 ± 0.03 kPa, p = 0.002, Supplementary Figure S3).
Treatment Effects on Net Photosynthesis and Foliar Respiration
While Piper glabrescens did not show treatment effects for any photosynthetic parameters, Psychotria brachiata did shift to a broader photosynthetic thermal niche under the warming treatment. Gain score analysis showed the optimum temperatures of photosynthesis (Topt) and the rates of both photosynthesis and stomatal conductance at that optimum temperature (Aopt and gs_opt) were not statistically different between warmed and control plots for either species (Supplementary Table S4 and Supplementary Figures S4A–D,G,H). However, the photosynthetic thermal niche (Ω) gain score of P. brachiata was ∼6°C wider in the heated plots compared to the control plots (Supplementary Table S4 and Supplementary Figure S4E), while P. glabrescens Ω did not differ between treatments (Supplementary Figure S4F).
For both species, photosynthetic optimum temperatures exceeded maximum daily vegetation temperatures in both heated and control plots during all measurement campaigns. Topt values ranged from 30 to 32°C in control plots and 32 to 34°C in heated plots for both species (Supplementary Table S5). Control plot Topt was ∼7°C higher than maximum vegetation temperature for P. brachiata and ∼6–9°C higher for P. glabrescens, with greater differences during the winter (Supplementary Table S5 and Figure 3).
We found no evidence of a warming treatment effect on foliar respiration temperature response or the ratio between respiration and photosynthesis at 25°C (R:A) for either species. Neither P. brachiata nor P. glabrescens showed significant treatment, season, or interaction effects on the gain scores of Q10, R25, or R:A (Supplementary Table S4 and Supplementary Figures S5A–F).
Treatment Effects on Component Processes of Net Photosynthesis and Stomata
We investigated underlying mechanisms of photosynthetic thermal acclimation by exploring the shifts in temperature responses of component processes of net photosynthesis, including the maximum rates of Rubisco carboxylation (Vcmax) and the maximum rates of electron transport (Jmax) (Supplementary Table S6). Consistent with our analyses of net photosynthesis, we detected no warming treatment effects for the temperature responses of Jmax or Vcmax. Neither the optimum temperature of Vcmax (ToptV; Student’s t-test p = 0.304), rate of Vcmax at ToptV (Vopt; p = 0.824), the rate of Vcmax at 25°C (p = 0.503), the optimum temperature of Jmax (ToptJ; p = 0.546), the rate of Jmax at ToptJ (Jopt; p = 0.747), nor the rate of Jmax at 25°C (p = 0.468) gain scores differed between treatments (Supplementary Figure S6).
Psychotria brachiata leaves had slightly smaller stomata in the heated (−23.80 ± 26.75 μm2) compared to the control (67.28 ± 31.70 μm2) plot gain scores after 8 months of warming (p = 0.095). There was no alteration in stomatal density (p = 0.443), where control density was −0.57 ± 42.24 m m–2 and heated density was 54.29 ± 49.50 m m–2.
Acclimation Effect Size for All Variables
Effect size calculations were used to show acclimation responses of gas exchange and stomatal trait gain scores in a standardized meta-analytic framework. Photosynthetic acclimation indicates an up-regulation of photosynthesis with experimental warming; therefore, photosynthetic parameter (Topt, Aopt, Ω, gs_Opt, ToptV, ToptJ, Vopt, Jopt) effect size greater than zero indicates acclimation. With an effect size of 1.36 ± 0.41 (effect size ± variance), P. brachiata thermal niche (Ω) was the only photosynthetic parameter that was not close to overlapping zero (Figure 5). Evidence of respiratory acclimation would result in Q10 and R25, and R:A parameter effect sizes lower than zero (i.e., down-regulation). Agreeing with the gain score analyses, neither species showed high magnitude respiratory effect sizes (Figure 5). Adjustment of stomatal traits can result in either increasing or decreasing stomatal size and/or density (e.g., Shen et al., 2017), however, the only stomatal trait showing acclimation was P. brachiata stomatal size. With an effect size of −1.43 ± 0.84, P. brachiata adjusted to have slightly smaller stomata under experimental warming (Figure 5).
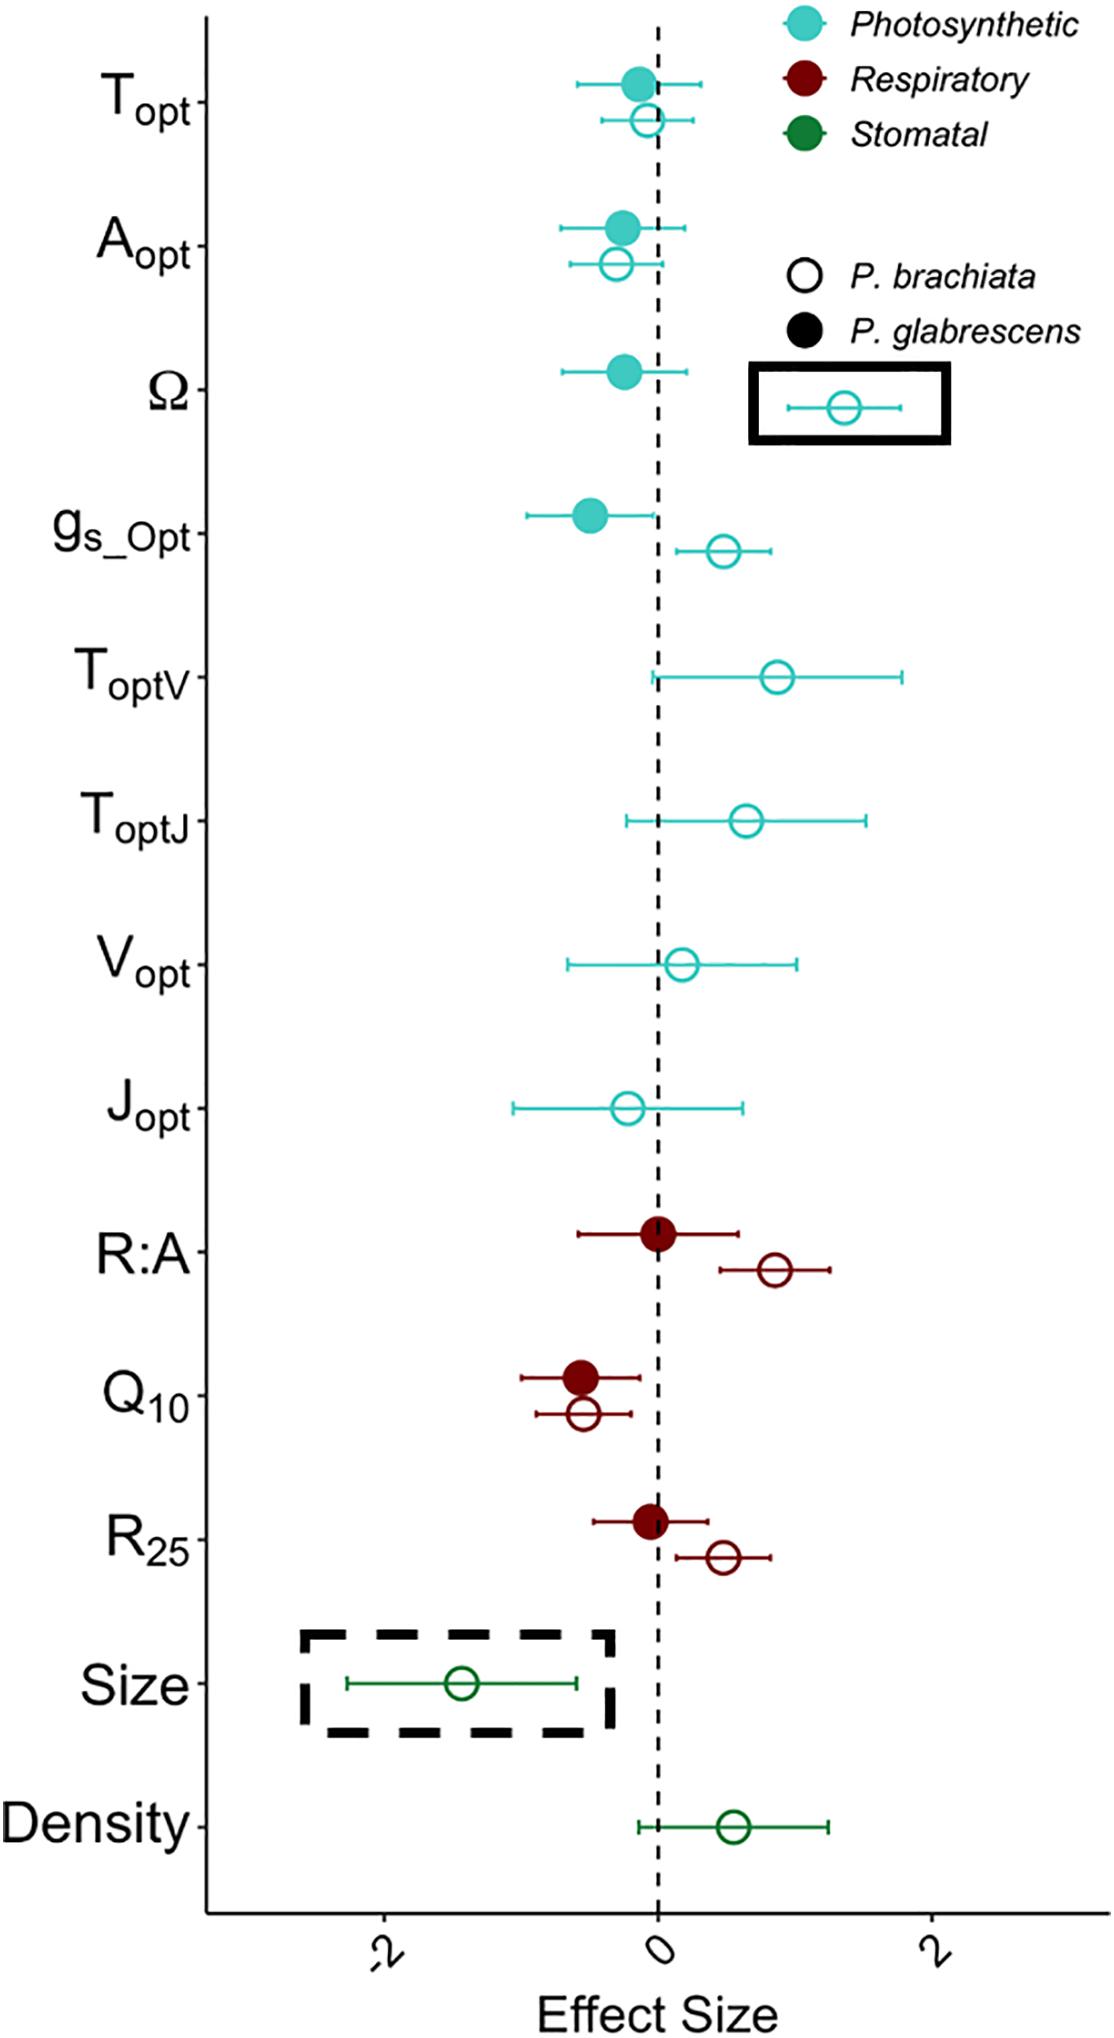
Figure 5. Acclimation effect size with warming for the photosynthesis, respiration, and stomatal size and density variables. Variables represented are the optimum temperature of photosynthesis (Topt) (°C), the photosynthetic rate at Topt (Aopt) (μmol m–2 s–1), the width of the photosynthetic – temperature response curve (Ω) (°C), the rate of stomatal conductance at Topt (gs_Opt) (mol m–2 s–1), optimum temperature of the maximum rate of Rubisco carboxylation (ToptV) (°C), optimum temperature of the maximum photosynthetic electron transport (ToptJ) (°C), rate of the maximum rate of Rubisco carboxylation at the optimum temperature (Vopt) (μmol m–2 s–1), rate of maximum photosynthetic electron transport at the optimum temperature (Jopt) (μmol m–2 s–1), respiration increase with every 10°C (Q10), the rate of leaf dark respiration at 25°C (R25) (μmol m–2 s–1), the ratio between R25 and photosynthesis at 25°C (R:A), stomatal density (Density) (m m–2) and stomatal size (Size) (μm2). Colors of data points depict the variable type, where light blue represents photosynthetic variables, dark red represents dark respiration variables, and green represents stomatal size and density. Symbols depict whether the sample is Psychotria brachiata (open) or Piper glabrescens (closed). Black boxes around P. brachiata Ω and stomatal size indicate significant (solid box) or marginally significant (dashed box) acclimation as calculated through the gain score analysis. Error bars depict variance of effect size as calculated from Gurevitch et al. (1992).
Gas Exchange Parameter Responses to Environmental Variables
While categorical gain score analysis of treatment and season only revealed photosynthetic thermal niche treatment effects, we did find significant responses to continuous environmental variables across plots. Overall, photosynthetic optimum temperatures and thermal niches increased for P. brachiata as vegetation became warmer, but P. glabrescens photosynthesis and stomatal conductance declined as temperatures rose. P. brachiata Topt increased significantly with daily mean and maximum vegetation temperatures (Supplementary Table S7, Figure 6A and Supplementary Figure S7A). P. glabrescens Topt showed no response with TvegMEAN or TvegMAX (Supplementary Table S7, Figure 6B, and Supplementary Figure S7B). P. brachiata Aopt did not respond to surface vegetation temperature (Tveg; Figure 6C and Supplementary Figure S7C); although, Aopt intercept was higher during winter for TvegMEAN analysis but higher during summer for the TvegMAX analysis (Supplementary Table S7). P. glabrescens Aopt declined as TvegMEAN, but not TvegMAX, increased (Figure 6D and Supplementary Figure S7D) and was higher during the summer (Supplementary Table S7). Thermal niche (Ω) broadened for P. brachiata as Tveg rose (Figure 6E and Supplementary Figure S7E), but P. glabrescens Ω did not respond to Tveg (Figure 6F and Supplementary Figure S7F). P. brachiata showed no relationship between gs_Opt and Tveg (Figure 6G and Supplementary Figure S7G). P. brachiata gs_Opt followed similar trends to Aopt, where gs_Opt decreased as TvegMEAN increased (Figure 6H), however, the relationship was not significant for TvegMAX (Supplementary Table S7 and Supplementary Figure S7H).
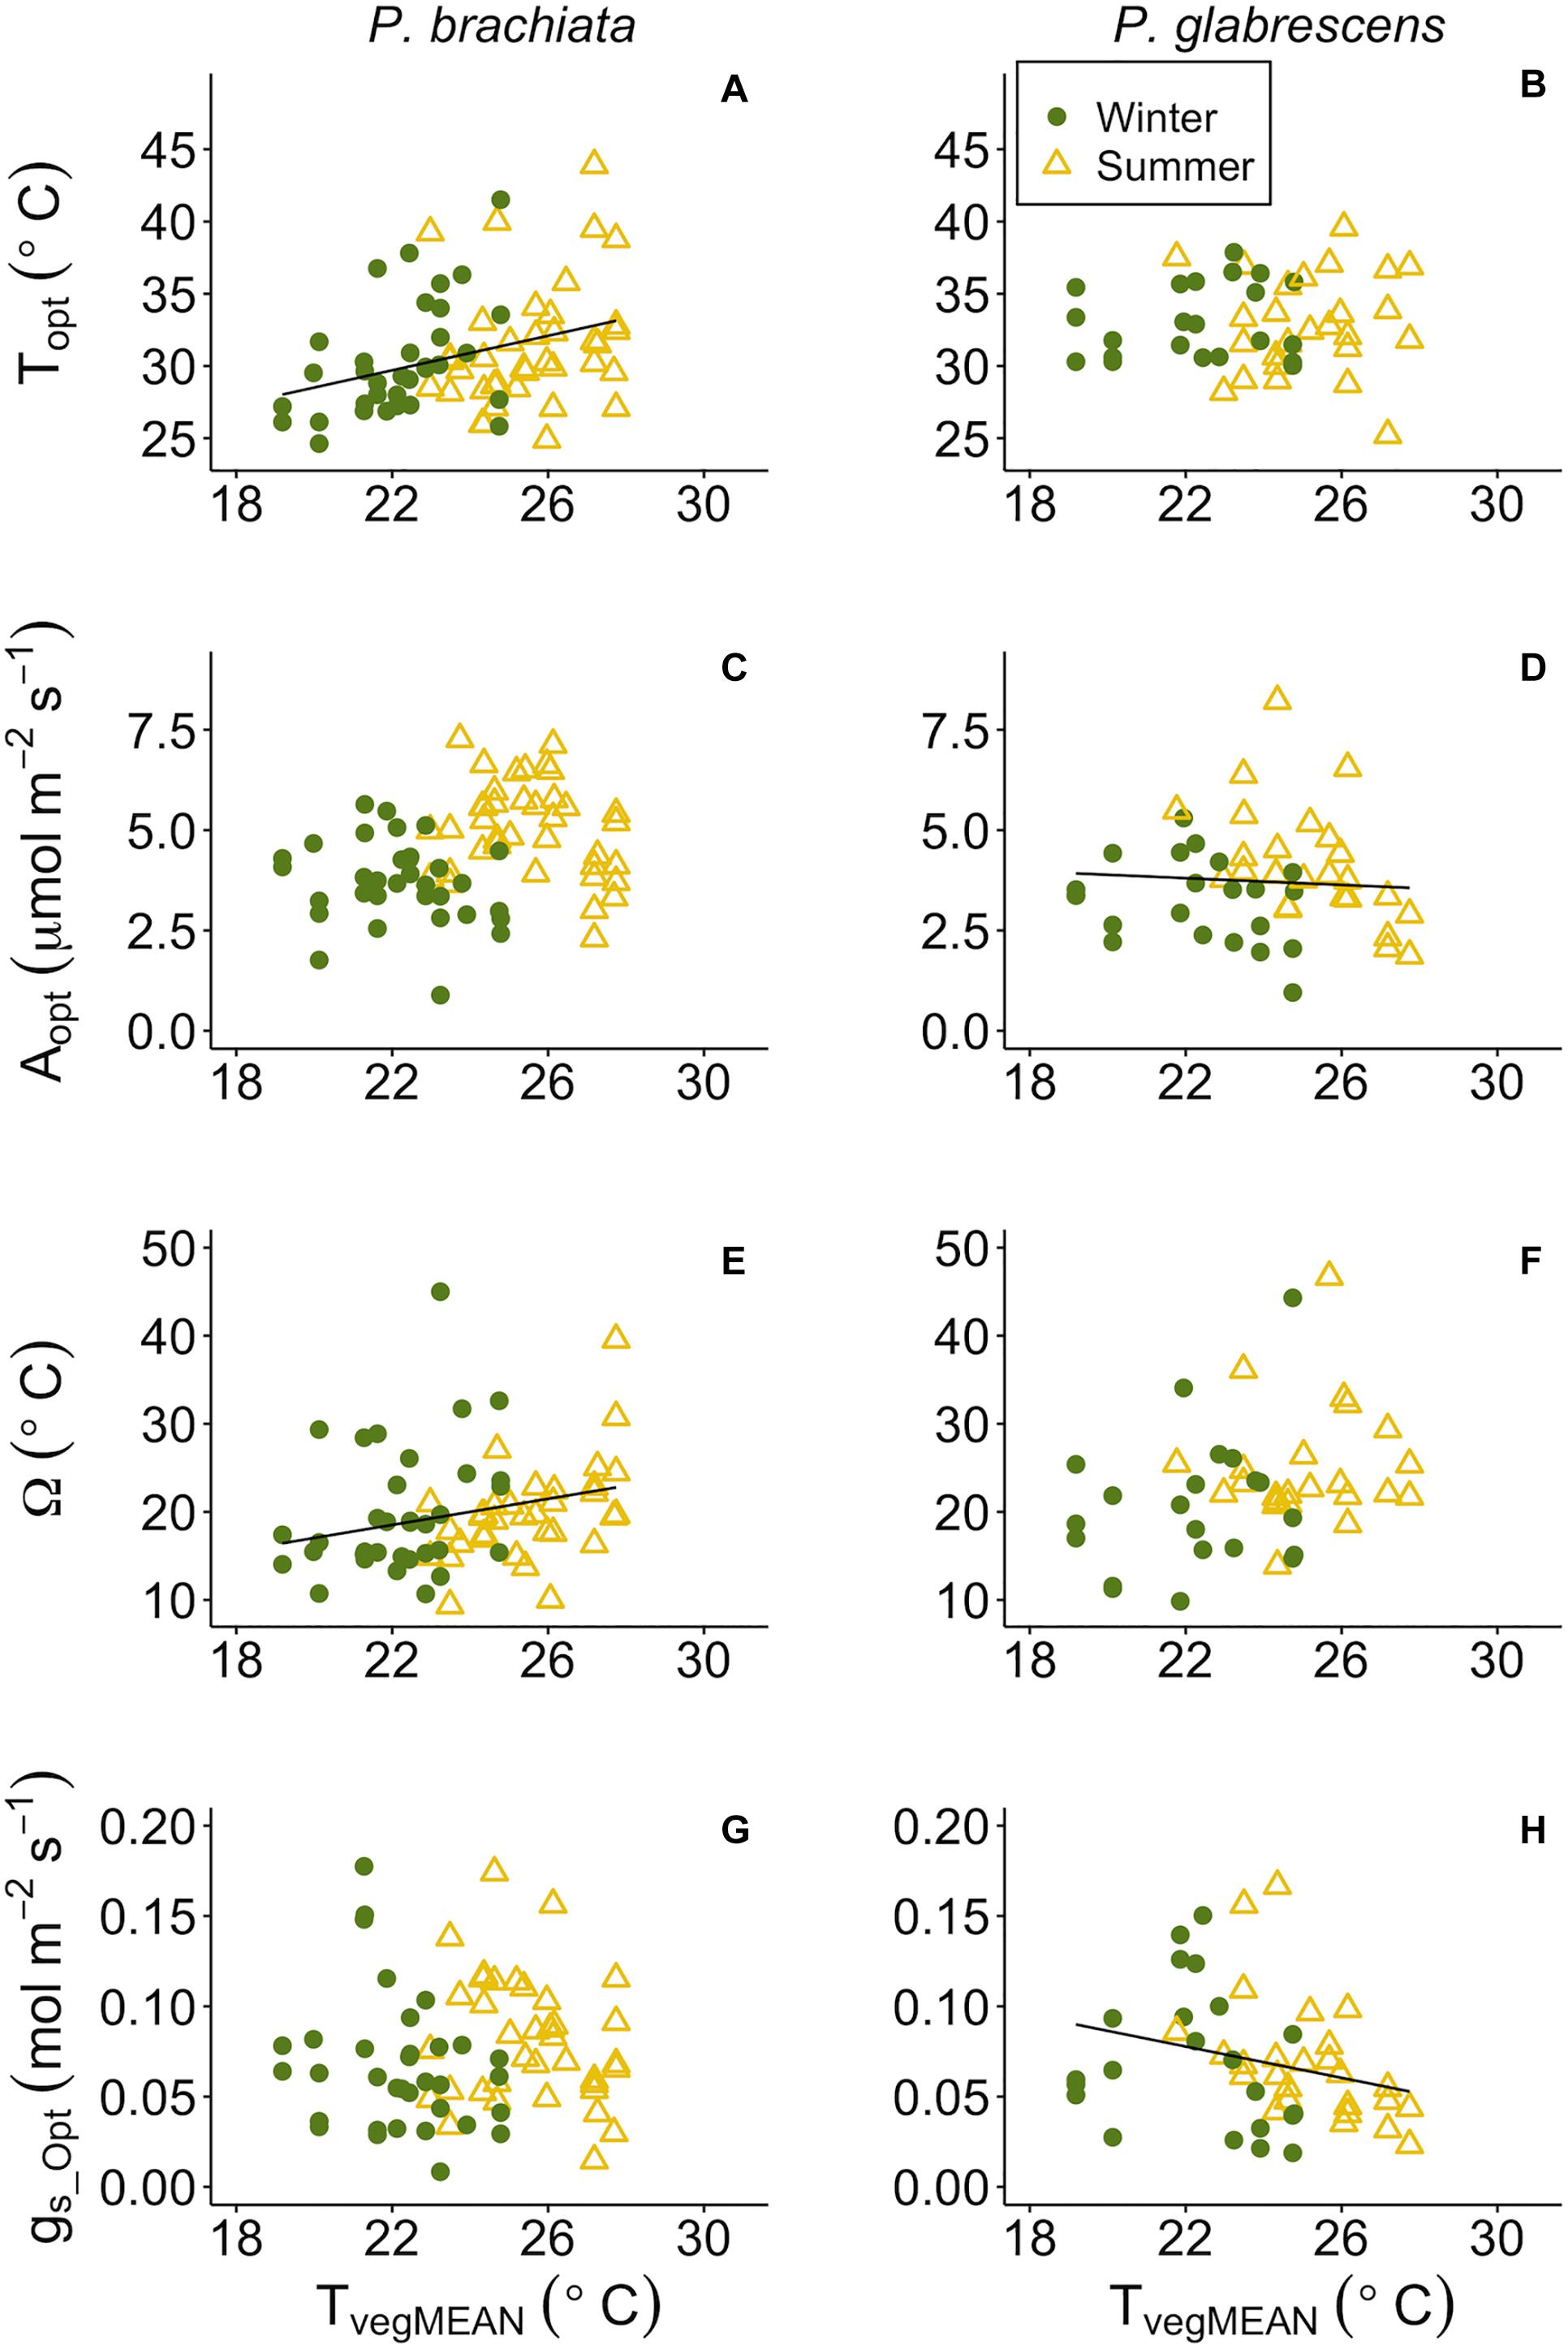
Figure 6. Photosynthetic parameter responses to mean daily vegetation temperature (TvegMEAN). (A) Psychotria brachiata optimum temperature of photosynthesis (Topt) response to TvegMEAN of winter (green circles) and summer (yellow triangles), (B) Piper glabrescens Topt response to TvegMEAN, (C) P. brachiata rate of photosynthesis at Topt (Aopt) response to TvegMEAN, (D) P. glabrescens Aopt response to TvegMEAN, (E) P. brachiata photosynthetic thermal niche (Ω) response to TvegMEAN, (F) P. glabrescens Ω response to TvegMEAN, (G) P. brachiata rate of stomatal conductance at Topt (gs_Opt) response to TvegMEAN, and (H) P. glabrescens rate of stomatal conductance at Topt (gs_Opt) response to TvegMEAN. Fit lines (green - winter; yellow – summer) indicate a significant interaction between TvegMEAN and season (Supplementary Table S7). A solid black line is fit when there is a significant TvegMEAN response but no interaction (Supplementary Table S7).
Temperature sensitivity of respiration did not respond to vegetation temperatures for either species, while respiratory rates at a standard temperature showed evidence of down regulation only for P. brachiata. Neither P. brachiata nor P. glabrescens Q10 responded to temperature (Figures 7A,B and Supplementary Figures S8A,B). P. brachiata R25 decreased with increasing TvegMEAN during the winter months only (Supplementary Table S7 and Figure 7C) and had no response to TvegMIN (Supplementary Figure S8C). P. glabrescens R25 did not respond to TvegMEAN (Figure 7D) or TvegMIN (Supplementary Figure S8D).
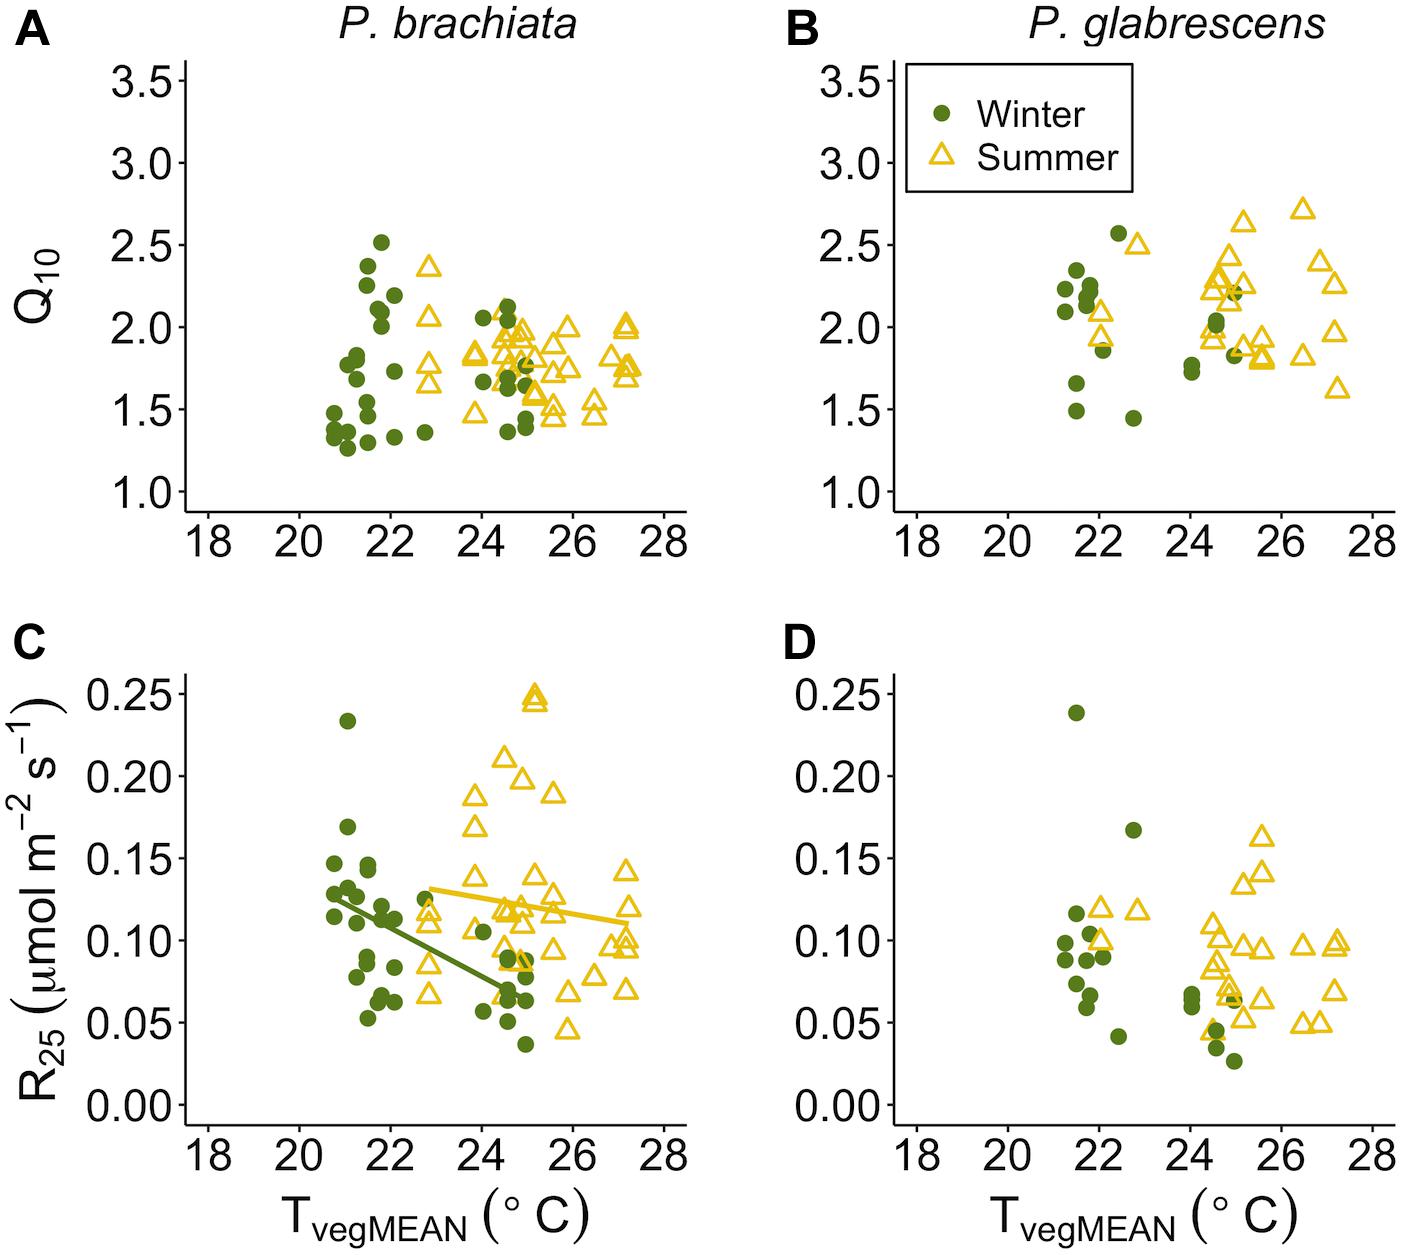
Figure 7. Respiration parameter responses to mean daily vegetation temperature (TvegMEAN). (A) Psychotria brachiata increase in respiration for every 10°C (Q10) response to TvegMEAN of winter (green circles) and summer (yellow triangles), (B) Piper glabrescens Q10 response to TvegMEAN (C) P. brachiata rate of respiration at 25°C (R25) response to TvegMEAN, and (D) P. glabrescens R25 response to TvegMEAN. Fit lines (green - winter; yellow – summer) indicate a significant interaction between TvegMEAN and season (Supplementary Table S7). A solid black line is fit when there is a significant TvegMEAN response but no interaction (Supplementary Table S7).
As soils dried, both species’ optimum temperatures increased, and P. brachiata photosynthesis declined. P. brachiata and P. glabrescens Topt rose as deeper (20–30 cm; VWC20) but not shallow (0–10 cm; VWC10) soils dried (Supplementary Table S7, Figures 8A,B, and Supplementary Figures S9A,B). P. brachiata Aopt declined as shallow soils dried during the summer but not during the winter (Supplementary Figure S9C) and declined with decreasing VWC20 (Figure 8C). P. glabrescens Aopt did not respond to VWC10 (Supplementary Figure S9C). As shown by the significant interaction (Supplementary Table S7), P. glabrescens Aopt declined as deep soils dried during the summer, however, Aopt was overall lower and did not respond to soil moisture during the winter (Figure 8C). Ω and gs_Opt did not respond to soil moisture for either species (Supplementary Table S7, Figures 7E–H, and Supplementary Figures S9E–H).
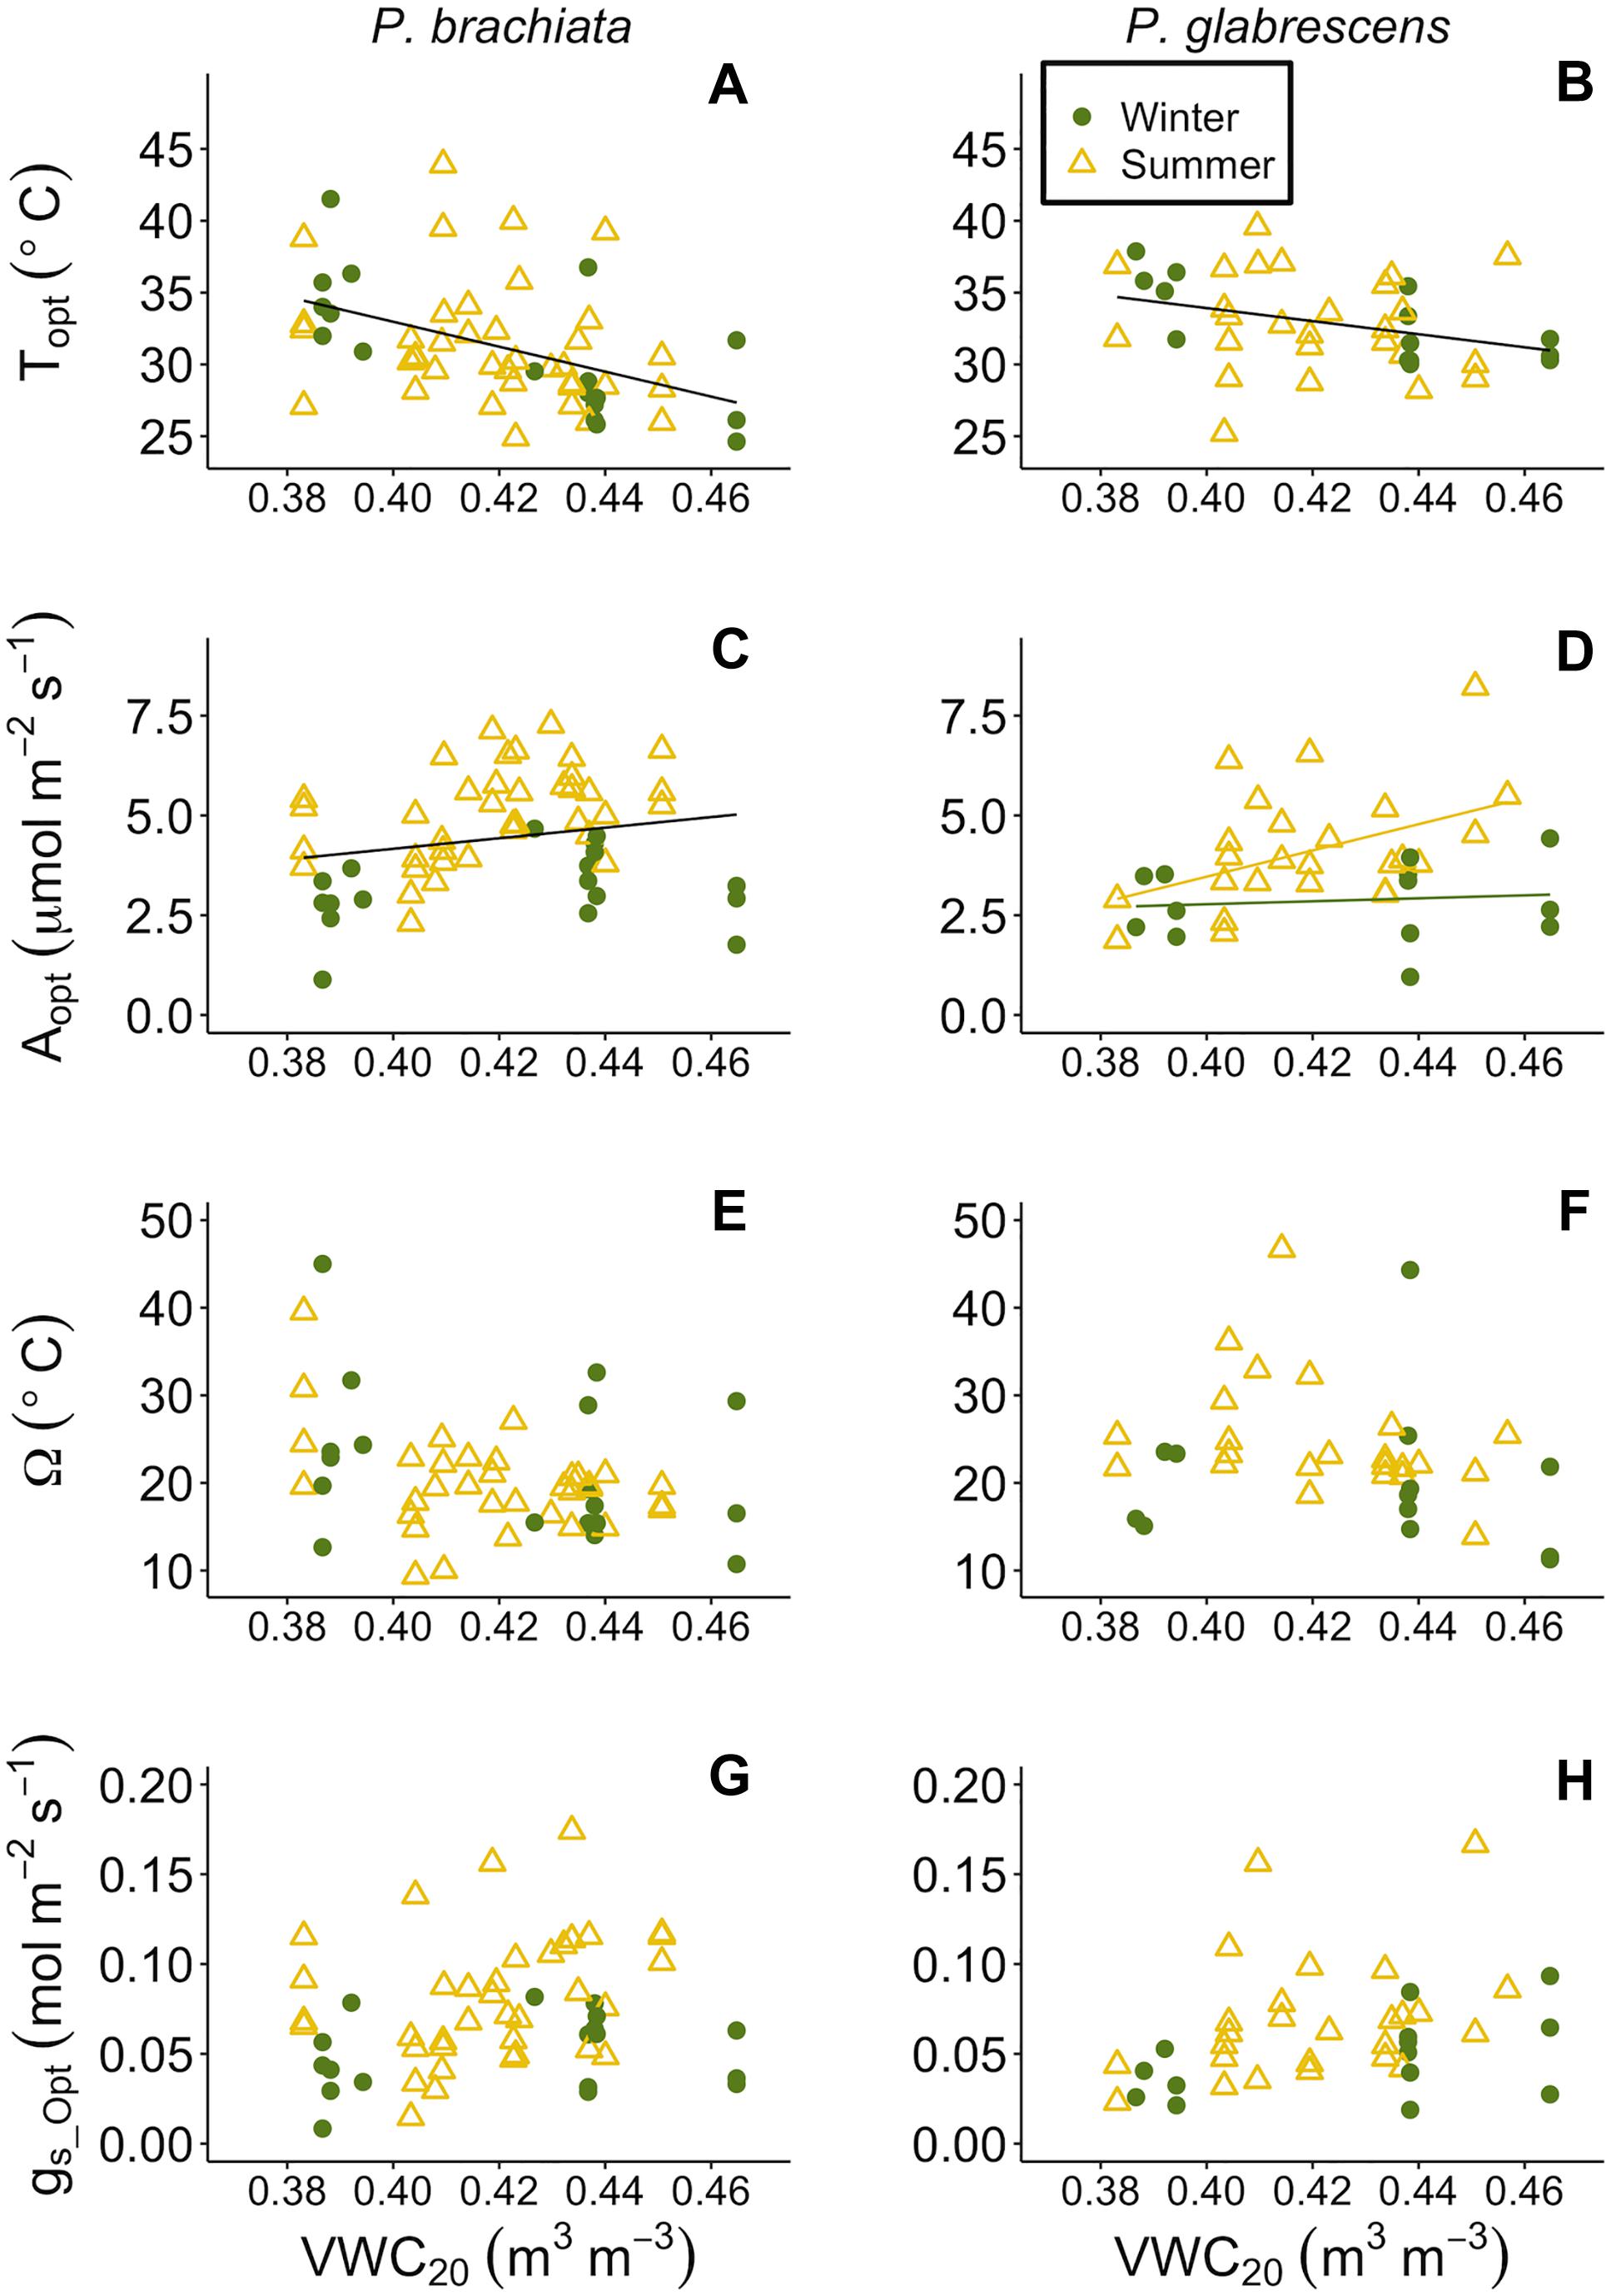
Figure 8. Photosynthetic parameter responses to soil moisture at 20–30 cm depth (VWC20). (A) Psychotria brachiata optimum temperature of photosynthesis (Topt) response to VWC20 of winter (green circles) and summer (yellow triangles), (B) Piper glabrescens Topt response to VWC20, (C) P. brachiata rate of photosynthesis at Topt (Aopt) response to VWC20, (D) P. glabrescens Aopt response to VWC20, (E) P. brachiata photosynthetic thermal niche (Ω) response to VWC20, (F) P. glabrescens Ω response to VWC20, (G) P. brachiata rate of stomatal conductance at Topt (gs_Opt) response to VWC20, and (H) P. glabrescens rate of stomatal conductance at Topt (gs_Opt) response to VWC20. Fit lines (green - winter; yellow – summer) indicate a significant interaction between VWC20 and season (Supplementary Table S7). A solid black line is fit when there is a significant VWC20 response but no interaction (Supplementary Table S7).
Both species showed down-regulation of respiratory basal rates with drying soils. Neither species Q10 responded to soil moisture (Supplementary Table S7, Figures 9A,B, and Supplementary Figures S10A,B). P. brachiata R25 did not respond to VWC10 but R25 declined as the 20 cm soils dried (Figure 9C and Supplementary Figure S10C). P. glabrescens R25 decreased with decreasing VWC10 and VWC20 (Figure 9D and Supplementary Figure S10D).
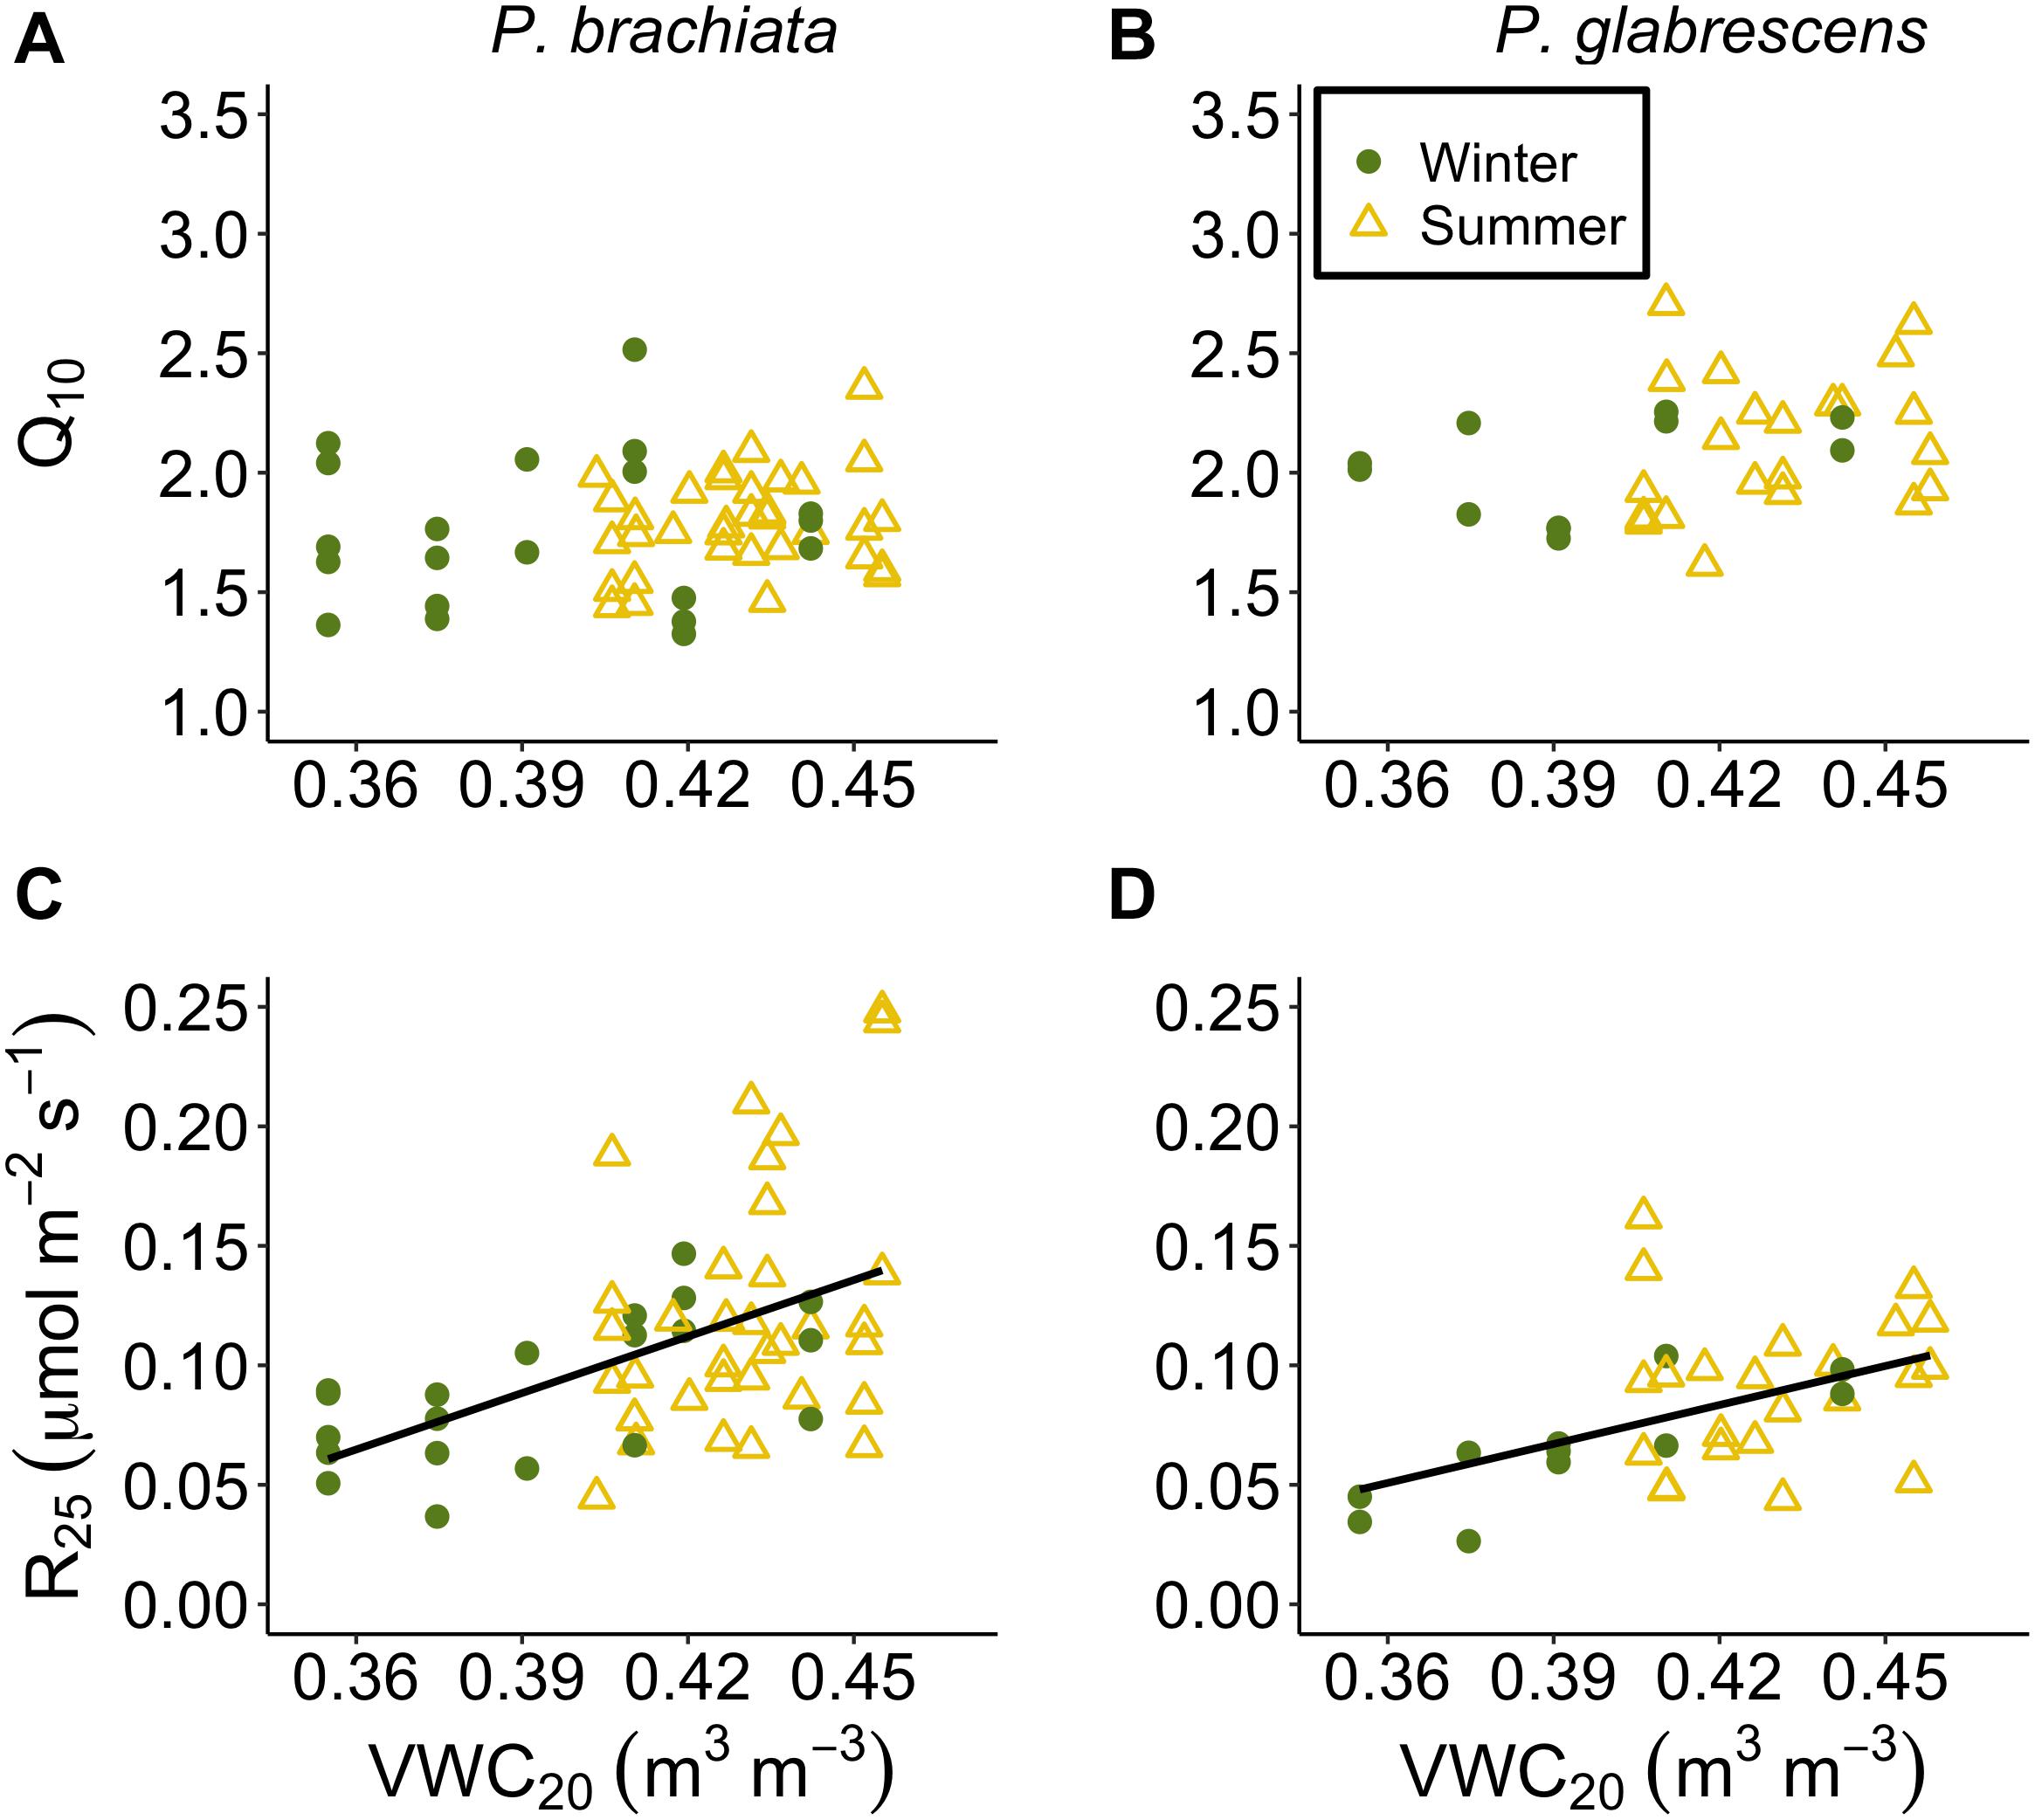
Figure 9. Respiration parameter responses to soil moisture at 20–30 cm depth (VWC20). (A) Psychotria brachiata increase in respiration for every 10°C (Q10) response to VWC20 of winter (green circles) and summer (yellow triangles), (B) Piper glabrescens Q10 response to VWC20 (C) P. brachiata rate of respiration at 25°C (R25) response to VWC20, and (D) P. glabrescens R25 response to VWC20. Fit lines (green - winter; yellow – summer) indicate a significant interaction between VWC20 and season (Supplementary Table S7). A solid black line is fit when there is a significant VWC20 response but no interaction (Supplementary Table S7).
Hierarchical partitioning revealed that most variation in photosynthesis and respiratory parameters was controlled, unexpectedly, by deeper soil moisture, rather than vegetation temperature. Variance in Topt, Aopt, and gs_Opt were all strongly controlled by VWC20 for both species (Supplementary Figure S11). Variance of thermal niche (Ω) for P. brachiata was strongly driven by VWC20 (Supplementary Figure S11A), however, P. glabrescens Ω variance was better explained by vegetation temperature (Supplementary Figure S11B). Q10 variance was relatively evenly explained by vegetation temperature and soil moisture (Supplementary Figure S11), particularly for P. glabrescens, while VWC20 explained most of the variance in R25 (Supplementary Figure S11).
Discussion
Photosynthetic and Stomatal Responses to Temperature
Our hypothesis that tropical woody shrubs would not photosynthetically acclimate after 8 months of experimental warming was supported for P. glabrescens, but not P. brachiata. While we did not detect a warming treatment effect on the optimum temperature for photosynthesis (Topt) from the gain score analysis, P. brachiata Topt up-regulated as mean daily temperature increased (Figure 6A). P. glabrescens Topt showed no acclimation to either experimental warming or daily temperature variations. Other studies have found that tropical species have some ability to photosynthetically acclimate to warmer temperatures (Cheesman and Winter, 2013; Slot and Winter, 2017; but see Fauset et al., 2019) or stimulate photosynthesis (Krause et al., 2013), however, acclimation was limited and had, until now, only been found in greenhouses or growth chambers. This emphasizes the importance of whole-plant in situ studies, such as this one, which may provide a more comprehensive representation of how plants will respond to climate warming.
Fewer warming studies investigate thermal niche acclimation, however, Slot and Winter (2017) found that thermal niche narrowed in experimentally warmed tropical seedlings where these plants shifted to maintain carbon gain under a wider temperature range. P. brachiata revealed a broadened photosynthetic thermal niche (Ω) following extended experimental warming (Figure 5 and Supplementary Figure S4) and in response to warmer daily temperatures (Figure 6E). Acclimation to both the experimental treatment and daily temperature variation suggests that this species’ thermal niche has a particularly plastic response to warming. Similar to Topt results, P. glabrescens showed no thermal niche acclimation potential. P. brachiata thermal niche acclimation occurred alongside slightly declined stomatal size with prolonged warming (Figure 5). Warming can either increase (Hill et al., 2014; Becker et al., 2017; Jumrani et al., 2017; Shen et al., 2017) or decrease (Rodrigues et al., 2016; Shen et al., 2017) stomatal density or size. For example, Wu et al. (2018) found that subtropical tree species with smaller stomata are better able to maintain rates of stomatal conductance and photosynthesis under high temperature-induced water deficits. Within our study, smaller size potentially allowed P. brachiata stomata to lose less water as the apertures remain open under wider temperature ranges (i.e., broadened thermal niche). Due to sampling restriction, we were unable to assess alterations in stomatal size for P. glabrescens; therefore, we cannot speculate if a lack of stomatal plasticity limited acclimation for this species. The co-occurring acclimation toward a wider thermal niche and slightly smaller stomata may give P. brachiata a slight advantage under climate warming, however, with mean values above 17°C, both of these understory species already had relatively wide photosynthetic thermal niches (Supplementary Table S5 and Figure 3).
Conversely, our hypothesis was supported for P. glabrescens, as this species showed no positive shift in photosynthetic temperature response with experimental warming (Figure 5 and Supplementary Figure S4). Instead of acclimating, P. glabrescens experienced slightly declined photosynthesis with warmer daily temperatures (Figure 6D). The negative correlation between Aopt and vegetation temperature in P. glabrescens corresponded with a decline in stomatal conductance (gs) at Topt (Figure 6H). Many model simulations of tropical forests have predicted that temperature will negatively affect carbon gain through lowered gs (Doughty and Goulden, 2008; Lloyd and Farquhar, 2008; Galbraith et al., 2010), rather than more direct effects to photosynthetic machinery. For our species, P. glabrescens experienced declines in gs as vegetation warmed (Figure 6H), while P. brachiata did not (Figure 6G). P. brachiata leaves shifted toward lower stomatal size in the heated leaves (Figure 5), suggesting that P. brachiata may be able to more readily maintain plant water status. While we did not measure plot-level VPD during most of the physiological measurement campaigns, VPD was higher in the heated plots during late summer 2017 (Supplementary Figure S3). Higher temperatures increase VPD, further increasing transpirational drive, and the shift to smaller stomata may have allowed P. brachiata to lose less water during warmer days. Smaller size allows stomata to close more quickly (Aasamaa et al., 2001), allowing plants to have more dynamic responses to environmental conditions (Hetherington and Woodward, 2003). This, in conjunction with overall lower water loss from smaller stomata, could further contribute to maintained photosynthesis with higher daily temperatures. Although we did find that P. glabrescens Aopt declined with increasing temperature, P. glabrescens Aopt was up-regulated during the warmer, wetter summer months, suggesting that this species does show some seasonal plasticity.
While we found indications of P. brachiata Anet acclimation potential, we did not detect evidence of thermal acclimation of the biochemical components of net photosynthesis (Jmax and Vcmax). While both Jmax and Vcmax have been found to acclimate within days (Smith and Dukes, 2017), it is possible that longer-term warming would be required to detect a shift of these processes within our study system or, perhaps, acclimation more readily occurs in the controlled environment of a growth chamber than for in situ studies (Gunderson et al., 2000). In addition, for both the photosynthetic and respiratory acclimation results, some of the study leaves were already fully developed prior to warming initiation. Leaf age, however, was not tracked, leading to uncertainty in whether leaves developed under the treatment (with the exception of the stomatal size and density measurements). Leaves that developed prior to initiation of warmer temperatures are less likely to acclimate (Loveys et al., 2003); therefore acclimation potential could have been limited for the fully developed leaves.
Our study site is in an area with frequent hurricanes, which can rapidly increase the light and temperature environment experienced by understory species. The higher plasticity in response to elevated temperature of P. brachiata may allow this species to respond more quickly to new environments (Figures 6A,E, 7C). Early successional species such as P. brachiata are often associated with higher plasticity (Valladares et al., 2000, 2002). There is some evidence that thermal acclimation is more likely to occur in faster growing, early successional species (e.g., Slot and Winter, 2018), however, this is not consistent across all species (reviewed in Atkin et al., 2006). More shade tolerant species, such as P. glabrescens, are generally adapted to thrive in relatively stable environmental conditions (Valladares et al., 2002; Niinemets and Valladares, 2004), which is supported by P. glabrescens’ wide thermal niches (Supplementary Table S5 and Figure 3). As a result, these two species may respond differently to the greater hurricane intensity and frequency predicted to occur with climate change (Knutson et al., 2015; Bacmeister et al., 2018). While higher P. brachiata plasticity may allow quicker responses to both warming and disturbance, the wider thermal niches found in P. glabrescens could also potentially mitigate negative effects of climate warming.
Respiratory Responses to Temperature
There is currently a general consensus that, unlike photosynthesis, tropical plants will be able to acclimate their rates of respiration (Slot and Kitajima, 2015). Contrary to this expectation, we found little to no respiratory thermal acclimation in either species. P. brachiata showed no acclimation response to experimental warming, however, there was slight evidence for acclimation to daily environmental variables. P. brachiata showed physiological plasticity by down-regulating the basal rate of respiration (R25) as vegetation warmed, but that trend only occurred during the cooler, drier winter months (Figure 7C). P. brachiata R25 decreased as soils dried (Figure 9C); therefore, R25 might have been more sensitive to warming temperatures, and the corresponding drier soils, during the drier winter season. P. glabrescens’ respiration did not acclimate to daily changes in temperature or experimental warming (Figure 5 and Supplementary Figures S5, S7B,D). While there are few studies to corroborate respiratory acclimation through in situ tropical warming studies, Slot et al. (2014) found that canopy leaves exposed to only one week of nighttime warming were able to acclimate through a down-regulation of basal respiration rate (R25). Studies on juvenile tropical species have found evidence of both decreased slope (Cheesman and Winter, 2013; Krause et al., 2013) or both decreased basal rate and slope (Cheesman and Winter, 2013; Drake et al., 2015) of respiratory acclimation. Meta-analyses suggest that plants across all biomes will acclimate their rates of respiration in response to warmer temperatures (Way and Oren, 2010; Slot and Kitajima, 2015) and, our study adds an important set of results suggesting that respiratory acclimation might not be universal across tropical species.
There were no treatment differences in the ratio of respiration to photosynthesis (R:A; Figure 5 and Supplementary Figure S5E,F). Because these species were operating well below their optimum temperatures for photosynthesis (Supplementary Table S5), +4°C of current conditions would likely not negatively affect leaf carbon balance for these two species. It is possible, however, that maximum vegetation temperatures inside the plots were underestimated (Supplementary Table S5). The infrared thermometer reads temperature over multiple surfaces; therefore, measured temperature was likely lower than the actual temperature experienced for some individual leaves if the thermometer was measuring multiple leaves experiencing different temperatures. Photosynthesis and respiration were measured on different days; therefore, we were unable to investigate variability in R:A with daily fluctuations of temperature and soil moisture.
Soil Moisture: A Stronger Driver Than Temperature
Our study aimed to investigate how plants specifically respond to elevated temperature, however, along with heating plant tissues, our warming treatment caused soil drying (Supplementary Figure S2D). Changing precipitation patterns and soil drying are predicted to have large effects on ecosystem carbon balance (Ciais et al., 2005; Phillips et al., 2009; Kao and Ganguly, 2011; Sherwood and Fu, 2014). Periodic drought and lowered soil moisture cause declines in tropical forest productivity (Santos et al., 2018; van Schaik et al., 2018). Importantly, hierarchical partitioning revealed that deeper soil moisture, even more so than vegetation temperature or shallow soil moisture, was the most influential climate variable determining variation in many gas exchange parameters (Supplementary Figure S11). Deeper, rather than shallow, soil moisture may have been a stronger driver because it was less variable in general (Figure 2D; Kimball et al., 2018) likely because of less surface evaporation and fewer roots present to rapidly draw water from that soil depth (Yaffar and Norby, 2020). Topt increased as soil moisture decreased (Figures 8A,B), suggesting that neither species’ Topt will likely be negatively affected by a drying climate. Topt increasing with drying soil in both of our species is somewhat surprising and the increase may not be a direct effect of soil drying. If increases in vegetation temperature (Tveg) coincided with soil drying, the negative relationship between Topt and soil moisture could be due to the indirect influence of higher Tveg, however, Topt only increased with Tveg for P. brachiata. We may lack the data to fully explain Topt responses to soil moisture.
While drier soils may not negatively affect Topt, we did observed decreased Aopt for P. brachiata as soils dried (Figure 8C). This negative association between photosynthesis and drier soil also occurred for P. glabrescens during the summer (Figure 8D), suggesting that drying soil has the potential to negatively affect both species’ carbon uptake. Similarly, a long-term study found that photosynthesis declined as soil moisture decreased in 11 boreal and temperate species, likely due to stomatal conductance restrictions (Reich et al., 2018). R25 also decreased as soil moisture decreased (Figures 9C,D), perhaps following the trend of Aopt, where decreased substrate may have limited the rate of respiration in drier soils. Soil drying often occurs with ecosystem-level warming experiments, and is also expected to occur with climate warming (e.g., Jarvi and Burton, 2013; Rich et al., 2015). Accordingly, the role soil moisture played in our study and the likelihood that, in the absence of precipitation changes, higher temperatures will result in reduced soil moisture, reinforces the importance of investigating how both temperature and moisture affect plant responses to climate change.
Assessing Physiological Responses by Treatment Versus Actual Environmental Conditions
We assessed thermal acclimation of physiological responses in two ways: (1) by assessing treatment effects using a binary comparison of control vs. warmed plots, and (2) by exploring responses to actual environmental conditions experienced by the plants in the day prior to each measurement. Although the experiment was initially designed to assess thermal acclimation through treatment effects, we detected stronger responses when looking at the responses to values of environmental variables across all treatments and time points. Several factors may have contributed to the disparity between the two assessments. First, in situ studies contend with many sources of variation across space and time. Gunderson et al. (2010) found a higher capacity for acclimation in seedlings grown in a growth chamber than saplings grown in the field. The authors suggest factors such as uncontrolled VPD and lower soil moisture could have limited acclimation capacity in situ.
The differences between plots prior to initiation of the warming treatment necessitated the gain score analysis comparing pre- and post- warming responses. This approach required all leaf-level measurements to be pooled at the plot level, thus dramatically reducing our statistical power compared to the regression-style analyses, which included plant-level data. We found no differences in temperature, soil moisture, or available nutrients between treatments that could easily explain pre-warming physiological variation between heated and control plots (Kimball et al., 2018; Reed et al., 2020). In January 2016, prior to initiation of the warming treatment, there were no differences in foliar nitrogen per unit leaf area for either P. brachiata (Student’s t test, p = 0.122) nor P. glabrescens (p = 0.520). Our experience here highlights not only the value of pre-treatment measurements, but also the importance of high-resolution measurements of actual environmental conditions when designing large-scale in situ experiments.
Conclusion and Implications
We assessed physiological acclimation potential of two Puerto Rican understory shrub species +4°C in an in situ field-scale warming experiment in a tropical forest and, overall, found different acclimation potential between species. Only one of our two study species, P. brachiata, acclimated to warmer temperatures through a wider photosynthetic thermal niche and higher photosynthetic optimum temperatures. In contrast, our other study species, P. glabrescens, showed no evidence photosynthetic acclimation, and in fact showed declines in both photosynthesis and stomatal conductance with warmer temperatures Surprisingly, we found little evidence for leaf respiratory acclimation, P. brachiata R25 decreased with increasing vegetation temperature during the drier winter season, but P. glabrescens showed no acclimation to experimental warming or daily temperature variations. These data provide important insight into how tropical understory plants respond to warming, as there are limited examples and, to our knowledge, no other large-scale in situ assessments of tropical forest understory plant physiological acclimation.
Expanding in situ experimental warming studies to include more species across different tropical forest types is essential, as a lack of acclimation could indicate altered tropical forest carbon uptake as global temperatures rise. Of our two study species, P. brachiata may be more resilient to climate warming due to higher plasticity in traits that conserve water and promote carbon gain. P. glabrescens experienced lower rates of photosynthesis at higher daily vegetation temperatures, perhaps due to reduced stomatal conductance. If a trend of higher physiological plasticity in early successional species and reduced photosynthesis with higher shade tolerance is conserved across more tropical understory species, we could see shifts in understory composition with climate warming. Soil moisture played an important role in determining the variation of many gas exchange variables and thus should be carefully considered in situ warming studies.
This study was conducted on understory species, yet upper canopy foliage may respond similarly to temperature as shaded layers (Slot et al., 2019) and, due to high heat stress, leaves in the canopy are already operating at or above thermal thresholds for photosynthesis (Doughty and Goulden, 2008; Mau et al., 2018). Thus, canopy foliage may not have the plasticity to up-regulate physiology to the same degree as understory plants. If so, the understory could become an even more dominant component of tropical forests’ carbon cycle. In conclusion, our study addresses a critical gap in our understanding of how tropical plants may respond to warming and suggests that species’ plasticity may play an important role in their ability to respond to climate change.
Data Availability Statement
The raw data supporting the conclusions of this article doi: 10.2737/RDS-2020-0055.
Author Contributions
MC, TW, and SR designed the TRACE experiment and acquired financial support for the overall study. KC and MC designed the physiological study. KC collected the photosynthesis, respiration, and leaf trait data. ES collected the stomatal size and density data. KC carried out all of the statistical analysis and wrote the first draft of the manuscript. MC provided additional advice and contributed to revisions of the text. All authors provided input and revisions to the final draft.
Funding
This research was funded by U.S. Department of Energy award numbers DE-SC-0012000, DE-SC-0011806, 89243018S-SC-000014, and DE-SC-0018942 awarded to MC, TW, and SR. This research was also funded by the National Science Foundation award DEB-1754713. SR was also supported by the U.S. Geological Survey Ecosystem Mission Area. The USDA Forest Service’s International Institute of Tropical Forestry (IITF) and University of Puerto Rico-Río Piedras provided additional support. All research at IITF is done in collaboration with the University of Puerto Rico. ES was also funded by Michigan Technological University Ecosystem Science Center and a Summer Undergraduate Research Fellowship. KC was also funded by Michigan Technological Finishing Fellowship and Michigan Tech Ecosystem Science Center.
Conflict of Interest
The authors declare that the research was conducted in the absence of any commercial or financial relationships that could be construed as a potential conflict of interest.
Acknowledgments
We are very grateful to TRACE project managers Aura M. Alonso-Rodríguez and Megan Berberich for their logistical support. We are also grateful to Kaylie Butts, Benjamin Miller, Talia Anderson, Jamarys Torres, GraceAnna Schilz, Jack Zwart, and Brian Peacock for their excellent field and lab assistance. Reviewers gave critical feedback on an earlier manuscript version that we believe greatly enhanced the quality. We also thank Robert Froese, Andrew Burton, and Sarah Green for thoughtful discussions. A previous version of this manuscript was included in a Ph.D. dissertation (Carter, 2019). Any use of trade, firm, or product names is for descriptive purposes only and does not imply endorsement by the United States Government.
Supplementary Material
The Supplementary Material for this article can be found online at: https://www.frontiersin.org/articles/10.3389/ffgc.2020.576320/full#supplementary-material
Supplementary Figure 1 | A-Ci curves at different temperatures.
Supplementary Figure 2 | Gain score analysis of heated and control plot vegetation temperature and soil moisture.
Supplementary Figure 3 | VPD of heated and control plots during summer 2017.
Supplementary Figure 4 | Photosynthetic parameter gain scores between pre-warming and post-warming measurements.
Supplementary Figure 5 | Dark respiration parameter gain scores between pre-warming and post-warming measurements.
Supplementary Figure 6 | Biochemical parameter responses to leaf temperature.
Supplementary Figure 7 | Photosynthetic parameter responses to maximum daily vegetation temperature.
Supplementary Figure 8 | Respiratory parameter responses to minimum daily vegetation temperature.
Supplementary Figure 9 | Photosynthetic parameter responses to soil moisture at 0–10 cm depth.
Supplementary Figure 10 | Respiratory parameter responses to soil moisture at 0–10 cm depth.
Supplementary Figure 11 | Hierarchical partitioning results of gas exchange parameter variances explained by environmental variables.
Supplementary Table 1 | Mean daily vegetation temperature of the control plots, mean, minimum, and maximum daily air temperature and rainfall during each measurement campaign.
Supplementary Table 2 | Count of total individual trees and leaves measured for each campaign, species, treatment, and gas exchange measurement.
Supplementary Table 3 | P-values and degrees of freedom from ANOVA results of gain score of vegetation temperature and soil moisture.
Supplementary Table 4 | P-values and degrees of freedom from ANOVA results of gain score of leaf gas exchange variables.
Supplementary Table 5 | Mean daily maximum vegetation temperature and physiological parameter means of the heated and control plots for each species.
Supplementary Table 6 | Temperature response parameters estimated for the maximum rate of Rubisco carboxylation (Vcmax) and the maximum rate of electron transport (Jmax).
Supplementary Table 7 | Summary of mixed effects model results of gas exchange parameter responses to environmental variables.
References
Aasamaa, K., Sõber, A., and Rahi, M. (2001). Leaf anatomical characteristics associated with shoot hydraulic conductance, stomatal conductance and stomatal sensitivity to change in leaf water status in temperate deciduous trees. Aust. J. Plant Physiol. 28, 765–774. doi: 10.1071/pp00157
Arneth, A., Mercado, L., Kattge, J., and Booth, B. B. B. (2012). Future challenges of representing land-processes in studies on land-atmosphere interactions. Biogeosciences 9, 3587–3599. doi: 10.5194/bg-9-3587-2012
Aspinwall, M. J., Drake, J. E., Campany, C., Vårhammar, A., Ghannoum, O., Tissue, D. T., et al. (2016). Convergent acclimation of leaf photosynthesis and respiration to prevailing ambient temperatures under current and warmer climates in Eucalyptus tereticornis. New Phytol. 212, 354–367. doi: 10.1111/nph.14035
Atkin, O. K., Bruhn, D., Hurry, V. M., and Tjoelker, M. G. (2005). The hot and the cold: unravelling the variable response of plant respiration to temperature. Funct. Plant Biol. 32, 87–105. doi: 10.1071/FP03176
Atkin, O. K., Loveys, B. R., Atkinson, L. J., and Pons, T. L. (2006). Phenotypic plasticity and growth temperature: understanding interspecific variability. J. Exp. Bot. 57, 267–281. doi: 10.1093/jxb/erj029
Atkin, O. K., and Tjoelker, M. G. (2003). Thermal acclimation and the dynamic response of plant respiration to temperature. Trends Plant Sci. 8, 343–351. doi: 10.1016/S1360-1385(03)00136-5
Bacmeister, J. T., Reed, K. A., Hannay, C., Lawrence, P., Bates, S., Truesdale, J. E., et al. (2018). Projected changes in tropical cyclone activity under future warming scenarios using a high-resolution climate model. Clim. Change 146, 547–560. doi: 10.1007/s10584-016-1750-x
Bates, D., Meachler, M., Bolker, B., and Walker, S. (2015). Fitting linear mixed-effects models using lme4. J. Stat. Softw 67, 1–48. doi: 10.18637/jss.v067.i01
Becker, V. I., Goessling, J. W., Duarte, B., Cacador, I., Liu, F., Rosenqvist, E., et al. (2017). Combined effects of soil salinity and high temperature on photosynthesis and growth of quinoa plants (Chenopodium quinoa). Funct. Plant Biol. 44, 665–678. doi: 10.1071/FP16370
Beer, C., Reichstein, M., Tomelleri, E., Ciais, P., Jung, M., Carvalhais, N., et al. (2010). Terrestrial gross carbon dioxide uptake: global distribution and covariation with climate. Science 329, 834–839. doi: 10.1126/science.1184984
Berry, J., and Bjorkman, O. (1980). Photosynthetic response and adaptation to temperature in higher plants. Annu. Rev. Plant Physiol. 31, 491–543. doi: 10.1146/annurev.pp.31.060180.002423
Booth, B. B. B., Jones, C. D., Collins, M., Totterdell, I. J., Cox, P. M., Sitch, S., et al. (2012). High sensitivity of future global warming to land carbon cycle processes. Environ. Res. Lett. 7:024002. doi: 10.1088/1748-9326/7/2/024002
Carter, K. R. (2019). Ecophysiological Responses of Tropical Woody Species to Ambient and Elevated Temperatures. Ph.D. Dissertation, Michigan Technological University, Houghton, MI.
Cavaleri, M. A., Oberbauer, S. F., and Ryan, M. G. (2008). Foliar and ecosystem respiration in an old-growth tropical rain forest. Plant, Cell Environ. 31, 473–483. doi: 10.1111/j.1365-3040.2008.01775.x
Cavaleri, M. A., Reed, S. C., Smith, W. K., and Wood, T. E. (2015). Urgent need for warming experiments in tropical forests. Glob. Chang. Biol. 21, 2111–2121. doi: 10.1111/gcb.12860
Cernusak, L. A., Winter, K., Dalling, J. W., Holtum, J. A. M., Jaramillo, C., Körner, C., et al. (2013). Tropical forest responses to increasing atmospheric CO2: current knowledge and opportunities for future research. Funct. Plant Biol. 40, 531–551. doi: 10.1071/FP12309
Cheesman, A. W., and Winter, K. (2013). Growth response and acclimation of CO2 exchange characteristics to elevated temperatures in tropical tree seedlings. J. Exp. Bot. 64, 3817–3828. doi: 10.1093/jxb/ert211
Chen, J. M., Mo, G., Pisek, J., Liu, J., Deng, F., Ishizawa, M., et al. (2012). Effects of foliage clumping on the estimation of global terrestrial gross primary productivity. Glob. Biogeochem. Cycles 26:GB1019. doi: 10.1029/2010GB003996
Ciais, P., Reichstein, M., Viovy, N., Granier, A., Ogée, J., Allard, V., et al. (2005). Europe-wide reduction in primary productivity caused by the heat and drought in 2003. Nature 437, 529–533. doi: 10.1038/nature03972
Cox, P. M., Betts, R. A., Jones, C. D., Spall, S. A., and Totterdell, I. J. (2000). Acceleration of global warming due to carbon-cycle feedbacks in a coupled climate model. Nature 408, 184–187. doi: 10.1038/35041539
Crous, K. Y., Sharwood, E., Drake, J. E., Tjoelker, M. G., Aspinwall, M. J., and Ghannoum, O. (2018). Photosynthetic capacity and leaf nitrogen decline along a controlled climate gradient in provenances of two widely distributed Eucalyptus species. Glob. Chang. Biol. 24, 4626–4644. doi: 10.1111/gcb.14330
Cunningham, S. C., and Read, J. (2003). Do temperate rainforest trees have a greater ability to acclimate to changing temperatures than tropical rainforest trees? New Phytol. 157, 55–64. doi: 10.1046/j.1469-8137.2003.00652.x
Devoe, N. N. (1989). Differential Seedling and Regerneration in Openings and Beneath Closed Canopy in Sub-Tropical Wet Forest. Ph.D. thesis, Yale University, New Haven, CT.
Dewar, R. C., Medlyn, B. E., and Mcmurtrie, R. E. (1999). Acclimation of the respiration/photosynthesis ratio to temperature: insights from a model. Glob. Chang. Biol. 5, 615–622. doi: 10.1046/j.1365-2486.1999.00253.x
Diffenbaugh, N. S., and Scherer, M. (2011). Observational and model evidence of global emergence of permanent, unprecedented heat in the 20th and 21st centuries. Clim. Change 107, 615–624. doi: 10.1007/s10584-011-0112-y
Doughty, C. E. (2011). An in situ leaf and branch warming experiment in the Amazon. Biotropica 43, 658–665. doi: 10.1111/j.1744-7429.2010.00746.x
Doughty, C. E., and Goulden, M. L. (2008). Are tropical forests near a high temperature threshold? J. Geophys. Res. Biogeosci. 114, 1–12. doi: 10.1029/2007JG000632
Drake, J. E., Aspinwall, M. J., Pfautsch, S., Rymer, P. D., Reich, P. B., Smith, R. A., et al. (2015). The capacity to cope with climate warming declines from temperate to tropical latitudes in two widely distributed Eucalyptus species. Glob. Chang. Biol. 21, 459–472. doi: 10.1111/gcb.12729
Drake, J. E., Tjoelker, M. G., Aspinwall, M. J., Reich, P. B., Barton, C. V. M., Belinda, E., et al. (2016). Does physiological acclimation to climate warming stabilize the ratio of canopy respiration to photosynthesis? New Phytol. 211, 850–863. doi: 10.1111/nph.13978
Duursma, R. A. (2015). Plantecophys - An R package for analysing and modelling leaf gas exchange data. PLoS One 10:e0143346. doi: 10.1371/journal.pone.0143346
Ellsworth, D. S., and Reich, P. B. (1993). Canopy structure and vertical patterns of photosynthesis and related leaf traits in a deciduous forest. Oecologia 96, 169–178. doi: 10.1007/BF00317729
Farquhar, G. D., von Caemmerer, S., and Berry, J. A. (1980). A biochemical model of photosynthesis CO2 fixation in leaves of C3 species. Planta 149, 78–90. doi: 10.1007/bf00386231
Fauset, S., Oliveira, L., Buckeridge, M. S., Foyer, C. H., Galbraith, D., Tiwari, R., et al. (2019). Contrasting responses of stomatal conductance and photosynthetic capacity to warming and elevated CO2 in the tropical tree species Alchornea glandulosa under heatwave conditions. Environ. Exp. Bot. 158, 28–39. doi: 10.1016/j.envexpbot.2018.10.030
Fox, J., and Weisberg, S. (2011). An {R} Companion to Applied Regression, 2nd Edn. Thousand Oaks, CA: Sage.
Galbraith, D., Levy, P. E., Sitch, S., Huntingford, C., Cox, P., Williams, M., et al. (2010). Multiple mechanisms of Amazonian forest biomass losses in three dynamic global vegetation models under climate change. New Phytol. 187, 647–665. doi: 10.1111/j.1469-8137.2010.03350.x
Gunderson, C. A., Norby, R. J., and Wullschleger, S. D. (2000). Acclimation of photosynthesis and respiration to simulated climatic warming in northern and southern populations of Acer saccharum: laboratory and field evidence. Tree Physiol. 20, 87–96. doi: 10.1093/treephys/20.2.87
Gunderson, C. A., O’Hara, K. H., Campion, C. M., Walker, A. V., and Edwards, N. T. (2010). Thermal plasticity of photosynthesis: the role of acclimation in forest responses to a warming climate. Glob. Chang. Biol. 16, 2272–2286. doi: 10.1111/j.1365-2486.2009.02090.x
Gurevitch, J., Morrow, L. L., Wallace, A., and Walsh, J. S. (1992). A meta-analysis of competition in field experiments. Am. Nat. 140, 539–572. doi: 10.2307/2462913
Harris, N., Lugo, A., Brown, S., and Heartsill Scalley, T. (2012). Luquillo Experimental Forest: Research History and Opportunities. EFR-1. Washington, DC: U.S. Department of Agriculture, 152.
He, L., Chen, J. M., Gonsamo, A., Luo, X., Wang, R., Liu, Y., et al. (2018). Changes in the shadow: the shifting role of shaded leaves in global carbon and water cycles under climate change. Geophys. Res. Lett. 45, 5052–5061. doi: 10.1029/2018GL077560
Hedges, L. V., and Olkin, I. (1985). Statistical Methods for Meta-Analysis. New York, NY: Academic Press.
Heskel, M. A., O’Sullivan, O. S., Reich, P. B., Tjoelker, M. G., Weerasinghe, L. K., Penillard, A., et al. (2016). Convergence in the temperature response of leaf respiration across biomes and plant functional types. Proc. Natl. Acad. Sci. U.S.A. 113, 3832–3837. doi: 10.1073/pnas.1520282113
Hetherington, A. M., and Woodward, F. I. (2003). The role of stomata in sensing and driving environmental change. Nature 424, 901–908. doi: 10.1038/nature01843
Hill, K. E., Guerin, G. R., Hill, R. S., and Watling, J. R. (2014). Temperature influences stomatal density and maximum potential water loss through stomata of Dodonaea viscosa subsp. angustissima along a latitude gradient in southern Australia. Aust. J. Bot. 62, 657–665. doi: 10.1071/BT14204
Hubau, W., Lewis, S. L., Phillips, O. L., Affum-Baffoe, K., Beeckman, H., Cuní-Sanchez, A., et al. (2020). Asynchronous carbon sink saturation in African and Amazonian tropical forests. Nature 579, 80–87. doi: 10.1038/s41586-020-2035-0
Huntingford, C., Zelazowski, P., Galbraith, D., Mercado, L. M., Sitch, S., Fisher, R., et al. (2013). Simulated resilience of tropical rainforests to CO2 -induced climate change. Nat. Geosci. 6, 268–273. doi: 10.1038/ngeo1741
Janzen, D. H. (1967). Why mountain passes are higher in the tropics. Am. Nat. 101, 233–249. doi: 10.1086/282487
Jarvi, M. P., and Burton, A. J. (2013). Acclimation and soil moisture constrain sugar maple root respiration in experimentally warmed soil. Tree Physiol. 33, 949–959. doi: 10.1093/treephys/tpt068
Jumrani, K., Bhatia, V. S., and Pandey, G. P. (2017). Impact of elevated temperatures on specific leaf weight, stomatal density, photosynthesis and chlorophyll fluorescence in soybean. Photosynth. Res. 131, 333–350. doi: 10.1007/s11120-016-0326-y
June, T., Evans, J. R., and Farquhar, G. D. (2004). A simple new equation for the reversible temperature dependence of photosynthetic electron transport: a study on soybean leaf. Funct. Plant Biol. 31, 275–283. doi: 10.1071/FP03250
Kao, S. C., and Ganguly, A. R. (2011). Intensity, duration, and frequency of precipitation extremes under 21st-century warming scenarios. J. Geophys. Res. Atmos. 116, 1–14. doi: 10.1029/2010JD015529
Kattge, J., and Knorr, W. (2007). Temperature acclimation in a biochemical model of photosynthesis: a reanalysis of data from 36 species. Plant Cell Environ. 30, 1176–1190. doi: 10.1111/j.1365-3040.2007.01690.x
Kimball, B. A., Alonso-Rodríguez, A. M., Cavaleri, M. A., Reed, S. C., González, G., and Wood, T. E. (2018). Infrared heater system for warming tropical forest understory plants and soils. Ecol. Evol. 8, 1931–1944. doi: 10.1002/ece3.3780
Kirschbaum, M. U. F., and McMillan, A. M. S. (2018). Warming and elevated CO2 have opposing influences on transpiration. Which is more important? Curr. For. Rep. 4, 51–71. doi: 10.1007/s40725-018-0073-8
Knutson, T. R., Sirutis, J. J., Zhao, M., Tuleya, R. E., Bender, M., Vecchi, G. A., et al. (2015). Global projections of intense tropical cyclone activity for the late twenty-first century from dynamical downscaling of CMIP5/RCP4.5 scenarios. J. Clim. 28, 7203–7224. doi: 10.1175/JCLI-D-15-0129.1
Korner, C. (2004). Through enhanced tree dynamics carbon dioxide enrichment may cause tropical forests to lose carbon. Philos. Trans. R. Soc. B Biol. Sci. 359, 493–498. doi: 10.1098/rstb.2003.1429
Krause, G. H., Cheesman, A. W., Winter, K., Krause, B., and Virgo, A. (2013). Thermal tolerance, net CO2 exchange and growth of a tropical tree species, Ficus insipida, cultivated at elevated daytime and nighttime temperatures. J. Plant Physiol. 170, 822–827. doi: 10.1016/j.jplph.2013.01.005
Lloyd, J., and Farquhar, G. D. (2008). Effects of rising temperatures and [CO2] on the physiology of tropical forest trees. Philos. Trans. R. Soc. Lond. B. Biol. Sci. 363, 1811–1817. doi: 10.1098/rstb.2007.0032
Lombardozzi, D. L., Bonan, G. B., Smith, N. G., Dukes, J. S., and Fisher, R. A. (2015). Temperature acclimation of photosynthesis and respiration: a key uncertainty in the carbon cycle-climate feedback. Geophys. Res. Lett. 42, 8624–8631. doi: 10.1002/2015GL065934
Loveys, B., Atkinson, L., Sherlock, D., Roberts, R., Fitter, A., and Atkin, O. (2003). Thermal acclimation of leaf and root respiration: an investigation comparing inherently fast- and slow- growing plant species. Glob. Chang. Biol. 9, 895–910. doi: 10.1046/j.1365-2486.2003.00611.x
Mau, A., Reed, S., Wood, T., and Cavaleri, M. (2018). Temperate and tropical forest canopies are already functioning beyond their thermal thresholds for photosynthesis. Forests 9:47. doi: 10.3390/f9010047
Medlyn, B. E., Dreyer, E., Ellsworth, D., Forstreuter, M., Harley, P. C., Kirschbaum, M. U. F., et al. (2002). Temperature response of parameters of a biochemically based model of photosynthesis. II. A review of experimental data. Plant Cell Environ. 25, 1167–1179. doi: 10.1046/j.1365-3040.2002.00891.x
Mercado, L. M., Medlyn, B. E., Huntingford, C., Oliver, R. J., Clark, D. B., Sitch, S., et al. (2018). Large sensitivity in land carbon storage due to geographical and temporal variation in the thermal response of photosynthetic capacity. New Phytol. 218, 1462–1477. doi: 10.1111/nph.15100
Monteith, J. L., and Unsworth, M. H. (2008). Principles of Environmental Physics, 3rd Edn. New York, NY: Academic Press.
Mora, C., Frazier, A. G., Longman, R. J., Dacks, R. S., Walton, M. M., Tong, E. J., et al. (2013). The projected timing of climate departure from recent variability. Nature 502, 183–187. doi: 10.1038/nature12540
Myster, R. W., and Walker, L. R. (1997). Plant successional pathways on Puerto Rican landslides. J. Trop. Ecol. 13, 165–173. doi: 10.1017/S0266467400010397
Nicotra, A. B., Atkin, O. K., Bonser, S. P., Davidson, A. M., Finnegan, E. J., Mathesius, U., et al. (2010). Plant phenotypic plasticity in a changing climate. Trends Plant Sci. 15, 684–692. doi: 10.1016/j.tplants.2010.09.008
Niinemets, Ü, and Valladares, F. (2004). Photosynthetic acclimation to simultaneous and interacting environmental stresses along natural light gradients: optimality and constraints. Plant Biol. 6, 254–268. doi: 10.1055/s-2004-817881
O’Sullivan, O. S., Heskel, M. A., Reich, P. B., Tjoelker, M. G., Weerasinghe, L. K., Penillard, A., et al. (2017). Thermal limits of leaf metabolism across biomes. Glob. Chang. Biol. 23, 209–223. doi: 10.1111/gcb.13477
O’Sullivan, O. S., Weerasinghe, K. W. L. K., Evans, J. R., Egerton, J. J. G., Tjoelker, M. G., and Atkin, O. K. (2013). High-resolution temperature responses of leaf respiration in snow gum (Eucalyptus pauciflora) reveal high-temperature limits to respiratory function. Plant Cell Environ. 36, 1268–1284. doi: 10.1111/pce.12057
Pan, Y., Birdsey, R. A., Phillips, O. L., and Jackson, R. B. (2013). The structure, distribution, and biomass of the world’s forests. Annu. Rev. Ecol. Evol. Syst. 44, 593–622. doi: 10.1146/annurev-ecolsys-110512-135914
Pau, S., Detto, M., Kim, Y., and Still, C. J. (2018). Tropical forest temperature thresholds for gross primary productivity. Ecosphere 9, 1–12. doi: 10.1002/ecs2.2311
Pearcy, R. W., Valladares, F., Wright, S. J., and De Paulis, E. L. (2004). A functional analysis of the crown architecture of tropical forest Psychotria species: Do species vary in light capture efficiency and consequently in carbon gain and growth? Oecologia 139, 163–177. doi: 10.1007/s00442-004-1496-4
Phillips, O. L., Lewis, S. L., Lloyd, J., López-González, G., Peacock, J., Quesada, C. A., et al. (2009). Drought sensitivity of the amazon rainforest. Science 323, 1344–1347. doi: 10.1126/science.1164033
Piersma, T., and Drent, J. (2003). Phenotypic flexibility and the evolution of organismal design. Trends Ecol. Evol. 18, 228–233. doi: 10.1016/S0169-5347(03)00036-3
R Core Team (2018). R: A Language and Environment for Statistical Computing. Vienna, Austria: R Foundation for Statical Computing.
Reed, S. C., Reibold, R., Cavaleri, M. A., Alonso-Rodríguez, A. M., Berberich, M. E., and Wood, T. E. (2020). Soil biogeochemical responses of a tropical forest to warming and hurricane disturbance. Adv. Ecol. Res. 62, 225–252. doi: 10.1016/bs.aecr.2020.01.007
Reich, P. B., Sendall, K. M., Stefanski, A., Rich, R. L., Hobbie, S. E., and Montgomery, R. A. (2018). Effects of climate warming on photosynthesis in boreal tree species depend on soil moisture. Nature 562, 263–267. doi: 10.1038/s41586-018-0582-4
Rich, R. L., Stefanski, A., Montgomery, R. A., Hobbie, S. E., Kimball, B. A., and Reich, P. B. (2015). Design and performance of combined infrared canopy and belowground warming in the B4WarmED (Boreal Forest Warming at an Ecotone in Danger) experiment. Glob. Chang. Biol. 21, 2334–2348. doi: 10.1111/gcb.12855
Rodrigues, W. P., Martins, M. Q., Fortunato, A. S., Rodrigues, A. P., Semedo, J. N., Simões-Costa, M. C., et al. (2016). Long-term elevated air [CO2] strengthens photosynthetic functioning and mitigates the impact of supra-optimal temperatures in tropical Coffea arabica and C. canephora species. Glob. Chang. Biol. 22, 415–431. doi: 10.1111/gcb.13088
Santos, V. A. H. F. D., Ferreira, M. J., Rodrigues, J. V. F. C., Garcia, M. N., Ceron, J. V. B., Nelson, B. W., et al. (2018). Causes of reduced leaf-level photosynthesis during strong El Niño drought in a Central Amazon forest. Glob. Chang. Biol. 24, 4266–4279. doi: 10.1111/gcb.14293
Scatena, F. (1989). An Introduction to the Physiography and History of the Bisley Experimental Watersheds in the Luquillo Mountains of Puerto Rico. General Technical Report SO-72. New Orleans, LA: United States Department of Agriculture Southern Forest Experimental Station, 22. doi: 10.2737/SO-GTR-72
Schimel, D., Pavlick, R., Fisher, J. B., Asner, G. P., Saatchi, S., Townsend, P., et al. (2015). Observing terrestrial ecosystems and the carbon cycle from space. Glob. Chang. Biol. 21, 1762–1776. doi: 10.1111/gcb.12822
Shen, H. F., Zhao, B., Xu, J. J., Liang, W., Huang, W. M., and Li, H. H. (2017). Effects of heat stress on changes in physiology and anatomy in two cultivars of Rhododendron. S. Afr. J. Bot. 112, 338–345. doi: 10.1016/j.sajb.2017.06.018
Slot, M., and Kitajima, K. (2015). General patterns of acclimation of leaf respiration to elevated temperatures across biomes and plant types. Oecologia 177, 885–900. doi: 10.1007/s00442-014-3159-4
Slot, M., Krause, G. H., Krause, B., Hernández, G. G., and Winter, K. (2019). Photosynthetic heat tolerance of shade and sun leaves of three tropical tree species. Photosynth. Res. 141, 119–130. doi: 10.1007/s11120-018-0563-3
Slot, M., Rey-Sánchez, C., Gerber, S., Lichstein, J. W., Winter, K., and Kitajima, K. (2014). Thermal acclimation of leaf respiration of tropical trees and lianas: response to experimental canopy warming, and consequences for tropical forest carbon balance. Glob. Chang. Biol. 20, 2915–2926. doi: 10.1111/gcb.12563
Slot, M., and Winter, K. (2017). Photosynthetic acclimation to warming in tropical forest tree seedlings. J. Exp. Bot. 68, 2275–2284. doi: 10.1093/jxb/erx071
Slot, M., and Winter, K. (2018). High tolerance of tropical sapling growth and gas exchange to moderate warming. Funct. Ecol. 32, 599–611. doi: 10.1111/1365-2435.13001
Smith, N. G., and Dukes, J. S. (2017). Short-term acclimation to warmer temperatures accelerates leaf carbon exchange processes across plant types. Glob. Chang. Biol. 4840–4853. doi: 10.1111/gcb.13735
Smith, N. G., Malyshev, S. L., Shevliakova, E., Kattge, J., and Dukes, J. S. (2016). Foliar temperature acclimation reduces simulated carbon sensitivity to climate. Nat. Clim. Chang. 6, 407–411. doi: 10.1038/nclimate2878
Valladares, F., Chico, J. M., Aranda, I., Balaguer, L., Dizengremel, P., Manrique, E., et al. (2002). The greater seedling high-light tolerance of Quercus robur over Fagus sylvatica is linked to a greater physiological plasticity. Trends Ecol. Evol. 16, 395–403. doi: 10.1007/s00468-002-0184-4
Valladares, F., Wright, S. J., Lasso, E., Kitajima, K., and Pearcy, R. W. (2000). Plastic phenotypic response to light of 16 congeneric shrubs from a Panamanian rainforest. Ecology 81, 1925–1936.
van Schaik, E., Killaars, L., Smith, N. E., Koren, G., Van Beek, L. P. H., Peters, W., et al. (2018). Changes in surface hydrology, soil moisture and gross primary production in the Amazon during the 2015/2016 El Niño. Philos. Trans. R. Soc. B Biol. Sci. 373:20180084. doi: 10.1098/rstb.2018.0084
von Caemmerer, S., and Farquhar, G. D. (1981). Some relationships between the biochemistry of photosynthesis and the gas exchange of leaves. Planta 153, 376–387. doi: 10.1007/BF00384257
Walsh, C., and Mac Nally, R. (2013). hier.part: Hierarchical Partitioning. R package version 1.0-4. Available online at: http://CRAN.R-project.org/package=hier.part (accessed September 15, 2013).
Way, D. A., and Oren, R. (2010). Differential responses to changes in growth temperature between trees from different functional groups and biomes: a review and synthesis of data. Tree Physiol. 30, 669–688. doi: 10.1093/treephys/tpq015
Way, D. A., and Yamori, W. (2014). Thermal acclimation of photosynthesis: on the importance of adjusting our definitions and accounting for thermal acclimation of respiration. Photosynth. Res. 119, 89–100. doi: 10.1007/s11120-013-9873-7
Wood, T. E., Cavaleri, M. A., Giardina, C. P., Khan, S., Mohan, J. E., Nottingham, A. T., et al. (2019). Soil Warming Effects on Tropical Forests with Highly Weathered Soils. Cambridge, MA: Academic Press. doi: 10.1016/b978-0-12-813493-1.00015-6
Wood, T. E., Cavaleri, M. A., and Reed, S. C. (2012). Tropical forest carbon balance in a warmer world: a critical review spanning microbial- to ecosystem-scale processes. Biol. Rev. 87, 912–927. doi: 10.1111/j.1469-185X.2012.00232.x
Wu, G., Liu, H., Hua, L., Luo, Q., Lin, Y., He, P., et al. (2018). Differential responses of stomata and photosynthesis to elevated temperature in two co-occurring subtropical forest tree species. Front. Plant Sci. 9:467. doi: 10.3389/fpls.2018.00467
Yaffar, D., and Norby, R. J. (2020). A historical and comparative review of 50 years of root data collection in Puerto Rico. Biotropica 52, 563–576. doi: 10.1111/btp.12771
Keywords: experimental warming, photosynthesis, respiration, stomatal traits, thermal acclimation, TRACE, tropical forests
Citation: Carter KR, Wood TE, Reed SC, Schwartz EC, Reinsel MB, Yang X and Cavaleri MA (2020) Photosynthetic and Respiratory Acclimation of Understory Shrubs in Response to in situ Experimental Warming of a Wet Tropical Forest. Front. For. Glob. Change 3:576320. doi: 10.3389/ffgc.2020.576320
Received: 25 June 2020; Accepted: 09 September 2020;
Published: 30 September 2020.
Edited by:
Nadine K. Ruehr, Karlsruhe Institute of Technology (KIT), GermanyReviewed by:
Tomoaki Ichie, Kōchi University, JapanDrew Peltier, Northern Arizona University, United States
Copyright © 2020 Carter, Wood, Reed, Schwartz, Reinsel, Yang and Cavaleri. This is an open-access article distributed under the terms of the Creative Commons Attribution License (CC BY). The use, distribution or reproduction in other forums is permitted, provided the original author(s) and the copyright owner(s) are credited and that the original publication in this journal is cited, in accordance with accepted academic practice. No use, distribution or reproduction is permitted which does not comply with these terms.
*Correspondence: Kelsey R. Carter, a2Vsc2V5cmNhcnRlckBnbWFpbC5jb20=