 David Solis
 Peter Cronkleton
 Erin O. Sills4,5
 Dawn Rodriguez-Ward
 Amy E. Duchelle
- 1Facultad de Ciencias Económicas y Empresariales, Universidad de Piura, Piura, Peru
- 2Pronaturaleza Foundation, Lima, Peru
- 3Center for International Forestry Research, Lima, Peru
- 4Department of Forestry and Environmental Resources, North Carolina State University, Raleigh, NC, United States
- 5Center for International Forestry Research, Bogor, Indonesia
REDD+ was conceived as a system of incentives for reducing emissions from deforestation and degradation. While this could include many different types of interventions to reduce deforestation and degradation, a consensus has emerged that they should safeguard and “do no harm” to the forest-based livelihoods of local people. Many REDD+ projects have been designed to incentivize forest conservation and support local livelihoods by promoting sustainable use of the forest, hence increasing the revenues earned by local households from forest products. We examine two such projects in the Peruvian Amazon, using panel survey data from over 400 households gathered in 2011 and 2014. In the 3 years between surveys, we observed a severe decline in forest revenue. However, by using a BACI study design and matching, we show that this decrease was not caused by the REDD+ interventions. Thus, REDD+ “did no harm” to local people, at least in terms of forest revenues in the early phases of these two projects in the Peruvian Amazon.
Introduction
The goal of REDD+ is to reduce emissions from deforestation and forest degradation, and enhance forest carbon stocks, toward mitigating global climate change. When REDD+ emerged on the international stage more than 10 years ago, it was seen as a potential quadruple win for climate benefits, poverty reduction, improved forest governance, and biodiversity conservation (Brown et al., 2008). In theory, REDD+ initiatives provide incentives (or disincentives) to encourage forest stewards to lower deforestation and forest degradation to limit carbon emissions and sequester carbon (Angelsen et al., 2012). To reach these goals, REDD+ implementers employ diverse tools, including conditional payments, forest law enforcement, support for sustainable forest management, and alternative livelihood enhancements (Petkova et al., 2010; Sills et al., 2014; Luttrell and Betteridge, 2017). Given the importance of forests to local well-being, it is widely accepted that REDD+ must minimize risks to local people and produce livelihood benefits to be effective and equitable (Duchelle et al., 2018a). This may be difficult to accomplish in the early phase of REDD+, when there is pressure to conserve forest but not yet carbon revenue to share with local people. One possible solution is to promote sustainable forest management as a way to both incentivize conservation and generate revenues from forest products.
Although the UNFCCC ultimately agreed on REDD+ implementation at the national scale, the international call for “demonstration activities” in 2007 led to the emergence of hundreds of local REDD+ projects across the tropics, largely implemented by non-governmental organizations (NGOs) and private companies (Sills et al., 2014). About half of those projects have been third party certified (e.g., by the Climate, Community and Biodiversity Alliance or Plan Vivo), which requires adherence to social and environmental safeguards and is a necessary step for carbon trading in international voluntary markets (Wunder et al., 2020). However, because of the international political climate, relatively few of the projects have sold carbon credits, especially in the first few years after their launch (Wunder et al., 2020). This presents a challenge for project implementation, including making good on promises of benefit sharing with local people.
A robust review of the scientific literature on REDD+ project impacts found generally small or mixed effects on local well-being that were more likely to be positive when incentives were offered (Duchelle et al., 2018b). A quasi-experimental study at 22 REDD+ sites in six countries found that REDD+ projects did not negatively affect local perceptions of well-being or income sufficiency (Sunderlin et al., 2017). At a subset of 17 of these sites, interventions designed to improve livelihoods cushioned the negative effects of forest restrictions (Duchelle et al., 2017). Some case studies, however, have highlighted negative outcomes for local people. An analysis from Tanzania showed that projects intended to improve local socio-economic well-being have instead undercut livelihoods and potentially deepened poverty because the intended beneficiaries were also identified as the principal threat to forests and were targeted for displacement (Beymer-Farris and Bassett, 2012). Others have flagged the potential risk of REDD+ leading to the alienation of forestlands from local stakeholders with the associated loss of livelihood options, a process they refer to as “green grabbing,” which involves “the restructuring of rules and authority over the access, use and management of resources” (Fairhead et al., 2012, p. 239). Other researchers have identified how the limited representation of local opinion in the implementation of REDD+ projects can “reshape” community forestry objectives, thereby undermining livelihoods and restricting local access to forest benefits (Khatri et al., 2018). While the REDD+ projects analyzed in this paper do not suffer from the levels of tenure insecurity that have driven many of the problems cited in these other case studies, it remains relevant to assess socio-economic outcomes like forest revenues to ensure that negative impacts are being avoided.
In this paper, we examine two REDD+ projects in the Peruvian Amazon (regions of Ucayali and Madre de Dios) that both promoted sustainable forest management to align their goals of conserving forest and supporting local livelihoods, although they also both planned to eventually offer direct conditional payments to local people. In the Ucayali site, these interventions included technical assistance for sustainable forest management (specifically reduced impact logging and FSC certification), the establishment of timber plantations, and training in sustainable practices for non-timber forest product management. In the Madre de Dios site, interventions included forest monitoring and surveillance, technical assistance with sustainable Brazil nut management and organic certification, and legal assistance with securing rights to Brazil nut concessions.
The two projects were included in the Global Comparative Study (GCS) on REDD+ of the Center for International Forestry Research (CIFOR). This study included a household panel survey in the project intervention areas and matched nearby communities. The survey elicited information on annual revenue earned from forest products such as timber, Brazil nuts, and fish, which we used to calculate forest revenue as the value of all forest products harvested by a household, corrected for inflation using a consumer price index for Peru (available at https://data.worldbank.org). We use survey data from before (2011) and after (2014) the REDD+ interventions to evaluate impacts on forest revenue (the value of all forest products harvested by a household), using Difference-in-Differences (DID) with matching.
This paper is organized into five sections. The first section describes the study sites and the quasi-experimental study design. The second section presents methods, describing in detail the step by step procedures and the data used for DID with Propensity Score Matching (PSM), as well as two robustness checks using an alternative matching method and regression adjustment. In the third section, we present the estimated effects of the REDD+ interventions on forest revenue, starting with DID across communities that were selected (treatment) and a pre-matched sample of communities that were not selected by REDD+ implementers (control). Next, we implement PSM with survey data on factors that could affect both the households' choice to participate in REDD+ and their forest revenues, and we estimate DID within that matched sample. In the fourth section, we explore possible explanations for our estimation results, and in the last section, we present conclusions.
Study Design and Study Sites
To assess whether REDD+ interventions “do no harm” to local people, we need to know what would have happened to those people without the interventions. This counterfactual has rarely been constructed for the social outcomes of REDD+, in part because it cannot be constructed from data on the project intervention areas alone (Caplow et al., 2011). For the GCS REDD+, CIFOR adopted the BACI (before-after-control-intervention) study design. As described in Sills et al. (2017), the first step was to identify a pool of communities in roughly the same biophysical and market environments, and then gather information on the characteristics of those communities that could have affected selection into the projects. Matching was then employed to identify a sample of four communities inside and four communities outside the intervention area of each project with a balanced distribution of those characteristics. Identical survey instruments were applied to a random sample of households in all of those communities just before REDD+ interventions began and again 3 years later.
These survey data allow us to estimate the causal effects of REDD+ by comparing changes in forest revenue inside and outside the intervention areas, i.e., DID. This method helps disentangle the effects of the interventions from the effects of the location of the intervention and contemporaneous policy, markets, social, economic, and environmental changes (Sills et al., 2017). The key assumption is that trends in forest revenues would have been the same in the matched communities inside and outside the intervention areas if there had been no intervention. Under this assumption, DID provides an unbiased measure of the “treatment effect,” or the effect of being included in the REDD+ intervention area.
While communities were pre-matched based on characteristics that the project implementers might have considered when defining their intervention area, there could still be systematic differences in the characteristics of households sampled in the intervention and control communities. If these characteristics are also related to forest revenues, those differences could bias our results. Thus, we also employ matching based on our household survey data to identify a sample of households inside and outside the intervention area that are balanced in terms of household characteristics that could be related to both participation in REDD+ and forest revenues.
In our main results, we use Propensity Score Matching (PSM) to identify a balanced sample of households in each site. PSM overcomes the multi-dimensional problem of matching on many observed characteristics by instead matching on the likelihood—or propensity—of participation (Rosenbaum and Rubin, 1983). Propensity scores are estimated from a logit model of participation estimated using characteristics reported in the first survey, before the intervention. Those scores are then used to select control households that are most similar to the households in the project intervention areas. The quality of the match is evaluated by comparing both the distributions of the propensity score and the standardized mean differences in the average values of individual characteristics.
This study design was implemented across six countries by CIFOR's GCS REDD+,1 including REDD+ projects that had defined their intervention areas but not yet begun implementing interventions at the time of the first survey. In Madre de Dios, data were collected during November 2011–February 2012 (phase 1) and May–June 2014 (phase 2). In Ucayali, data were collected during December 2012–February 2013 (phase 1) and September–October 2014 (phase 2). While interviews were conducted in different seasons in the two phases, the survey instrument elicited information on all sources of household income, including all forest products harvested for consumption or sale, for the previous 12 months. Forest revenues were then computed as the value of all production using local prices. The survey data were collected using the same survey instruments by teams of enumerators who received the same extensive training in 2011 and 2014. In addition, seven of the same enumerators worked in both phases of survey (five in Ucayali and two in Madre de Dios).
The two REDD+ projects that we study sought to protect forest in the Amazon region by promoting sustainable forest management. However, they were implemented by different types of organizations (NGO vs. private company) and involved different types of households (indigenous vs. NTFP collector). We employed the same study design in both, collecting data both before and after in both intervention and matched control communities. This was key because neither project worked with a random sample of communities.
The NGO Asociación para la Investigación y Desarrollo Integral (AIDER) implemented REDD+ in Ucayali in collaboration with seven native communities. The intervention area covers 127,004 hectares of community forest, where AIDER has been working since 2000, e.g., providing technical support for the preparation of community forest management plans. The Forest Stewardship Council (FSC) certified five of these communities, four in 2006 and another in 2010. The AIDER REDD+ project built on these earlier initiatives to support sustainable harvest of timber and non-timber forest products initiatives to increase forest revenues and reduce deforestation. Specifically, as part of the REDD+ project, AIDER invested in capacity-building for sustainable forestry management, established timber plantations of the fast growing pioneer species bolaina (Guazuma crinite), and supported sustainable management of NTFPs such as tanoni (Thevetia peruviana), aguaje (Mauritia flexuosa), and huayruro (Ormosia coccinea) (Rodriguez-Ward and Paredes de Aguilar, 2014). Tanoni and huayruro are important especially to women's livelihoods, because their seeds are used for handicrafts (Rodriguez-Ward and Paredes de Aguilar, 2014). An eventual goal of the AIDER REDD+ project is to distribute carbon revenues to households as direct payments, but this had not yet been launched at the time of data collection. However, in 2018, AIDER signed a loan agreement with Althelia Funds (managed by the European investment company Mirova National Capital Limited or MNC) to generate carbon credits from FSC certified sustainable forest management and cacao agroforestry systems (Althelia Funds, 2019). In total, the survey resulted in a panel of 204 households interviewed in two phases (109 treated and 95 controls in a matched sample of native communities). We were not able to locate and interview 43 households in the second phase (14 treated and 29 controls).2 Map 1 shows control and treated communities in the Ucayali site.
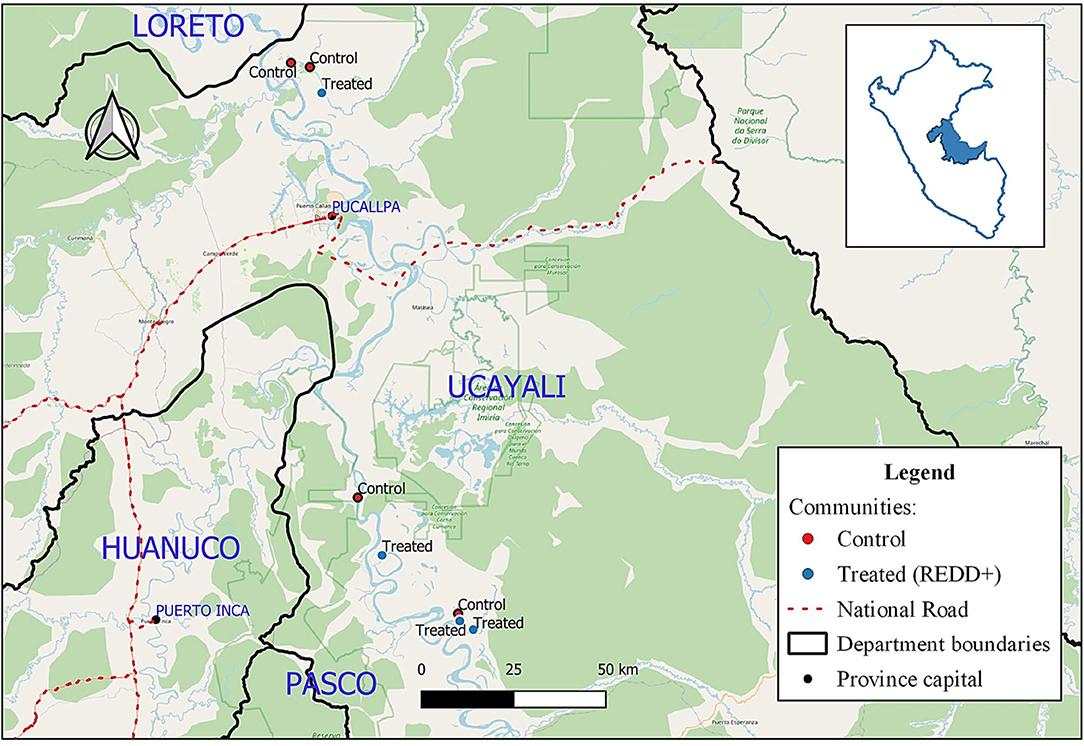
MAP 1. Control and treated communities—Ucayali site.
The second REDD+ project is organized by the private forestry company Bosques Amazónicos (BAM) in the southwestern Amazonian region of Madre de Dios. This project is jointly implemented with the Federation of Brazil nut producers in Madre de Dios (Federación de Productores Castaña de Madre de Dios—FEPROCAMD). The goal of the project is to maintain forest cover in the Brazil nut concessions by strengthening forest tenure, improving compliance with forestry regulations, and increasing revenue from Brazil nuts by adding value to this product (Garrish et al., 2014). By the end of 2014, 405 Brazil nut concessionaires had joined the BAM project with combined concession areas totaling ~308,738 hectares of forest. Participating concessionaires committed to avoiding deforestation within their concessions and transferred the carbon credits to the Federation. The Federation in turn transferred the rights to hold and commercialize carbon credits to BAM. BAM pledged to invest at least US$1 million in the REDD+ project, including building a Brazil nut processing facility. Although a peri-urban property (near Puerto Maldonado) was purchased for the facility, it has not yet been constructed (as of October 2020). BAM also provided participants with operational capital, technical and legal assistance to prepare annual operational plans for the Brazil nut harvest and other documentation such as plans to harvest timber from their concessions and delineation of concession boundaries. In addition, after recovering their costs from investment in the REDD+ project (which include the costs associated with the carbon verification process, the Brazil nut processing facility, technicians to assist concessionaires, and concession fees), BAM initially expected to distribute 30% of net revenues from the sale of carbon credits to participating concessionaires, although this had not yet begun during our study period (Garrish et al., 2014). More recently, BAM reported that they have modified their agreement with FEPROCAMD to equally share the proceeds of carbon trades from 2021 onwards.
We gathered data from four Brazil nut-producing communities participating in the REDD+ project and four matched Brazil nut-producing communities that were not selected for the project. Unlike the Ucayali case, these communities were not indigenous; most community members were migrants from southern Peruvian Andean regions who had been granted Brazil nut concessions. In total, we interviewed 217 households in both phases (113 treated and 104 controls). We were not able to locate and interview 33 households in the second phase (13 treated and 20 controls).3 Map 2 shows control and treated communities in the Madre de Dios site.
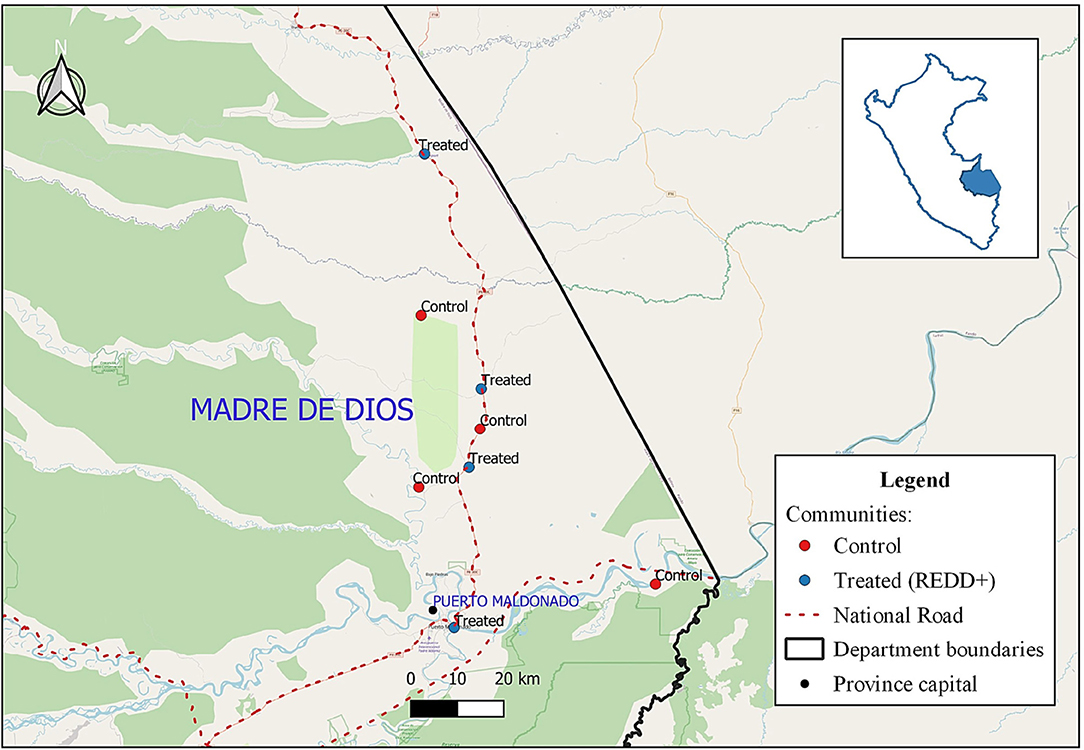
MAP 2. Control and treated communities—Madre de Dios site.
Methodology
The estimand of interest is the ATET (Average Treatment Effect on the Treated), or the average treatment effect of REDD+ on forest revenues earned by households that participated in REDD+. Using DID, this is the change in forest revenue (F) between phases (t = 0 to t = 1) for a household (i) that participated in REDD+ (or was treated, T = 1) compared to the change in forest revenue for that same household if it had not participated in REDD+.
Where F1i represents the outcome for household i if it participates in the intervention and F0i the outcome for the same household if it does not participate. ATET is calculated for households that participated in REDD+, i.e., they were in the treatment group (T = 1). The t in the superscript indicates time period (0 before and 1 after).
Estimating ATET would be trivial if we could observe the same household simultaneously participating in REDD+ and not participating in REDD+. Since that is not possible, we cannot observe the second term on the right side of Equation (1). Thus, we need to identify a group that best represents the treatment group, but that does not participate in the treatment, as our control group. We can then compare the original treatment group to this control group to observe how they change over the same time period. In our case, the change in forest revenues among this control group provides the counterfactual of what would have happened to the treated group if REDD+ had not been implemented. For this to be valid, selection bias must be constant over time, such that the potential outcomes for the treated and control groups follow parallel trends. Mathematically, this assumption is represented by the following equation.
With this assumption, Equation (1) can be re-written as follows:
The DID method helps to avoid selection bias due to time-invariant non-observable variables. For instance, an organization may select communities for REDD+ based on relationships—or affinity—with local community leaders. Affinity is difficult to measure. However, our estimation method “differences it out.” Other such non-observable factors could include institutional agreements between and within communities, past interventions and familiarity with villages, and socio-economic or racial prejudice. Likewise, when individual households chose whether to participate in REDD+ interventions, they were probably influenced by unobservable factors such as their risk and time preferences. To the extent that these are time invariant, they are differenced out by DID estimation. Because some characteristics at baseline may lead to different future paths, however, we also seek to control for them by estimating DID in a matched sample of households with similar distributions of characteristics at baseline among treated and control households. This makes the assumption of parallel trends more plausible.
We use single nearest neighbor matching with replacement based on the propensity score. This method employs an algorithm to match each household in the treatment group to the household in the control group with the closest propensity score. It selects only the best match for each treated unit. A given household in the control group can be reused, so one control household could be matched with multiple households in the treated group, thus allowing the best match for each treated household (Caliendo and Kopeinig, 2008; Austin, 2011).
Nearest neighbor propensity score matching builds a robust control group that is statistically similar to the treated group, allowing the ATET to be estimated as follows:
where X refers to observed characteristics measured at baseline that we expect to be related both to participation and to forest revenue (Heckman et al., 1997), based on economic theory, previous research findings, and specific knowledge about the institutional setting in the study areas. As explained below, we use a subset of the variable to compute the propensity score, but we test for balance on all of them.
Because there are many characteristics that could confound the relationship between participation and forest revenue, we adopt the propensity score method of summarizing them in an estimated likelihood of participation. The likelihood to participate in the treatment is computed for all treated and control households from a logit model estimated with phase 1 data. We implement matching using the “psmatch2” routine in STATA 13.
Summarizing the process, we first identified potential confounders and used those to estimate models of the probability of household participation in the REDD+ projects in Ucayali and Madre de Dios. Second, using the estimated coefficients, we computed the propensity score (probability of participation) for each household. Third, we matched each household in the treated group to their counterpart in the control group with the closest propensity score. Matched households from the control group were returned to the selection pool, so they could be matched with multiple treated households. In the end, only a subset from the control group was paired.
To assess whether that sub-group is a reasonable counterfactual for the treated group, we compare their propensity score distributions and compute standardized differences in means (SDM)4 for all candidate variables for the propensity score specification. We consider variables with SDM <0.10, in absolute value, to be balanced (Austin, 2011). We tried several different specifications of the propensity score model, including different sub-sets of the potential confounders as well as artificial variables5 until we found the best balance on all of the potential confounders.
Because the best balance was still not perfect, we also estimated the effect of REDD+ in the matched sample while adjusting for differences in covariates (using the STATA package for regression adjustment). As a second robustness check, we also implemented the Kernel matching method with Epanechnikov distribution and bandwidth of 0.06. The Kernel matching procedure also matches households from treatment and control groups based on the similarity of their propensity scores. In this case, each member of the control group is weighted based on its similarity to the intervention households, with larger weights given to control observations that are more similar.
Matching Variables
In both Ucayali and Madre de Dios, household demographics could potentially influence both participation and household revenues. We therefore considered as components of X, the age, years of education, years in village, and birthplace of the household head, as well as the number of household members, the number of adult equivalents,6 and years since the household formed. Another potential confounding factor is socio-economic status, which we proxied with a house condition index (a composite measure of the quality of the materials used to construct the home),7 utility index (a composite measure of household access to potable water, electricity and plumbing),8 asset value,9 total land, total annual revenue,10 annual farming revenue, annual forest revenue, and annual timber revenue. In both sites, many of these characteristics are balanced across households in the treated and control groups, reflecting the fact that we selected matched communities into our sample. However, we also found that some variables had substantially different means in the treatment and control groups, which we addressed with matching using the household survey data.
In Ucayali, several variables had a SDM >0.1. For example, “years since household formed” and the “utility index” both had higher means in the control group, indicating that these households were older and had better access to utility services. We estimated a logit model to obtain a propensity score (or probability of treatment) for each household in the treated and control groups using all the variables listed in Appendix 1. However, nearest neighbor matching based on the resulting propensity scores did not consistently improve balance across all of the variables. Therefore, we re-estimated the propensity score with a logit model including only “year of education,” “birthplace,” “asset value,” “house condition index,” “total land,” and “total annual farming revenue,” in addition to the two unbalanced variables noted above, and several artificial11 variables. Nearest neighbor matching with replacement based on this propensity score resulted in good overlap in the propensity score distributions (Figure 1) and SDMs <0.10 for all variables except timber revenue (Appendix 2). Thus, PSM effectively removed the systematic differences in pre-treatment variables by identifying a new matched control group of 53 households from the control villages, some of them matched to multiple households in the REDD+ intervention area.
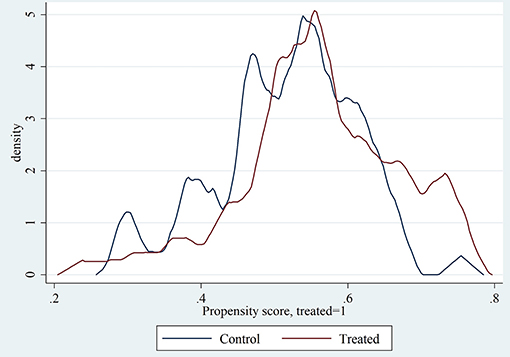
Figure 1. Propensity score distribution by treatment status—Ucayali site.
In Madre de Dios, we identified a few more characteristics that varied across households and could have confounded the relationship between participation in REDD+ and forest revenue (Appendix 3). First, distance to the nearest road (“distance to road”) and the number of homes owned outside of the village could have affected the decision to engage in REDD+ activities organized by the producer federation headquartered in the capital of the region, Puerto Maldonado. We also included gender of the household head, because a large portion (20% in treatment group) were female, which we considered likely to affect both participation and forest revenues.
As reported in Appendix 3, seven of these variables had SDM >0.10 in the full baseline dataset (102 households in control communities, and 109 in treatment communities), despite the fact that we had selected matched communities for the sample. Control households had systematically higher values for “distance to road,” “number of homes owned outside of the village,” “total land area,” “total annual revenue,” and “total annual farming revenue,” while treated households had higher values for “years in village” and likewise were more likely to have been born in their current village.
In parallel to our process for Ucayali, we first estimated a logit model with all of these variables but found that some variable remained imbalanced. We therefore narrowed down our specification to age, years of education, years living in village, born in village, household size, adult equivalent, years since household formed, asset value, house condition index, utility index, total land, and total farming revenue, along with higher order and interaction terms, in order to minimize the number of variables that remained imbalanced (Appendix 4). In the resulting matched sample (again with 53 households from the control communities), all variables are reasonably well-balanced except for “distance from home to nearest road” (SDM value of 0.20) and “number of homes” owned outside the village (SDM value 0.32). Despite the large SDM, the actual difference in the mean number of homes owned among treated (0.5 home units out of the village) and control (0.8 home units) households was actually quite small. However, several other variables had SDMs slightly above the critical value of 0.10 and the propensity score distributions had relatively poor overlap (Figure 2), suggesting that this sample is not as well-balanced as in Ucayali. Thus, regression adjustment is a particularly important robustness check in this site.
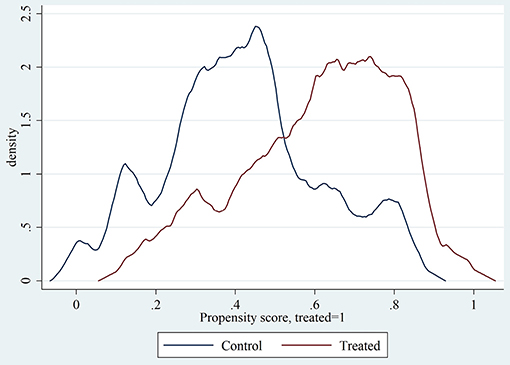
Figure 2. Propensity score distribution by treatment status—Madre de Dios site.
Results
Descriptive
Forest revenues declined in both the Ucayali and Madre de Dios sites. Figures 3, 4 show that although there were outliers in both sites and both phases, these do not explain the decline. Rather, the entire distribution of forest revenues shifted down. Without the additional information in control sites collected by GCS REDD+, this decline in the value of forest products harvested could have been blamed on REDD+. However, our data from households outside of the intervention areas clearly show that there was a general decline in forest revenues. This is due both to declining prices for Brazil nuts and timber in both sites, and declining fish catch in Ucayali—possibly due to floods in that region in 2014.
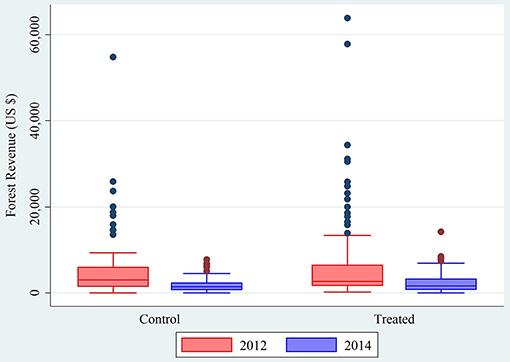
Figure 3. Box plot for forest revenue—Ucayali site.
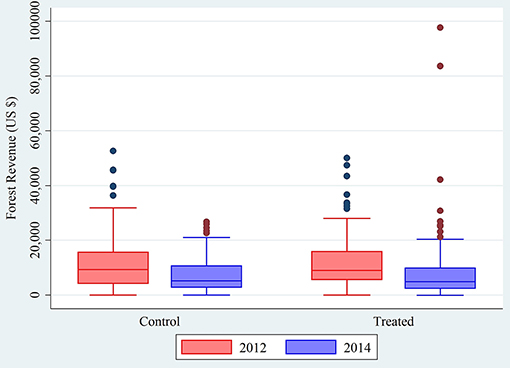
Figure 4. Box plot for forest revenue—Madre de Dios site.
In Appendix 5, we present village characteristics for both sites. In the native communities of Ucayali, basic characteristics such as access to infrastructure and participation in agriculture are similar on average between control and treated communities. There is a slight difference in average population in favor of control villages (554 people vs. 476 people) and in total land area in favor of treated villages (5,376 vs. 4,961 ha).
In contrast, in Madre de Dios site, the average total land area (Brazil nut concessions) is smaller in control villages (41,988 ha) than treated ones (72,525 ha). The same happens with average population (53 people in control vs. 94 people in treated), price per hectare of good quality agricultural land (US$ 1,153 in control vs. US$ 889 in treated), and access to secondary school (0 out of 4 control communities vs. 3 out of 4 treated communities). However, control and treated villages have similar average years of village existence, distance to closest market by most common means of transport (km), main staple food and crop with highest production value per household on average.
DID
Figures 5, 6 plot average forest revenues of households in the REDD+ intervention areas (in red) compared to control households (in blue). If the households in the control communities had followed the same trend as in the intervention communities, their incomes would have been higher in Madre de Dios and slightly lower in Ucayali (shown in green). However, neither of these DID estimates of impacts are significantly different from zero, suggesting that the REDD+ interventions actually had no impact on forest revenues.12
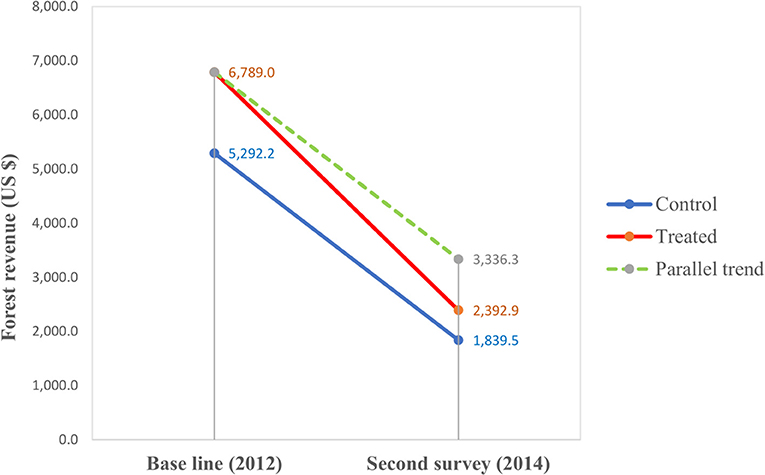
Figure 5. Change in annual forest revenue Ucayali site.
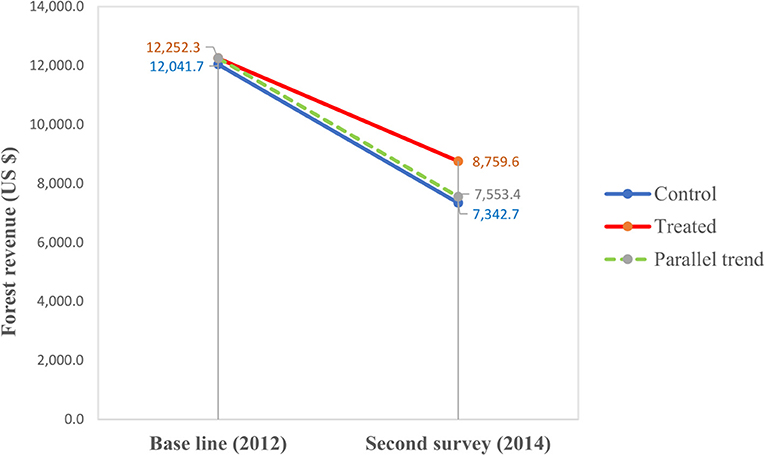
Figure 6. Change in annual forest revenue Madre de Dios site.
In Ucayali, during the 2012–13 baseline survey, the average forest revenue per households in control communities was US$ 5,292 while in the intervention communities it was US$ 6,789. In the 2014 survey, the average revenues in both sets of villages dropped. That year, the average revenue in control villages was US$ 1,839 and in intervention villages, it was US$ 2,392. Thus, at baseline, the value of forest products harvested by intervention households was on average US$ 1,496 than for control households. In the second survey, both averages were lower and, although the treated group's average (US$ 553) was still higher than the control group, the difference between them was smaller. The difference in averages between the control and treatment group before and after the intervention shows that the forest revenues in participating communities declined more than control group (by US$ 943). However, forest revenues were so variable that this difference was not statistically significant (P-value 0.46). These results are presented in Figure 5.
In Madre de Dios, during the 2011–12 baseline survey, the average forest revenue among the control communities was US$ 12,041 while in the intervention communities it was slightly higher (US$ 12,252). In the 2014 survey, as happened in Ucayali, the average revenues in both sets of villages dropped to US$ 7,342 in control and US$ 8,759 in intervention communities. Thus, in the second survey, average forest revenue had declined for both groups, but the not as much for treated households, whose average revenues were US$ 1,416 higher than the control group's average revenues. In this case, the point estimate suggests a positive impact of REDD+, but again, revenues are so variable that this difference is not statistically significant (P = 0.47). These results are presented in Figure 6.
DID With Matching
The DID estimates of ATET in the matched samples are reported in Appendix 6 for Ucayali and Madre de Dios. They confirm that the projects had no statistically significant effect on forest revenues.
The point estimate of the ATET of the Ucayali REDD+ project was negative, US$ −1,209 but not statistically significant (P = 0.29). Thus, although forest revenues clearly declined substantially, this was neither caused nor mitigated by AIDER's REDD+ project. This is confirmed by both post-matching regression adjustment, and by kernel matching: the ATET for the project remains negative and statistically insignificant.
In Madre de Dios, the point estimate of the ATET of BAM's REDD+ project is positive (US$ 61.1), but once again, not statistically significant (P = 0.96). This reflects the fact that forest revenues decline less in the REDD+ intervention area than in control areas. However, the confidence intervals around these estimates are huge, meaning that the ATET is not statistically different from zero. Again, these results are robust to regression adjustment and to a different matching method: the ATET for the project remains positive and statistically insignificant. Thus, neither REDD+ project affected forest revenues, even though that was clearly the goal of many of their interventions.
Discussion
Our survey data show that there was a sharp decline in forest revenue between 2012 and 2014 in two sites in the Peruvian Amazon where REDD+ was implemented. In these two regions, households harvest multiple forest products, with the greatest value generated by timber in Ucayali and Brazil nuts in Madre de Dios. Despite this diversification across timber and non-timber products, revenues consistently fell during the time period of our study. This was also true of other sources of revenue and of total household income. In Madre de Dios, the average price of Brazil nuts fell by 19% between the two periods. In both regions, the average quantity of fish harvested fell around 50% between the phases. In both sites, revenues from sawn timber also declined, possibly due to increased monitoring and enforcement actions by OSINFOR (the Peruvian Agency for the Supervision for Forest Resources and Wild Fauna). This demonstrates the importance of collecting data on households in comparison villages, to know what can—and what cannot—be attributed to REDD+.
Our findings demonstrate that these two REDD+ projects in the Peruvian Amazon did not undermine livelihoods by their efforts to protect forest. This could be because the effects of new restrictions were offset by the effects of new opportunities offered by the projects. Thus, they effectively complied with requirements to safeguard local livelihoods, but they did not live up to expectations that REDD+ will generate co-benefits for sustainable development. Both projects planned but had not yet begun sharing revenues from carbon credits with households in their intervention areas. Absent revenue sharing, they could only support local livelihoods by helping to increase forest revenues. Our results show that they did not accomplish this in their first 3 years. This finding is robust to sample and methods of analysis.
While this finding demonstrates that the projects “did no harm” to the forest-based livelihoods of local people in the two sites, their objective was actually to increase forest revenues. One possible reason that there are no measurable effects is the heterogeneity of implementation and participation across communities and households. This suggests that the effects are also heterogeneous and that the average effects therefore may be difficult to distinguish from zero. A second source of attenuation could be that both AIDER and BAM designed their REDD+ projects to continue and build on previous activities in the two regions. These previous activities may have extended across both treatment and control communities, who thus both experienced the benefits, resulting in no statistical difference in their trends in forest revenues.
The most obvious explanation for our findings is that not enough time had passed for new forest revenue flows to become established. Both projects invested in establishing the conditions—e.g., by assisting with legal documents and establishing plantations—for local people to earn increased forest revenues. The impacts of these types of investments on household revenues may not be observed for years, in contrast to revenue sharing via direct payments, which could immediately increase household income. Neither site proponent had made direct conditional payments at the time of our surveys. That revenue sharing was delayed either because carbon credits had not been sold (by AIDER) or because carbon revenues were used to cover other start-up costs of the project (by BAM) to come into compliance with international standards for carbon credits that require legal compliance, secure land tenure, and a Measurement, Reporting, and Verification (MRV) system. Our finding of no negative effect on forest revenues suggests that when the projects do start sharing carbon revenues, they will have a positive impact on household incomes.
Conclusions
Through careful selection of communities into the samples, followed by propensity score matching based on household survey data, we were able to identify two similar groups of households that participated in the REDD+ project and counterpart households that did not participate. In both groups, forest revenue sharply declined between 2012 and 2014. However, DID estimates of ATET, including with regression adjustment to account for remaining imbalance in the matched samples, clearly show this was not attributable to REDD+. That is, despite the observed decline in forest revenues in their intervention areas, the REDD+ projects themselves were not responsible for undermining forest livelihoods. However, they also had not yet effectively mitigated that decline in revenues, nor started providing new revenues from benefit sharing of carbon revenues. Monitoring the impacts of these projects should be an ongoing process. This initial assessment may have been too soon to observe significant change as a result of these interventions. However, we did find that these REDD+ projects “did no harm” to local people, at least in terms of forest revenues in this early phase. This work illustrates the value of quasi-experimental study design and careful impact evaluation for monitoring safeguards and tracking the effects of REDD+ implementation.
Data Availability Statement
The datasets presented in this study can be found in online repositories. The names of the repository/repositories and accession number(s) can be found at: data.cifor.org/dataverse/gcs.
Ethics Statement
The studies involving human participants were reviewed and approved by an institutional ethics review at CIFOR. The household participants and village leaders provided verbal consent to participate in this study.
Author Contributions
DS implemented the quasi-experimental methods for impact estimates. All authors contributed equally to the writing of the article.
Funding
This research was part of CIFOR's Global Comparative Study on REDD+ (www.cifor.org/gcs). The funding partners that have supported this research include the Norwegian Agency for Development Cooperation (Norad; QZA-10/0468, QZA-12/0882, QZA-16/0110), the Australian Department of Foreign Affairs and Trade (DFAT; 46167, 63560), the European Commission (EC; DCI-ENV/2011/269-520), the International Climate Initiative (IKI) of the German Federal Ministry for the Environment, Nature Conservation, Building and Nuclear Safety (BMUB; KI II 7 – 42206-6/75), the United Kingdom Department for International Development (UKAID; TF069018), and the CGIAR Research Program on Forests, Trees and Agroforestry (CRP-FTA), with financial support from the donors contributing to the CGIAR Fund.
Conflict of Interest
The authors declare that the research was conducted in the absence of any commercial or financial relationships that could be construed as a potential conflict of interest.
Acknowledgments
We thank the communities in Madre de Dios and Ucayali who participated in this research, as well as the CIFOR field teams for their careful data collection efforts, including Valerie Garrish and Emilio Perales who supervised the first two phases of fieldwork. We also appreciate Bosques Amazónicos (BAM) and Asociación para la Investigación y Desarrollo Integral (AIDER) for their collaboration with GCS REDD+. A special thank you to Mella Komalasari for support with this manuscript.
Supplementary Material
The Supplementary Material for this article can be found online at: https://www.frontiersin.org/articles/10.3389/ffgc.2021.624724/full#supplementary-material
Footnotes
1. ^More information on https://www2.cifor.org/gcs/.
2. ^Of the 43 households; five households in the intervention and 13 in the control communities had moved away, and four households had dissolved in the control communities, leaving 12 control and nine intervention households that could not be re-interviewed for unknown reasons.
3. ^Household attrition from the sample between phase 1 to phase 2 included 14 households from the control communities and 12 from the intervention communities who had moved away; three from control and one from intervention that dissolved; and three from control who were unable to participate (e.g., because household members had died).
4. ^SDM is robust to sample variation and is not subject to an assumed parametric functional form, thereby providing a consistent comparison between treated and control groups.
5. ^These are quadratic or cubic forms or interactions between variables.
6. ^We use the OECD adult equivalent formula of AE = 1 + 0.7(Number of adults – 1) + 0.5*Number of Children. It has the following equivalence: first adult = 1, further adults = 0.7, all members <16 years = 0.5.
7. ^This aggregate index for house condition includes type of roof, walls and floors. Each type is valued from 1 (poor), 2 (medium), and 3 (high), this gives an index with minimum value of 3 (low) and maximum value 9 (high).
8. ^Utility index represents household access to utilities (water, toilet, and electricity), including variables with the following levels: water (stream, river, pond, common faucet or well = low, own well or reservoir = medium and piped water = high); toilet (no latrine or shared latrine = low, own latrine = medium, own flush toilet with piped water = high); electricity (no electricity = low, through unpaid connection to grid or village system = medium, and through paid connection to grid or own generator = high). The relative value are 1 = low, 2 = medium, and 3 = high. This gives an index with minimum value 3 (low) and maximum value 9 (high).
9. ^Value of all assets owned by the household.
10. ^Total household income from all activities.
11. ^Artificial variables included years of education power to two, years of education power to three, and interaction between birthplace and years of education.
12. ^We replicated the same estimations using nominal prices and we confirmed that the decline occurred in nominal as well as real prices, i.e., it is not an artifact of our procedures for normalizing all prices to 2014.
References
Althelia Funds (2019). Althelia Fund Impact Report 2019: Aligning Economy With Ecology. Available online at: https://ecosphere.plus/wp-content/uploads/2020/10/ALTHELIA_ACF1Report_2019_WEB-1.pdf
Angelsen, A., Brockhaus, M., Sunderlin, W. D., and Verchot, L. V. (2012). Analysing REDD+: Challenges and Choices. Bogor: CIFOR.
Austin, P. (2011). An introduction to propensity score methods for reducing the effects of confounding in observational studies. Multivariate Behav. Res. 46, 399–424. doi: 10.1080/00273171.2011.568786
Beymer-Farris, B. A., and Bassett, T. J. (2012). The REDD menace: resurgent protectionism in Tanzania's mangrove forests. Global Environ. Change 22, 332–341. doi: 10.1016/j.gloenvcha.2011.11.006
Brown, D., Seymour, F., and Peskett, L. (2008). “How do we achieve REDD co-benefits and avoid doing harm?” in Moving Ahead With REDD: Issues, Options and Implications, ed A. Angelsen [Bogor: Center for International Forestry Research (CIFOR)], 107–118.
Caliendo, M., and Kopeinig, S. (2008).Some practical guidance for the implementation of propensity score matching. J. Econ. Surv. 22, 31–72. doi: 10.1111/j.1467-6419.2007.00527.x
Caplow, S., Jagger, P., Lawlor, K., and Sills, E. (2011). Evaluating land use and livelihood impacts of early forest carbon projects: Lessons for learning about REDD+. Environ. Sci. Policy 14, 152–167. doi: 10.1016/j.envsci.2010.10.003
Duchelle, A. E., de Sassi, C., Jagger, P., Cromberg, M., Larson, A. M., Sunderlin, W. D., et al. (2017). Balancing carrots and sticks in REDD+: Implications for social safeguards. Ecol. Soc. 22:2. doi: 10.5751/ES-09334-220302
Duchelle, A. E., de Sassi, C., Sills, E. O., and Wunder, S. (2018a). People and communities: Well-being impacts of REDD+ on the ground,” in Transforming REDD+: Lessons and New Directions, eds A. Angelsen, C. Martius, V. De Sy, A. E. Duchelle, A. M. Larson, and T. T. Pham (Bogor: CIFOR), 131–141.
Duchelle, A. E., Simonet, G., Sunderlin, W. D., and Wunder, S. (2018b). What is REDD+ achieving on the ground? Curr. Opin. Environ. Sustain. 32, 134–140. doi: 10.1016/j.cosust.2018.07.001
Fairhead, J., Leach, M., and Scoones, I. (2012). Green grabbing: a new appropriation of nature? J. Peasant Stud. 39, 237–261. doi: 10.1080/03066150.2012.671770
Garrish, V., Perales, E., Duchelle, A. E., and Cronkleton, P. (2014). “The REDD project in Brazil nut concessions in Madre de Dios,” in REDD+ on the Ground: A Case Book of Subnational Initiatives Across the Globe, eds E. O. Sills, S. S. Atmadja, C. de Sassi, A. E. Duchelle, D. L. Kweka, I. A. P. Resosudarmo, et al. (Bogor: CIFOR), 147–166. Available online at: https://www2.cifor.org/redd-case-book/case-reports/peru/redd-project-brazil-nut-concessions-madre-de-dios-peru/
Heckman, J., Ichimura, H., and Todd, P. (1997). Matching as an econometric evaluation estimator: evidence from evaluating a job training programme. Rev. Econ. Stud. 64, 605–654. doi: 10.2307/2971733
Khatri, D. B., Marquardt, K., Pain, A., and Ojha, H. (2018). Shifting regimes of management and uses of forests: what might REDD+ implementation mean for community forestry? Evidence from Nepal. Forest Policy Econ. 92, 1–10. doi: 10.1016/j.forpol.2018.03.005
Luttrell, C., and Betteridge, B. (2017). Lessons for multi-level REDD+ benefit-sharing from revenue distribution in extractive resource sectors (oil, gas and mining). Occasional Paper 166 (Bogor: CIFOR).
Petkova, E., Larson, A., Contreras-Hermosilla,1, A., and Toni, F. (2010). Governance, Forest and REDD+ in Latin America. Info Brief N° 28. CIFOR, Bogor. doi: 10.3390/f1040250
Rodriguez-Ward, D., and Paredes de Aguilar, P. (2014). “The valuation of environmental services in the managed forests of seven indigenous communities in Ucayali, Peru,” in REDD+ on the Ground: A Case Book of Subnational Initiatives Across the Globe, eds E. O. Sills, S. S. Atmadja, C. de Sassi, A. E. Duchelle, D. L. Kweka, I. A. P. Resosudarmo, et al. (Bogor: CIFOR), 166–184. Available online at: https://www2.cifor.org/redd-case-book/case-reports/peru/valuation-environmental-services-managed-forests-seven-indigenous-communities-ucayali-peru/
Rosenbaum, P. R., and Rubin, D. B. (1983). The central role of the propensity score in observational studies for causal effects. Biometrika. 70, 41–55. doi: 10.1093/biomet/70.1.41
Sills, E. O., Atmadja, S. S., de Sassi, C., Duchelle, A. E., Kweka, D. L., Resosudarmo, I. A. P., et al. (2014). REDD+ on the Ground: A Case Book of Subnational Initiatives Across the Globe. Bogor: CIFOR.
Sills, E. O., de Sassi, C., Jagger, P., Lawlor, K., Miteva, D. A., Pattanayak, S. K., et al. (2017). Building the evidence base for REDD+: study design and methods for evaluating the impacts of conservation interventions on local well-being. Global Environ. Change 43, 148–160. doi: 10.1016/j.gloenvcha.2017.02.002
Sunderlin, W. D., De Sassi, C., Ekaputri, A. D., Light, M., and Pratama, C. D. (2017). REDD+ contribution to well-being and income is marginal: the perspective of local stakeholders. Forests 8:125. doi: 10.3390/f8040125
Keywords: REDD+, Peruvian Amazon, quasi-experimental impact evaluation, Brazil nut, sustainable forest management, carbon payments, difference-in-differences, average treatment effect on the treated
Citation: Solis D, Cronkleton P, Sills EO, Rodriguez-Ward D and Duchelle AE (2021) Evaluating the Impact of REDD+ Interventions on Household Forest Revenue in Peru. Front. For. Glob. Change 4:624724. doi: 10.3389/ffgc.2021.624724
Received: 10 December 2020; Accepted: 22 February 2021;
Published: 25 March 2021.
Edited by:
Alejandro Lopez-Feldman, Centro de Investigación y Docencia Económicas, MexicoReviewed by:
Juan Jose Miranda, World Bank Group, United StatesDil Khatri, Southasia Institute of Advanced Studies, Nepal
Copyright © 2021 Solis, Cronkleton, Sills, Rodriguez-Ward and Duchelle. This is an open-access article distributed under the terms of the Creative Commons Attribution License (CC BY). The use, distribution or reproduction in other forums is permitted, provided the original author(s) and the copyright owner(s) are credited and that the original publication in this journal is cited, in accordance with accepted academic practice. No use, distribution or reproduction is permitted which does not comply with these terms.
*Correspondence: David Solis, ZGF2aWQuc29saXNAdWRlcC5lZHUucGU=