 Nagai Shin
 Yasuyuki Maruya
 Taku M. Saitoh
 Narumasa Tsutsumida
- 1Earth Surface System Research Center, Research Institute for Global Change, Japan Agency for Marine-Earth Science and Technology, Yokohama, Japan
- 2River Basin Research Center, Gifu University, Gifu, Japan
- 3Graduate School of Engineering, Kyushu University, Fukuoka, Japan
- 4Graduate School of Science and Engineering, Saitama University, Saitama, Japan
Can social sensing detect the spatio-temporal variability of autumn phenology? We analyzed data published on the Twitter social media website through the text mining of non-geotagged tweets regarding a forested, mountainous region in Japan. We were able to map the spatial characteristic of tweets regarding peak leaf coloring along an altitudinal gradient and found that text mining of tweets is a useful approach to the in situ collection of autumn phenology information at multiple locations over a broad spatial scale. Potential uncertainties in this approach were examined and compared to other online research sources and methods, including Google Trends and information on widely available websites and live camera images. Finally, we suggest ways to reduce the uncertainties identified within our approach and to create better integration between text mining of tweets and other online research data sources and methods.
Introduction
Can the spatio-temporal variability of autumn phenology—specifically, leaf coloring and leaf fall—be detected by “social sensing” through analysis of data published on social media such as Twitter? Accurate in situ observation of spatio-temporal variability of autumn phenology at multiple locations over a broad spatial scale is an important but challenging task. Compared with spring phenology, observational accuracy in autumn phenology lacks sufficient understanding and development (Gallinat et al., 2015; Xie et al., 2018b). The lower accuracy for autumn phenology may be caused by either or both of two reasons. First, each tree species shows different patterns and timing of leaf coloring and leaf fall (Klosterman et al., 2018; Xie et al., 2018a, b). Second, the triggering of leaf-coloring and leaf-fall (also known as leaf senescence) is affected by numerous factors such as air temperature, photoperiod, precipitation, solar radiation, and leaf longevity (Park et al., 2017; Xie et al., 2018a, b). Solving this problem for deciduous forests, however, is instrumental to achieving accurate evaluation of the spatio-temporal variability of ecosystem functions and services and to establishing relationships between animal and plant phenology on the one hand and biodiversity on the other hand, and will contribute to the important social task of collecting evidence on the sensitivity of autumn phenology to climate change (Xie et al., 2018a). However, we take a necessary step toward the accurate detection of autumn phenology at multiple points over a broad spatial scale.
Until now, the spatio-temporal variability of leaf coloring and leaf fall have been detected through the following means: visual inspection of subject trees (Klosterman and Richardson, 2017; Park et al., 2017; Klosterman et al., 2018; Xie et al., 2018b; Tao et al., 2019), fixed-point observations by time-lapse digital cameras (Liu et al., 2018; Nagai et al., 2018; Richardson et al., 2018; Xie et al., 2018a), repeated observation by drones (Klosterman and Richardson, 2017; Klosterman et al., 2018), analysis of vegetation indexes obtained by satellite observation (Garonna et al., 2014; Nagai et al., 2015; Zhao et al., 2015; Klosterman et al., 2018), and analysis of phenology information published on the internet (Nagai et al., 2020). Of these means, phenology observations by visual inspection, digital cameras, and drones excel at detailed information, but can only cover a limited number of locations. In contrast, satellite observations excel at information collected over a broad spatial scale, but are subject to uncertainties caused by the spatial, temporal, and spectral resolution of sensors, and by the noise generated by cloud contamination and atmospheric conditions (Nagai et al., 2020). At present, satellite sensors frequently fail to produce simultaneous observations of individual trees at fine scale. Compared with visual inspection, digital cameras, and drones, internet-based methods can make use of websites to obtain phenology information, but the available locations are mainly limited to famous tourist areas.
In contrast, the data posted to social media by ordinary citizens may enable the detection of phenology information in real time at multiple points over a broad spatial scale. In fact, despite the coarse spatial resolution of the data, such as at a local jurisdiction or national scale, Google Trends has been used to show the seasonality of plant and animal phenology regarding fireflies and beetles in Japan (Takada, 2012), mosquitoes and pollen in multiple countries (Proulx et al., 2013), and pollen in the US (Hall et al., 2020). Google Trends is a website that enables users to gauge public interest via an analysis of search terms on Google. For Twitter, the spatio-temporal variability of tweets regarding “winged ant emergence,” “autumnal house spider,” and “starling murmurations” in the US has been shown to correspond with in situ observations (Hart et al., 2018). Also, phenology information observed by the Japanese Meteorological Agency has been used to illustrate the correspondence between the spatio-temporal variability of geotagged tweets and in situ observations (Endo et al., 2014, 2017).
Here, we examine the usability of tweets regarding leaf coloring in a mountainous region in central Japan, where the elevation difference is notable for its narrow range. Detection of leaf coloring information for multiple points along the altitudinal gradient is useful for the development of accurate evaluations of the spatio-temporal variability of leaf coloring. In order to identify conclusive evidence of the robustness of the text mining of tweets for obtaining information on leaf coloring phenology, we chose the more difficult case of studying a less populated area. We assumed that there are few geotagged tweets (i.e., most tweets lack latitude and longitude information) and therefore used morpheme analysis to extract place names from the body text of tweets. The aim of the study is to clarify the possibilities for the text mining of tweets regarding leaf coloring as well as its uncertainties and limitations.
Materials and Methods
We collected tweets that included the Japanese word for leaf coloring (紅葉) in Gifu Prefecture, Japan (Figure 1). Gifu extends about 150 km from north to south and about 120 km from east to west, and elevations there range from 0 to 3,190 m a.s.l. (Unless stated otherwise, Gifu in this paper refers to Gifu Prefecture and not to Gifu City, a major city within the prefecture.) Our target period was from 16 October 2019 to 30 November 2019, the period during which leaf coloring occurs in Gifu. We used the Linux curl command issued through a web API to download 6,207 tweets formatted for JSON (JavaScript Object Notation; Introducing JSON, 2021). All data was purchased using the nazuki Twitter data provision service from NTT Data (NTT Data, 2021). Because no tweets were geotagged with latitude and longitude information, we used the two methods described below to extract place names associated with peak leaf coloring from the body text of the tweets. All analyses were conducted in R version 3.6.2 (The R Foundation, 2021).
• Method 1: Manual reading of the body text of tweets: First, we changed the time zone of each tweet from UTC to Japanese local time (UTC + 0900). Second, we divided 6,207 tweets into 5-day bins. Third, we removed the text and graphics from the body of the tweets, excluding overlapping tweets and unofficial re-tweets. Fourth, for each 5-day bin, we extracted tweets that contain Japanese terms that mean peak time (見頃, 見ごろ, and ピーク; Yamamoto et al., 2015; Ishida, 2018). The number of tweets for each 5-day bin ranged from 7 to 42 (Table 1). Finally, we extracted the place names associated with peak leaf coloring by manually reading each tweet. Our reasoning for using manual reading is that we assumed that automatic detection of place names from the body text of tweets would be difficult because the morphemes of Japanese place names can be resolved into the following patterns: proper noun–common noun, proper noun–proper noun, common noun–proper noun, and common noun–common noun.
• Method 2: Manual reading of bigram network graphs: First, we extracted nouns, adjectives, and verbs by dividing each tweet described above in method 1 into morphemes. For this analysis, we used the MeCab software package for analysis of Japanese morphemes (MeCab: Yet Another Part-of-Speech and Morphological Analyzer, 2021) and the RMeCab library to provide an interface between MeCab and R. Second, we generated bigrams that show the connections between nouns, adjectives, and verbs and visualized the bigrams by using a network graph (Figure 2) for bigrams having a frequency of 2 or more (Yamamoto et al., 2015; Ishida, 2018). Finally, we extracted the place names by manually reading each bigram network graph.
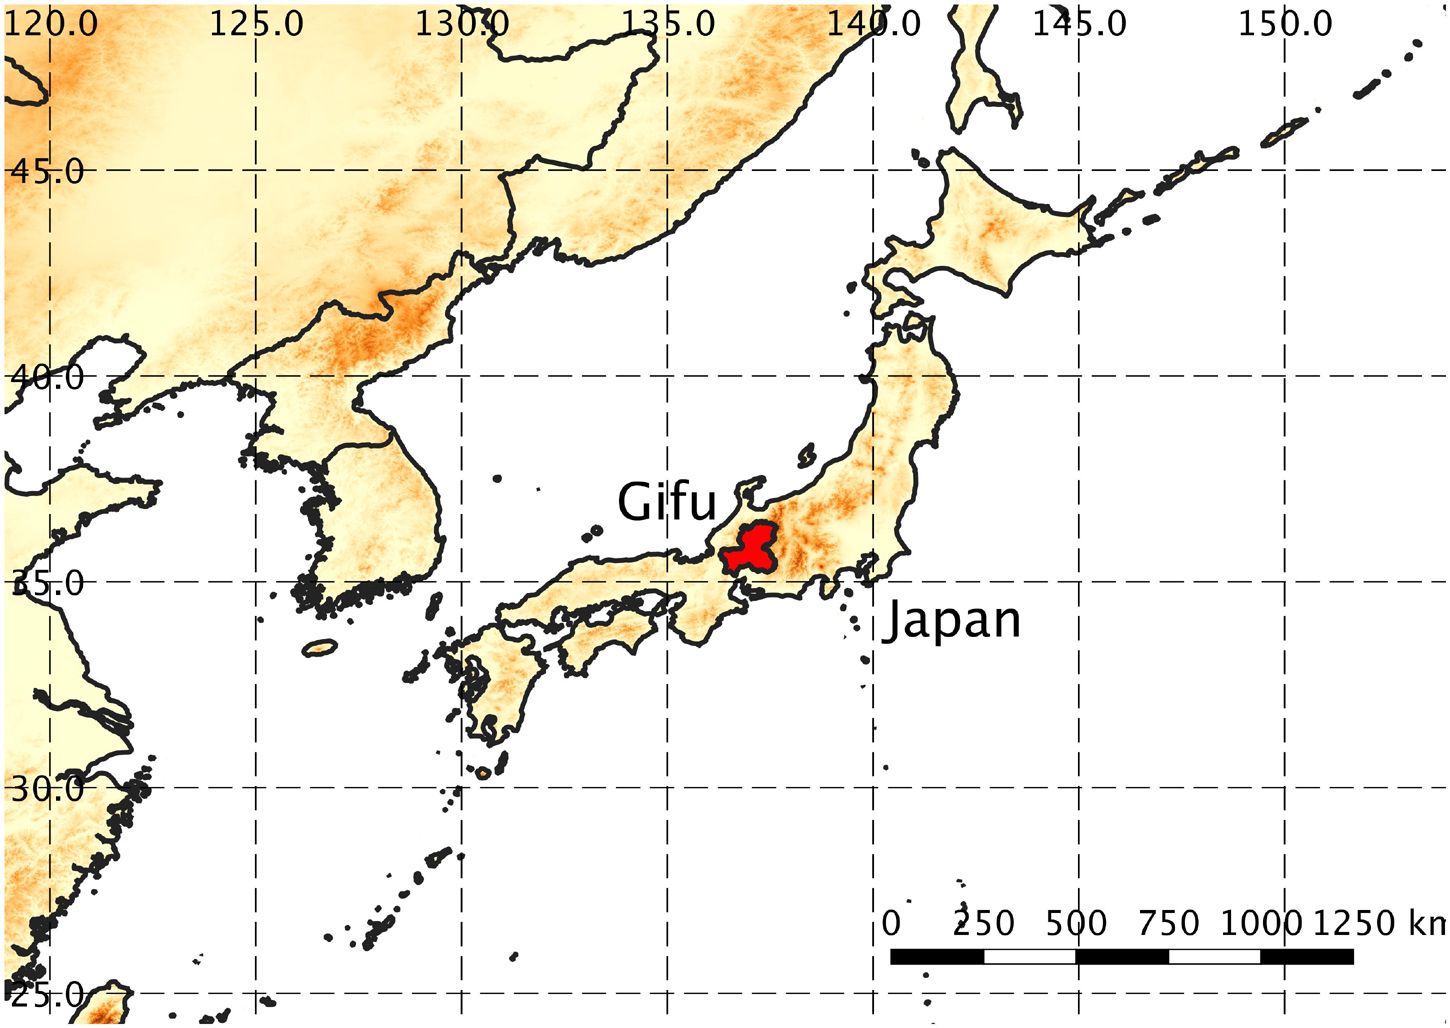
Figure 1. Target area of this study. Elevation is indicated in black scale (from 0 to 3,000 m a.s.l.). Elevations come from the GTOPO30 digital elevation model (USGS, 2021). Quantitative land and territory information for the country of Japan (administrative district data) comes from the Ministry of Land, Infrastructure, Transport and Tourism of Japan (2020). Boundary data comes from the “1:10 m cultural vectors” published by Natural Earth (Natural Earth, 2021).
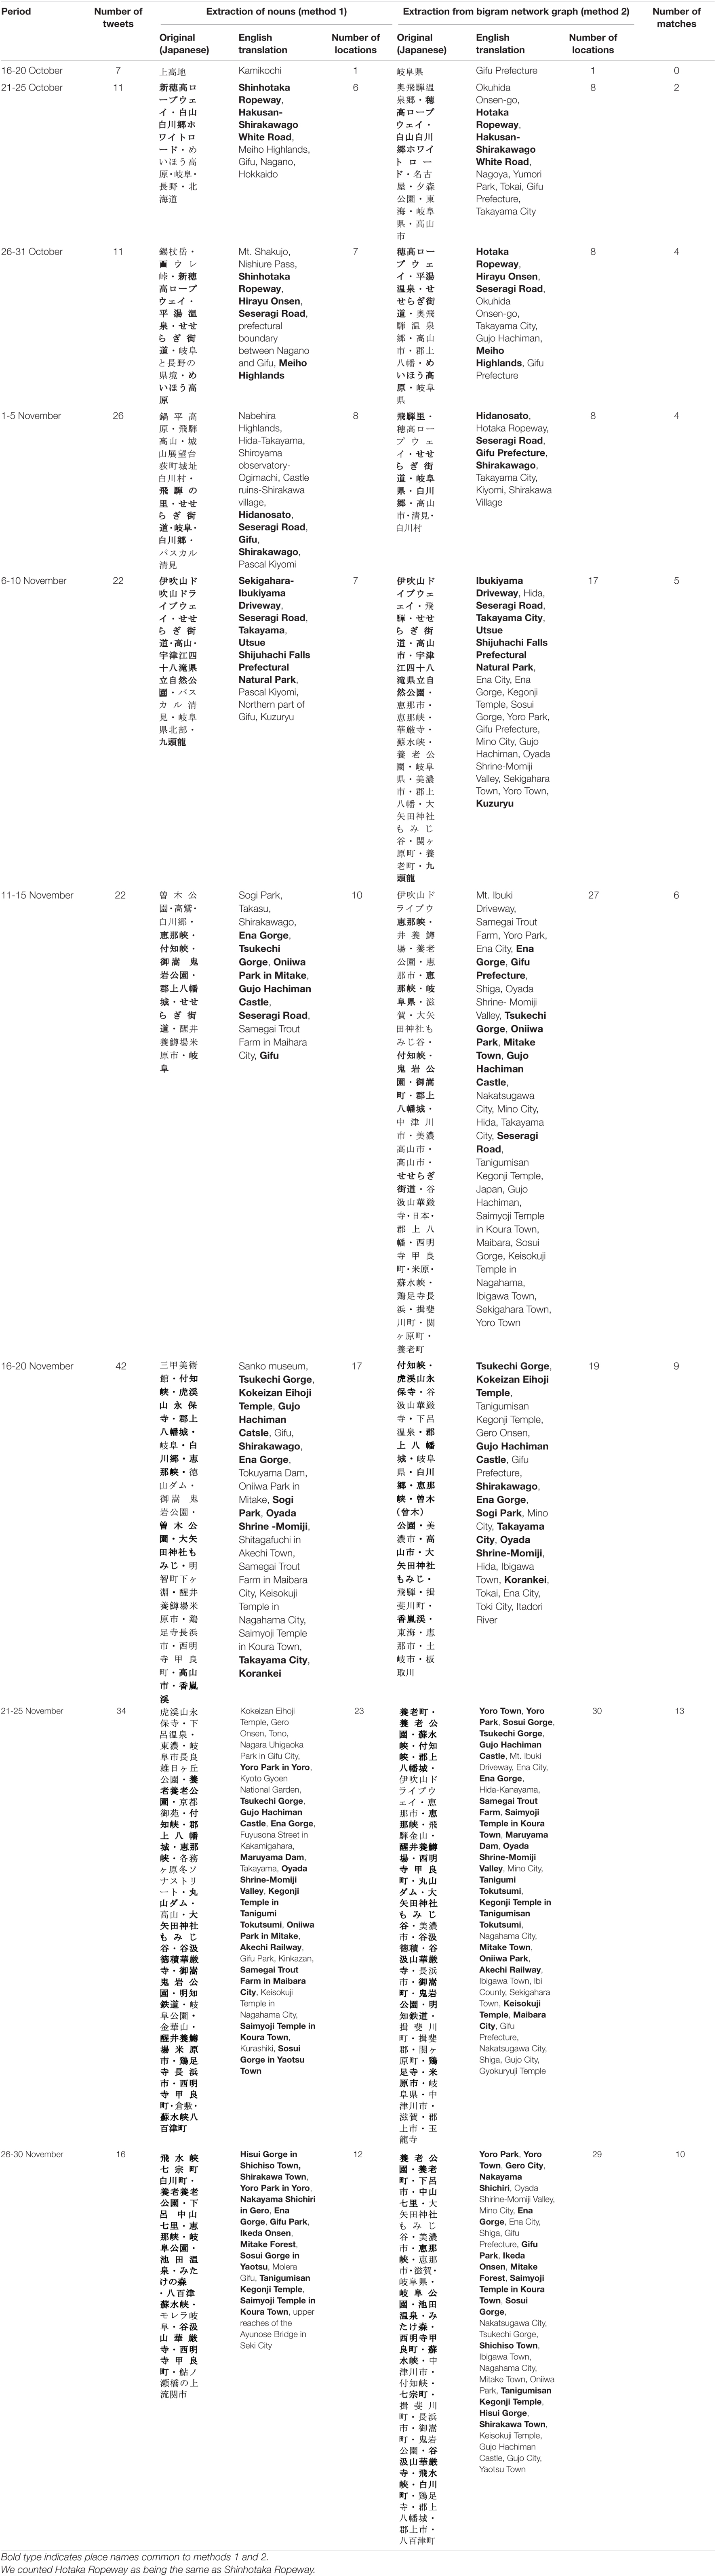
Table 1. Place names detected by manual reading of morphemes (nouns; method 1) and bigram network graphs (nouns, adjectives, and verbs; method 2) for each 5-day bin.
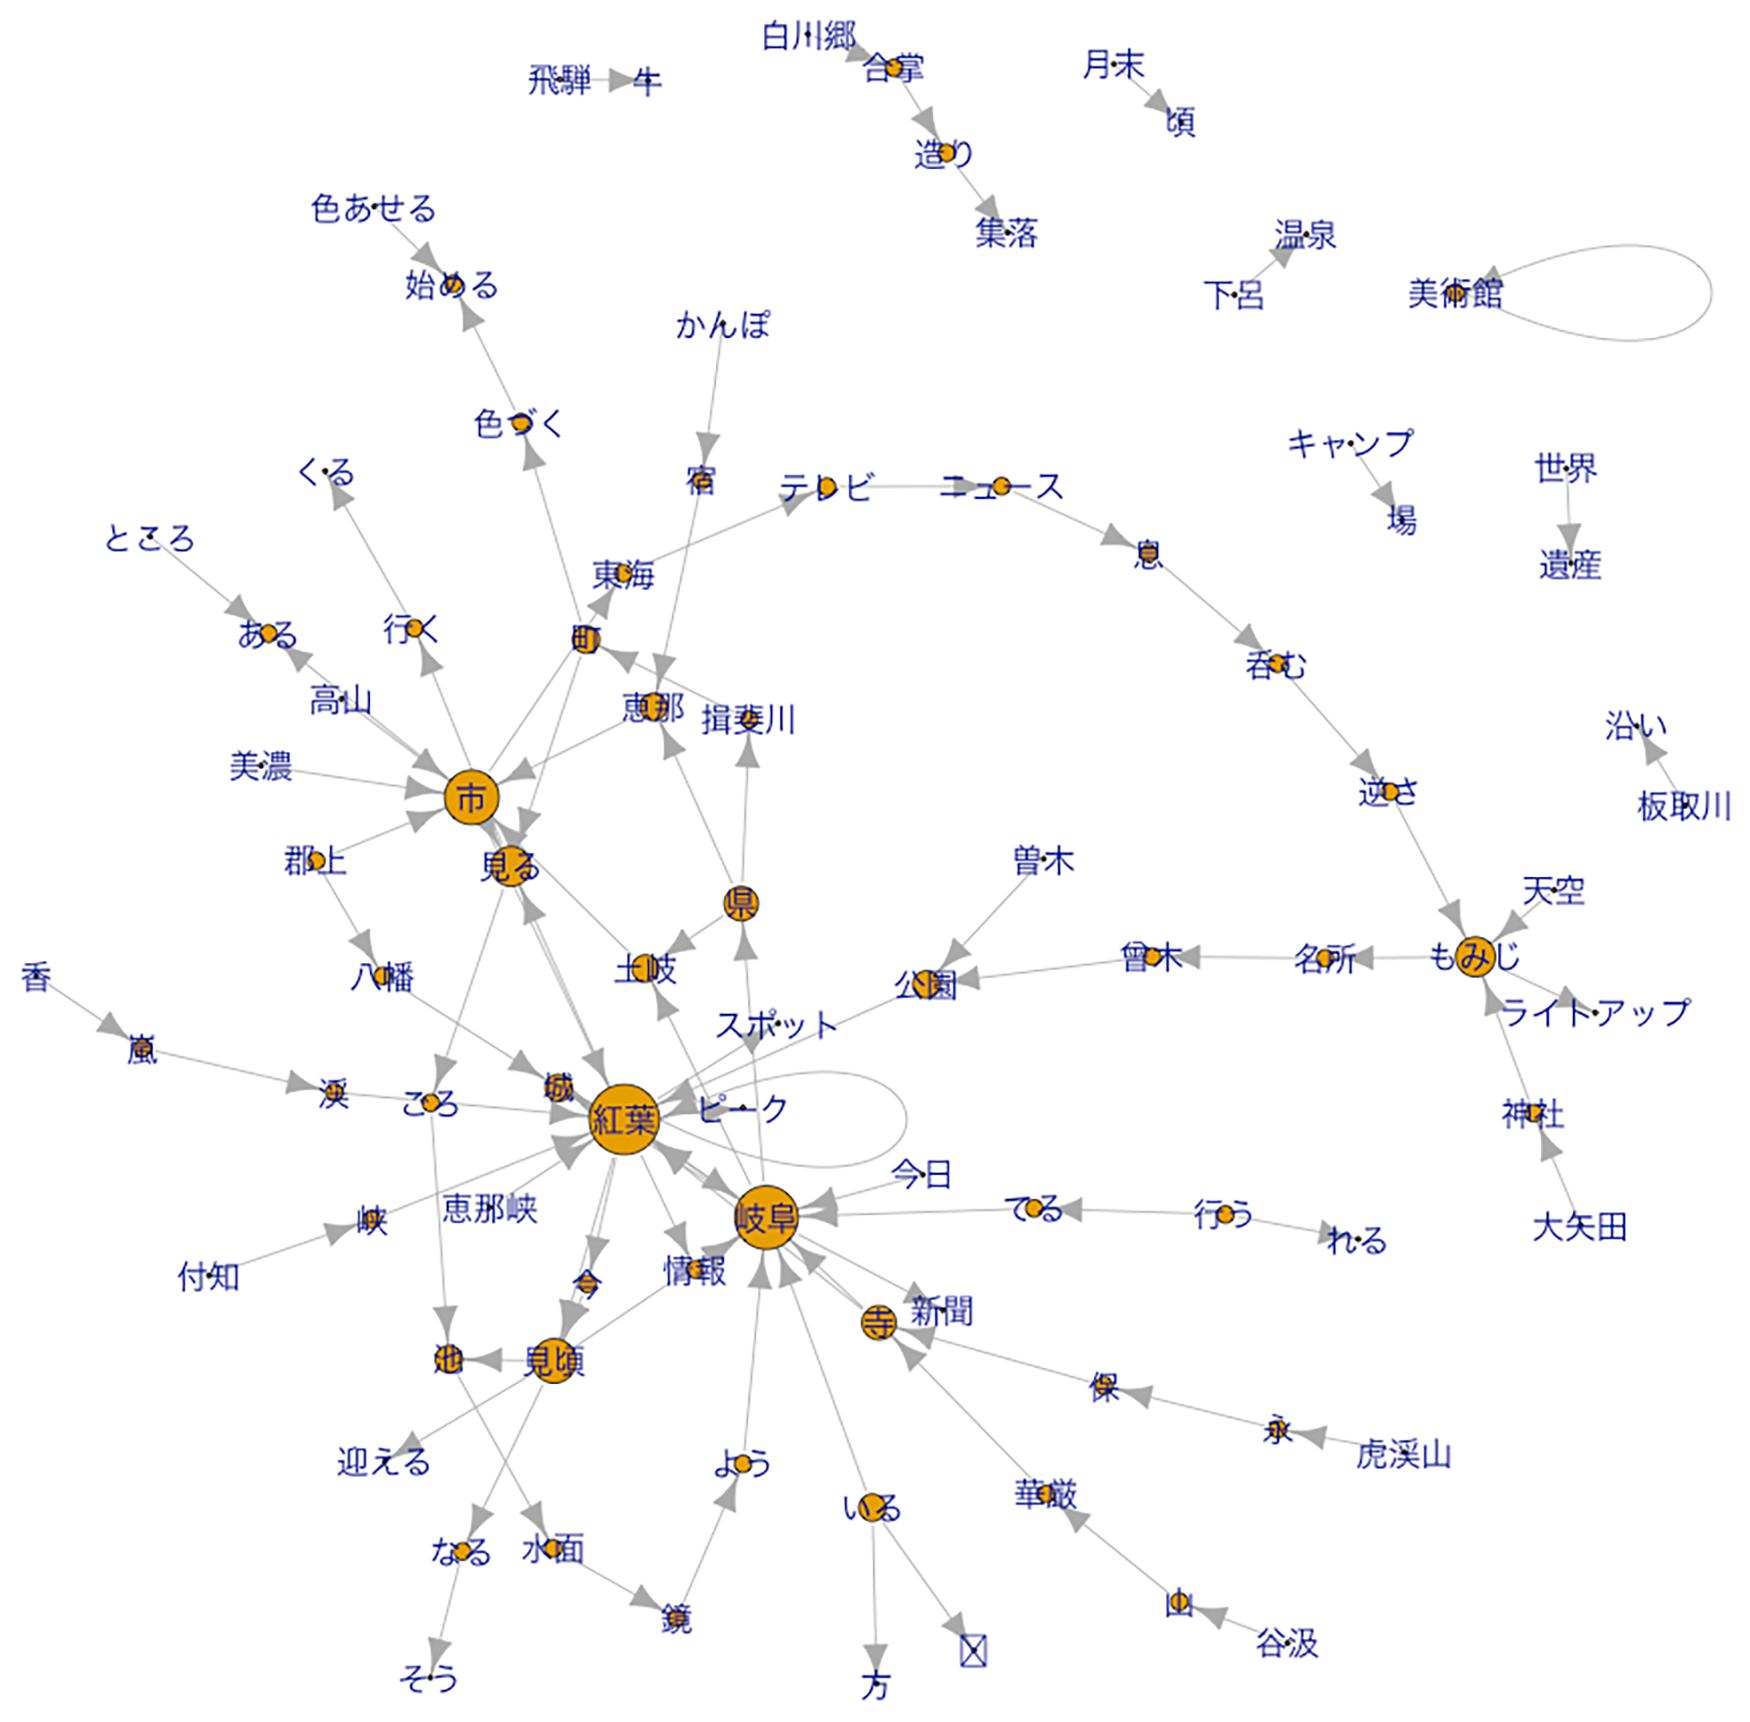
Figure 2. Bigram network graph of tweets including the Japanese terms for peak (見頃, 見ごろ, and ピーク) from 16 November to 20 November 2019.
For each method, we used Google Maps to determine the latitude and longitude of each place name associated with peak leaf coloring.
Results
We were able by both methods to extract a set of place names associated with peak leaf coloring from the body text of the tweets (summarized in Table 1). The number of place names associated with peak leaf coloring for each 5-day bin under method 1, method 2, and common to methods 1 and 2 ranged from 1 to 23, 1 to 27, and 0 to 13, respectively. The total number of unique place names in Gifu and neighboring prefectures identified across all methods was 84. We then mapped the spatio-temporal distribution of place names associated with peak leaf coloring under method 1 (Figure 3). These place names varied from north to south along the altitudinal gradient in Gifu. The peak coloring dates for the mined place names show a statistically significant negative correlation with altitude (R2 = 0.71, p < 0.001; Pearson’s correlation coefficient test; Figure 4).
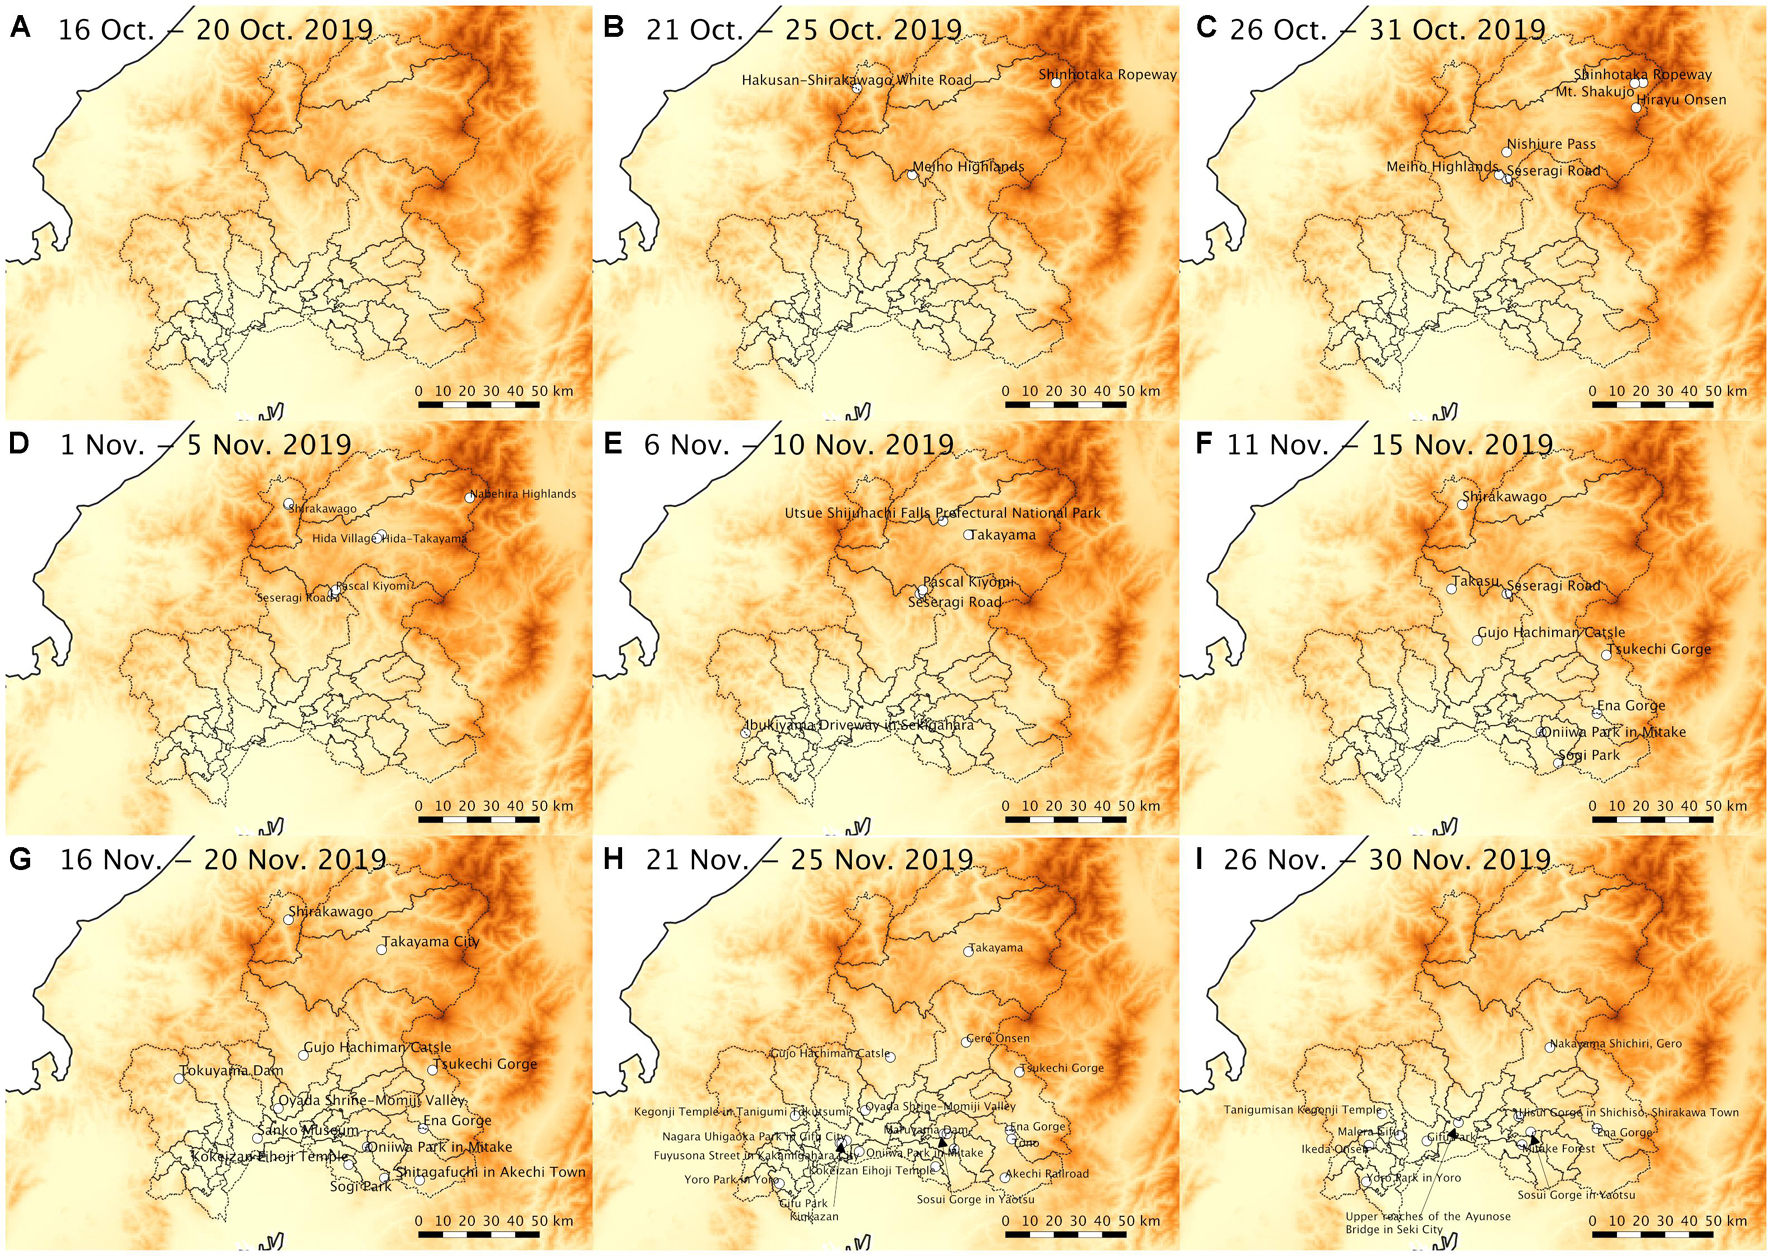
Figure 3. Spatio-temporal distribution of the place names regarding peak leaf coloring in Gifu extracted from the body text of tweets for each 5-day bin. Elevation is indicated in black scale (from 0 to 3,000 m a.s.l.). We removed the place names except Gifu.
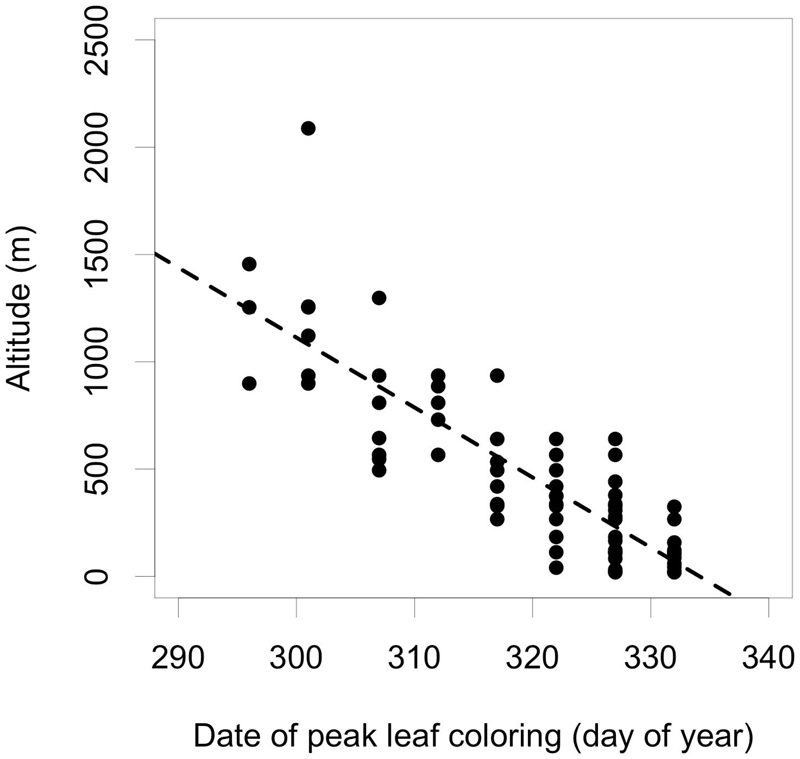
Figure 4. Altitudinal gradient for the dates of peak leaf coloring for place names mined from the body text of tweets. Dates shown are the middle dates for each 5-day bin. We used the program published by the Geospatial Information Authority of Japan to determine the altitude of each named place (Geospatial Information Authority of Japan, 2021) after determining longitude and latitude from Google Maps.
Discussion
Usefulness of the Text Mining of Tweets
The Japanese Meteorological Agency has conducted plant and animal phenology observations at weather stations in each prefecture since 1953. The agency records observations on 41 plant phenology items (including the first date of flowering, full blooming, leaf flush, leaf coloring, and leaf fall) and 24 animal phenology items (including the first dates of appearance and chirping of certain insects, birds, amphibians, and reptiles). These observations enable us to evaluate the spatio-temporal variability of the first date of various kinds of flowering and appearances of animals throughout a year (Japan Meteorological Agency, 2021). However, the number of observation points has been decreasing year by year: the Japanese Meteorological Agency only operated two observation stations in our target region until 2005 (Gifu City and Takayama) and only operates one now (Gifu) (Japan Meteorological Agency, 2021). In addition, many observation items represent Japanese culture, and therefore reduce the useful size of our data set. For instance, autumn phenology items are limited to the flowering of cluster-amaryllis, Japanese pampas grass, and Japanese bush clover; the leaf fall of ginkgo; and the leaf coloring of ginkgo and maple. For few observation items and few observation points, this approach does not facilitate the evaluation of spatio-temporal variability of leaf coloring along an altitudinal gradient. Twitter may be a useful, alternative tool for obtaining phenology information outside of the set of phenology items and observation stations operated by the Japanese Meteorological Agency.
We tested the usefulness of Twitter as a data source by comparing our text mining of tweets to the phenology information published on tenki.jp (2021), a popular weather website operated by the Japan Weather Association. Tenki.jp shows 22 place names associated with peak leaf coloring in Gifu (Nagai et al., 2020), and we were able to detect 11 of these locations through text mining of tweets under method 1, but did not detect the other 11. Conversely, text mining of tweets detected 43 locations in Gifu under method 1 that are not covered by the phenology information published on tenki.jp. These results suggest the possibility that we can increase the number of observation points by using the leaf coloring information published on websites and Twitter.
We then examined Google Trends (Google Trends, 2021), which can be used to generate relative scores (from 0 to 100) indicating interest in a given search term during a target period and for a specific geographic area. Using Google Trends, we analyzed public interest in the place names regarding peak leaf coloring that we detected through text mining of tweets under method 1 and were not able to detect seasonality except at three locations in Gifu: Shirakawago, Ena Gorge, and Sogi Park. Here, we concluded that the maximum trend scores in Shirakawago (on 4 November) included queries issued with an eye toward other seasonal items of interest such as “fire” (The Asahi Shimbun, 2019). In addition, we could not detect any Google Trends at 14 locations that we had identified from tweet mining.
Although we can obtain Google Trends scores for famous tourist locations, the seasonality found on Google Trends may be unclear because we used the service to check tourist information throughout the year, so that we could examine searches made about fall coloring but which were sent at other times of the year. This resulted in some cases of fall coloring events being overshadowed by events other than fall coloring from other seasons. One feature of Google Trends is that it enables us to obtain properties such as related topics; however, we did not evaluate the aim of each search request to Google in minute detail. Furthermore, in the case of Japan, the minimum spatial sphere for the collection of trends is each prefecture of Japan (which range in area from 1,876 to 83,456 km2). This means that the trend scores are largely averaged information, and that the seasonality found on Google Trends may include uncertainties and noise that are irrelevant to plant and animal phenology. This supports the view that Twitter is more useful than Google Trends.
We then evaluated online sources of image information. One source is live camera images, also known as webcams, which are useful for validating the contents of tweets because the criterion of peak leaf coloring includes variations among individual species. Within Gifu, we can view these images at tourist areas such as Shinhotaka Ropeway (2021), and in the suburbs (Koito Pottery, 2021) and the old part of Takayama City (Hida Takayama Live Camera, 2021). We viewed live camera images in the suburbs and the old part of Takayama city, which were taken during the period indicated by the tweets from which we extracted the place names regarding peak leaf coloring (Figure 5). Despite the nearly identical climate conditions at both camera locations, the live camera images showed different statuses of leaf coloring among the individual trees so that the timing of peak leaf coloring could be considered as 21–25 November 2019. This suggests the possibility that different statuses of leaf coloring among individual trees even in nearby locations may lead to variability in when people discern the peak leaf coloring. For this reason, the range of dates of the tweets from which the place names regarding peak leaf coloring were extracted could be expanded to some degree. This tendency toward greater variability is more notable in locations where the place names indicate a wide range of coverage, such as “Takayama.”
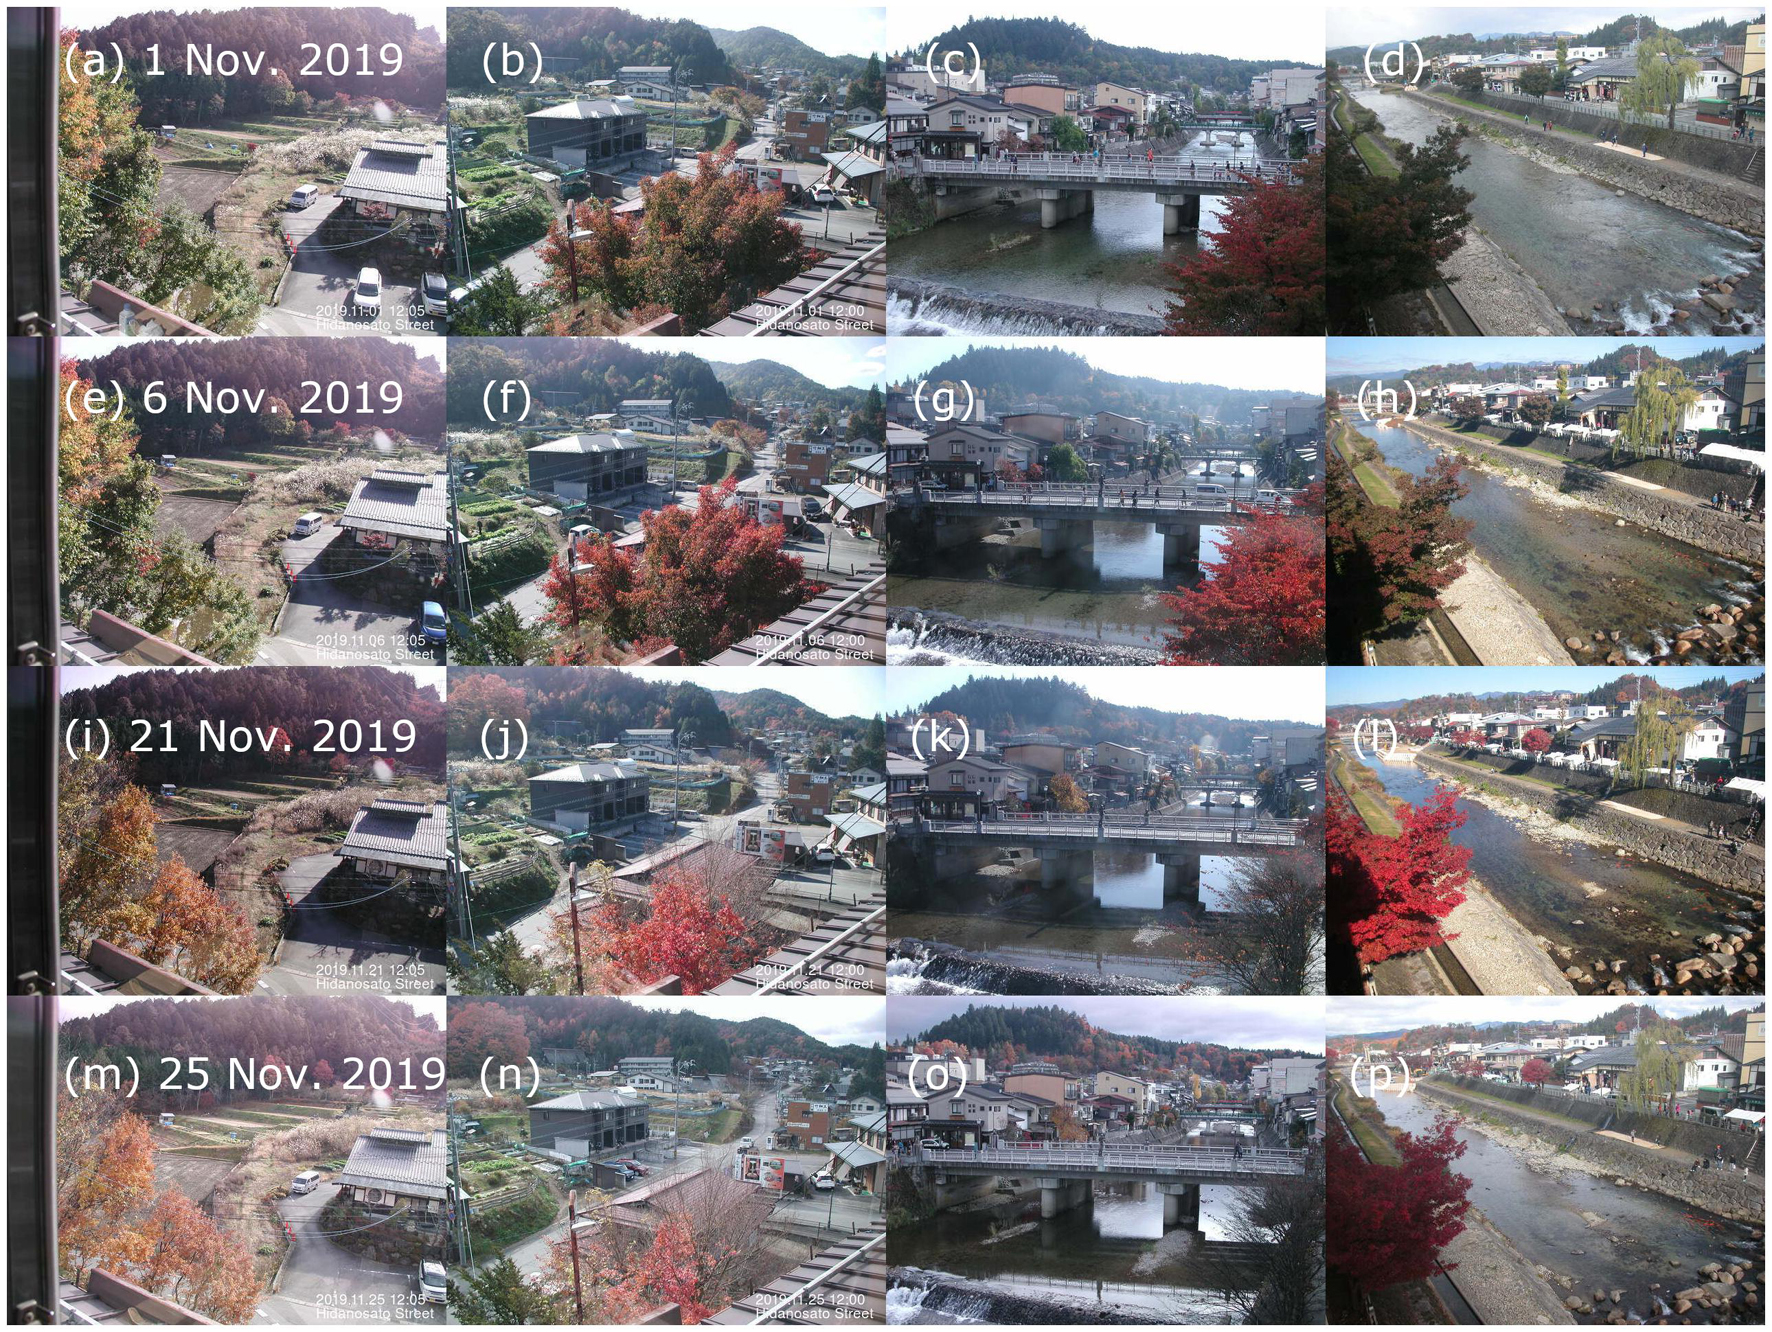
Figure 5. Live camera images at suburbs (a,b,e,f,i,j,m,n; 36°08′08′′N, 137°14′24′′E, 605 m a.s.l.) and the old part of Takayama city (c,d,g,h,k,l,o,p; 36°08′36′′N, 137°15′27′′E, 572 m a.s.l.) taken during the period covered by the extraction of place names regarding peak leaf coloring. The upper part of images (a,e,i,m) show unusual color (reddish tint), which we attribute to image quality error.
In addition, a Twitter user can attach photographs that capture leaf coloring in the field to the body text of a tweet. In fact, Silva et al. (2018) developed a phenology index by analyzing a time-series of images attached to tweets. However, in the present study, the data provider did not grant permission for the use of linked images. For this reason, in the cases for which attached images are unavailable, we should integrate the text mining of tweets with analysis of geotagged images such as those on Instagram (2021) and flickr (2021; Stafford et al., 2010; Song et al., 2020).
Uncertainties in the Text Mining of Tweets
Even though the tweets we mined did not include geotags, thereby adding uncertainty to our approach, we were still able to detect the spatio-temporal distribution of peak leaf coloring along an altitudinal gradient (Figure 3). If we apply this analysis on a nationwide scale, we expect that we can detect the spatio-temporal distribution of peak leaf coloring along latitudinal and altitudinal gradients (Nagai et al., 2020). Compared with the leaf coloring information published on websites (about 750 locations, Nagai et al., 2020), the information generated by the text mining of tweets on a nationwide scale greatly increased the number of locations of peak leaf coloring that can be detected. In addition, the locations for which leaf coloring information published on websites and mined from tweets overlap are useful for verifying information between the two types of sources.
The choice of method for reading tweets introduces another source of uncertainty. For method 1, manual reading of tweets was advantageous because it facilitated detection of the exact place names in tweets that contain descriptions of peak leaf coloring. In contrast, in the case of manual reading of bigram network graphs, we were able to identify and remove locations where peak leaf coloring was not actually present. Because both method 1 and method 2 rely on interpretation by manual reading, it would be inefficient to expand the target region of analysis given the labor-intensity of this task. In fact, the actual time spent on manual reading under method 1 was about 5 s per tweet.
One potential solution to the labor intensity issue is to pre-register a large set of place names in the MeCab dictionary used in the morpheme analysis in method 2 in order to facilitate their automatic extraction during this analysis. To test this solution, we pre-registered the place names in Table 1 as proper nouns in the MeCab dictionary and then automatically extracted the proper nouns from morphemes for each 5-day bin by using R (Table 2). The place names were successfully detected; however, many other irrelevant proper nouns including people’s names and the names of places unrelated to where peak leaf coloring was indicated, were also detected by the automatic extraction (Table 3).
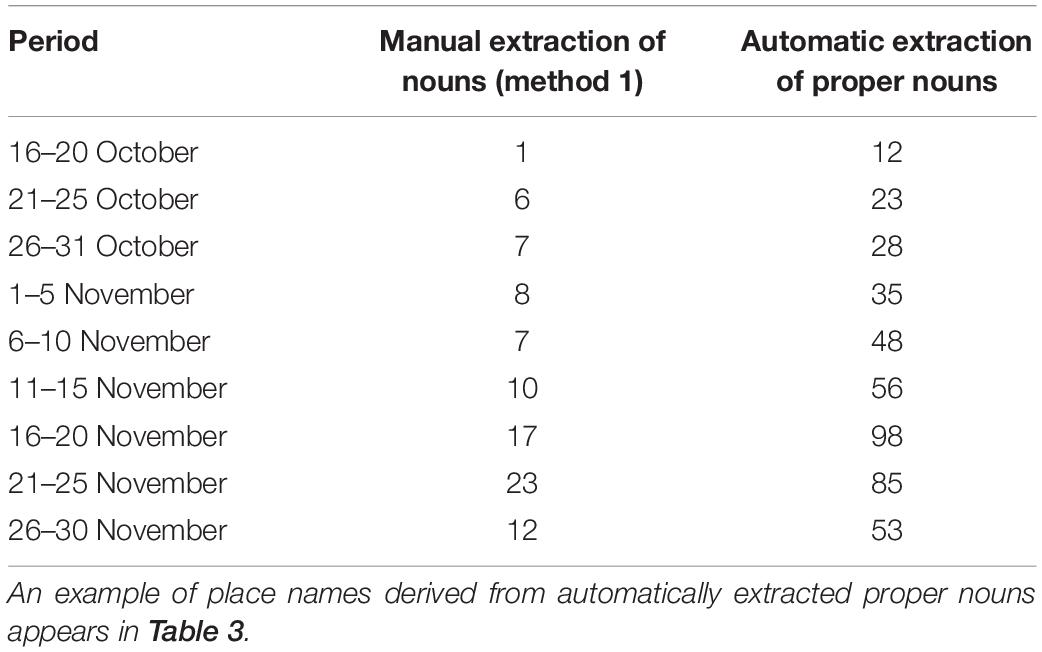
Table 2. Comparison of place names detected by manual reading of morphemes (nouns; method 1; Table 1) and those detected by automatic extraction of proper nouns from morphemes after registering place names as proper nouns in the MeCab dictionary.
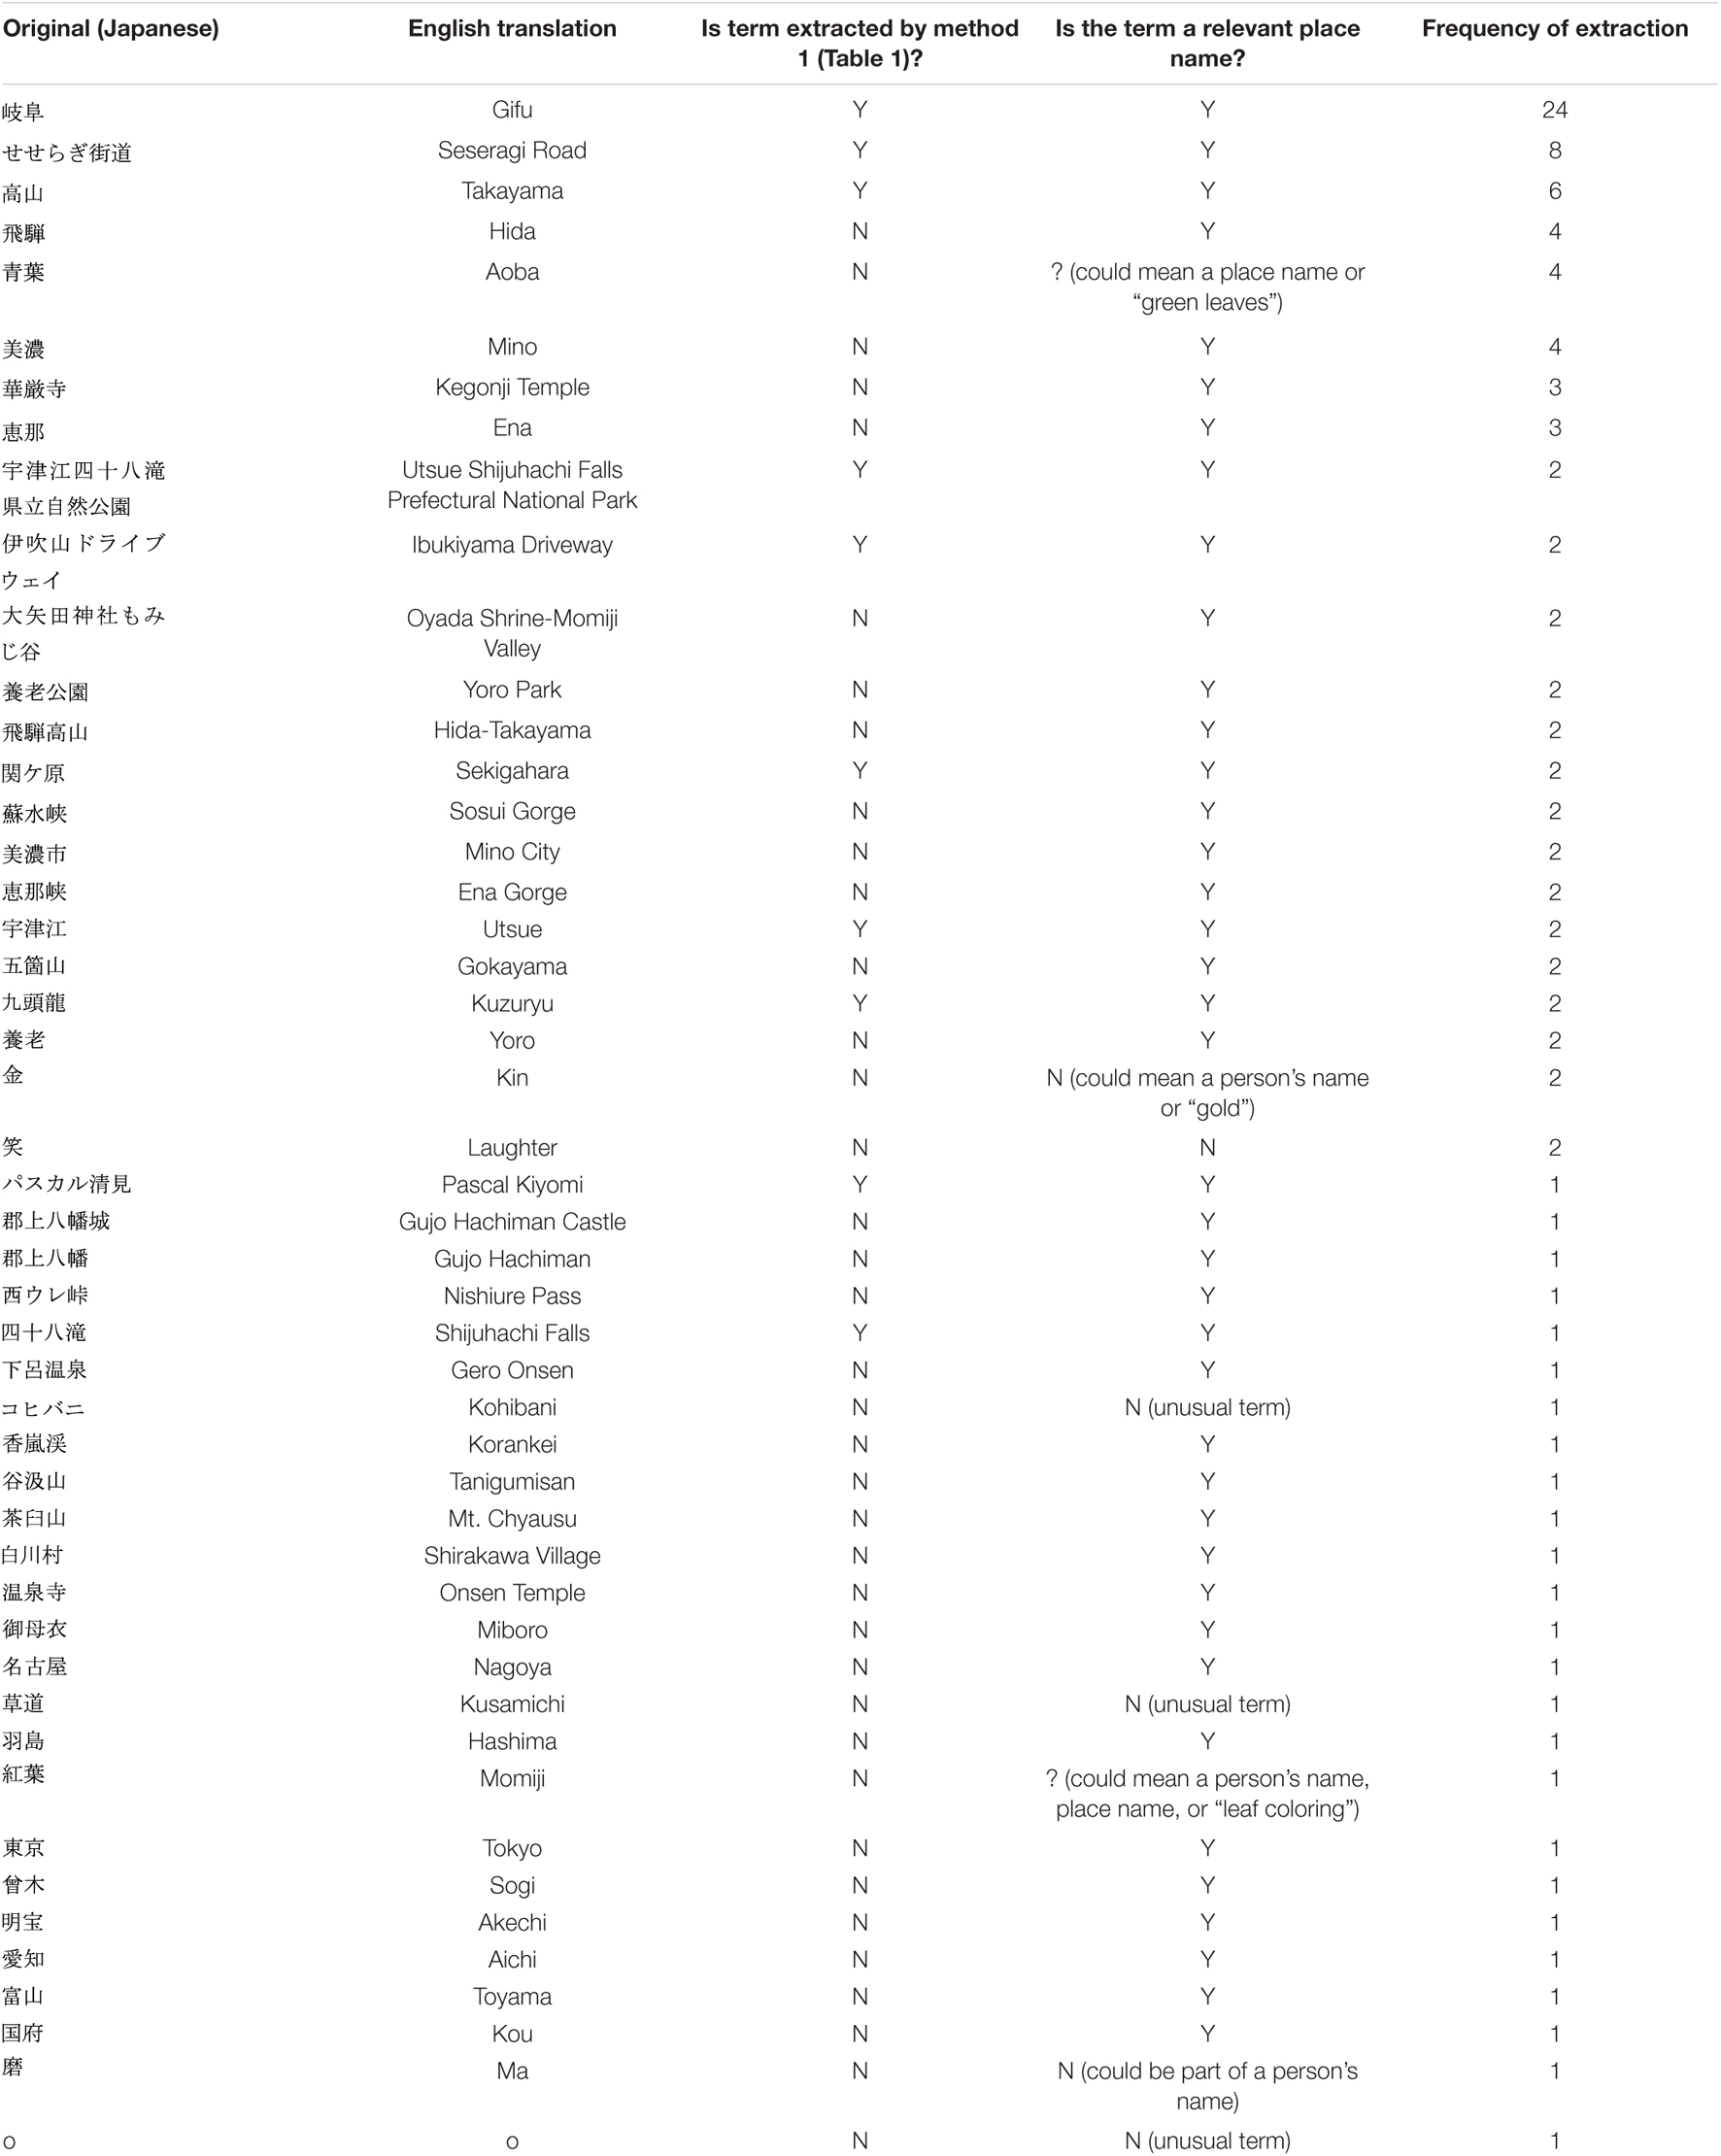
Table 3. Place names detected by automatic extraction of proper nouns from morphemes from 6 November to 10 November 2019.
Another reading-related uncertainty is that tweet contents may include past events, hoped-for events, and hearsay regarding leaf coloring as well as descriptions that are not directly connected to leaf coloring. Also, place names embedded in a hashtag (i.e., those preceded by “#”) may lead to the erroneous detection of place names because we removed all hashtag text from the body text of the tweets. Removing these sources of noise, as well as the irrelevant place names and proper nouns uncovered during automatic extraction, can be easily done by human judgment, but doing so by automatic computer interpretation requires rigorous supervised training of the software. We note the development of algorithms for the automatic detection of place names that are associated with peak leaf coloring and not related to past events, hoped-for events, or hearsay, as a future issue. In addition, we also note that automatic reading gives rise to its own uncertainties such as some place names that could not be detected because of the low frequency of appearance of morphemes (Table 1).
Another set of uncertainties relates to demographics. Specifically, the results may be heavily dependent on a small number or Twitter users, many of whom are not familiar with the local geography. Gifu Prefecture has a population of 1,965,427 (as of 1 July 2021: Gifu Prefectural Office, 2021, which is much smaller than Tokyo; 14,049,146; as of 1 July 2021: Statistics Division, Bureau of General Affairs, Tokyo Metropolitan Government, 2021) and neighboring Aichi Prefecture (7,525,239; as of 1 July 2021: Aichi Prefectural Office, 2021). In particular, the population of the Hida area in the northern part of Gifu, a forested mountainous area, is much smaller than that of the Mino area in the southern part. For 2019, 67.6% of the 71,628,000 tourists to Gifu visited from outside the prefecture (Gifu Prefectural Office, 2020). This points to the possibility that the number of tweets in Gifu, especially in the Hida area, is much less than that in metropolitan areas and that the source of tweets includes visitors from outside Gifu. In fact, the number of detected locations associated with peak leaf coloring under method 1 in the Hida area (16) constitute 35% of the total (46; Figure 2). We note the examination of the spatial concentration of tweets according to the characteristics and count of Twitter users as a future issue. In particular, examination of actual usage of Twitter in familiar ecosystems such as a nearby park would help to support the usefulness of text mining of tweets.
Another uncertainty is the tweeter’s knowledge of botany. Although we can expect knowledgeable users to provide detailed information of phenology such as tree species and phenology stage, in this study we seldom found tweets that contain such detailed phenology information. Instead, our source of tweets included a large number that conveyed leaf coloring information and news from the media. Does this tendency apply on a nationwide scale? Examination of the aim of each tweet and the regional characteristics of the source locations of tweets is an important topic for evaluating the generality or specificity of leaf coloring information detected by text mining of tweets.
Limitations With the Text Mining of Tweets
Although the mined tweets can be used to detect place names regarding peak leaf coloring at multiple geographic locations, they can never be used to evaluate the continuously distributed status of leaf coloring along an altitudinal gradient. In other words, the tweets have the shortcoming of being point data across space horizontally and altitudinally. We also note the limited number of available locations regarding peak leaf coloring from the mined tweets. Although we may increase the number of observation points by using the leaf coloring information published on websites and tweets (as we mentioned in the “Usefulness of the text mining of tweets” section), the available locations from the mined tweets are mainly limited to famous tourist sites and areas where many people are living (see Figure 3 for an example).
One promising solution to this problem is provided by the recent generation of advanced remote-sensing satellites equipped with sensors having high spatio-temporal resolution. One example is the Sentinel-2A/2B satellite constellation that takes images at a spatial resolution of 10 m with a revisit frequency of 5 days. Shin et al. (2021) analyzed the vegetation index produced by observations from Sentinel-2A/2B and showed the geographical distribution of the end of the growing season, marked by leaf coloring and leaf fall, along the altitudinal gradient in a steep river basin in Takayama. A time-series analysis of a vegetation index produced by satellite observations can facilitate evaluation of the spatio-temporal variability of leaf coloring along the altitudinal gradient. However, satellite data often include cloud contamination and atmospheric noise. For this reason, we cannot obtain satellite data with clear sky conditions at high frequency, such as every day. In contrast, the text mining of tweets may provide leaf coloring information at a daily time interval. To compensate for the limitations of the text mining of tweets, further integrated analysis between the text mining of tweets and satellite data with high spatio-temporal resolution is required.
Conclusion
We were able to detect place names associated with peak leaf coloring by text mining of non-geotagged tweets and to show the spatio-temporal distribution of the timing of peak leaf coloring along an altitudinal gradient. Despite the uncertainties and limitations related to the widespread application of automatic detection of relevant place names regarding peak leaf coloring, such an approach could be applied to all of Japan. Detection of place names regarding peak leaf coloring at multiple areas throughout Japan would help develop our understanding of the spatio-temporal variability of peak leaf coloring along the altitudinal and latitudinal gradients. The following three topics are future issues: (1) development of automatic detection of place names and phenology information from the main text of tweets, (2) examination of the spatial characteristics of the relationship between the number of tweets regarding peak leaf coloring and the number of tweeters, and (3) integrated analysis between the main text of tweets and geotagged images such as those on Instagram and flickr. Compared with fixed in situ observations and phenology information published on websites, the application of text mining of tweets to various kinds of plant and animal phenology that people are highly interested in enables the collection of a large volume of phenology information at multiple locations over a broad spatial scale.
Data Availability Statement
The data analyzed in this study is subject to the following licenses/restrictions: All data was purchased using the nazuki Twitter data provision service from NTT Data (https://nttdata-nazuki.jp/data/twitter.html). Requests to access these datasets should be directed to https://nttdata-nazuki.jp/data/twitter.html (in Japanese).
Author Contributions
NS designed this study, collected and analyzed the data, and wrote the manuscript. All authors contributed to critical manuscript revision and read and approved the submitted version.
Conflict of Interest
The authors declare that the research was conducted in the absence of any commercial or financial relationships that could be construed as a potential conflict of interest.
Publisher’s Note
All claims expressed in this article are solely those of the authors and do not necessarily represent those of their affiliated organizations, or those of the publisher, the editors and the reviewers. Any product that may be evaluated in this article, or claim that may be made by its manufacturer, is not guaranteed or endorsed by the publisher.
Acknowledgments
We are grateful to Koito-Pottery and Takayama Printing Co., Ltd., for providing live camera images. We are grateful for Twitter, Inc., and NTT Data Corporation for providing data and approving its use in our manuscript. We are grateful for the journal editor and the reviewers for their constructive comments.
References
Aichi Prefectural Office (2021). Monthly population reports in Aichi Prefecture. Available online at: https://www.pref.aichi.jp/soshiki/toukei/jinko1new.html (accessed August 24, 2021).
Endo, M., Saiki, K., Kondo, T., Ono, S., and Ishikawa, H. (2014). Phenological observations by analyzing the trends of geotagged tweets. IPSJ SIG Technical Rep. 131, 1–8.
Endo, M., Shoji, Y., Hirota, M., Ohno, S., and Ishikawa, H. (2017). Best-time estimation for regions and tourist spots using phenological observations with geotagged tweets. Int. J. Informat. Soc. 9, 109–117.
flickr (2021). flickr. Available online at: https://www.flickr.com (accessed August 24, 2021).
Gallinat, A. S., Primack, R. B., and Wagner, D. L. (2015). Autumn, the neglected season in climate change research. Trends Ecol. Evolut. 30, 169–176. doi: 10.1016/j.tree.2015.01.004
Garonna, I., De Jong, R., De Wit, A. J. W., Mücher, C. A., Schmid, B., and Schaepman, M. E. (2014). Strong contribution of autumn phenology to changes in satellite-derived growing season length estimates across Europe (1982–2011). Glob. Change Biol. 2014:12625. doi: 10.1111/gcb.12625
Geospatial Information Authority of Japan (2021). A program for getting altitude from latitude and longitude on the server side. Tsukuba City: Geospatial Information Authority of Japan.
Gifu Prefectural Office (2020). Tourist visitor statistics survey in Gifu, 2019. Gifu: Gifu Prefectural Office.
Gifu Prefectural Office (2021). Monthly population and households reports in Gifu Prefecture. Gifu: Gifu Prefectural Office.
Google Trends (2021). Google Trends. Available online at: https://trends.google.com/trends/ (accessed August 24, 2021).
Hall, J., Lo, F., Saha, S., Vaidyanathan, A., and Hess, J. (2020). Internet searches offer insight into early-season pollen patterns in observation-free zones. Sci. Rep. 10:11334. doi: 10.1038/s41598-020-68095-y
Hart, A. G., Carpenter, W. S., Hlustik-Smith, E., Reed, M., and Goodenough, A. E. (2018). Testing the potential of Twitter mining methods for data acquisition: Evaluating novel opportunities for ecological research in multiple taxa. Methods Ecol. Evolut. 9, 2194–2205. doi: 10.1111/2041-210x.13063
Hida Takayama Live Camera (2021). Hida Takayama Live Camera. Available online at: https://www.takayama-dp.com/live/ (accessed August 24, 2021).
Instagram (2021). Instagram. Available online at: https://www.instagram.com (accessed August 24, 2021).
Introducing JSON (2021). Introducing JSON. Available online at: https://www.json.org/json-en.html (accessed August 24, 2021).
Ishida, M. (2018). First book in text mining using R (second edition). Tokyo: Morikita Publishing, 183.
Japan Meteorological Agency (2021). Information on phenology observations. Tokyo: Japan Meteorological Agency.
Klosterman, S., and Richardson, A. D. (2017). Observing spring and fall phenology in a deciduous forest with aerial drone imagery. Sensors 17:2852. doi: 10.3390/s17122852
Klosterman, S., Melaas, E., Wang, J. A., Martinez, A., Frederick, S., O’Keefe, J., et al. (2018). Fine-scale perspectives on landscape phenology from unmanned aerial vehicle (UAV) photography. Agricult. For. Meteorol. 248, 397–407. doi: 10.1016/j.agrformet.2017.10.015
Koito Pottery (2021). Koito Pottery. Takayama: Koito Pottery. Available online at: https://koitoyaki.com/livecam/
Liu, Z., An, S., Lu, X., Hu, H., and Tang, J. (2018). Using canopy greenness index to identify leaf ecophysiological traits during the foliar senescence in an oak forest. Ecosphere 9:e02337. doi: 10.1002/ecs2.2337
MeCab: Yet Another Part-of-Speech, and Morphological Analyzer. (2021). MeCab: Yet Another Part-of-Speech and Morphological Analyzer. Available online at: https://taku910.github.io/mecab/ (in Japanese) (accessed August 24, 2021).
Ministry of Land, Infrastructure, Transport and Tourism of Japan (2020). Download site for quantitative land and territory information for the country of Japan (by administrative district). Tokyo: Ministry of Land, Infrastructure, Transport and Tourism of Japan.
Nagai, S., Akitsu, T., Saitoh, T. M., Busey, R., Fukuzawa, K., Honda, Y., et al. (2018). 8 million phenological and sky images from 29 ecosystems from the Arctic to the tropics: the Phenological Eyes Network. Ecol. Res. 33, 1091–1092. doi: 10.1007/s11284-018-1633-x
Nagai, S., Saitoh, T. M., and Miura, T. (2020). Peak autumn leaf coloring along latitudinal and altitudinal gradients in Japan evaluated with online phenological data. Int. J. Biometeorol. 64, 1743–1754. doi: 10.1007/s00484-020-01953-6
Nagai, S., Saitoh, T. M., Nasahara, K. N., and Suzuki, R. (2015). Spatio-temporal distribution of the timing of start and end of growing season along vertical and horizontal gradients in Japan. Int. J. Biometeorol. 59, 47–54. doi: 10.1007/s00484-014-0822-8
Natural Earth (2021). Natural Earth. Available online at: https://www.naturalearthdata.com (accessed August 24, 2021).
Park, C.-K., Ho, C.-H., Jeong, S.-J., Lee, E. J., and Kim, J. (2017). Spatial and temporal changes in leaf coloring date of Acer palmatum and Ginkgo biloba in response to temperature increases in South Korea. PLoS One 12:e0174390. doi: 10.1371/journal.pone.0174390
Proulx, R., Massicotte, P., and Pépino, M. (2013). Googling Trends in conservation biology. Conservat. Biol. 28, 44–51. doi: 10.1111/cobi.12131
Richardson, A. D., Hufkens, K., Milliman, T., Aubrecht, D. M., Chen, M., Gray, J. M., et al. (2018). Tracking vegetation phenology across diverse North American biomes using PhenoCam imagery. Sci. Data 5:180028.
Shin, N., Saitoh, T. M., and Nasahara, K. N. (2021). How did the characteristics of the growing season change during the past 100 years at a steep river basin in Japan? PLoS One 16:e0255078. doi: 10.1371/journal.pone.0255078
Shinhotaka Ropeway (2021). Shinhotaka Ropeway. Available online at: https://shinhotaka-ropeway.jp (accessed August 24, 2021).
Silva, S. J., Barbieri, L. K., and Thomer, A. K. (2018). Observing vegetation phenology through social media. PLoS One 13:e0197325. doi: 10.1371/journal.pone.0197325
Song, X. P., Richards, D. R., He, P., and Tan, P. Y. (2020). Does geo-located social media reflect the visit frequency of urban parks? A city-wide analysis using the count and content of photographs. Landscape Urban Planning 203:103908. doi: 10.1016/j.landurbplan.2020.103908
Stafford, R., Hart, A. G., Collins, L., Kirkhope, C. L., Williams, R. L., Rees, S. G., et al. (2010). Eu-social science: The role of Internet social networks in the collection of bee biodiversity data. PLoS One 5:e14381. doi: 10.1371/journal.pone.0014381
Statistics Division, Bureau of General Affairs, Tokyo Metropolitan Government (2021). Statistics of Tokyo Metropolitan Government. Tokyo: Tokyo Metropolitan Government.
Takada, K. (2012). Japanese Interest in “Hotaru” (Fireflies) and “Kabuto-Mushi” (Japanese Rhinoceros Beetles) corresponds with seasonality in visible abundance. Insects 3, 424–431. doi: 10.3390/insects3020424
Tao, Z., Xu, Y., Dai, J., and Wang, H. (2019). Divergent response of leaf coloring seasons to temperature change in Northern China over the past 50 years. Adv. Meteorol. 2019:2706803. doi: 10.1155/2019/2706803
tenki.jp (2021). tenki. Available online at: https://tenki.jp (accessed August 24, 2021).
The Asahi Shimbun (2019). The Asahi Shimbun. Available online at: https://www.asahi.com/articles/ASMCV4T21MCVOHGB00B.html (accessed August 24, 2021).
USGS (2021). USGS EROS Archive - Digital Elevation - Global 30 Arc-Second Elevation (GTOPO30). Reston, VA: USGS.
Xie, Y., Wang, X., Wilson, A. M., and Silander, J. A. Jr. (2018b). Predicting autumn phenology: how deciduous tree species respond to weather stressors. Agricult. For. Meteorol. 250–251, 127–137. doi: 10.1016/j.agrformet.2017.12.259
Xie, Y., Civco, D. L., and Silander, J. A. Jr. (2018a). Species-specific spring and autumn leaf phenology captured by time-lapse digital cameras. Ecosphere 9:e02089.
Yamamoto, Y., Fujino, T., and Kubota, T. (2015). First book in data mining using R. Tokyo: Ohmsha, 230.
Keywords: altitudinal gradient, Japan, leaf coloring, social sensing, Twitter, text mining, autumn phenology
Citation: Shin N, Maruya Y, Saitoh TM and Tsutsumida N (2021) Usefulness of Social Sensing Using Text Mining of Tweets for Detection of Autumn Phenology. Front. For. Glob. Change 4:659910. doi: 10.3389/ffgc.2021.659910
Received: 28 January 2021; Accepted: 14 September 2021;
Published: 07 October 2021.
Edited by:
Shonil Anil Bhagwat, The Open University, United KingdomReviewed by:
Hong Wei, University of Maryland, College Park, United StatesJess K. Zimmerman, University of Puerto Rico, Puerto Rico
Copyright © 2021 Shin, Maruya, Saitoh and Tsutsumida. This is an open-access article distributed under the terms of the Creative Commons Attribution License (CC BY). The use, distribution or reproduction in other forums is permitted, provided the original author(s) and the copyright owner(s) are credited and that the original publication in this journal is cited, in accordance with accepted academic practice. No use, distribution or reproduction is permitted which does not comply with these terms.
*Correspondence: Nagai Shin, bmFnYWlzQGphbXN0ZWMuZ28uanA=