 Nina L. Bingham
 Eric W. Slessarev
 Peter M. Homyak3†
- 1Department of Land, Air, and Water Resources, University of California, Davis, Davis, CA, United States
- 2Physical and Life Sciences Directorate, Lawrence Livermore National Laboratory, Livermore, CA, United States
- 3Department of Environmental Sciences, University of California, Riverside, Riverside, CA, United States
- 4Department of Geography, University of California, Santa Barbara, Santa Barbara, CA, United States
Models suggest that rock-derived nitrogen (N) inputs are of global importance to ecosystem N budgets; however, field studies demonstrating the significance of rock N inputs are rare. We examined rock-derived N fluxes in soils derived from sedimentary rocks along a catena formed under a semi-arid climate. Our measurements demonstrate that there are distinct and traceable pools of N in the soil and bedrock and that the fraction of rock-derived N declines downslope along the catena. We used geochemical mass balance weathering flux measurements to estimate a rock-derived N flux of 0.145 to 0.896 kg ha–1 yr–1 at the ridgecrest. We also developed independent N flux estimates using a 15N-based isotope mixing model. While geochemical mass-balance-based estimates fell within the 95% confidence range derived from the isotope mixing model (−1.1 to 44.3 kg ha–1 yr–1), this range was large due to uncertainty in values for atmospheric 15N deposition. Along the catena, N isotopes suggest a diminishing effect of rock-derived N downslope. Overall, we found that despite relatively large N pools within the saprolite and bedrock, slow chemical weathering and landscape denudation limit the influence of rock-derived N, letting atmospheric N deposition (7.1 kg ha–1 yr–1) and N fixation (0.9–3.1 kg ha–1 yr–1) dominate N inputs to this grassland ecosystem.
Introduction
Rock-derived nitrogen (N) can supplement N availability in terrestrial ecosystems (Morford et al., 2011); its contribution to the global N budget has been estimated at 6–17% (Morford et al., 2016b; Houlton et al., 2018), and in some ecosystems inputs of rock N are comparable to the flux from atmospheric fixation (Morford et al., 2016a). However, analysis of rock-derived N at the pedon scale – i.e., the scale of the soil profile and underlying bedrock – has been limited to a few humid, forested montane sites underlain by shale (Wan et al., 2021) or relatively N-rich ammonia-bearing metamorphic rock (Morford et al., 2016a). Expanding our understanding of rock N fluxes to other biomes and rock types can help constrain the importance of rock N in the nutrient budgets of natural and managed ecosystems.
This paper considers rock-derived N fluxes in soils derived from sedimentary rocks in dryland ecosystems, the latter of which comprise ∼45% of Earth’s surface (Prãvãlie, 2016). Siliciclastic sedimentary rocks and unconsolidated sediments account for 50% or more of the global land-surface (Suchet et al., 2003; Hartmann and Moosdorf, 2012; Börker et al., 2018), and are an important global source of rock N (Houlton et al., 2018). However, much of the N in sedimentary bedrock resides in organic forms that cannot be distinguished from surface-derived organic N using conventional extraction methods (Morford et al., 2016a). A multi-year, intensive pore-water and gas sampling study set in the humid and montane Upper Colorado River Basin used element proxy-to-N ratios and temporally resolved subsurface water flux rates to estimate the contribution to subsurface N from the weathering of marine shale (Wan et al., 2021). Wan et al. (2021) are currently the only watershed scale rock-derived N field study that focuses on N in sedimentary lithology, thus it remains unclear how much rock-derived N is released from sedimentary parent materials in other climates. For example, wetter climates have higher weathering rates than drier climates (White and Blum, 1995; Kump et al., 2000). We thus expect weathering rates – and rock-derived N fluxes – to be lower in more arid regions than in the humid regions where rock N has been studied (Houlton and Morford, 2015).
The rate at which N is released from silicates or fossilized organic matter (FOM) is set by chemical weathering of bedrock (Holloway and Dahlgren, 2002; Morford et al., 2016b). Specific elemental fluxes from the bedrock, as a proportion of total chemical weathering within the soil, can be quantified by combining denudation rates with geochemical mass balance calculations (Riebe et al., 2003). However, using this approach for N is complicated because N is also sourced from atmospheric N deposition and biotic and abiotic N fixation (Chapin et al., 2011). Proxy elements have been used to estimate rock-derived N fluxes in the absence of direct quantification of rock-derived N in soil (Houlton et al., 2018; Wan et al., 2021). However, more common proxies (e.g., Ca and Na) can precipitate as salts in drier climates and in regions affected by coastal salt deposition (Vengosh, 2003; Zamanian et al., 2016). To address this challenge, we use a suite of bedrock-derived nutrients (P, K, and Si) to provide an estimate for rock-derived N flux. While each of these elements behaves differently than N (e.g., P and Si can take relatively insoluble forms), together these elements may behave similarly to rock-derived N in that they are released to the soil by rock weathering and are actively biologically cycled. Together, these elements may hence be used to develop a range of possible rock-N flux estimates.
Rock-derived N may also be traceable using isotopic approaches, which can help supplement geochemical mass balance flux estimates. For example, a study in Northern California, where rock-derived N comprised roughly half the N inputs to soils, showed soil δ15N values were similar to those of the N-rich rock (Morford et al., 2011). The bulk δ15N of soil and sediments is the product of flux-weighted isotope values associated with N inputs and outputs (Brenner et al., 2001). N isotopes fractionate during biological cycling – as N is mineralized and exported from the soil, 14N is preferentially lost over 15N (Hobbie and Ouimette, 2009; Craine et al., 2015; Homyak et al., 2016). The effects of biological cycling over time thus increase the δ15N of soil organic matter (Kramer et al., 2003; Dijkstra et al., 2006), possibly leading to different isotope values in surface soil, FOM associated with sedimentary rock, and atmospheric N inputs. If the N isotope values for each N source are sufficiently distinct from each other, then isotope mixing models may validate rock N fluxes derived from other approaches (i.e., geochemical mass balance).
Mineral N pools, such as ammonium (NH4+) and nitrate (NO3–), and δ15N- and δ18O-NO3– values within a pedon may also help to qualitatively identify sources of rock N. For example, NH4+ is a byproduct of N metabolism readily immobilized by negatively charged soil exchange sites on clays and organic matter. In this sense, NH4+ bound to clays and organic matter within the rock may be less bioavailable, allowing NH4+ to persist with little oxidation to NO3–. Given sufficient oxygen and favorable pH (neutral-alkaline), however, NH4+ can be oxidized to NO3– by autotrophic nitrifiers (Schmidt, 1982). In arid climates where potential for NO3– leaching is limited, accumulation of NO3– produced by nitrification below the surface could reflect increased NH4+ bioavailability and, thus, might be used to identify the depth at which rock-derived N is released. However, because NO3– is a mobile anion, atmospheric and biologically produced NO3– at the surface could be redistributed to the subsurface (Walvoord et al., 2003), confounding the use of NO3– as an indicator of rock weathering. To differentiate redistribution from weathering, subsurface concentration maxima of other mobile anions such as Cl– could be used to indicate leaching from the surface (Walvoord et al., 2003). Alternatively, natural abundance δ18O- and δ15N-NO3– values can help further differentiate between in-situ production of NO3– at depth versus redistribution of NO3– from the surface; nitrification depletes δ15N-NO3– values whereas atmospheric NO3– influence increases δ18O-NO3– values (Oelmann et al., 2007; Rock et al., 2011; Michalski et al., 2012).
Application of these flux assessment approaches is simplest where solute flux is 1-D (vertical flux) so that accumulation of soil and solutes from upslope (horizontal flux) is minimized. Much of the previous pedon-scale rock N work targeted convex, ridgecrest-adjacent landscape positions to limit upslope colluvial input (Morford et al., 2011, 2016a). The dearth of pedon-scale work in downslope positions means our understanding of the influence of rock-derived N to hillslope-scale N budgets is limited. It is probable that downslope soils inherit mass from both upslope colluvium and from the underlying bedrock – the deeper the soil, the smaller the fraction derived from bedrock (Heimsath et al., 1997; Yoo et al., 2009). Thus, we expect that deepening soils downslope will lead to diminished rock-derived N flux, allowing other N inputs to dominate the N pools. We use the ridgecrest δ15N signatures for surface and rock N sources to interpret δ15N depth patterns in downslope, accumulating hillslope positions and infer the influence of rock-derived N in these downslope positions.
Here, we examine the contribution of shale-derived N to soils in a semi-arid, Mediterranean grassland ecosystem at the pedon and hillslope scale. We calculate bedrock-derived N flux using both a geochemical mass balance at the ridgecrest position and an isotope mixing model which partitions the relative influence of N inputs on soil δ15N. We then interpret the importance of rock-derived N contributions across a hillslope using N isotope depth patterns. We hypothesize that (1) our mass balance- and isotope mixing model-derived ridgecrest rock-derived N fluxes will converge, but that (2) the convergent flux will be lower than previous rock-derived N flux rates measured in wetter climates with higher denudation rates, and that (3) downslope rock-derived N fluxes will be lower than at the ridgecrest due to higher proportions of colluvial input. This work provides the first estimates of sedimentary rock-derived N fluxes in soils formed in a semi-arid climate where weathering rates are relatively low. Since there are no simple tracers of rock-N in soils, we use geochemical and isotope mass balances to infer the contributions of rock-derived N.
Materials and Methods
Study Site
We selected a study site with comparable bedrock-N concentrations to previous pedon-scale work (Morford et al., 2016a), situated in a semi-arid climate on sedimentary rock in the University of California Sedgwick Reserve, Santa Ynez Valley of central California (Figure 1). The area is characterized by a Mediterranean climate with cool, wet winters and warm, dry summers. The mean annual precipitation is 380 mm and the mean annual temperature is 16.8°C. Precipitation can vary dramatically year to year (Haston and Michaelsen, 1994), which affects the frequency at which water infiltrates into the soil and bedrock (Chamran et al., 2002). The vegetation is dominated by annual grasses, Bromus diandrus and Avena fatua. The bedrock underlying the study site is the Paso Robles Formation – a non-marine, alluvial formation with several members that vary in grain size from conglomerates to mudstones (Dibblee, 1966). The member of the Paso Robles underlying the studied hillslope is a low-energy depositional environment composed of organic-rich mudstone with lenses of carbonate (Dibblee, 1966). N in this type of lithology can be stored as NH4+ in interlayer crystalline clays or as organic-N trapped as micro-detritus during diagenesis (Holloway and Dahlgren, 2002).
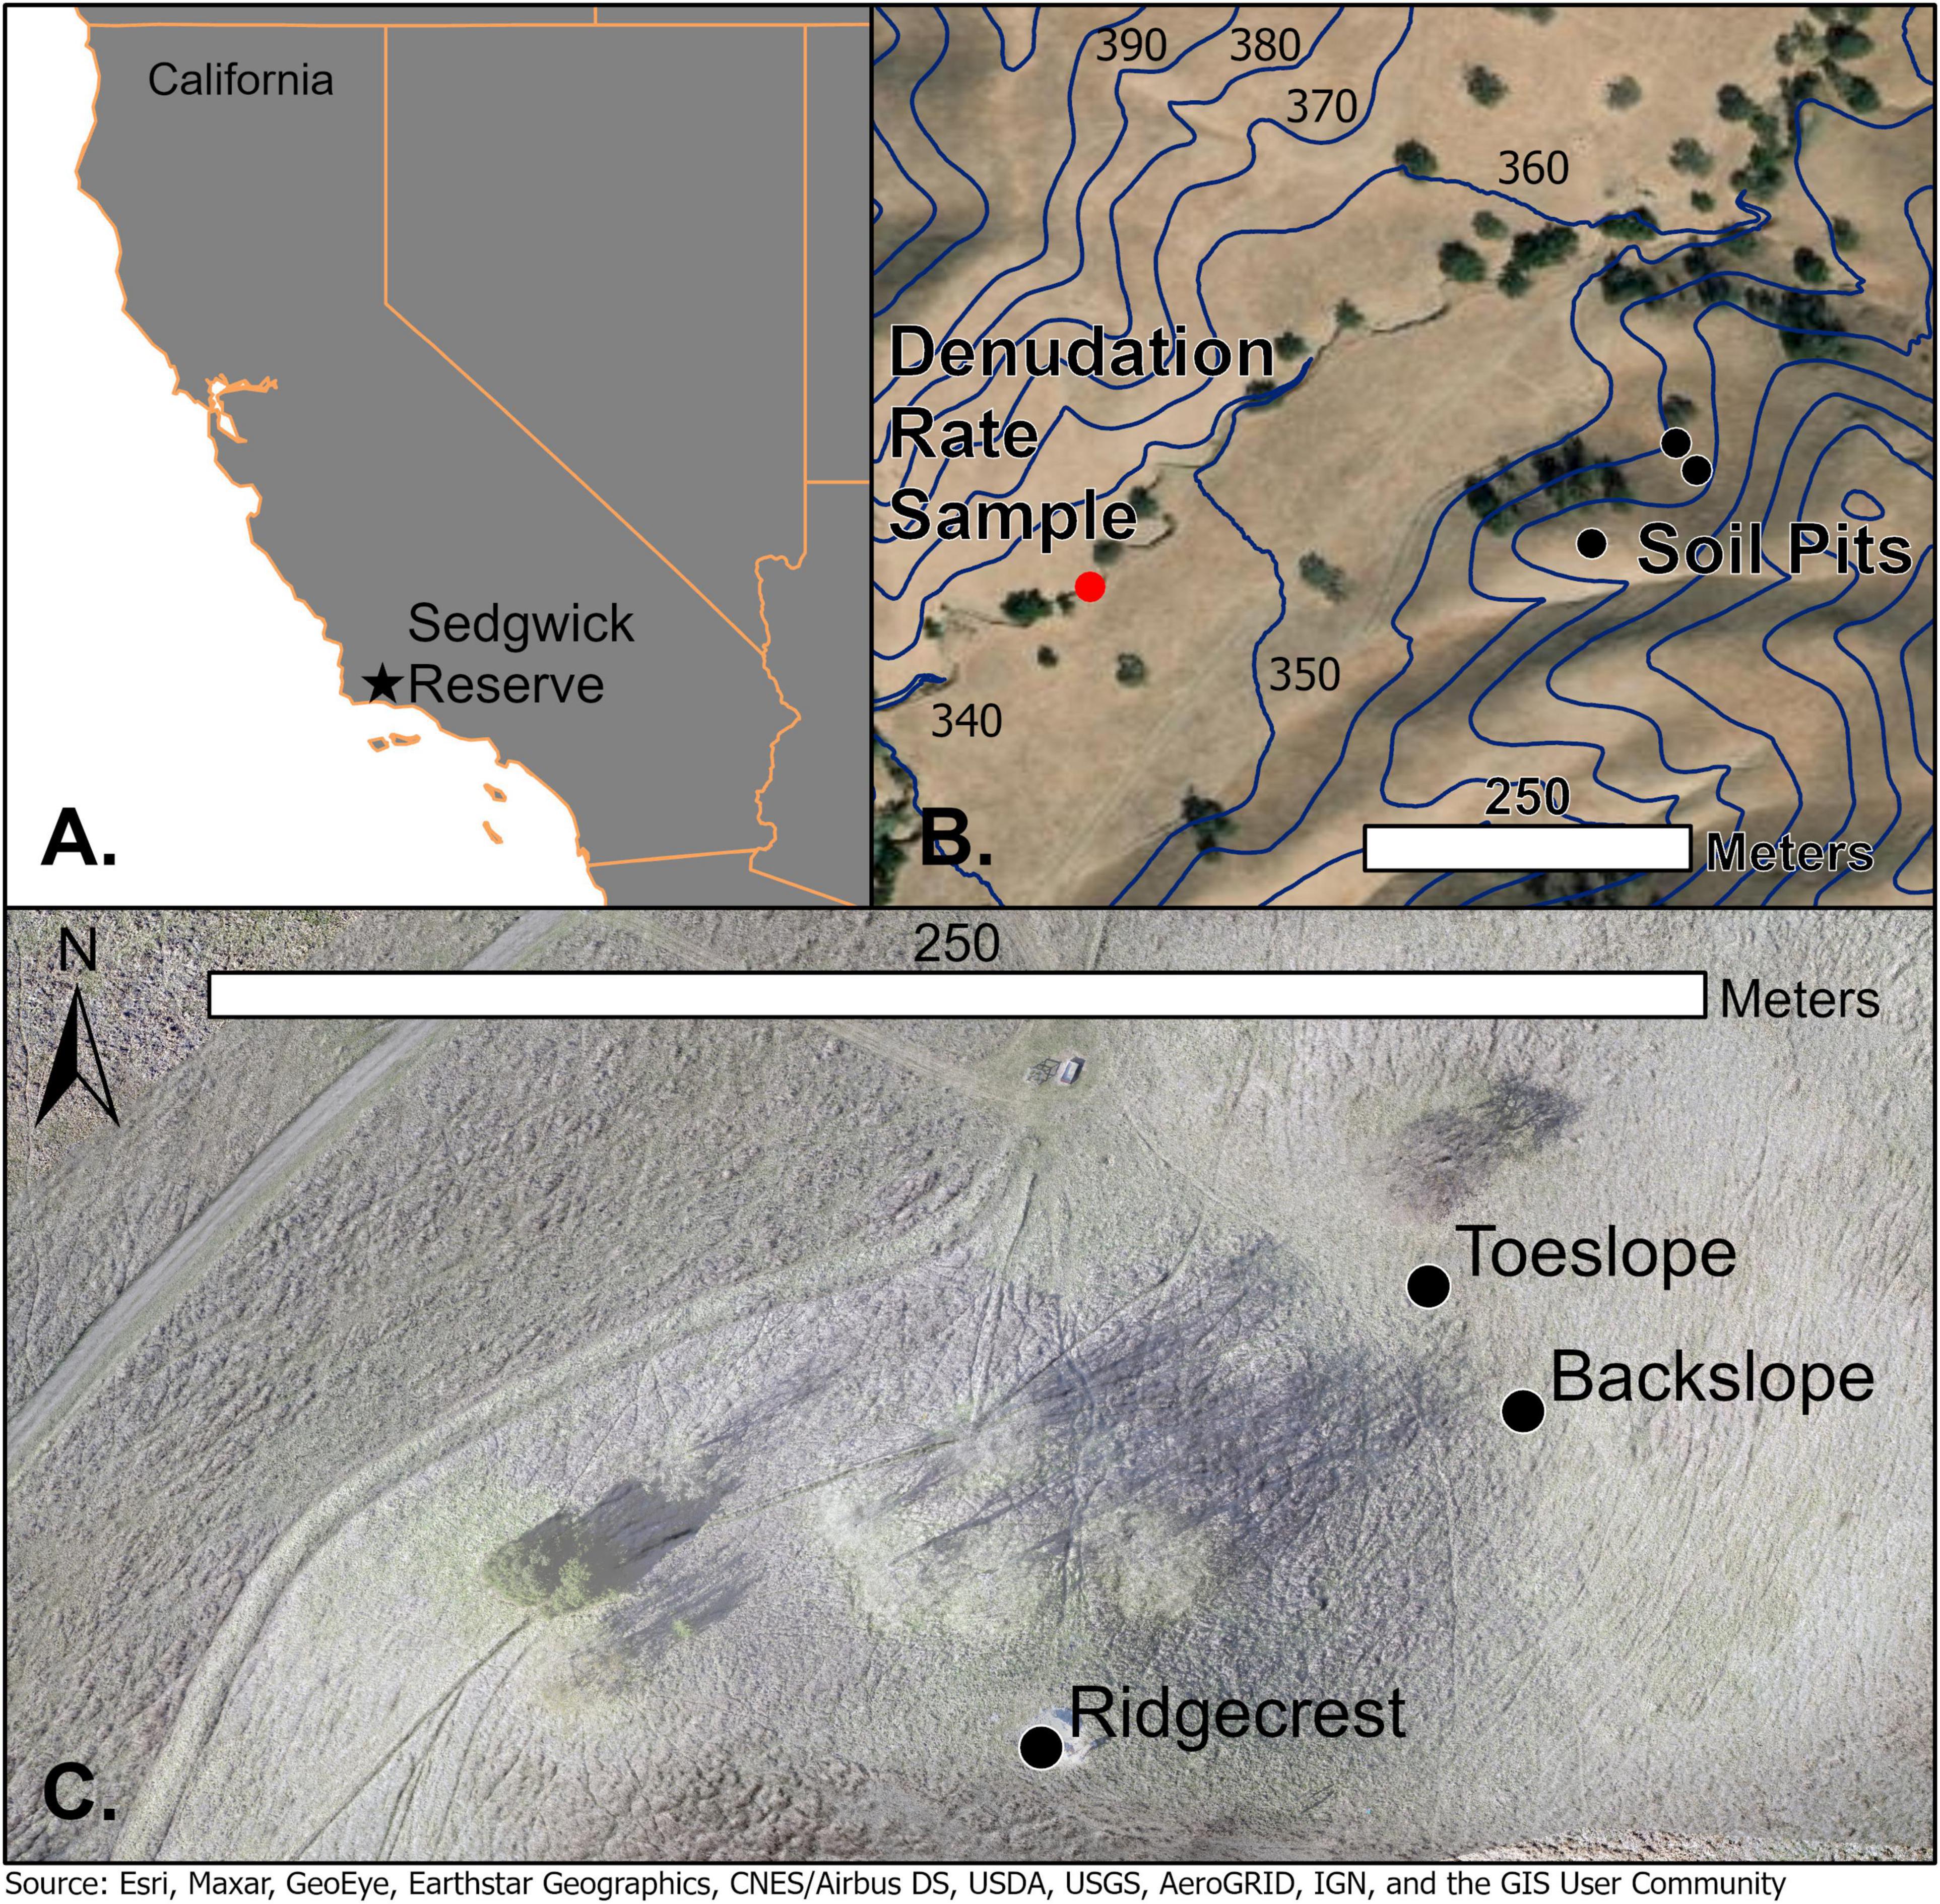
Figure 1. (A) Location of Sedgwick UC Field Reserve. (B) Soil (black points) and denudation sample locations (red point) within Sedgwick Reserve. Navy blue 10-m elevation contours lines show change in elevation across study site. (C) Ridgecrest, backslope, and toeslope soil sampling locations (black points).
The sampling sites chosen for this study are at a ridgecrest and adjacent, downslope locations positioned at the blackslope and toeslope of a soil catena (Figure 1). We determine the flux of rock-derived N at the ridgecrest location and then interpret changes in this flux at the blackslope and toeslope locations. The ridgecrest pedon was excavated to include soil and saprolite (0–250 cm) in early February 2018 and sampled by soil horizon in the top 100 cm and rock facies properties below 100 cm within the saprolite Figure 2. The ridgecrest pedon was extended to 415 cm with a soil auger in May 2018, and these samples were only taken at depth ranges that represented the strongest expression of the different sedimentary facies. The sample sites for the catena are adjacent to the pedon, in linear to slightly concave backslope and toeslope positions. Soil depths increase dramatically downslope from 1 m at the ridgecrest to 4.5 m at the backslope and 3.6 m at the toeslope. Sharp increases in soil depth downslope are also demonstrated for nearby locations within Sedgwick Reserve by Gessler et al. (2000). These downslope sites were sampled to the base of the soil and described previously in Lin et al. (2016) (locations – Figure 1B). We classified the ridgecrest soil as a Calcic Haploxeroll, the backslope soil as a Pachic Haploxeroll, and the toeslope soil as a Calcic Haploxeroll.
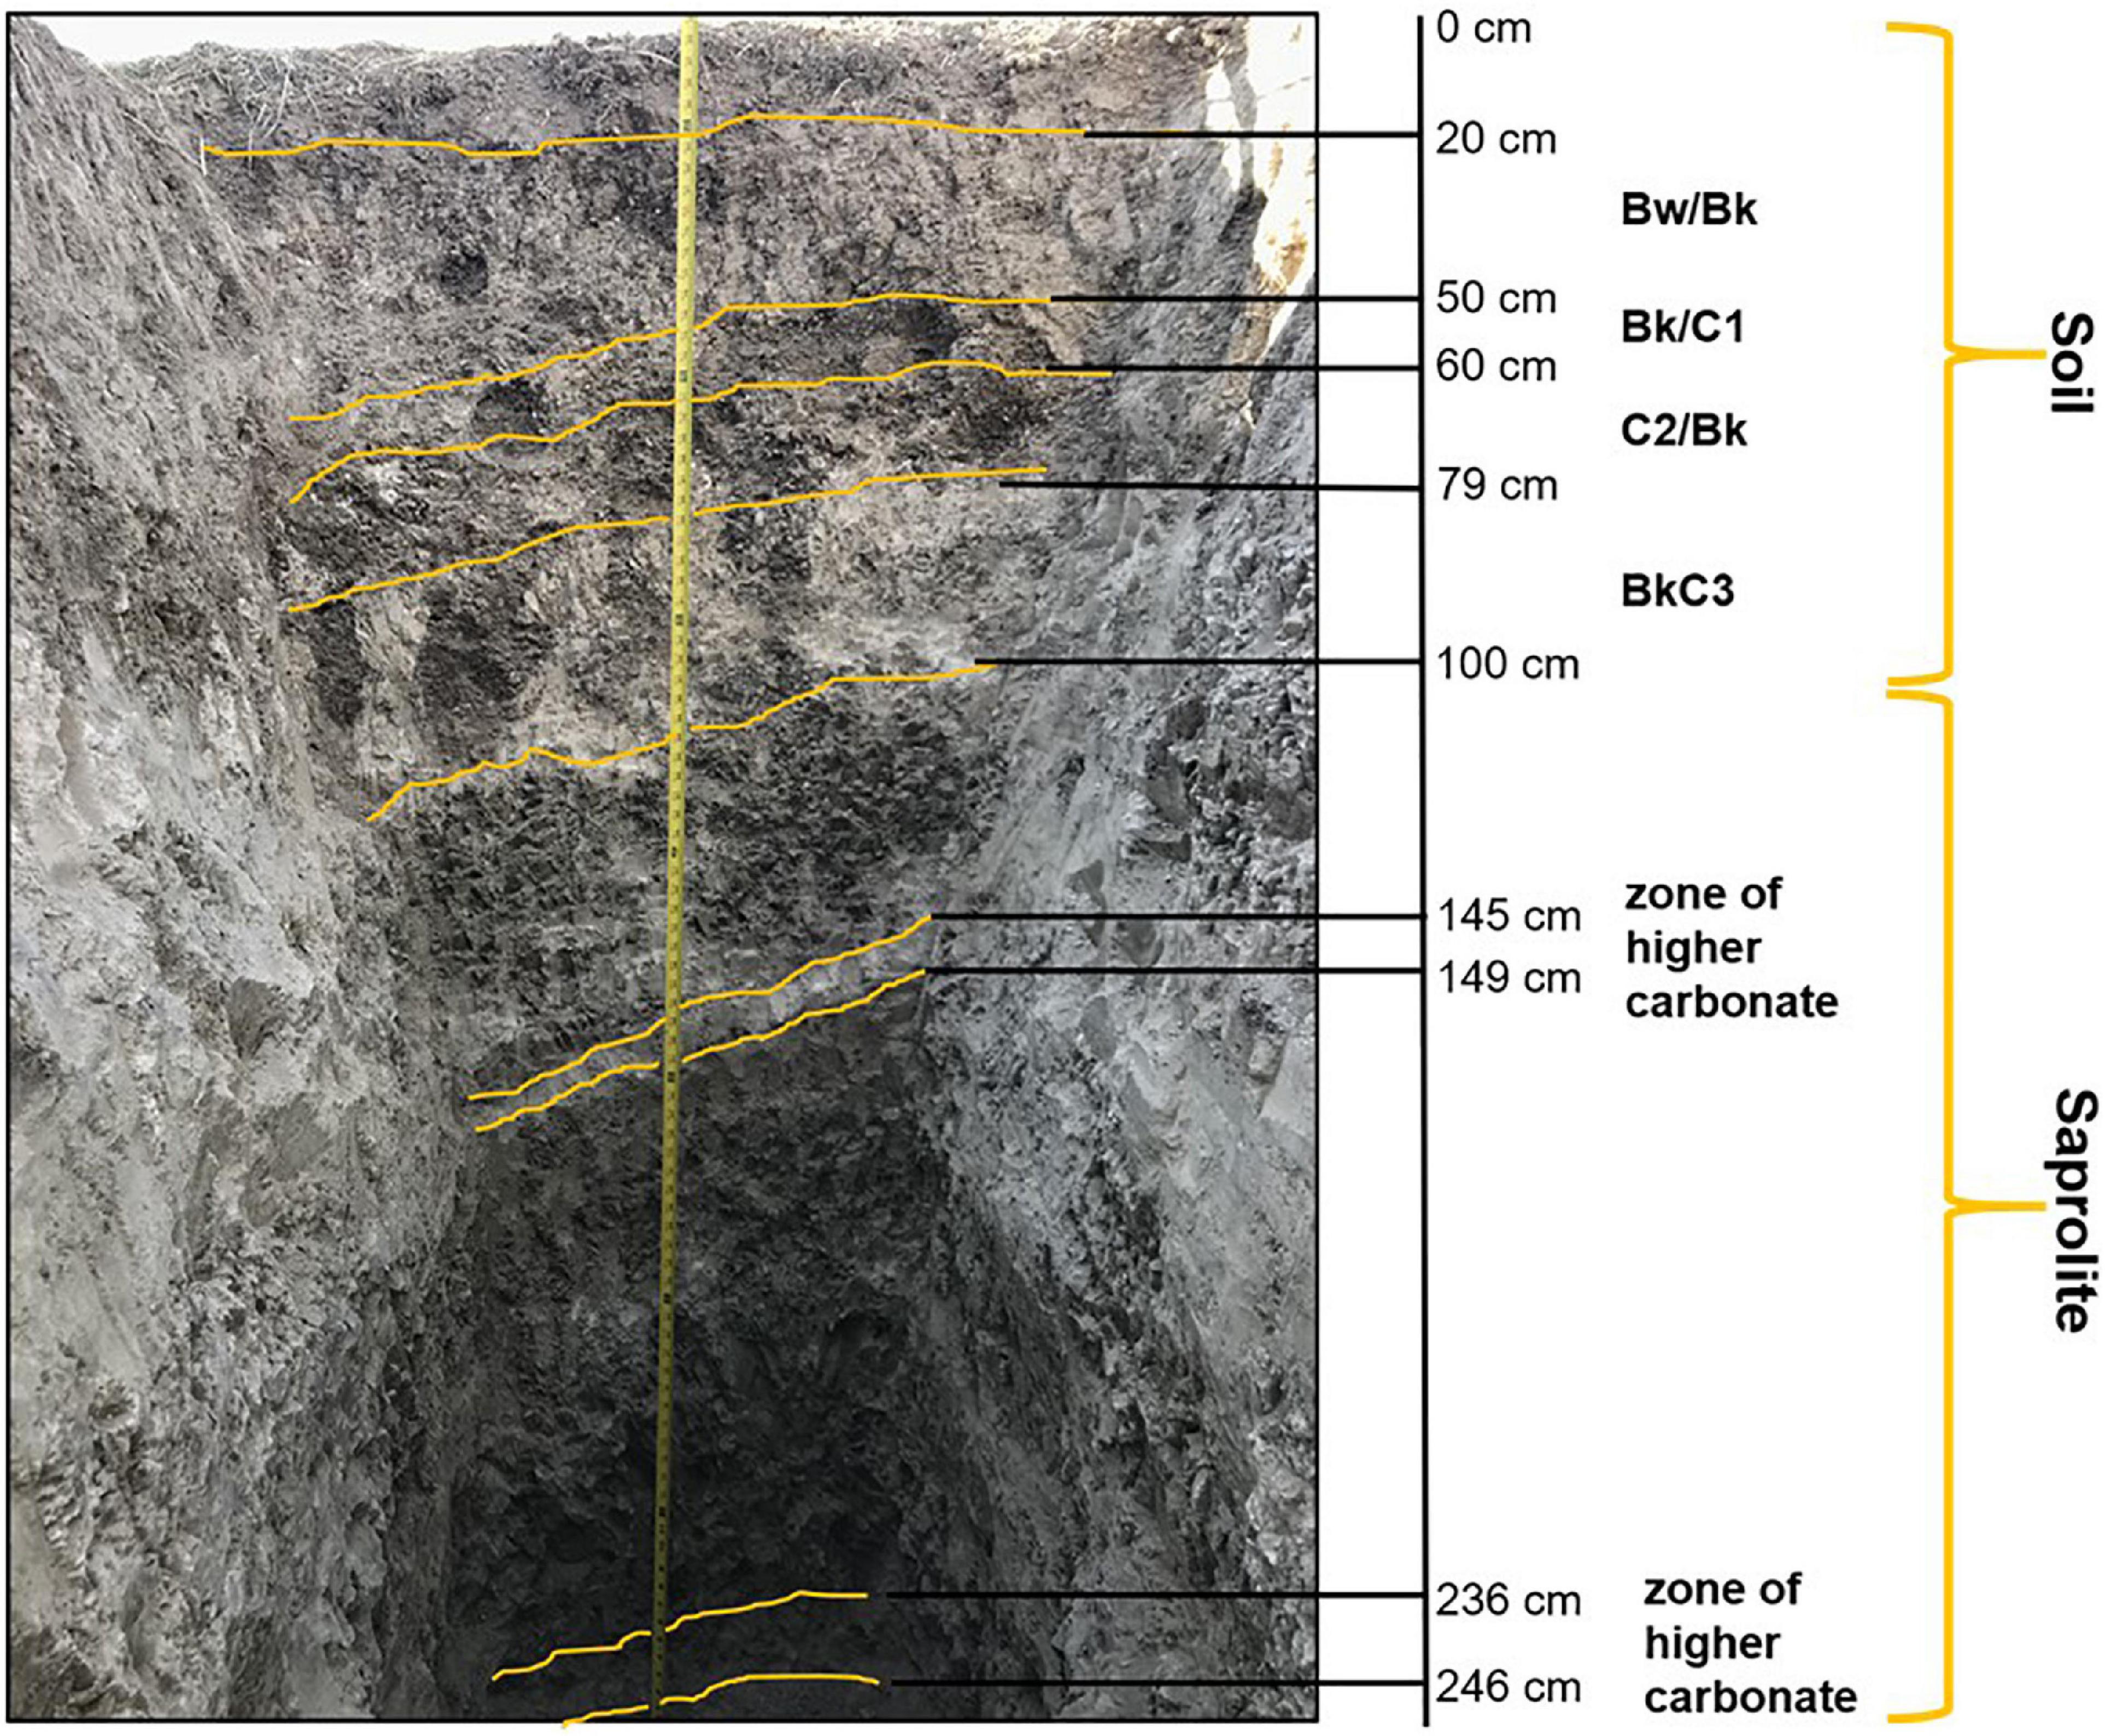
Figure 2. Ridgecrest soil (0–100 cm) and saprolite profile (100–250 cm) with major horizon depth-breaks within the soil indicated. The gopher holes (dark, circular patches expressing on the pit face) from 0 to 110 cm were present at the time of excavation.
Here, we provide a description of important physical characteristics for the ridgecrest pedon to provide the setting for our bedrock-N flux calculations. The ridgecrest pedon is heavily bioturbated from gopher (Thomomys bottae) burrowing. The deepest gopher burrow identified while digging was 110 cm; however, most gopher burrows were between 0 and 79 cm, with the highest density near the surface of the pedon. Rooting depth is ∼20 cm and sets the base of the A horizon. In-place bedrock structure appears at 50 cm, but ∼50% of the horizon at 50–60 cm shows pedogenic structure and carbonate accumulation within the gopher back-filled burrows. Mottles of calcium carbonate (CaCO3) appear by 20 cm and increase in size and percent area coverage to 79 cm, where we identified a horizon partially cemented by CaCO3. Within the soil (0–100 cm of the pedon), we identified the presence of a Mollic epipedon and a Calcic horizon. Below the partially cemented CaCO3-rich horizon (79–100 cm) was mechanically weak and easily diggable bedrock that retained its original structure; we considered this the start of the saprolite (100 cm). Beneath the soil, the saprolite gradually increases in physical competency with depth, which is demonstrated by an increase in fragment size for the shale facies: 1–3 cm at 100 cm to 3–5 cm by 200 cm. Additionally, the distinction between carbonate-rich and silicate clay-rich facies of the Paso Robles becomes more pronounced with depth (Figure 2). The increase in fracture spacing and competency of shale was used to determine the transition from saprolite to unweathered bedrock at 250 cm. The horizons and facies with physical evidence for the presence of CaCO3 are reflected in the concentration of inorganic carbon, with depth (Figure 3A). A horizon-by-horizon description can be found in the (Supplementary Table 1).
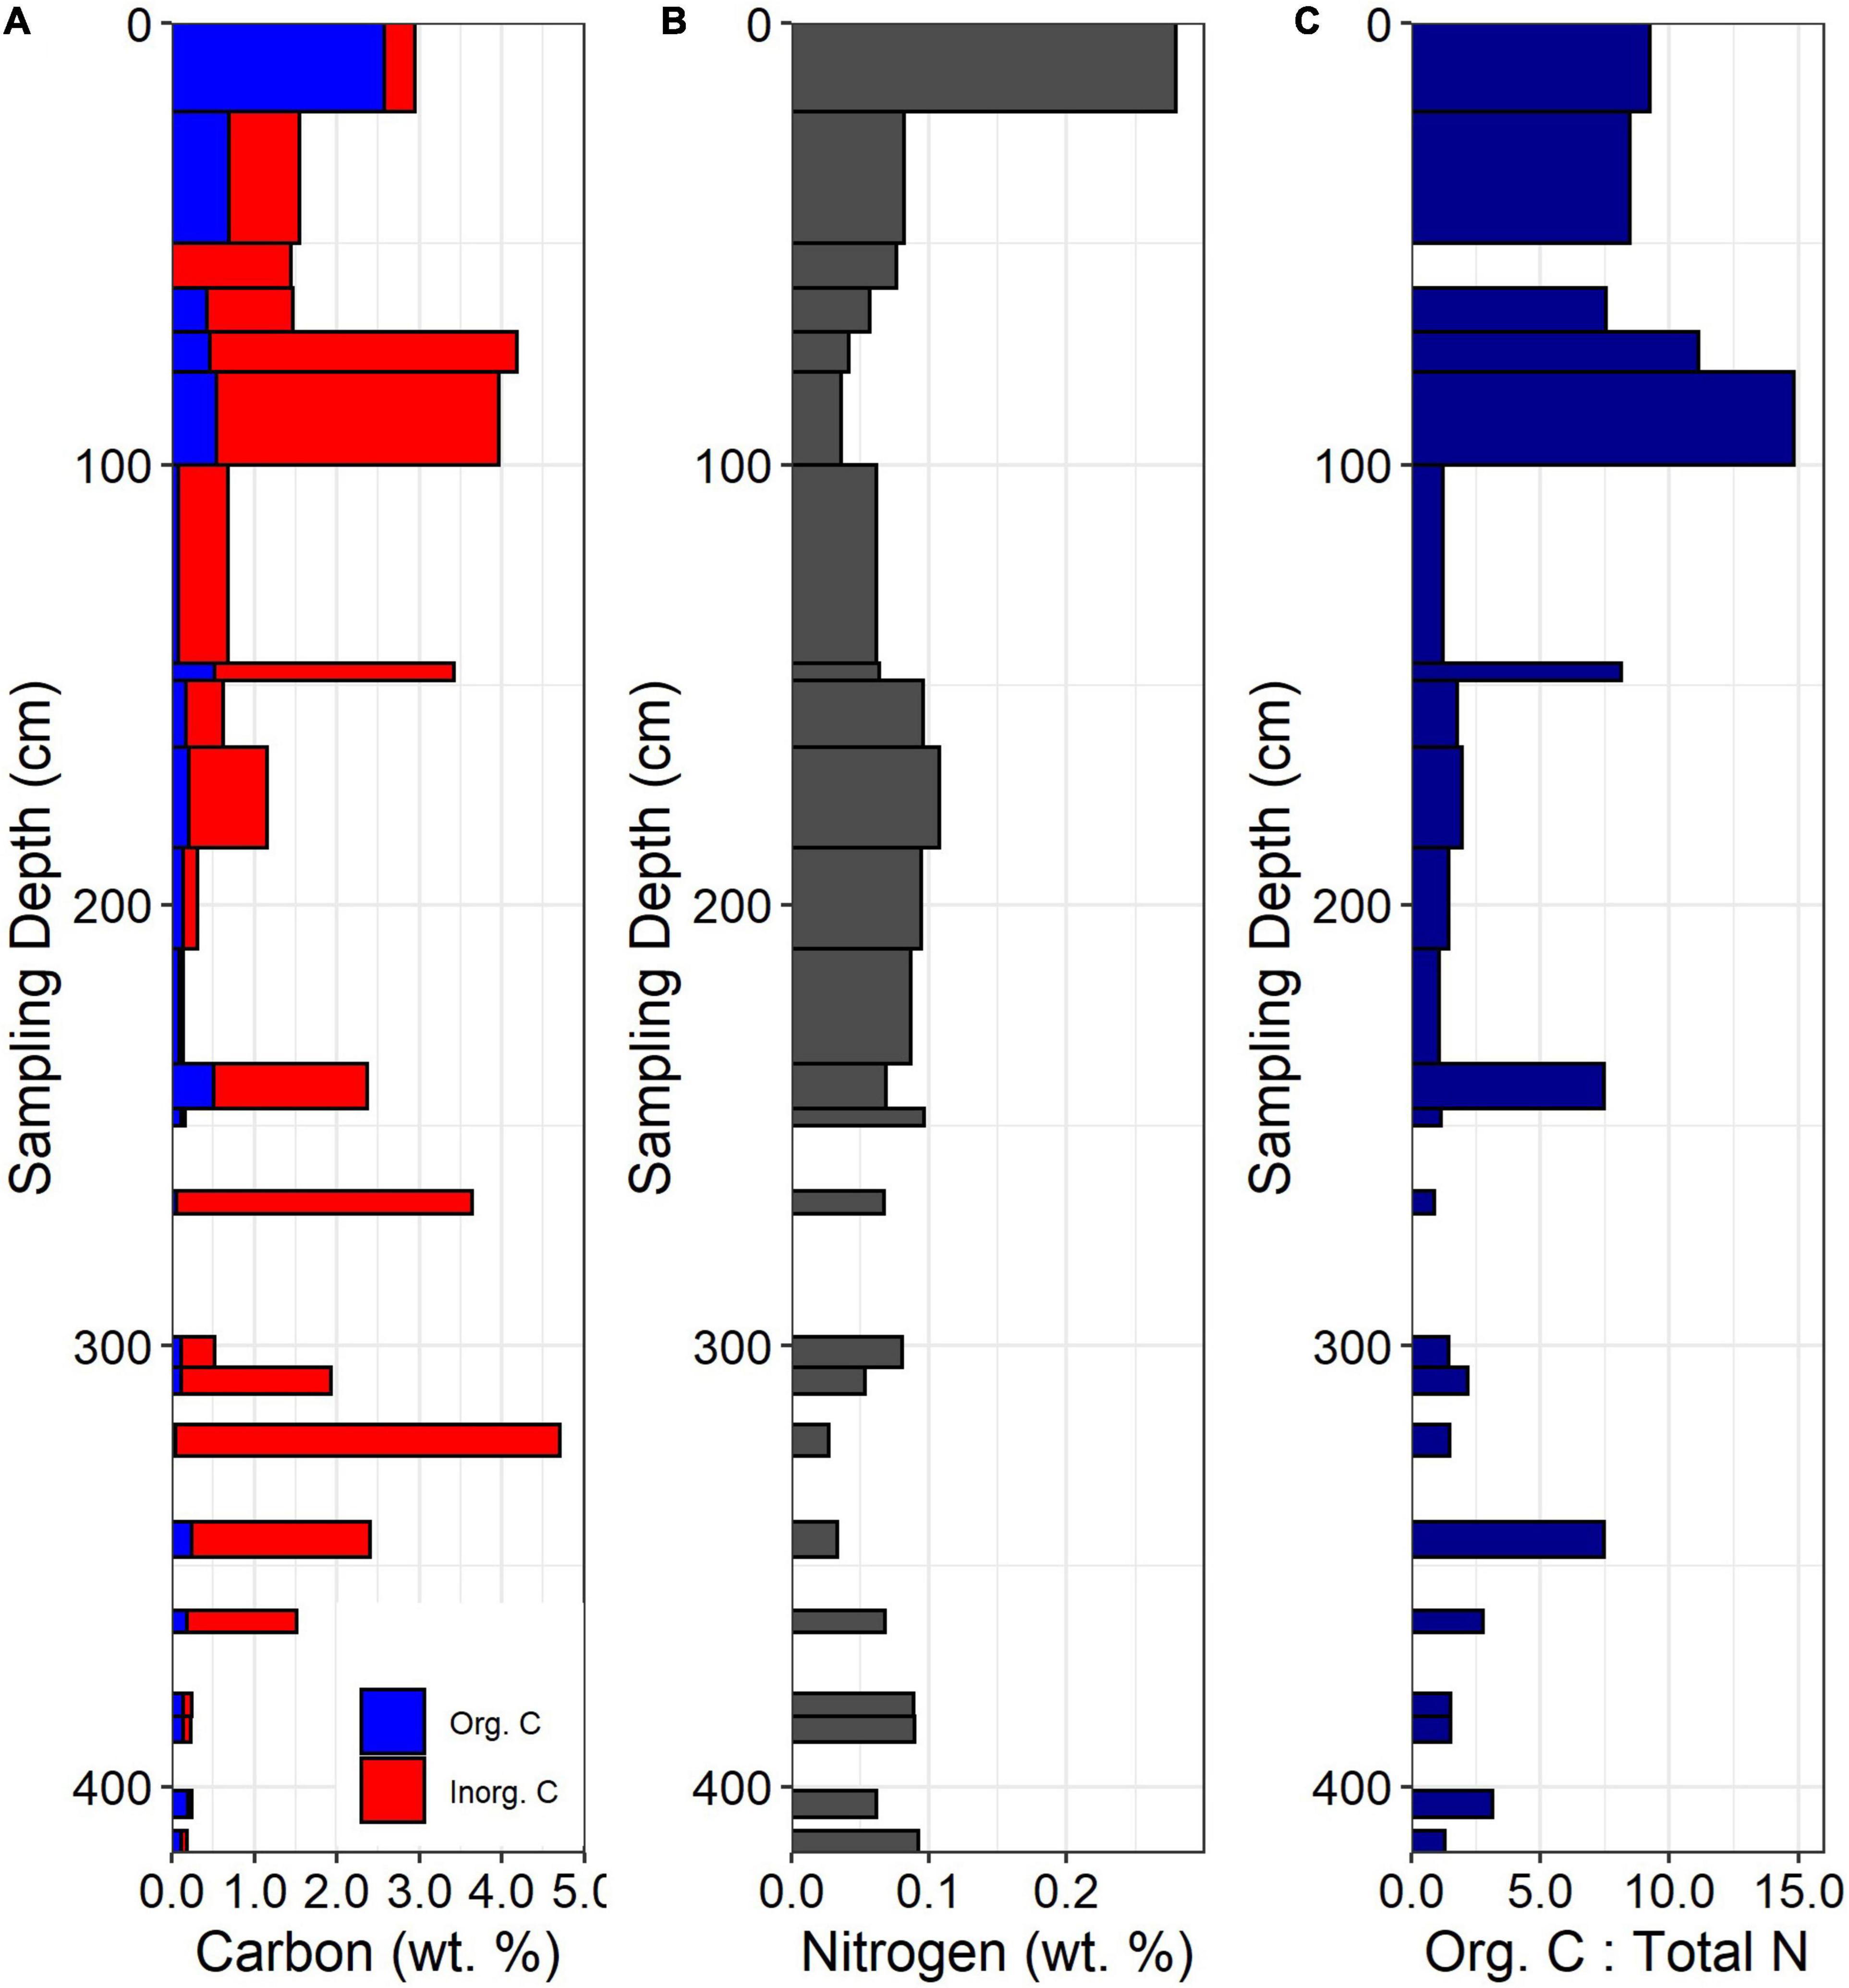
Figure 3. (A) Total C concentrations, (B) Total N concentrations, and (C) organic C: total N for the ridgecrest soil pit. Gaps in data indicate samples not taken at depth (gaps occurring below 250 cm) or because there was no organic C measured in the sample (50–60 cm).
Soil Physical and Geochemical Analyses
Bulk density, bulk elemental concentrations and trace metals, highly mobile anions, total C, inorganic C, total N, and N isotopes were determined for the ridgecrest, backslope, and toeslope soils. Geochemical properties were measured on ground <2-mm fraction for the ridgecrest, backslope, and toeslope soils and ground bulk samples for saprolite and unweathered bedrock from the ridgecrest pedon. Samples were ground to <150 μm to minimize extraction discrepancies produced by particle size differences between soil, saprolite, and unweathered bedrock. Bulk density for all soils was determined by saran-clod method (Soil Survey Division Staff, 1993). Bulk density was determined for samples extracted from the exposed profile but not for auger samples (e.g., ridgecrest pedon depths 250–415 cm) (Supplementary Table 2). Whole-soil elemental concentrations were determined with lithium borate fusion prior to acid dissolution and then analyzed on an ICP-AES (ALS-Chemex, Reno, NV, United States). Trace elements including Zr, Ti, and Nb were processed in the same manner as whole-soil elemental concentrations but analyzed on an ICP-MS (ALS-Chemex, Reno, NV, United States). Labile chloride was water extracted from ground soil and measured at the UC Riverside Environmental Sciences Research Laboratory on a Dionex Aquion Ion Chromatograph. Total C and N were determined via combustion using a PDZ Europa ANCA-GSL elemental analyzer at UC Davis Stable Isotope Facility. Inorganic C was measured at UC Santa Barbara by acidification using 2 N sulfuric acid with 5% iron sulfate and measuring headspace CO2 with an infrared gas analyzer (LI-COR 6520) (Loeppert and Suarez, 1996). Organic C was calculated by subtracting inorganic C from total C.
N forms were analyzed for the ridgecrest soil only. Mineral forms of N were measured on air-dried samples, extracted at UC Santa Barbara using 1 M potassium chloride and milliQ-water in a 5:1 ratio of solute to sample for 3 h. NH4+ and NO3– concentrations were determined by colorimetric analysis and measured on a micro-plate reader (Tecan Infinite Series) (Hood-Nowotny et al., 2010). Mineralization can continue during air-drying (Scherer et al., 1992); therefore, while our mineral N data can be used to infer differences within the pit, it is not representative of field conditions.
Catchment Average Denudation Rate
Denudation rates are required to determine geochemical mass-balance-derived bedrock N fluxes (Morford et al., 2016a). The cosmogenic nuclide, 10Be can be used to calculate catchment average denudation rates. 10Be accumulates in quartz grains over time by spallation from incoming cosmic rays. The flux of cosmic rays through surface regolith decreases rapidly with depth, such that the accumulation of 10Be within quartz is dependent on the cosmic ray flux and time spent by the mineral within the penetration zone – averaging over hundreds to thousands of years depending on the denudation rate (von Blanckenburg, 2006). Faster denudation corresponds to lower concentrations of 10Be and slower denudation leads to higher concentrations of 10Be in the mineral grains (Lal, 1991). Sampling sediment in stream channels utilizes the natural routing of sediment through a landscape to spatially average the denudation within the watershed (Granger et al., 1996).
We measured the 10Be in channel sands from the creek (Windmill Canyon) draining our study site to determine a catchment average denudation rate of 0.155 ± 0.019 mm yr–1 (Figure 1B). Other catchment average denudation rates previously measured for adjacent and higher order streams within the Santa Ynez Valley are similar (Figueroa Creek = 0.143 ± 0.019 mm yr–1 and Santa Agueda Creek 0.122 ± 0.017 mm yr–1), and these Santa Ynez Valley rates fall within the range of 10Be denudation rates measured across the Western Transverse range (Bingham, 2019). The channel sand sample was cleaned and 10Be isolated following standard procedures adapted from Kohl and Nishiizumi (1992), von Blanckenburg et al. (2004), and Bookhagen and Strecker (2012). Beryllium isotopes were measured at the PRIMELab (Purdue University) and the uncertainty for the erosion rates reflects the instrument error range per sample. Calculating catchment average erosion rates from concentrations of 10Be in channel sands requires the cosmic ray production rate specific to the sample watershed (von Blanckenburg, 2006). A shielding-weighting (ratio of production rate with obstruction to production rate without obstruction) matrix was calculated to account for potential blocking of cosmogenic rays within the watershed by dense or high vegetation, ice or snow, and steep topography (Balco et al., 2008). The shielding matrix for the rate used in this study was calculated using TopoToolbox (Schwanghart and Kuhn, 2010; Schwanghart and Scherler, 2014); because snow and ice are extremely rare in the study area, only a topographic shielding component was calculated. An average shielding value and the catchment outlet elevation was input to the online Chronus-calculator (Balco et al., 2008) and a Lm-scaling scheme (Nishiizumi et al., 1989; Lal, 1991; Stone, 2000) was used to convert 10Be concentrations into denudation rates.
Mass-Balance-Based N Flux Estimate
We estimate the bedrock-derived N flux at the ridgecrest location using the mass balance of several proxy elements and a measure of denudation rate (Riebe et al., 2003; Morford et al., 2016a). Our estimated rock-derived N weathering flux (WN,e) was calculated using a set of elements (Si, K, P) assumed to share biogeochemical characteristics with rock-derived N, and hence provided bounds on rock N mobility. Si provides a low weathering flux estimate given its relatively low solubility in near-neutral pH soils prevent leaching losses from the profile (Elgawhary and Lindsay, 1972). K is often replaced by NH4+ within silicate minerals due to similar ionic radii (Juster et al., 1987; Holloway and Dahlgren, 2002). Lastly, P offers a proxy for bedrock-derived N because Pis second to N as a major plant nutrient and primarily derived from bedrock (Vitousek et al., 2010). We did not use sodium (Na), despite previous work using Na for continental- and global-scale weathering models focused on rock-derived N fluxes (Houlton et al., 2018). Na concentrations in the A horizon of the ridgecrest pit were elevated in the soil relative to the parent material (Supplementary Table 3), reflecting the proximity of our study site to marine aerosol sources (∼25 km from the coast), which would bias weathering calculations.
Mass loss in the mobile soil can be quantified using a mass-balance approach (Brimhall and Dietrich, 1987; Chadwick et al., 1990). High field strength elements are less likely to be chemically mobile within a soil profile and can be used as a normalizing index element (i) against which biologically relevant elements (j) can be referenced to understand chemical weathering. We use the index element to calculate change in individual elements within the soil (w) and saprolite bedrock (w) relative to their concentrations in unweathered bedrock (p). This chemical mass transfer coefficient (t) (Eq. 1) provides relative loss or gain of an element within the soil (Brimhall and Dietrich, 1987; Chadwick et al., 1990).
Here, we use titanium as the “immobile” index element – see the (Supplementary Figure 2) for further discussion on the choice of index element. The elemental composition of parent material was determined by depth-averaging concentrations across samples collected from 250 to 415 cm in the ridgetop pedon, which we identified as unweathered parent material. Positive t values indicate additions relative to the parent material, whereas negative values indicate losses relative to the parent material.
We combine our 10Be-measured denudation rate (D, mm yr–1) with a profile averaged t value for a given element (Taue or te, unitless), the concentration of the N in the parent material (CN, mass fraction), and the bulk density (B, g cm–3) estimate for the parent material provides the proxy derived flux of N (WN,e, kg ha–1 yr–1) from the parent material to the mobile soil (Eq. 2; Morford et al., 2016a).
Nitrogen Isotope Analysis and Mixing Model
Ground samples (25–35 mg subsample, duplicated) were foil wrapped and natural abundance isotopes of total N were measured at UC Davis Stable Isotope Facility using a PDZ Europa ANCA-GSL elemental analyzer connected to a PDZ Europa 20–10 isotope ratio mass spectrometer. Instrument error for these measurements is ± 0.3‰ for δ15N and the range in standard deviation for a set of samples run in triplicate was 0.41 – 0.71‰ for δ15N (n = 4 samples). Nitrate δ18O and δ15N were measured on water extracts following the microbial denitrifier method (Sigman et al., 2001) at the Facility for Isotope Ratio Mass Spectrometry at UC Riverside. Pseudomonas aureofaciens was used for determining δ18O and δ15N in all samples on a Thermo Delta V isotope ratio mass spectrometer (Thermo Fisher Scientific) and the Gas Bench interface. The international reference materials United States Geological Survey (USGS)-32, USGS-34, and USGS-35 were included in each analytical run. Uncertainty for this method is ± 0.5‰. Isotope data are presented in delta notation using air as the standard (Eq. 3).
We developed a simple isotope mixing model to validate our mass-balance-based rock N fluxes. We assumed that the bulk soil δ15N value was a product of the inputs and outputs at steady-state with respect to N (Brenner et al., 2001). We based our model on a modified version of the steady-state solution of Brenner et al. (2001) which designated that the corresponding δ15N signature of the bulk soil as the sum of the flux-proportional fractions of δ15N from each input divided by a fractionation factor which accounts for the change in δ15N when soil N is transferred out of the soil reservoir via leaching or gaseous loss (Eq. 4). We modified this model by including rock-derived N as an additional input along with atmospheric deposition and N fixation (Eq. 5). Numerical modeling of N isotope dynamics in soils and plants over time using a box-model framework indicated that Californian grassland soils similar to those at our field site reach N steady-state in a few thousand years (Brenner et al., 2001). We assume a constant weathering flux over the residence time of our soil (using denudation rate and 1-m soil depth: ∼6,450 years), allowing the input of rock-derived N to also be in steady-state with respect to N.
We parametrized a mixing model to solve for the Nfluxrock (Eq. 6). We used data from the 3–40 kyr terraces (which bracket the residence time of the ridgecrest soil) studied in Brenner et al. (2001) to supply values for the fractionation factor (αex, encompasses fractionation for all pathways of N loss: 0.9906–0.9965). This factor was estimated in Central California at a site that supports similar vegetation (forbs and annual grasses, including the dominant species at our site) in soils formed in comparable parent material (terrestrial sediments – although more influenced by granitic rocks than those at our site) and features a similar climate (MAT = 16°C; MAP = 310 mm; winter-dominant precipitation; Brenner et al., 2001); hence we consider it and appropriate analog for our study site. Previous studies in California grasslands provide an estimate of N fixation inputs (Nfluxfix = 0.9–3.1 kg ha–1 yr–1 and δ15Nfix = 0‰: Jones and Woodmansee, 1979; Cleveland et al., 1999; Brenner et al., 2001). Total atmospheric N deposition (Nfluxatm = 7.1 ± 1.1 kg ha–1 yr–1) was obtained from 30-km2 grid cell N deposition rasters at our study site location (National Atmospheric Deposition Program (Nrsp-3), 2019), summing wet and dry deposition of all N forms and averaging over the years 2000–2019. The range of δ15N signatures for atmospheric deposition is highly variable, we followed Brenner et al. (2001) and used a range of δ15Natm signatures (δ15Natm = −5 and 5‰) sourced from Hoering (1957), Heaton (1986), and Garten (1992). Remaining model inputs were determined using mean and standard deviations obtained from this paper (δ15Nsoil, and δ15Nrock).
We evaluated the rock N flux by propagating uncertainty from the parameters listed above using Monte Carlo simulations. The error in the field-measured parameters (δ15Nsoil and δ15Nrock) and Nfluxatm was modeled by generating normal distributions using standard deviations and means listed above. In the case the remaining parameters (αex, Nfluxfix, δ15Natm) only ranges were available and so errors were modeled by drawing from uniform distributions bounded by the minimum and maximum estimates. δ15Nfix was not varied. We drew random samples from each parameter distribution 10,000 times and computed Nfluxrock – these estimates were used to define a distribution for Nfluxrock given uncertainty in the parameters of Eq. 6. Using this distribution, we obtained a 95% confidence range for the N flux estimate from empirical quantiles (Buckland, 1984).
Results
We first examined trends in total C and N and inorganic N pools to characterize the distribution of organic matter and N species within the ridgecrest soil profile. Then we used mass balance of several proxy elements to calculate an estimated chemical weathering flux of bedrock-derived N to the soil in the ridgecrest location. We also determined the bedrock-derived N flux using an isotope mixing model and compare our Nfluxrock estimates form these two approaches. Finally, we collected soil δ15N for the backslope and toeslope locations to interpret changes in influence of rock-derived N downslope.
Carbon and Nitrogen Concentration Depth Patterns at the Ridgecrest
Concentration-depth patterns for C and N were observed in the soil, saprolite, and bedrock. Organic carbon was highest in the surface soil and declined below 20 cm (∼0.5 wt. % or less; Figure 3A). Inorganic carbon was prevalent in the subsoil and in specific facies of the saprolite and bedrock (Figure 3A). In the soil, inorganic carbon increased dramatically from 60 to 100 cm, observable as a shift in soil color at ∼60 cm (Figure 2). In the saprolite and bedrock, inorganic C was variable but peaked in specific facies at ∼150 and 325 cm depth. Total N was highest in the A horizon (0–20 cm depth), declined in the B horizons (20–100 cm depth), and then increased again in the Cr or saprolite (below 100 cm, Figure 3B). At all depths, total N tended to be lower when inorganic C was present. The mean bedrock N concentration was 0.064 wt. % and was slightly lower than the depth-averaged soil N concentration of 0.095 wt. %. The organic C: total N ratio was relatively high in the soil and then declined below 100 cm, with peaks at depth corresponding with increases in organic C (Figure 3C).
In the ridgecrest soil, NO3– was highest in the A horizon (0–20 cm), declined through the soil and saprolite, and peaked again around 175 cm before declining again in deeper saprolite and bedrock (Figure 4A). Like NO3–, NH4+ was elevated near the surface, declined through the soil and upper saprolite, and also increased at approximately 175 cm depth. However, in contrast to NO3–, NH4+ remained elevated through the lower saprolite and bedrock (Figure 4B). Chloride reached its maximum in the A horizon and then persisted at low concentrations through the subsurface soil, saprolite, and bedrock (Figure 4C).
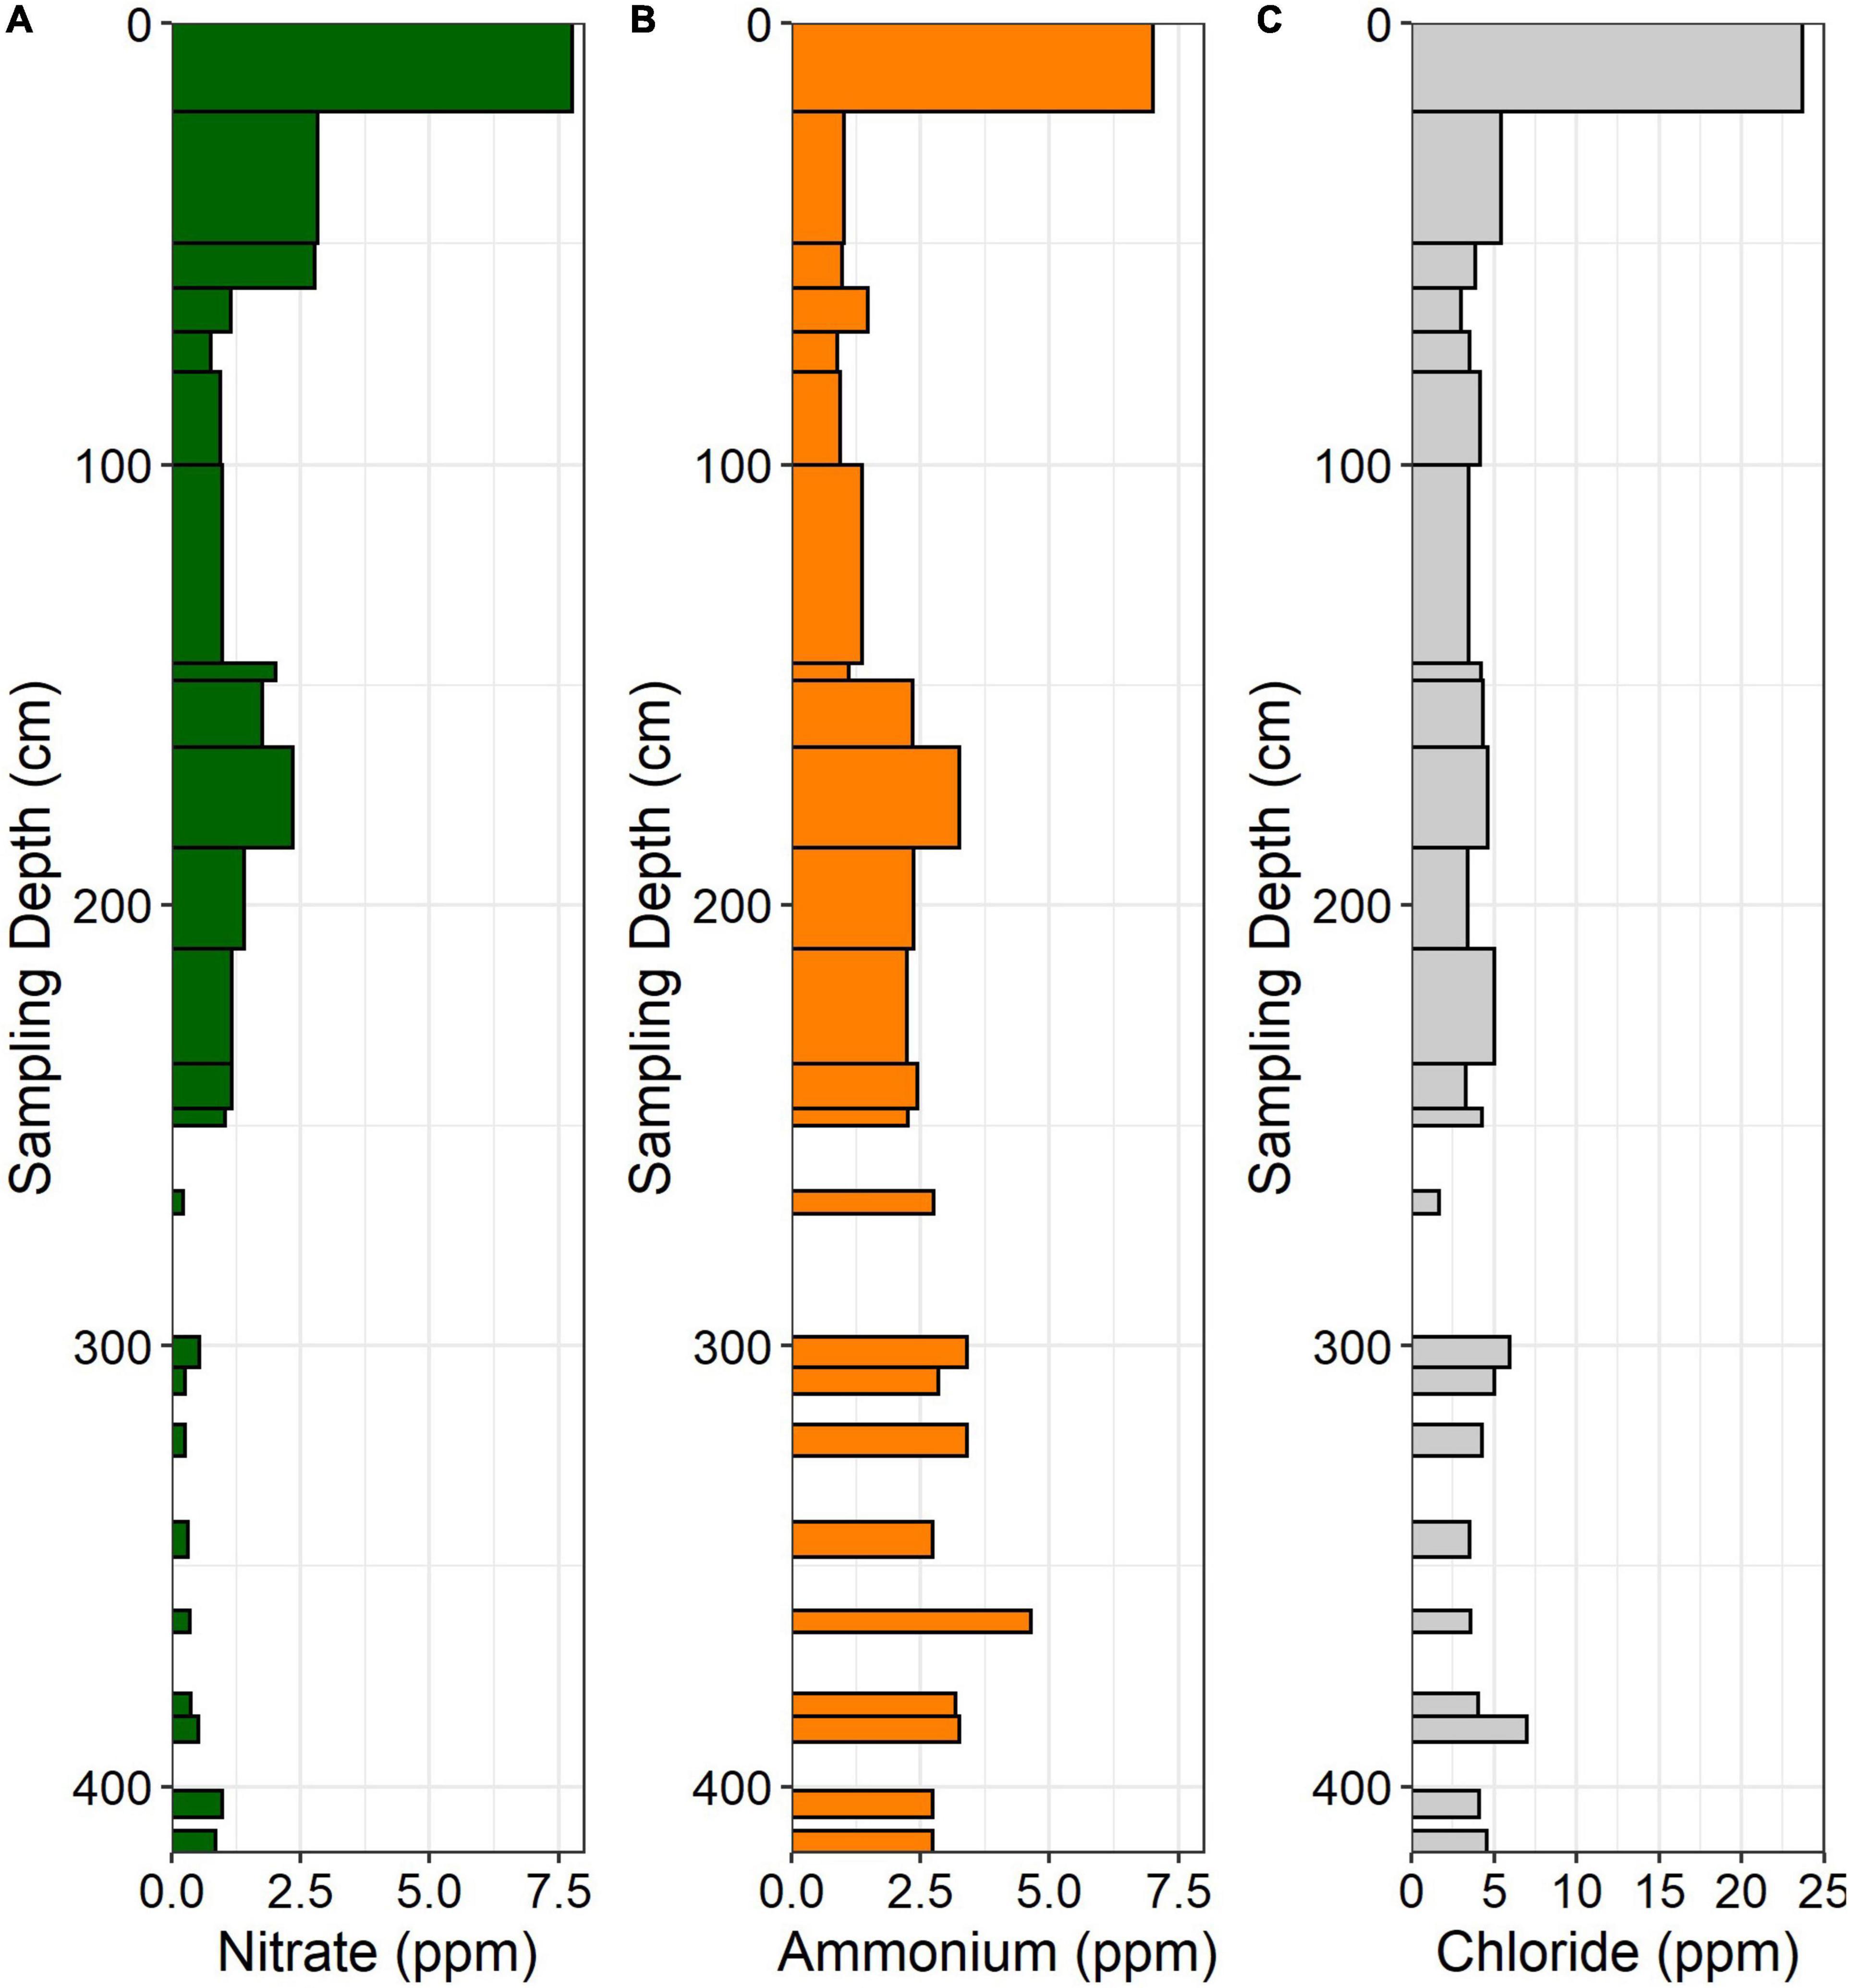
Figure 4. (A) NO3–, (B) NH4+, and (C) Cl– concentrations in the ridgecrest soil pit. Data are in ppm (mg N per kg soil). Gaps in data indicate samples not taken at depth.
Geochemical Mass-Balance-Based N Flux Estimate
We utilized proxy elements (Si, K, P) for calculating the fractional loss of N in conversion of bedrock to soil in the ridgecrest pedon. We evaluated changes in these proxy elements throughout the mobile soil (0–100 cm depth) relative to the parent material (250–415 cm depth). We found a range of chemical depletion: P was moderately depleted, while Si and K were relatively less depleted (Figure 5). Si was the least depleted element, with small apparent losses in the horizons with higher inorganic C deeper than ∼60 cm. K was most depleted between 20 and 60 cm, but then slightly enriched at the base of the soil (79–100 cm). P was depleted within the soil (>35% loss in every horizon) but showed no loss in the saprolite (Supplementary Table 3). Integrating across the soil column provided a range of Taue required for estimating N-flux (Table 1). Using the catchment average denudation rate, the measured rock N concentration and bulk density from the ridgecrest pedon, and the proxy element Taue, we estimated the rock-derived N flux for the ridgecrest soil to be 0.145–0.896 kg ha–1 yr–1 (Table 1).
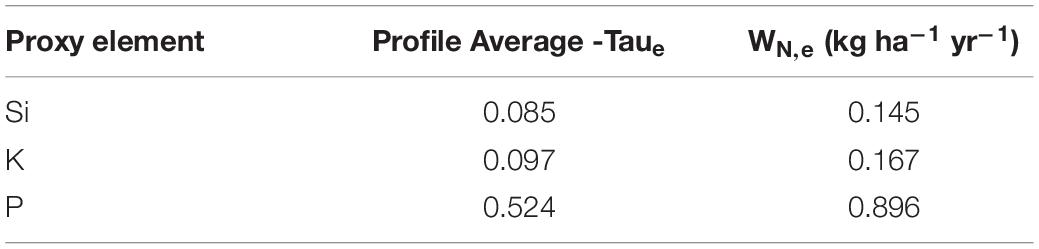
Table 1. Estimates for N flux using a bedrock bulk density of 1.733 g cm–3, a denudation rate of 0.155 mm yr–1, and a bedrock N concentration of 0.064 wt. %.
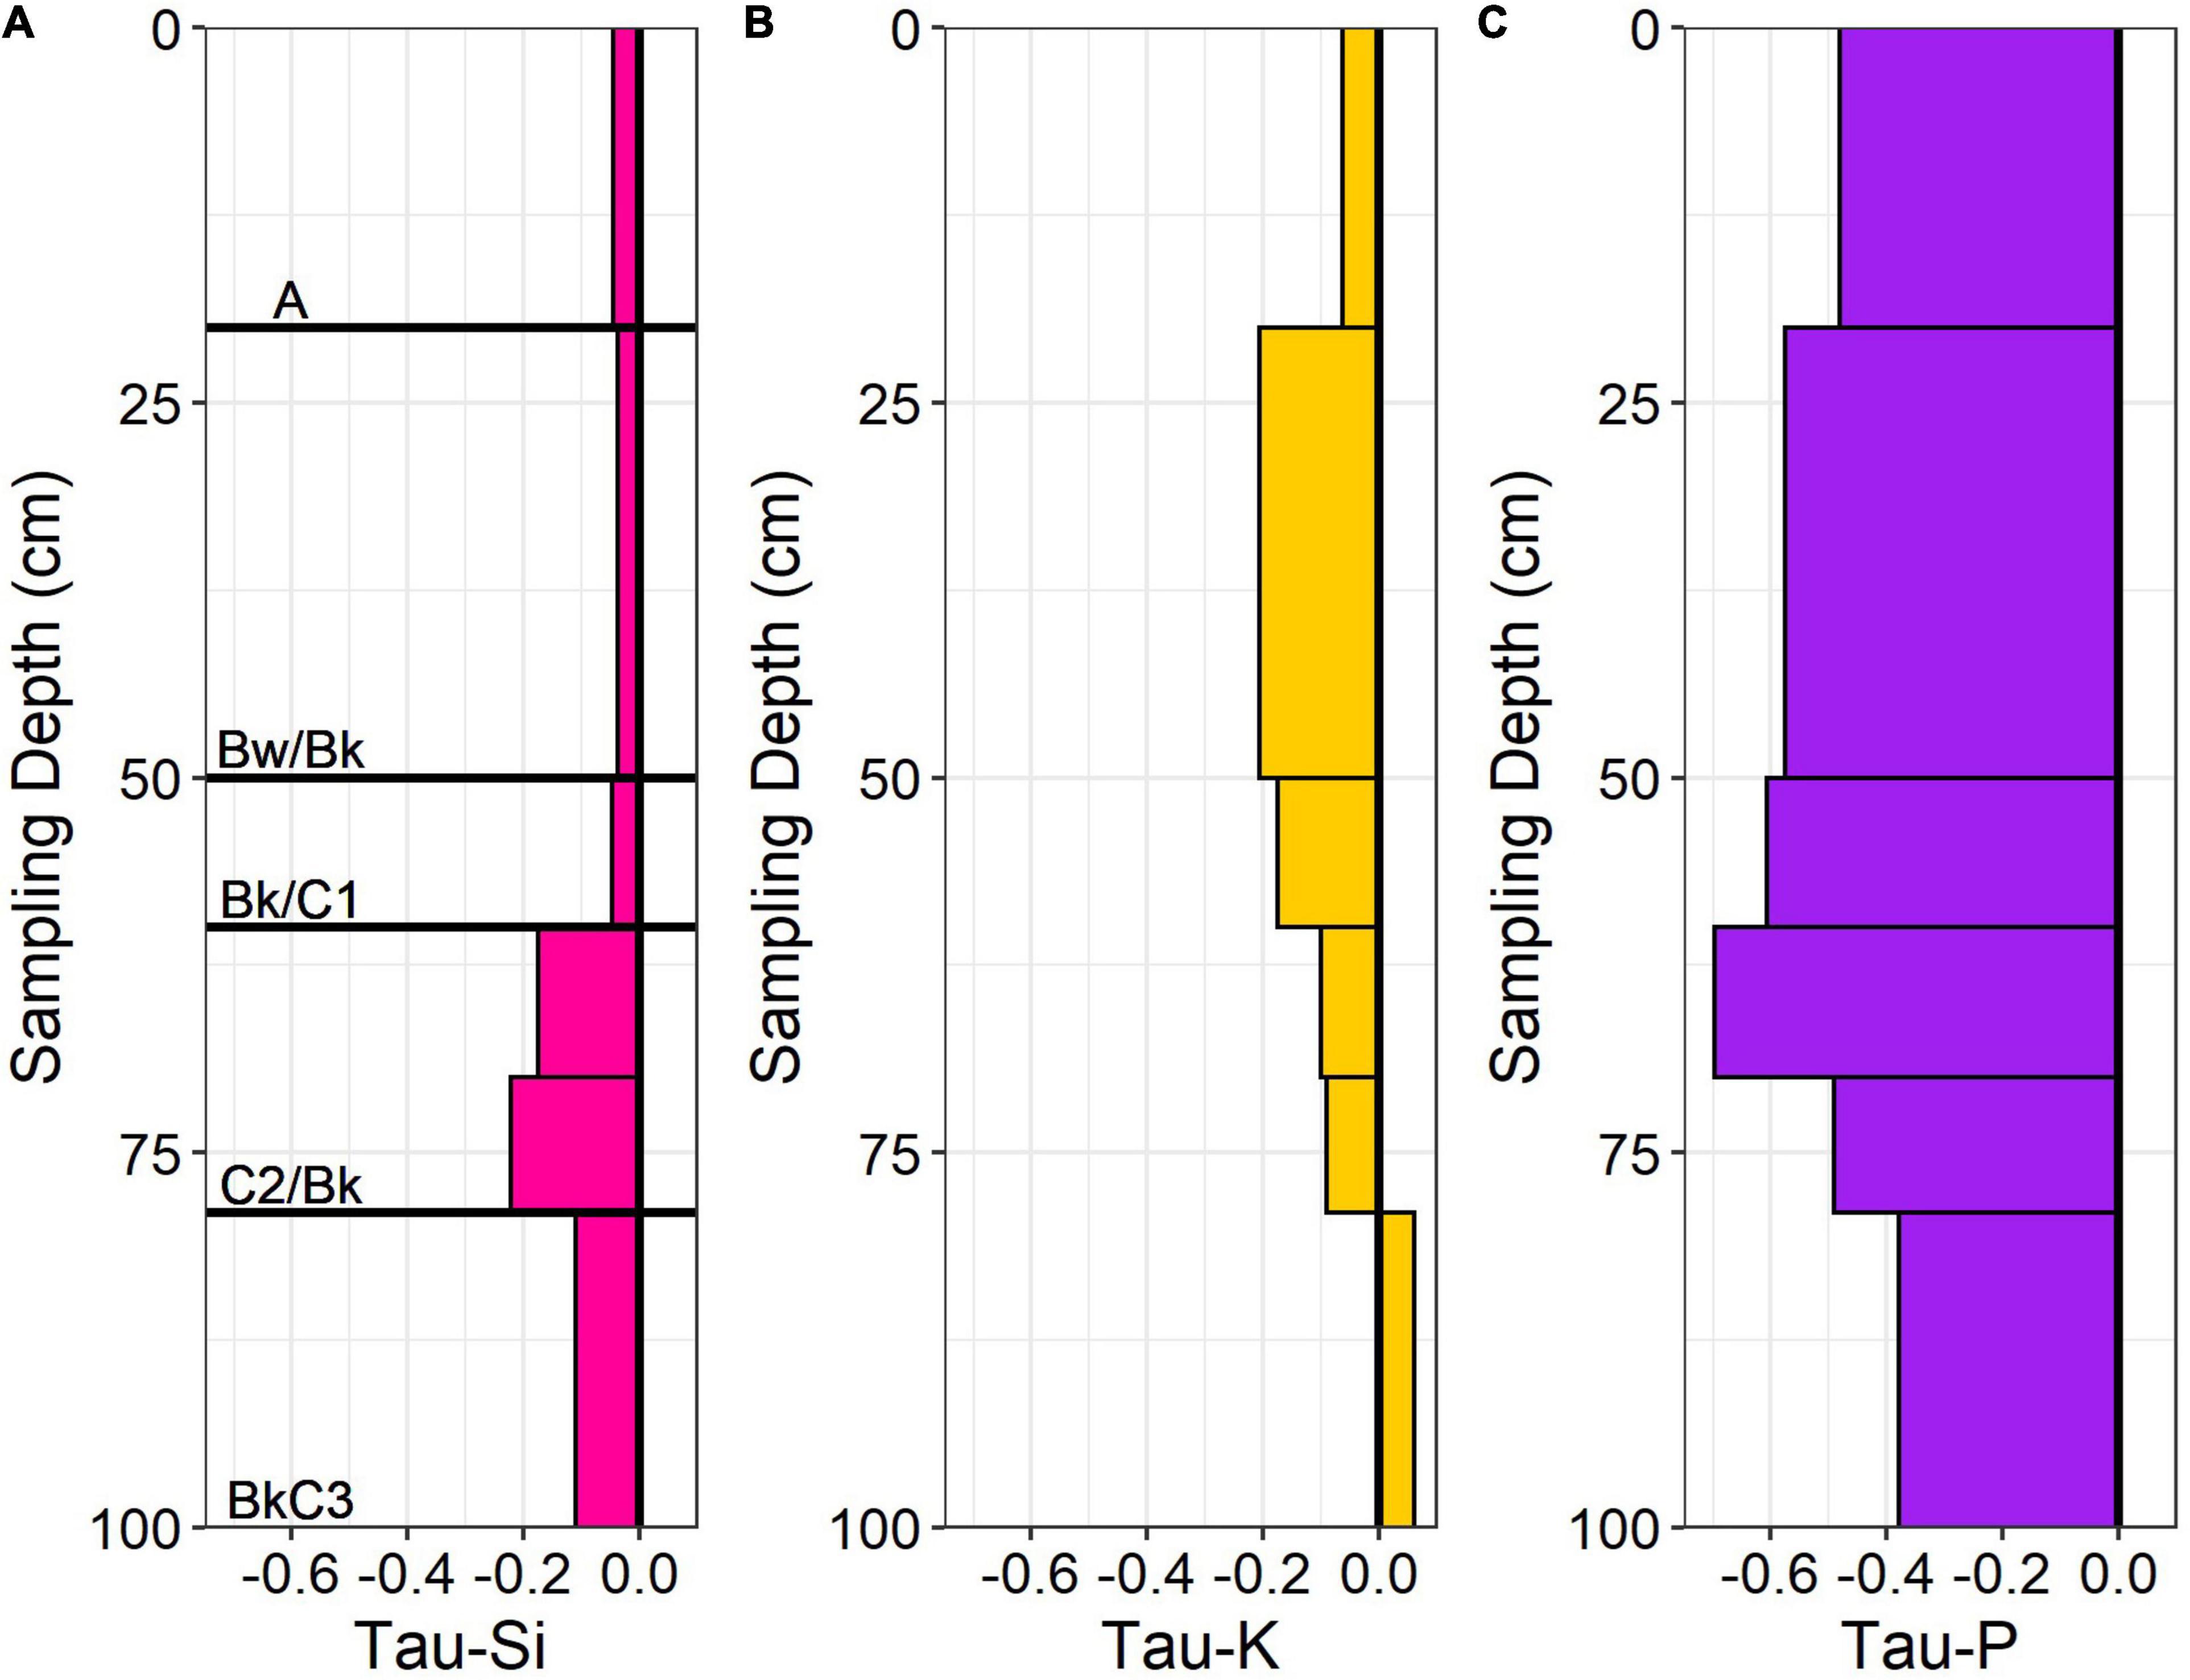
Figure 5. Geochemical mass balance (Tau) profiles of (A) Si, (B) K, and (C) P using Ti as the reference element for the ridgecrest soil (0–100 cm). The value of 0 indicates no change between parent and soil values, positive values indicate additions (+) and negative values indicate losses (−). Major horizons identified for the soil indicated on (A).
N Isotope-Depth Pattern and Mixing Model
We used 15N to characterize different N pools in the weathering zone and to develop secondary estimates of the rock N flux using an isotopic mixing model. The δ15N of the ridgecrest pedon showed a distinct break at the soil-saprolite boundary (Figure 6), indicating that the soil and bedrock had distinct δ15N values. The mean ± SD δ15N value for soil samples was 3.566 ± 0.426‰ and the mean ± SD δ15N value for saprolite and bedrock samples was 6.044 ± 0.578‰.
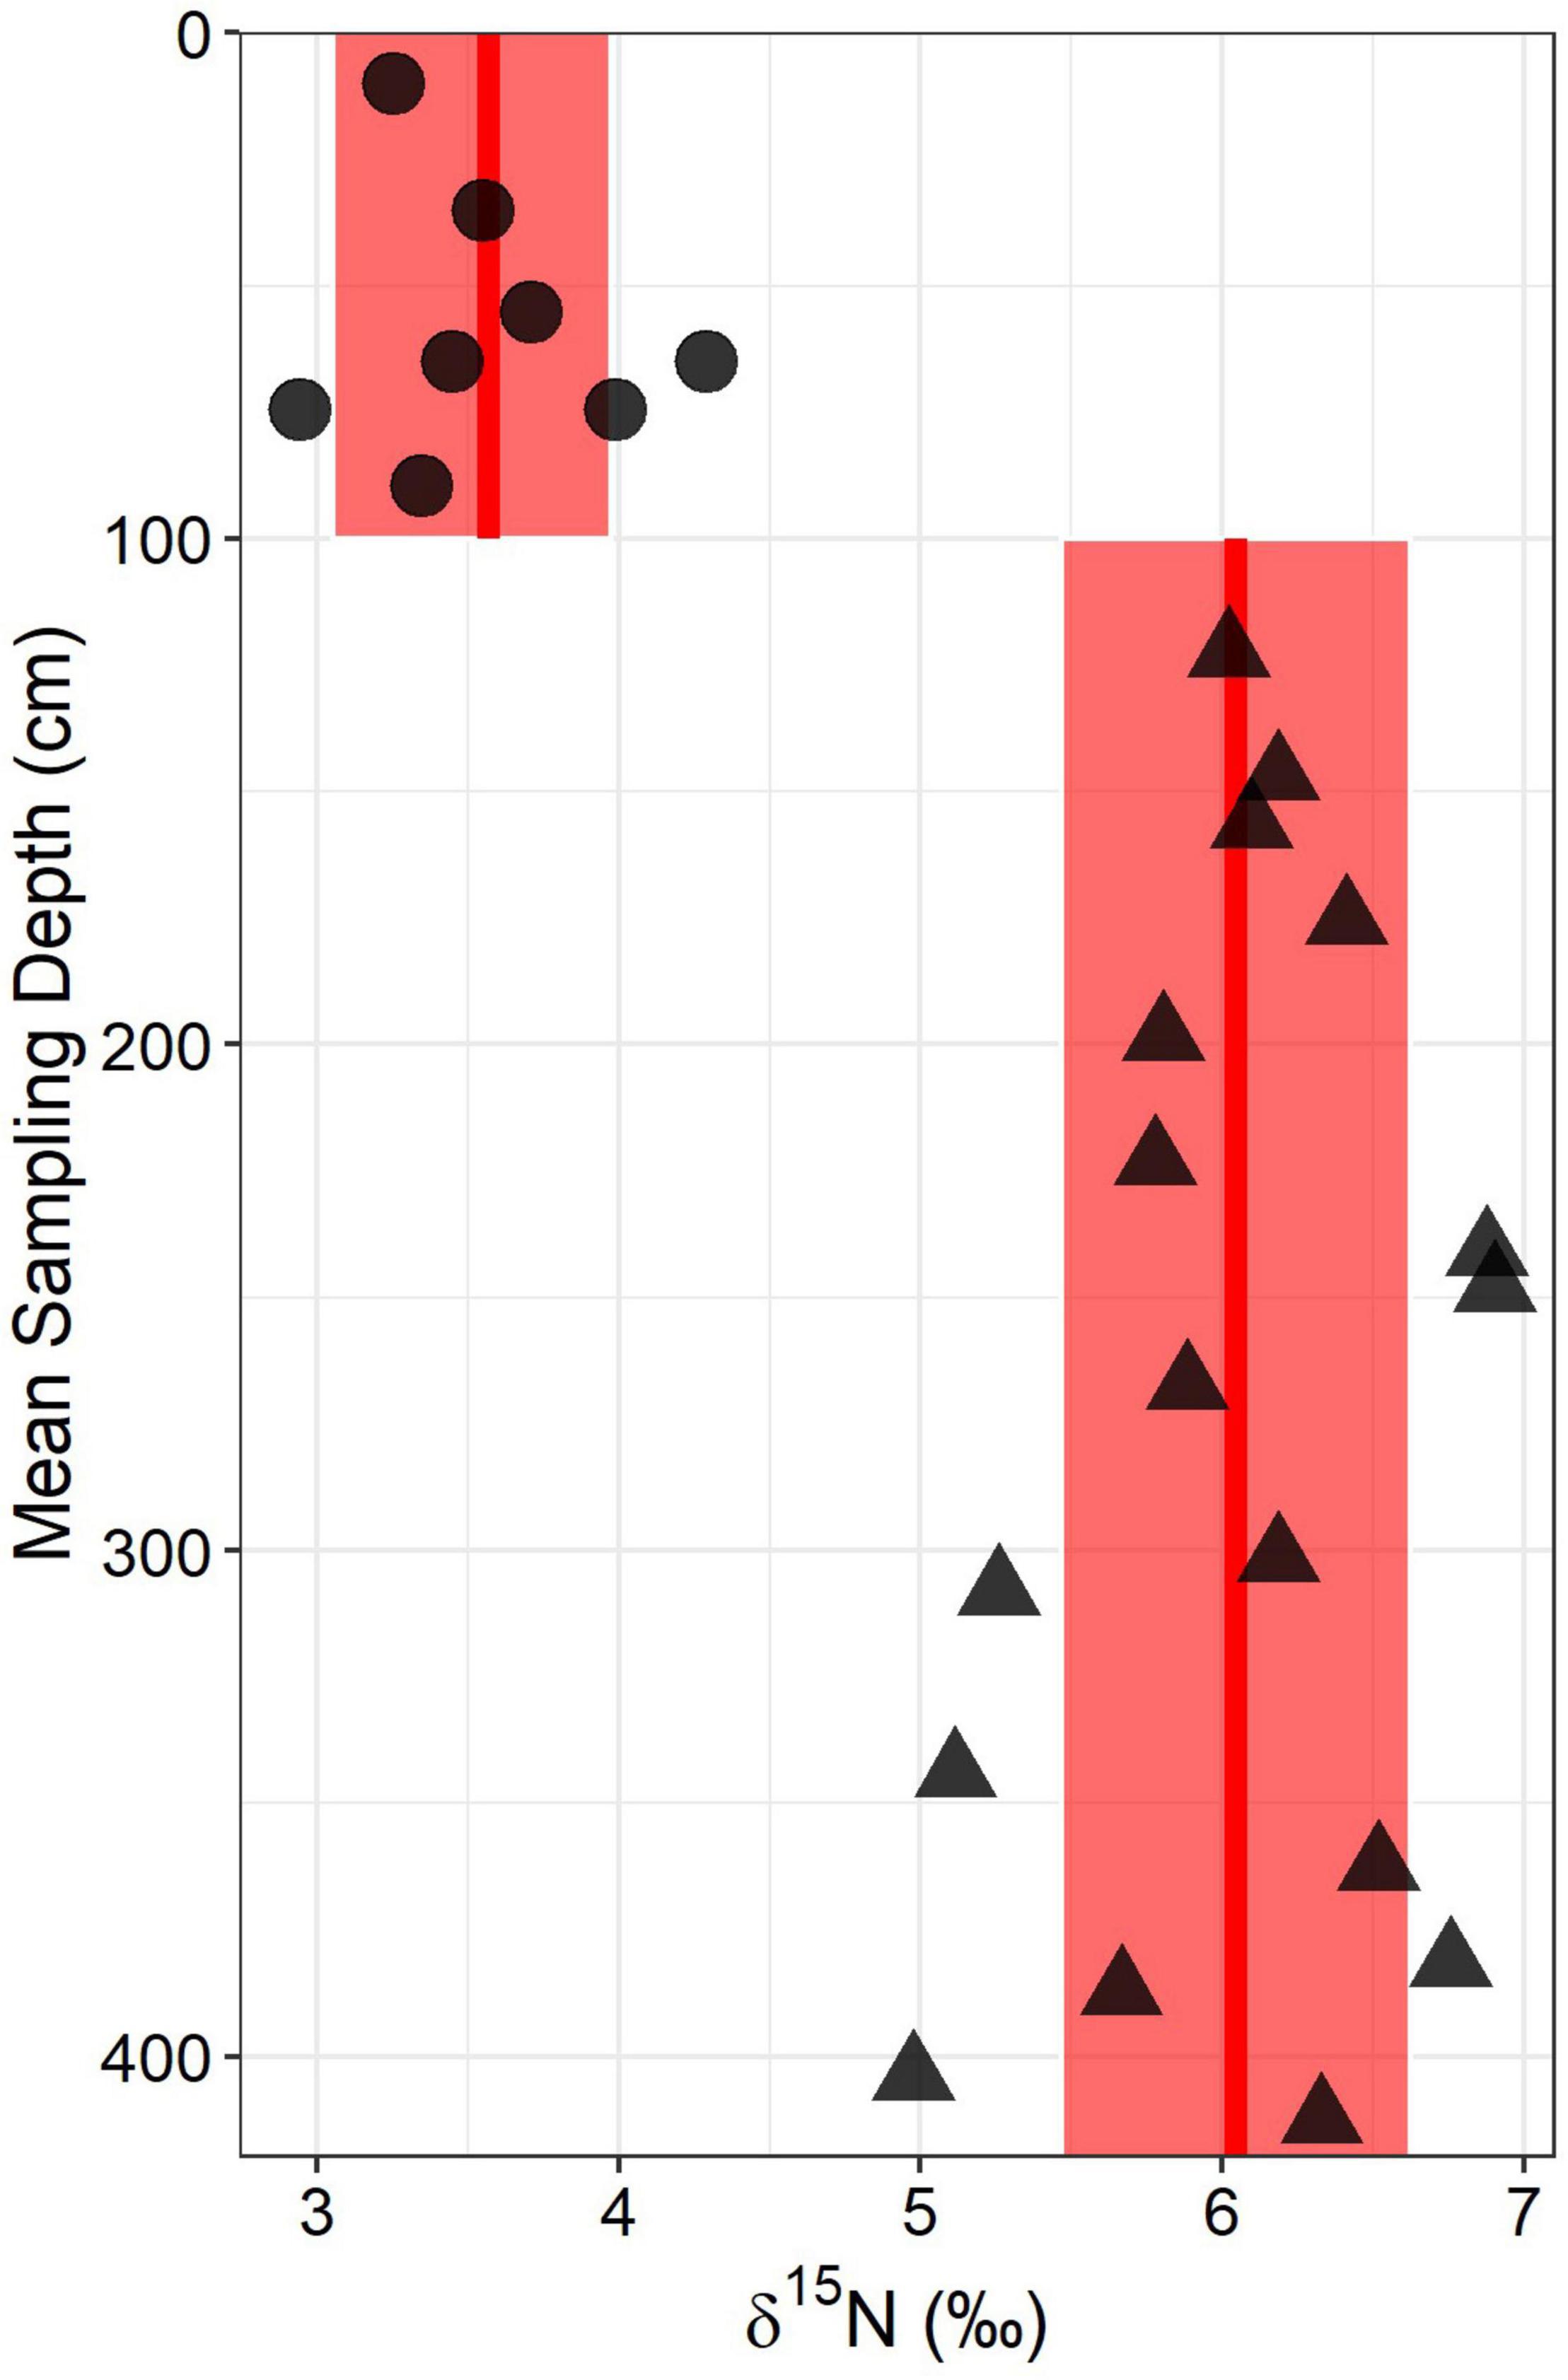
Figure 6. Total soil- δ15N depth profile for the ridgecrest location. Circles represent soil (0–100 cm) samples whereas triangles represent saprolite and bedrock samples (>100 cm). Red lines and shaded boxes indicate mean values and ± one standard deviation from the mean for the two groups of points. Points at the same depth reflect sampling of horizons where there was both shale fragments and soil present (50–60 and 60–70).
Given the distinct δ15N values of the soil and rock (Figure 6), we used an isotope mixing model (Eq. 6) to estimate a rock-derived N flux and compare against our rock-derived N flux estimates calculated using element proxies. To parameterize the model, we used studies from similar ecosystems (Mediterranean grasslands) to supply fractionation factors, fluxes, and δ15N values for atmospheric N deposition and N fixation (see section “Materials and Methods”). The ridgecrest pedon bulk δ15N data provided values for δ15Nrock and δ15Nsoil. We solved for bedrock-derived N flux using Monte Carlo simulations to propagate uncertainty (Figure 7). The mixing model results produce a wide range of Nfluxrock, with 95% of the estimates derived from the Monte Carlo simulation falling between −1.1 and 44.2 kg ha–1 yr–1. Given the wide range of flux estimates, the isotopic mixing model approach did not appear adequate for constraining the rock N flux.
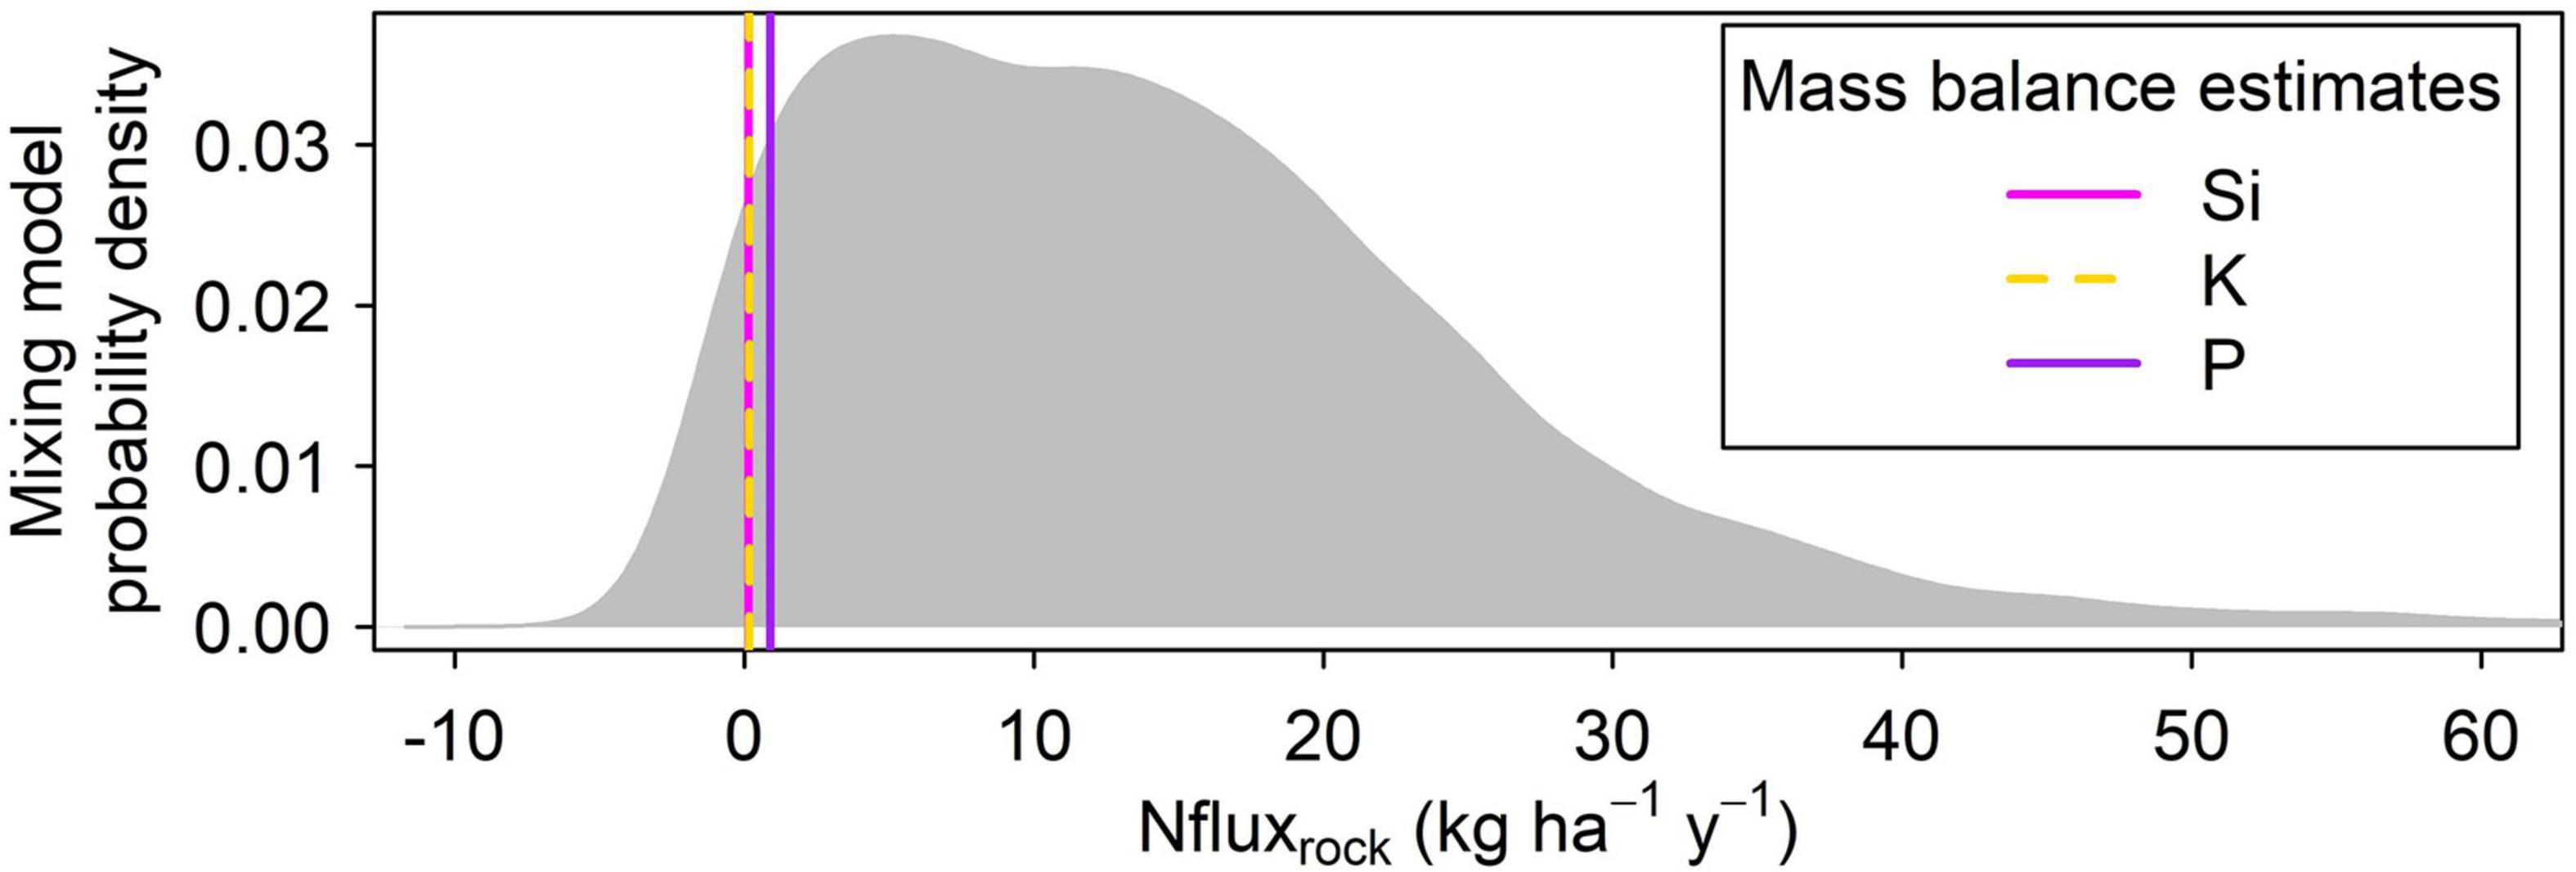
Figure 7. Monte carlo simulation results. The gray probability distribution shows results from 10,000 estimates of the rock-N weathering flux based on 15N constraints (Eq. 6), with parameters drawn randomly published ranges and values measured in this study (Methods see section “Mass-Balance-Based N Flux Estimate”). Estimates of the rock-N weathering flux based on geochemical mass balance calculations are shown for comparison with vertical lines: magenta = Si; yellow = K; purple = P. The empirical 95% confidence range of the 15N-based estimate spans from –1.1 to 44.2 kg ha–1 y–1, indicating that the range of possible rock N fluxes consistent with soil N isotopes is large and encompasses zero.
Downslope Changes to N Flux
We examined two downslope soils – a backslope position and a toeslope position – and use δ15N data to interpret the relative importance of rock-derived N across the hillslope. All of the δ15N values for the backslope and toeslope soils were depleted relative to the mean bedrock δ15N measured at the ridgecrest (Figure 8). The backslope and toeslope soils are much deeper than the ridgecrest soil (soil material extending to 3+ meters at both sites) and show no distinct groupings of δ15N values with depth (Figure 8). The backslope soils tended to have slightly more enriched signatures than the toeslope soils, particularly within the first meter of soil. The most enriched δ15N values were immediately below the surface soil in both the backslope (5.32‰) and the toeslope (4.15‰) positions. The deepest soils in the toeslope have the most depleted δ15N values (∼2.5‰), suggesting little direct rock N contribution.
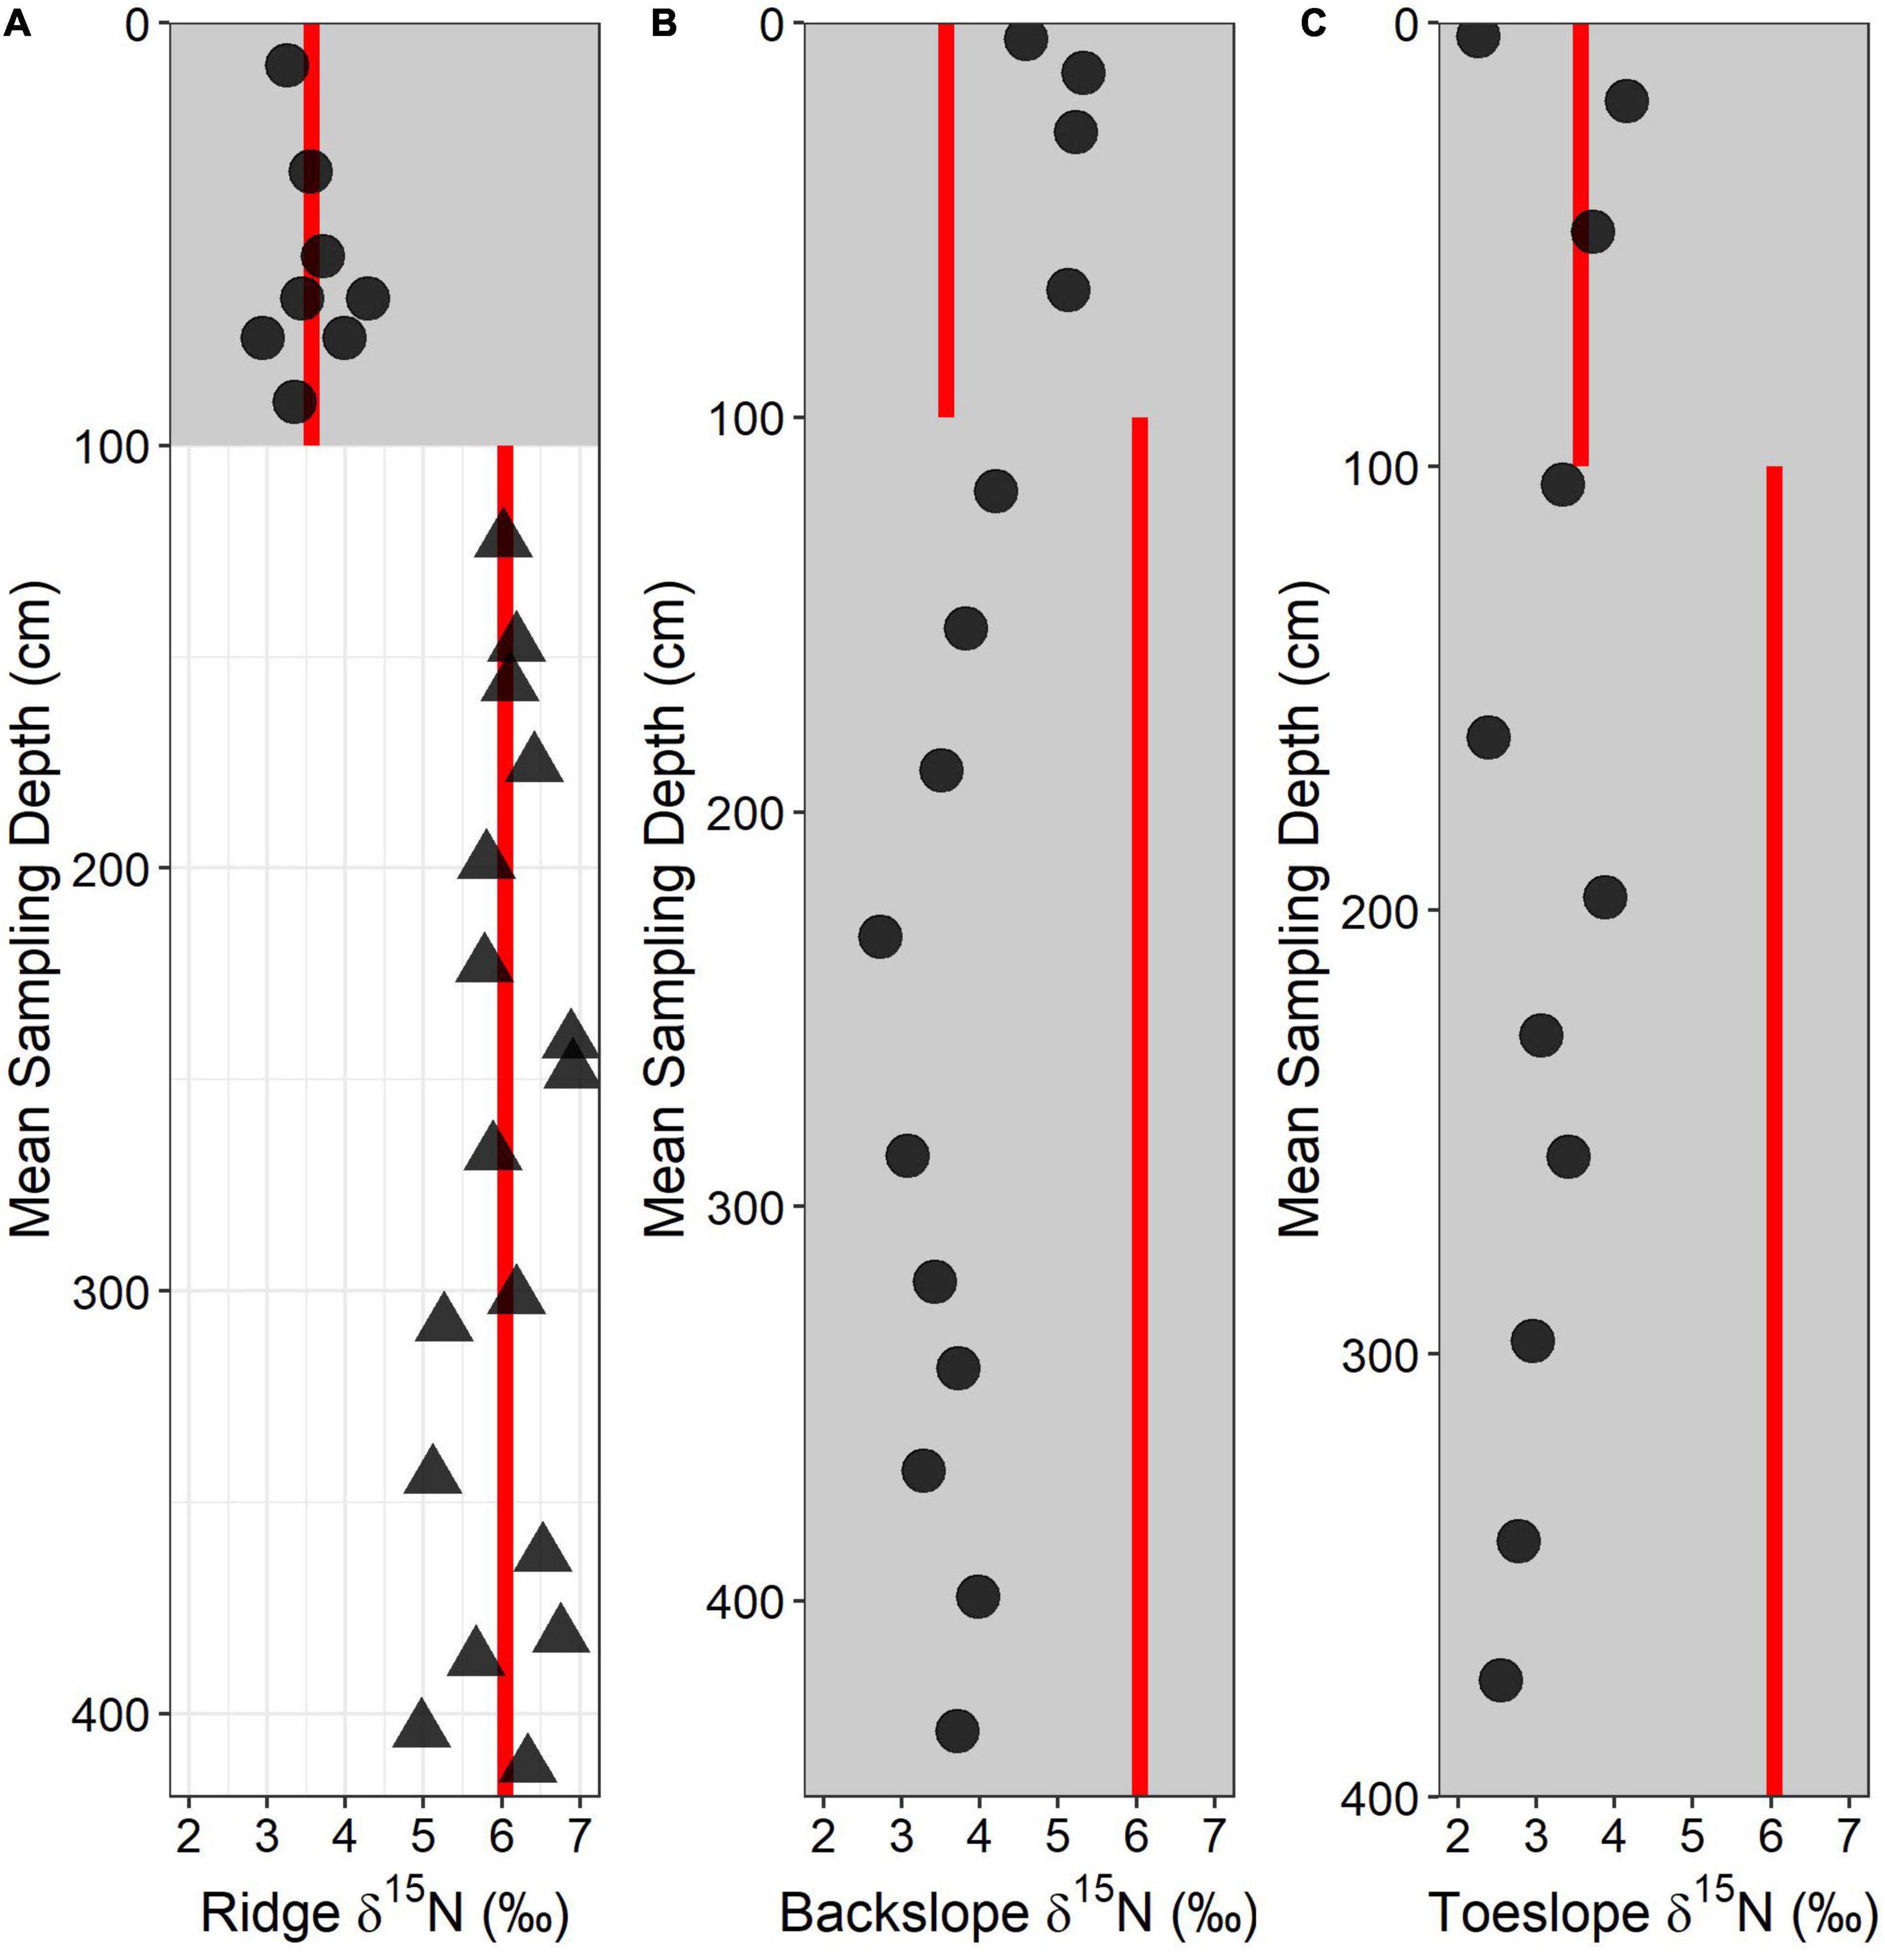
Figure 8. Total soil-d15N depth profile for (A) ridge, (B) backslope, and (C) toeslope soils. Circles and gray shaded area represent soil samples whereas triangles and no shading represent saprolite and bedrock samples. Red lines indicate mean values of the soil and saprolite/rock d15N values from the ridgecrest soil.
Discussion
We examined the flux of rock-derived N into their overlying soils in a semi-arid, Mediterranean grassland ecosystem. We hypothesized that our estimates for ridgecrest rock-derived N flux would be low compared to fluxes estimated in wetter climates and that this rock-derived N flux would decrease downslope. We found a comparatively low rock-derived N flux, 0.145 to 0.896 kg ha–1 yr–1 at the ridgecrest as estimated by elemental proxies. Depth profiles of bulk soil δ15N for downslope soils suggested little evidence for the presence of rock-derived N within the soils farther along the catena.
Ridgecrest Rock-Derived N Dynamics
Multiple lines of evidence indicate that there is a substantial amount of N locked in the rock at our study site. The ridgecrest pedon had isotopically distinct soil and bedrock nitrogen pools, and geochemical analyses showed that there was substantial amount of N well below the lower boundary of soil in saprolite and unweathered rock (Figure 3). NH4+ concentrations were high within the bedrock and declined in the upper saprolite (100–175 cm) (Figure 4B). Together, these facts suggest that the sedimentary bedrock harbors N, part of which is held as exchangeable NH4+ – likely predominantly bound to clays with a secondary contribution from exchange sites on organic molecules, given the relatively low organic carbon concentrations in the rock (<0.5 wt. %). Because exchangeable NH4+ was only a small fraction of the total N pool in the rock (∼2.5 ppm N versus ∼0.1 wt %; Figures 3B, 4B), the bulk of the rock N must be bound in less available forms. These could include a combination of organic N and more tightly bound inorganic forms, given that organic C was present throughout the rock but organic C to N ratios were low (C:N < 4; Figure 3C). Tightly bound inorganic N might include NH4+ irreversibly fixed in phyllosilicate mineral interlayer spaces (Holloway and Dahlgren, 2002; Skiba et al., 2018). Unlike exchangeable NH4+, this N would not be extractable with KCl, and would also be less available to plants or soil organisms relative to organic or exchangeable forms (Holloway and Dahlgren, 2002). If we assume that the lower limit of the (molar) C:N ratio of fossil organic matter in the parent material is 6.5 (Reiners, 1986), this suggests that roughly 39% of the rock N may exist as organic N, with the remainder comprised of exchangeable and more tightly bound inorganic forms. Similarly, NH4+ was a dominant N species in a nitrogen-rich marine shale bedrock studied in the Upper Colorado River Basin (Wan et al., 2021).
The composition and depth-distribution of mineral N pools at the ridgecrest suggested that rock N was being oxidized at the soil-bedrock interface, although this evidence was not conclusive. Specifically, NH4+ concentrations declined in the upper saprolite (100–175 cm) while NO3– concentrations increased (Figure 4A), which could reflect the role of microbial nitrifiers in weathering N in the saprolite. Similarly, nitrification in the subsurface zone of highest rock weathering was a source of subsurface NO3– in the Upper Colorado River Basin (Wan et al., 2021). Alternatively, NO3– concentrations at depth in arid and semi-arid environments can result from NO3– leaching (Walvoord et al., 2003); however, subsurface pools of NO3– are typically accompanied by subsurface accumulation of other mobile ions like chloride, which was not observed in this soil (Figure 4C). Furthermore, δ18O-NO3– values show little sign of atmospheric influence on the NO3– at depth with values at 175 cm much depleted (<3‰) relative to the surface (8.54‰; Supplementary Figure 2B). Our data thus show little evidence of downward NO3– mobilization, leaving open the possibility that microbial nitrification is responsible for oxidizing bedrock-derived N and generating NO3– in the saprolite.
We found that δ15N values in the soil were distinct from the relatively enriched saprolite and bedrock δ15N values (Figure 5). The relative homogeneity of the soil may be an indicator of extensive mixing (Hobbie and Ouimette, 2009) – and the profile showed significant evidence for bioturbation by gophers (Figure 2 and Supplementary Table 1). The depth of gopher bioturbation also corresponds closely with the base of the soil (Figure 2 and Supplementary Table 1). This clear separation between the soil and bedrock N isotopic signatures gives us confidence in using soil δ15N and rock soil δ15N to parametrize the isotope mixing model (although atmospheric inputs were harder to constrain – see section “Ridgecrest Rock-Derived N Flux Estimate” below).
Ridgecrest Rock-Derived N Flux Estimate
We used Si, K, and P as proxies to calculate a rock-derived N flux using geochemical mass balance. The suite of elemental proxies used in this study behave differently than N – in particular, N is subject to gaseous losses unlike P, K, and Si (Chapin et al., 2011). Additionally, the high -TauP suggests P may be preferentially lost through a pathway that we were unable to identify. We speculate that removal of P in biomass due to historical grazing may partly explain this pattern, although we have no way to test this. Even given these caveats and the wide range in -Taue values (0.085–0.524), the comparatively low denudation rates for our study site limited our estimate of the N weathering flux (0.145–0.896 kg ha–1 yr–1). This suggests our flux estimate is not highly sensitive to choice of proxy element used for mass balance, but instead the magnitude of total denudation rate. Our low flux estimate, which was considerably smaller than literature derived ranges for atmospheric deposition and N fixation, indicates that rock N is a relatively minor N source at our site.
We also used an N isotope mixing model to provide an independent calculation of the rock-derived N flux. The mixing model produced a wide range of flux estimates which included negative fluxes, leading us to conclude that it was not possible to constrain the rock N flux quantitatively using the isotopic data available at our site. This large uncertainty was likely due to the significant contribution of atmospheric N deposition, which published estimates suggest was responsible for 7.1 kg N ha–1 yr–1 – far more than the literature-derived N fixation rate of 0.9–3.1 kg ha–1 yr–1, or our geochemical mass-balance-derived N fluxes of 0.145–0.896 kg ha–1 yr–1. The variation in the atmospheric 15N values (−5 to +5 ‰) means that uncertainty carried by this input exerts much control over the outcome of the model. We nonetheless suggest the isotope mixing model results are informative given previous work demonstrating soil and rock 15N values may be useful indicators of rock-derived N (Morford et al., 2011). Here, we show isotope mixing models might be used to constrain rock N fluxes in systems where atmospheric inputs are relatively small but highlight that model uncertainty increases as N inputs via atmospheric N deposition and fixation increase. In systems with high N inputs, on-site measurements of 15N atmospheric deposition and fixation become critical for models to accurately predict the contribution of rock-derived N, as these N inputs can be highly variable in both space (Elliott et al., 2019) and time (Li et al., 2019). Given the relatively high N input from atmospheric deposition and fixation at our site, our study mostly relies on the geochemical mass-balance-based estimates, which suggest a small but non-zero contribution of rock N to the ecosystem.
The range of fluxes produced by geochemical mass balance in this study are lower than those from forested soils derived from N-rich mica schist in Northern California (Morford et al., 2011, 2016a) and the marine shale in the Upper Colorado River Basin (Wan et al., 2021). Those sites receive more than twice as much annual precipitation as Sedgwick (∼1,000–1,500 mm, vs. 380 mm). Increased precipitation can drive increased chemical weathering: the studies in Northern California found chemical weathering fractions for K, Na, and N (N was derived from a silicate-N targeted extraction) between 22 and 48% across three different sites. These weathering fractions are much higher than the chemical weathering fractions for Si and K (9 and 10%, respectively), and only slightly lower than the P weathering fraction (52%). Importantly, the sites in northern California were also eroding at higher rates than our study site: cosmogenic nuclide derived denudation rates were 0.20–1.25 mm yr–1 compared to 0.155 mm yr–1. The rock-derived N fluxes estimated for the Northern California pedon studies are consequently higher: 1.6–10.7 kg ha–1 yr–1 (Morford et al., 2016a), and 3.0–10.9 kg ha–1 yr–1 (Morford et al., 2011). Thus – despite an N-rich bedrock – our study site has a relatively slow denudation rate and lower chemical weathering, which limits the flux of rock-derived N to the ecosystem.
We think that the flux estimates from our ridgecrest pit are representative of the broader landscape for two reasons. First, while rock N concentrations vary as a function of grain size in sedimentary rocks (Morford et al., 2016b), extensive soil sampling within Sedgwick Ranch in previous work (Gessler et al., 2000; Prentice, 2013; Lin et al., 2016) enabled us to carefully situate the soil pit at a site dominated by a single, fine-grained facies of the Paso Robles formation (Dibblee, 1966); hence we expect that N fluxes estimates are representative of other soils derived from this fine-grained rock. Second, denudation rates – which are a major constraint on rock N flux estimates – were broadly similar in multiple catchments across the region (Bingham, 2019). We hence consider it likely that our low rates of rock-derived N are representative for the local Santa Ynez Valley and that atmospheric deposition and N fixation dominate N supply to the soil in this area.
Changes in Rock-Derived N Flux Along a Catena
We used geomorphic theory of soil production (Heimsath et al., 1997; Yoo et al., 2009) and depth patterns of δ15N to interpret downslope changes in the flux of rock-derived N to the soil. We found varying δ15N patterns with depth for the backslope and toeslope soils which we interpreted as representative of surface inputs and biological cycling. With increasing soil depths, the soil production rate decreases, reducing the flux of rock-derived elements to the soil (Heimsath et al., 1997; Yoo et al., 2009). The very low rock-derived N flux rates at the ridgecrest (where soil depths are shallowest), imply almost negligible rock-derived N fluxes in backslope and toeslope positions where soil depths reach 3 to 4 m and are composed of colluvium derived from upslope (Gessler et al., 2000; Gabet et al., 2005). Some δ15N values were slightly enriched beyond the ridgecrest soil mean value (>3.57‰), but these values were in near-surface soils, far from the source of bedrock N. Given the very low rock-derived N fluxes at the ridgecrest and the proposed lower flux downslope, biological cycling is the most likely explanation for the enriched δ15N values observed in the backslope and toeslope soils. At this study site, decomposition during downslope transport is thought to account for the lower concentrations of C and N in the backslope and toeslope soils relative to upslope soils (Lin et al., 2016). While δ15N values at the ridgecrest provide a clear distinction between bedrock and soil, the depth patterns break down across the hillslope where biological cycling during transport can obscure isotope endmembers.
Conclusion
We examined N dynamics at pedon and hillslope scales and estimated the first rock-derived N flux for a semi-arid climate with sedimentary lithology. We found high concentrations of N within the soil and the underlying saprolite and unweathered bedrock. We also found evidence suggesting conversion of bedrock derived NH4+ to NO3– within the saprolite, a potential pathway for rock-derived N introduction into the ecosystem. The rock-derived N flux for the study site is between 0.145 and 0.896 kg ha–1 yr–1 as determined by geochemical mass balance proxies. The rock-derived N flux is low due to slow denudation rates and low chemical weathering set by the semi-arid climate. Additionally, large contributions of N from wet and dry atmospheric deposition dwarf contributions of rock-derived N within this study-site. Low rock-derived N fluxes at the ridgecrest location led to very little rock-derived N influence in downslope soils. Our results suggest that rock-derived N likely plays a small and spatially variable role in semi-arid and arid ecosystems with low denudation rates, even when the bedrock is N-rich.
Data Availability Statement
The original contributions presented in the study are included in the article/Supplementary Material, further inquiries can be directed to the corresponding author.
Author Contributions
NB collected and analyzed samples and interpreted data for the manuscript. NB created figures, drafted, and edited the manuscript. ES collected and analyzed samples and interpreted data for the manuscript. ES created figures, drafted, and edited the manuscript. PH analyzed samples and interpreted data for the manuscript. PH edited the manuscript. OC provided project oversight, and edited the manuscript. All authors were involved in the conception and project development for the manuscript.
Funding
This work was funded by the NSF-EAR grant no. 1411309, “Bedrock nitrogen and the Earth system: From geobiological mechanisms to climate change forecasts.”
Conflict of Interest
The authors declare that the research was conducted in the absence of any commercial or financial relationships that could be construed as a potential conflict of interest.
Acknowledgments
We would like to thank the reserve managers at Sedgwick Reserve and the UC Reserve system for permitting the excavation of a large soil pit on their property. We would also like to thank Claire Kouba, Kelsey Bisson, and Gad Girling for their assistance in excavation of the soil pit and Chuck Sweeney, Tess Irving-Ruffing, and David Lyons for their assistance in lab analyses. Writing and data analysis contributions by ES were performed under the auspices of the United States Department of Energy by Lawrence Livermore National Laboratory under Contract DE-AC52-07NA27344.
Supplementary Material
The Supplementary Material for this article can be found online at: https://www.frontiersin.org/articles/10.3389/ffgc.2021.672522/full#supplementary-material
References
Balco, G., Stone, J. O., Lifton, N. A., and Dunai, T. J. (2008). A complete and easily accessible means of calculating surface exposure ages or erosion rates from 10Be and 26Al measurements. Q. Geochronol. 3, 174–195. doi: 10.1016/j.quageo.2007.12.001
Bingham, N. L. (2019). Exploration of Transient Landscapes Within the Western Transverse Range, CA. Ph.D.thesis. Santa Barbara, CA: University of California.
Bookhagen, B., and Strecker, M. R. (2012). Spatiotemporal trends in erosion rates across a pronounced rainfall gradient: examples from the southern Central Andes. Earth Planet. Sci. Lett. 327, 97–110. doi: 10.1016/j.epsl.2012.02.005
Börker, J., Hartmann, J., Amann, T., and Romero−Mujalli, G. (2018). Terrestrial sediments of the earth: development of a global unconsolidated sediments map database (GUM). Geochem. Geophy. Geosyst. 19, 997–1024. doi: 10.1002/2017gc007273
Brenner, D. L., Amundson, R., Baisden, W. T., Kendall, C., and Harden, J. (2001). Soil N and 15N variation with time in a California annual grassland ecosystem. Geochim. Cosmochim. Acta 65, 4171–4186. doi: 10.1016/s0016-7037(01)00699-8
Brimhall, G. H., and Dietrich, W. E. (1987). Constitutive mass balance relations between chemical composition, volume, density, porosity, and strain in metasomatic hydrochemical systems: results on weathering and pedogenesis. Geochim. Cosmochim. Acta 51, 567–587. doi: 10.1016/0016-7037(87)90070-6
Buckland, S. T. (1984). Monte Carlo confidence intervals. Biometrics 40, 811–817. doi: 10.2307/2530926
Chadwick, O. A., Brimhall, G. H., and Hendricks, D. M. (1990). From a black to a gray box—a mass balance interpretation of pedogenesis. Geomorphology 3, 369–390. doi: 10.1016/0169-555x(90)90012-f
Chamran, F., Gessler, P. E., and Chadwick, O. A. (2002). Spatially explicit treatment of soil-water dynamics along a semiarid catena. Soil Sci. Soc. Am. J. 66, 1571–1583. doi: 10.2136/sssaj2002.1571
Chapin, F. S. III, Matson, P. A., and Vitousek, P. (2011). Principles of Terrestrial Ecosystem Ecology. Berlin: Springer Science & Business Media.
Cleveland, C. C., Townsend, A. R., Schimel, D. S., Fisher, H., Howarth, R. W., Hedin, L. O., et al. (1999). Global patterns of terrestrial biological nitrogen (N2) fixation in natural ecosystems. Glob. Biogeochem. Cycles 13, 623–645. doi: 10.1029/1999gb900014
Craine, J. M., Brookshire, E. N. J., Cramer, M. D., Hasselquist, N. J., Koba, K., Marin-Spiotta, E., et al. (2015). Ecological interpretations of nitrogen isotope ratios of terrestrial plants and soils. Plant Soil 396, 1–26. doi: 10.1007/s11104-015-2542-1
Dibblee, T. W. (1966). Geology of the Central Santa Ynez Mountains, Vol. 186. Santa Barbara, CA: California Division of Mines and Geology.
Dijkstra, P., Ishizu, A., Doucett, R., Hart, S. C., Schwartz, E., Menyailo, O. V., et al. (2006). 13C and 15N natural abundance of the soil microbial biomass. Soil Biol. Biochem. 38, 3257–3266. doi: 10.1016/j.soilbio.2006.04.005
Elgawhary, S. M., and Lindsay, W. L. (1972). Solubility of silica in soils. Soil Sci. Soc. Am. J. 36, 439–442. doi: 10.2136/sssaj1972.03615995003600030022x
Elliott, E. M., Yu, Z., Cole, A. S., and Coughlin, J. G. (2019). Isotopic advances in understanding reactive nitrogen deposition and atmospheric processing. Sci. Total Environ. 662, 393–403. doi: 10.1016/j.scitotenv.2018.12.177
Gabet, E. J., Fierer, N., and Chadwick, O. A. (2005). A geomorphic model to predict the yields of sediment-bound carbon, nitrogen, and phosphorus from grassland and coastal sage scrub watersheds. JGR-Biogeosci. 110:G02001.
Garten, C. T. Jr. (1992). Nitrogen isotope composition of ammonium and nitrate in bulk precipitation and forest throughfall. Int. J. Environ. Anal. Chem. 47, 33–45. doi: 10.1080/03067319208027017
Gessler, P. E., Chadwick, O. A., Chamran, F., Althouse, L., and Holmes, K. (2000). Soil-landscape modeling of carbon along a catena. Soil Sci. Soc. Am. J. 64, 2046–2056.
Granger, D. E., Kirchner, J. W., and Finkel, R. (1996). Spatially averaged long-term erosion rates measured from in situ-produced cosmogenic nuclides in alluvial sediment. Geology 104, 249–257. doi: 10.1086/629823
Hartmann, J., and Moosdorf, N. (2012). The new global lithological map database GLiM: a representation of rock properties at the Earth surface. Geochem. Geophys. Geosyst. 13:Q12004.
Haston, L., and Michaelsen, J. (1994). Long-term central coastal California precipitation variability and relationships to El Niño-Southern Oscillation. J. Climate 7, 1373–1387.
Heaton, T. H. (1986). Isotopic studies of nitrogen pollution in the hydrosphere and atmosphere: a review. Chem. Geol. Isot. Geosci. Section 59, 87–102. doi: 10.1016/0168-9622(86)90059-x
Heimsath, A. M., Dietrich, W. E., Nishiizumi, K., and Finkel, R. C. (1997). The soil production function and landscape equilibrium. Nature 388:358. doi: 10.1038/41056
Hobbie, E. A., and Ouimette, A. P. (2009). Controls of nitrogen isotope patterns in soil profiles. Biogeochemistry 95, 355–371. doi: 10.1007/s10533-009-9328-6
Hoering, T. (1957). The isotopic composition of the ammonia and the nitrate ion in rain. Geochim. Cosmochim. Acta 12, 97–102. doi: 10.1016/0016-7037(57)90021-2
Holloway, J. M., and Dahlgren, R. A. (2002). Nitrogen in rock: occurrences and biogeochemical implications. Glob. Biogeochem. Cycles 16, 65–61. doi: 10.1029/2002gb001862
Homyak, P. M., Blankinship, J. C., Marchus, K., Lucero, D. M., Sickman, J. O., and Schimel, J. P. (2016). Aridity and plant uptake interact to make dryland soils hotspots for nitric oxide (NO) emissions. Proc. Natl. Acad. Sci. U.S.A. 113, E2608–E2616.
Hood-Nowotny, R., Umana, N. H. N., Inselbacher, E., Oswald-Lachouani, P., and Wanek, W. (2010). Alternative methods for measuring inorganic, organic, and total dissolved nitrogen in soil. Soil Sci. Soc. Am. J. 74, 1018–1027. doi: 10.2136/sssaj2009.0389
Houlton, B. Z., and Morford, S. L. (2015). A new synthesis for terrestrial nitrogen inputs. Soil 1, 381–397. doi: 10.5194/soil-1-381-2015
Houlton, B. Z., Morford, S. L., and Dahlgren, R. A. (2018). Convergent evidence for widespread rock nitrogen sources in Earth’s surface environment. Science 360, 58–62. doi: 10.1126/science.aan4399
Jones, M. B., and Woodmansee, R. G. (1979). Biogeochemical cycling in annual grassland ecosystems. Bot. Rev. 45, 111–144. doi: 10.1007/bf02860854
Juster, J. T., Brown, P. E., and Bailey, S. W. (1987). NH4-bearing illite in very low grade metamorphic rocks associated with coal, northeastern Pennsylvania. Am. Mineral. 72, 555–565.
Kohl, C. P., and Nishiizumi, K. (1992). Chemical isolation of quartz for measurement of in situproduced cosmogenic nuclides. Geochim. Cosmochim. Acta 56, 3583–3587. doi: 10.1016/0016-7037(92)90401-4
Kramer, M. G., Sollins, P., Sletten, R. S., and Swart, P. K. (2003). N isotope fractionation and measures of organic matter alteration during decomposition. Ecology 84, 2021–2025. doi: 10.1890/02-3097
Kump, L. R., Brantley, S. L., and Arthur, M. A. (2000). Chemical weathering, atmospheric CO2, and climate. Annu. Rev. Earth Planet. Sci. 28, 611–667. doi: 10.1146/annurev.earth.28.1.611
Lal, D. (1991). Cosmic ray labeling of erosion surfaces: in situ nuclide production rates and erosion models. Earth Planet. Sci. Lett. 104, 424–439. doi: 10.1016/0012-821x(91)90220-c
Li, Z., Walters, W. W., Hastings, M. G., Zhang, Y., Song, L., Liu, D., et al. (2019). Nitrate isotopic composition in precipitation at a Chinese megacity: seasonal variations, atmospheric processes, and implications for sources. Earth Space Sci. 6, 2200–2213. doi: 10.1029/2019ea000759
Lin, Y., Prentice, S. E. III, Tran, T., Bingham, N. L., King, J. Y., and Chadwick, O. A. (2016). Modeling deep soil properties on California grassland hillslopes using LiDAR digital elevation models. Geoderma Reg. 7, 67–75. doi: 10.1016/j.geodrs.2016.01.005
Loeppert, R. H., and Suarez, D. L. (1996). “Carbonate and gypsum,” in Methods of Soil Analysis: Part 3 Chemical Methods 5, eds D. L. Sparks, A. L. Page, P. A. Helmke, R. H. Loeppert, P. N. Soltanpour, M. A. Tabatabai, et al. (Madison, WI: SSSA), 437–474.
Michalski, G., Bhattacharya, S. K., and Mase, D. F. (2012). “Oxygen isotope dynamics of atmospheric nitrate and its precursor molecules,” in Handbook of Environmental Isotope Geochemistry, ed. M. Baskaran (Berlin: Springer), 613–635. doi: 10.1007/978-3-642-10637-8_30
Morford, S. L., Houlton, B. Z., and Dahlgren, R. A. (2011). Increased forest ecosystem carbon and nitrogen storage from nitrogen rich bedrock. Nature 477:78. doi: 10.1038/nature10415
Morford, S. L., Houlton, B. Z., and Dahlgren, R. A. (2016a). Direct quantification of long−term rock nitrogen inputs to temperate forest ecosystems. Ecology 97, 54–64. doi: 10.1890/15-0501.1
Morford, S. L., Houlton, B. Z., and Dahlgren, R. A. (2016b). Geochemical and tectonic uplift controls on rock nitrogen inputs across terrestrial ecosystems. Glob. Biogeochem. Cycles 30, 333–349. doi: 10.1002/2015gb005283
National Atmospheric Deposition Program (Nrsp-3). (2019). NADP Program Office, Wisconsin State Laboratory of Hygiene. Madison, WI 53706: 465 Henry Mall.
Nishiizumi, K., Kubik, P. W., Elmore, D., Reedy, R. C., and Arnold, J. R. (1989). Cosmogenic Cl-36 production rates in meteorites and the lunar surface. Lunar Planet. Sci. Conf. Proc. 19, 305–312.
Oelmann, Y., Kreutziger, Y., Bol, R., and Wilcke, W. (2007). Nitrate leaching in soil: tracing the NO3- sources with the help of stable N and O isotopes. Soil Biol. Biochem. 39, 3024–3033. doi: 10.1016/j.soilbio.2007.05.036
Prãvãlie, R. (2016). Drylands extent and environmental issues. A global approach. Earth Sci. Rev. 161, 259–278. doi: 10.1016/j.earscirev.2016.08.003
Prentice, S. III (2013). Soil-Landscape Modeling Of Coastal California Hillslopes Using Terrestrial Lidar. Ph.D. thesis. Santa Barbara, CA: University of California.
Reiners, W. A. (1986). Complementary models for ecosystems. Am. Nat. 127, 59–73. doi: 10.1086/284467
Riebe, C. S., Kirchner, J. W., and Finkel, R. C. (2003). Long-term rates of chemical weathering and physical erosion from cosmogenic nuclides and geochemical mass balance. Geochim. Cosmochim. Acta 67, 4411–4427. doi: 10.1016/s0016-7037(03)00382-x
Rock, L., Ellert, B. H., and Mayer, B. (2011). Tracing sources of soil nitrate using the dual isotopic composition of nitrate in 2 M KCl-extracts. Soil Biol. Biochem. 43, 2397–2405. doi: 10.1016/j.soilbio.2011.08.016
Scherer, H. W., Werner, W., and Rossbach, J. (1992). Effects of pretreatment of soil samples on N mineralization in incubation experiments. Biol. Fertil. Soils 14, 135–139. doi: 10.1007/bf00336263
Schwanghart, W., and Kuhn, N. J. (2010). TopoToolbox: a set of Matlab functions for topographic analysis. Environ. Model. Softw. 25, 770–781. doi: 10.1016/j.envsoft.2009.12.002
Schwanghart, W., and Scherler, D. (2014). TopoToolbox 2–MATLAB-based software for topographic analysis and modeling in Earth surface sciences. Earth Surf. Dyn. 2, 1–7. doi: 10.5194/esurf-2-1-2014
Sigman, D. M., Casciotti, K. L., Andreani, M., Barford, C., Galanter, M. B., and Böhlke, J. K. (2001). A bacterial method for the nitrogen isotopic analysis of nitrate in seawater and freshwater. Anal. Chem. 73, 4145–4153. doi: 10.1021/ac010088e
Skiba, M., Skiba, S., Derkowski, A., Maj-Szeliga, K., and Dziubiñska, B. (2018). Formation of NH4-illite-like phase at the expense of dioctahedral vermiculite in soil and diagenetic environments–an experimental approach. Clays Clay Minerals 66, 74–85. doi: 10.1346/ccmn.2018.064082
Soil Survey Division Staff. (1993). Soil survey division staff (1993) soil survey manual. Soil conservation service. U. S. Dep. Agric. Handb. 18:315.
Stone, J. O. (2000). Air pressure and cosmogenic isotope production. J. Geophys. Res. Solid Earth 105, 23753–23759. doi: 10.1029/2000jb900181
Suchet, P. A., Probst, J. L., and Ludwig, W. (2003). Worldwide distribution of continental rock lithology: implications for the atmospheric/soil CO2 uptake by continental weathering and alkalinity river transport to the oceans. Glob. Biogeochem. Cycles 17:1038.
Vengosh, A. (2003). “Salinization and saline environments,” in Treatise on Geochemistry, ed. B. S. Lollar (Amsterdam: Elsevier Science), 325–378. doi: 10.1016/b978-0-08-095975-7.00909-8
Vitousek, P. M., Porder, S., Houlton, B. Z., and Chadwick, O. A. (2010). Terrestrial phosphorus limitation: mechanisms, implications, and nitrogen–phosphorus interactions. Ecol. Appl. 20, 5–15. doi: 10.1890/08-0127.1
von Blanckenburg, F. (2006). The control mechanisms of erosion and weathering at basin scale from cosmogenic nuclides in river sediment. Earth Planet. Sci. Lett. 242, 224–239. doi: 10.1016/j.epsl.2005.11.017
von Blanckenburg, F., Hewawasam, T., and Kubik, P. (2004). Cosmogenic nuclide evidence for low weathering and denudation in the wet tropical Highlands of Sri Lanka. J. Geophys. Res. 109:F03008.
Walvoord, M. A., Phillips, F. M., Stonestrom, D. A., Evans, R. D., Hartsough, P. C., Newman, B. D., et al. (2003). A reservoir of nitrate beneath desert soils. Science 302, 1021–1024. doi: 10.1126/science.1086435
Wan, J., Tokunaga, T. K., Brown, W., Newman, A. W., Dong, W., Bill, M., et al. (2021). Bedrock weathering contributes to subsurface reactive nitrogen and nitrous oxide emissions. Nat. Geosci. 14, 217–224. doi: 10.1038/s41561-021-00717-0
White, A. F., and Blum, A. E. (1995). Effects of climate on chemical_ weathering in watersheds. Geochim. Cosmochim. Acta 59, 1729–1747. doi: 10.1016/0016-7037(95)00078-e
Yoo, K., Mudd, S. M., Sanderman, J., Amundson, R., and Blum, A. (2009). Spatial patterns and controls of soil chemical weathering rates along a transient hillslope. Earth Planet. Sci. Lett. 288, 184–193. doi: 10.1016/j.epsl.2009.09.021
Keywords: rock-derived nitrogen, nitrogen isotopes, pedon, shale, semi-arid ecosystem
Citation: Bingham NL, Slessarev EW, Homyak PM and Chadwick OA (2021) Rock-Sourced Nitrogen in Semi-Arid, Shale-Derived California Soils. Front. For. Glob. Change 4:672522. doi: 10.3389/ffgc.2021.672522
Received: 25 February 2021; Accepted: 26 April 2021;
Published: 24 May 2021.
Edited by:
Douglas Godbold, University of Natural Resources and Life Sciences Vienna, AustriaReviewed by:
Chao Wang, Institute of Applied Ecology, Chinese Academy of Sciences, ChinaJean-Thomas Cornelis, University of British Columbia, Canada
Copyright © 2021 Bingham, Slessarev, Homyak and Chadwick. This is an open-access article distributed under the terms of the Creative Commons Attribution License (CC BY). The use, distribution or reproduction in other forums is permitted, provided the original author(s) and the copyright owner(s) are credited and that the original publication in this journal is cited, in accordance with accepted academic practice. No use, distribution or reproduction is permitted which does not comply with these terms.
*Correspondence: Nina L. Bingham, bmxiaW5naGFtQHVjZGF2aXMuZWR1
†ORCID: Nina L. Bingham, orcid.org/0000-0003-3083-9432; Eric W. Slessarev, orcid.org/0000-0002-4076-1950; Peter M. Homyak, orcid.org/0000-0003-0671-8358; Oliver A. Chadwick, orcid.org/0000-0002-4964-6203