 Winnifred Jean Roach1*
 Suzanne W. Simard1
 Camille E. Defrenne2
 Brian J. Pickles3
 Les M. Lavkulich4Teresa L. Ryan1
- 1Department of Forest and Conservation Sciences, University of British Columbia, Vancouver, BC, Canada
- 2Division of Environmental Sciences, Climate Change Science Institute, Oak Ridge National Laboratory, Oak Ridge, TN, United States
- 3School of Biological Sciences, Whiteknights, University of Reading, Reading, United Kingdom
- 4Faculty of Land and Food Systems, University of British Columbia, Vancouver, BC, Canada
Forests are important for biodiversity, timber production and carbon accumulation, but these ecosystem services may be impacted by climate change. Field data collected from individual forest types occurring across a climatic gradient can contribute to forecasting these consequences. We examined how changes in temperature, precipitation and aridity affect ecosystem services in 23 mature Douglas-fir (Pseudotsuga menziesii) forests in nine climatic regions across a 900 km gradient in British Columbia, Canada. Using Canadian National Forest Inventory methodology, we assessed richness and diversity of plant functional groups, site index, and above- and below-ground carbon stocks. As aridity increased, ecosystem-level tree species richness declined on average from four to one species, Douglas-fir site index declined from 30 to 15 m, and ecosystem carbon storage decreased from 565 to 222 Mg ha–1. Tree species richness was positively and herb species richness negatively correlated with carbon storage. Carbon storage by ecosystem compartment was largest in aboveground live tree biomass, declining in the following order: mineral soils > coarse woody debris and dead standing trees > forest floor > small and fine woody debris > understory plants. Mineral soil carbon at depths of 0-15 cm, 15-35 cm, and 35-55 cm increased with increasing mean annual precipitation and decreasing aridity. Our results indicate that as aridity increases and precipitation decreases, tree species richness, site index and carbon storage in existing Douglas-fir forests declines. However, assisted or natural migration of Douglas-fir into more humid regions could be associated with more diverse, productive, carbon-rich forests. This study informs carbon stock vulnerability and provides empirical data essential for carbon stock forecasts.
Introduction
Douglas-fir (Pseudotsuga menziesii var. glauca (Beissn.) Franco) temperate forests in interior British Columbia, Canada are good candidates for conducting gradient studies to estimate how climate influences whole-ecosystem carbon (C) stocks as these forests are widely distributed across varied climatic regions and are predicted to be subject to and sensitive to climate change. Niche modeling based on predicted changes in temperature and precipitation has generated projections that Douglas-fir’s suitability range in British Columbia could expand substantially northward in the coming decades (projected expansion of 82 and 124% by 2055 and 2085, respectively; Hamann and Wang, 2006). However, interior Douglas-fir is sensitive to limited soil water availability during the growing season (Littell et al., 2008; Chen et al., 2010; Griesbauer and Green, 2010; Griesbauer et al., 2011; Restaino et al., 2016) and drought is an important growth limiting factor for the species across all biogeoclimatic zones in British Columbia (Lloyd et al., 1990; Braumandl and Curran, 1992; Delong et al., 1993; Steen and Coupe, 1997; Coops et al., 2010). By the end of the 21st century, drought stress is predicted to have increased even more across most of these zones (Coops et al., 2010) due to warmer, drier summers (Intergovernmental Panel on Climate Change [IPCC], 2014) and decreased snowpack depth and duration (Pike et al., 2008). Similarly, analysis for the western United States indicates strong potential for drought-related forest mortality and the possibility of substantial changes in forest composition due to unsuitable climatic conditions for re-establishment of existing species, which can have long-term effects on C cycling and sequestration potential (Buotte et al., 2019). Hence, while the potential for future range expansion of Douglas-fir is promising, the consequences of changing aridity for existing forests requires further examination.
Temperate forests represent one-third of the global forest C sink and are accumulating C in large enough quantities to affect the global C budget (Goodale et al., 2002; Canadell et al., 2007), although the degree to which forests are meeting their potential to store C is uncertain (Harmon et al., 2009). Forests are of particular interest for offsetting atmospheric CO2 because they do not require new technologies or infrastructure to mitigate climate change (Law et al., 2018). However, climate change has been associated with greater frequency and intensity of disturbances such as insect outbreaks (Kurz et al., 2008), fire (Wang et al., 2015; Wotton et al., 2017), and drought (Anderegg et al., 2015) throughout North American forest ecosystems, leading some forests to switch from sinks to temporary sources of CO2. To understand and appropriately model consequences of climate change on C accumulation, it is essential to collect field data that quantifies how changes in temperature and precipitation affect C stocks (Malhotra et al., 2019).
Since the Kyoto agreement of 1997, assessment of the size and fluxes of forest C pools has been ongoing at national (e.g., Canadian Forest Service, United States Department of Agriculture) and international (e.g., Food and Agriculture Organization, Intergovernmental Panel on Climate Change) scales, and while this is useful for high-level decision-making, it is not suitable for forest planning at operational scales, for example, setting regional sustainable annual harvest rates. Quantification of both C fluxes (the rate at which C is stored and released), as determined from large scale techniques such as FLUXNET (Baldocchi et al., 2001), as well as current ecosystem C stocks are critical. In a stock-based approach, C stored across sites experiencing different climatic conditions at the time of study can be measured, and the climatic gradient used as a proxy for climate change. However, most studies relating forest C stocks to climate focus on one or two ecosystem components such as aboveground trees and upper soil layers (Gough et al., 2008), and field data that describes total-ecosystem C stocks are insufficient or unavailable for many forest types (Mokany et al., 2006). For example, modeling for the United States, England, Wales and France using various databases was found to underestimate soil C stocks by 40% compared to field data (Tifafi et al., 2017). Mineral soil C assessments are typically limited to the upper 20 cm of the profile, leaving a considerable knowledge gap regarding soil C stocks at greater depths (Buchholz et al., 2014). Sampling restricted to shallow layers is not useful for estimating total soil C storage (Arrouays and Pelissier, 1994; Grand and Lavkulich, 2011) given that 50 percent or more of soil C can be stored below 20 cm (Jobbágy and Jackson, 2000; Homann et al., 2005).
Forests are not just a repository for C and few forests are managed for C storage alone, with wood products, wildlife habitat, clean water and recreational opportunities some of the other important ecosystem services (Ryan et al., 2010; Thompson et al., 2012; Trumbore et al., 2015). Forests hold more than three-quarters of the world’s terrestrial biodiversity (Food and Agriculture Organization [FAO], 2018), but up to 50 percent of tree species worldwide are threatened by factors including the direct and indirect effects of climate change, deforestation and urbanization (Dawson et al., 2011; Intergovernmental Panel on Climate Change [IPCC], 2014; Liang et al., 2016). Biodiversity is an important consideration in forest management because diverse forests generally support a wider range of ecosystem services and are more resilient to disturbance than those with lower levels of diversity (Thompson et al., 2011; Morin et al., 2018; Watson et al., 2018). Higher levels of biodiversity have also been associated with increased tree volume productivity (Liang et al., 2016) and C storage (Thompson et al., 2011, 2012; Brandt et al., 2014; Lecina-Diaz et al., 2018; Buotte et al., 2020), although exceptions exist: some areas with high biodiversity have low future C sequestration potential, and some areas with low biodiversity have high rates of C sequestration. A need exists to not only estimate how C stocks in individual forest types vary with climate (Keith et al., 2009), but also how biodiversity, C and climate are inter-related within these types.
Here we present the results of a natural field experiment in which we measured biodiversity, potential productivity as measured by site index, and ecosystem-level C storage in mature forests across a broad climatic gradient focused on the interior of British Columbia, Canada. We conducted this study as part of the Mother Tree Project, in which a network of nine replicated 25-ha mature Douglas-fir forests was established throughout the province. We utilized the National Forest Inventory protocol (Canadian Forest Inventory Committee, and Canadian Forest Service, 2008) for data collection because it is standardized for use across Canada, methods are clearly documented and comprehensive, and the measures are designed to be repeatable over time. We tested four hypotheses about Douglas-fir-dominated forests: (1) Site index, total ecosystem C storage, C stored aboveground, and the ratio of aboveground to belowground C storage increase with increasing precipitation and decreasing aridity; (2) The amount of C stored in mineral soils and its correlation with climatic factors decrease with soil depth; (3) The largest C pools at all locations, regardless of climate, are live trees and mineral soils followed by large deadwood (coarse woody debris and dead standing trees) and the forest floor, with small and fine woody debris, stumps and understory plants all minor pools; and (4) Biodiversity measures for vegetation are positively correlated with C storage and negatively correlated with aridity.
Our study is an advance over past work because we measured C in multiple pools, including mineral soil to 55 cm depth, rather than limiting measurements to one or two pools and/or the top 20 cm of the soil profile. Our detailed C measurements provide much-needed data quantifying the contribution of different pools in Douglas-fir ecosystems to terrestrial C storage across a climate gradient. In addition, we measured tree and understory plant diversity alongside C and across a climatic gradient, enabling us to make unique investigations into how these variables are correlated.
Materials and Methods
Study Area
The study took place in B.C., Canada in mature naturally regenerated fire-origin forests at eight interior and one coastal location (Figure 1 and Table 1). The interior locations span the range of interior Douglas-fir in B.C., occurring along a 900 km climatic gradient (mean annual temperature 2.3-7.7°C, mean annual precipitation 398-1059 mm; Interior Douglas-fir, Sub-boreal Spruce, and Interior Cedar-Hemlock biogeoclimatic zones), from south of Cranbrook (49.21oN, 115.37oW) to Fort St James (54.65oN, 124.43oW). The coastal location (mean annual temperature 8.0°C, mean annual precipitation 2701 mm; Coastal Western Hemlock zone) is located near Maple Ridge (49.32oN, 122.54oW) and was the only forest in our study that included the coastal variety of Douglas-fir (P. menziesii var. menziesii). There are up to three replicate forest sites within the landscape at each location (total 23 sites), and 4-5 5 ha treatment plots per forest site (total 113 plots). Tree removal had taken place within the wider forest landscape in the 1950’s and 1960’s, but our replicate forest sites were established in undisturbed locations.
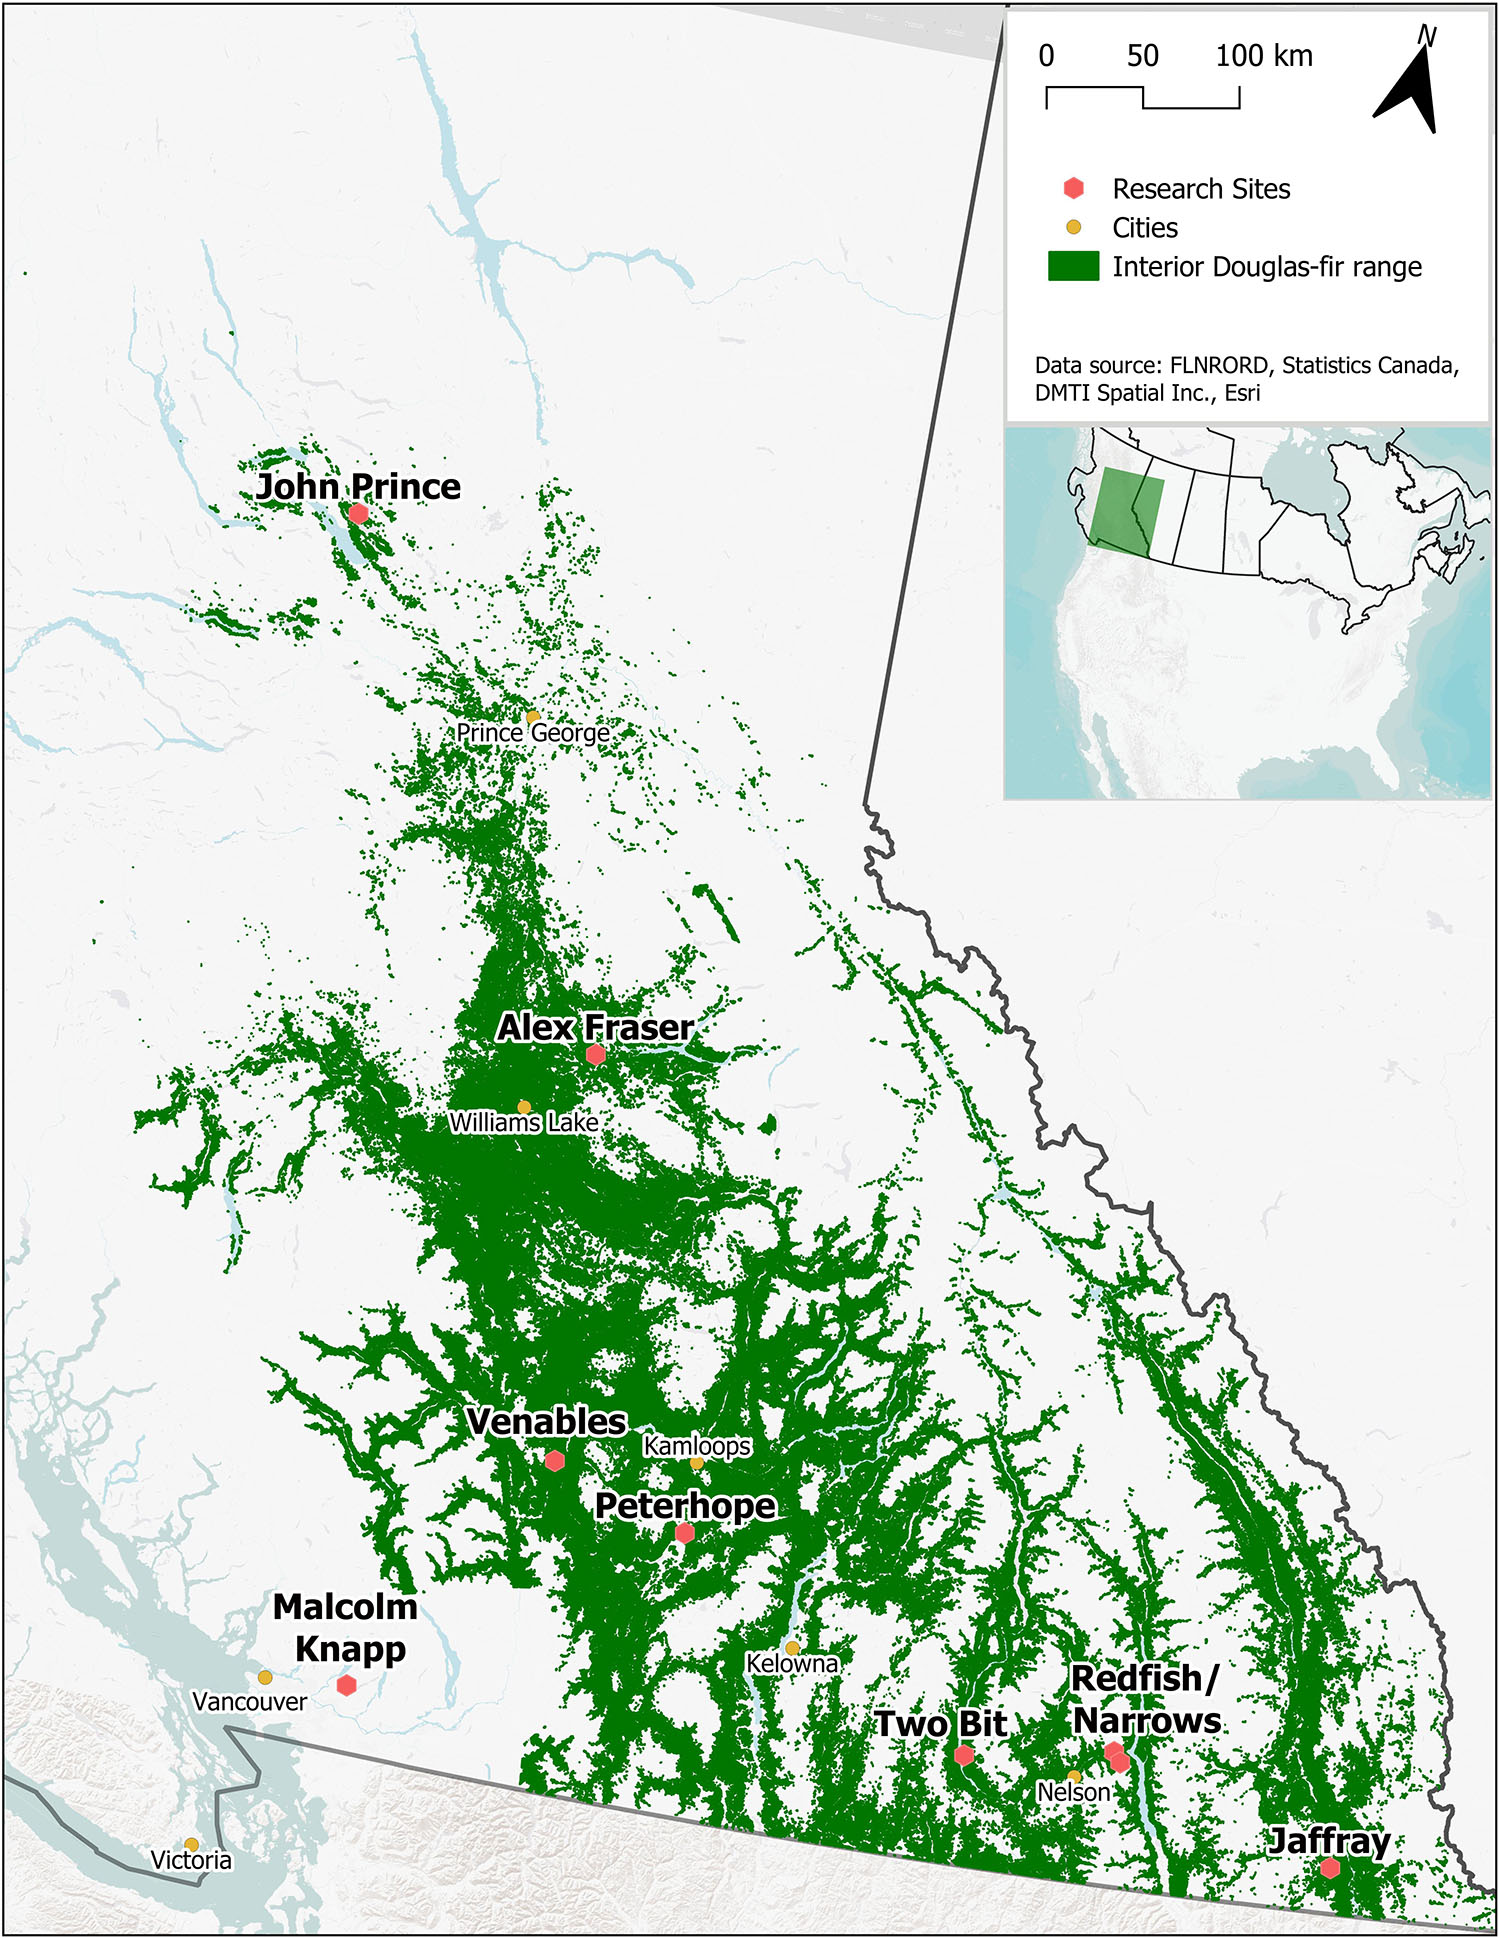
Figure 1. Location of the nine research sites. Green indicates the current distribution of Interior Douglas-fir in British Columbia.
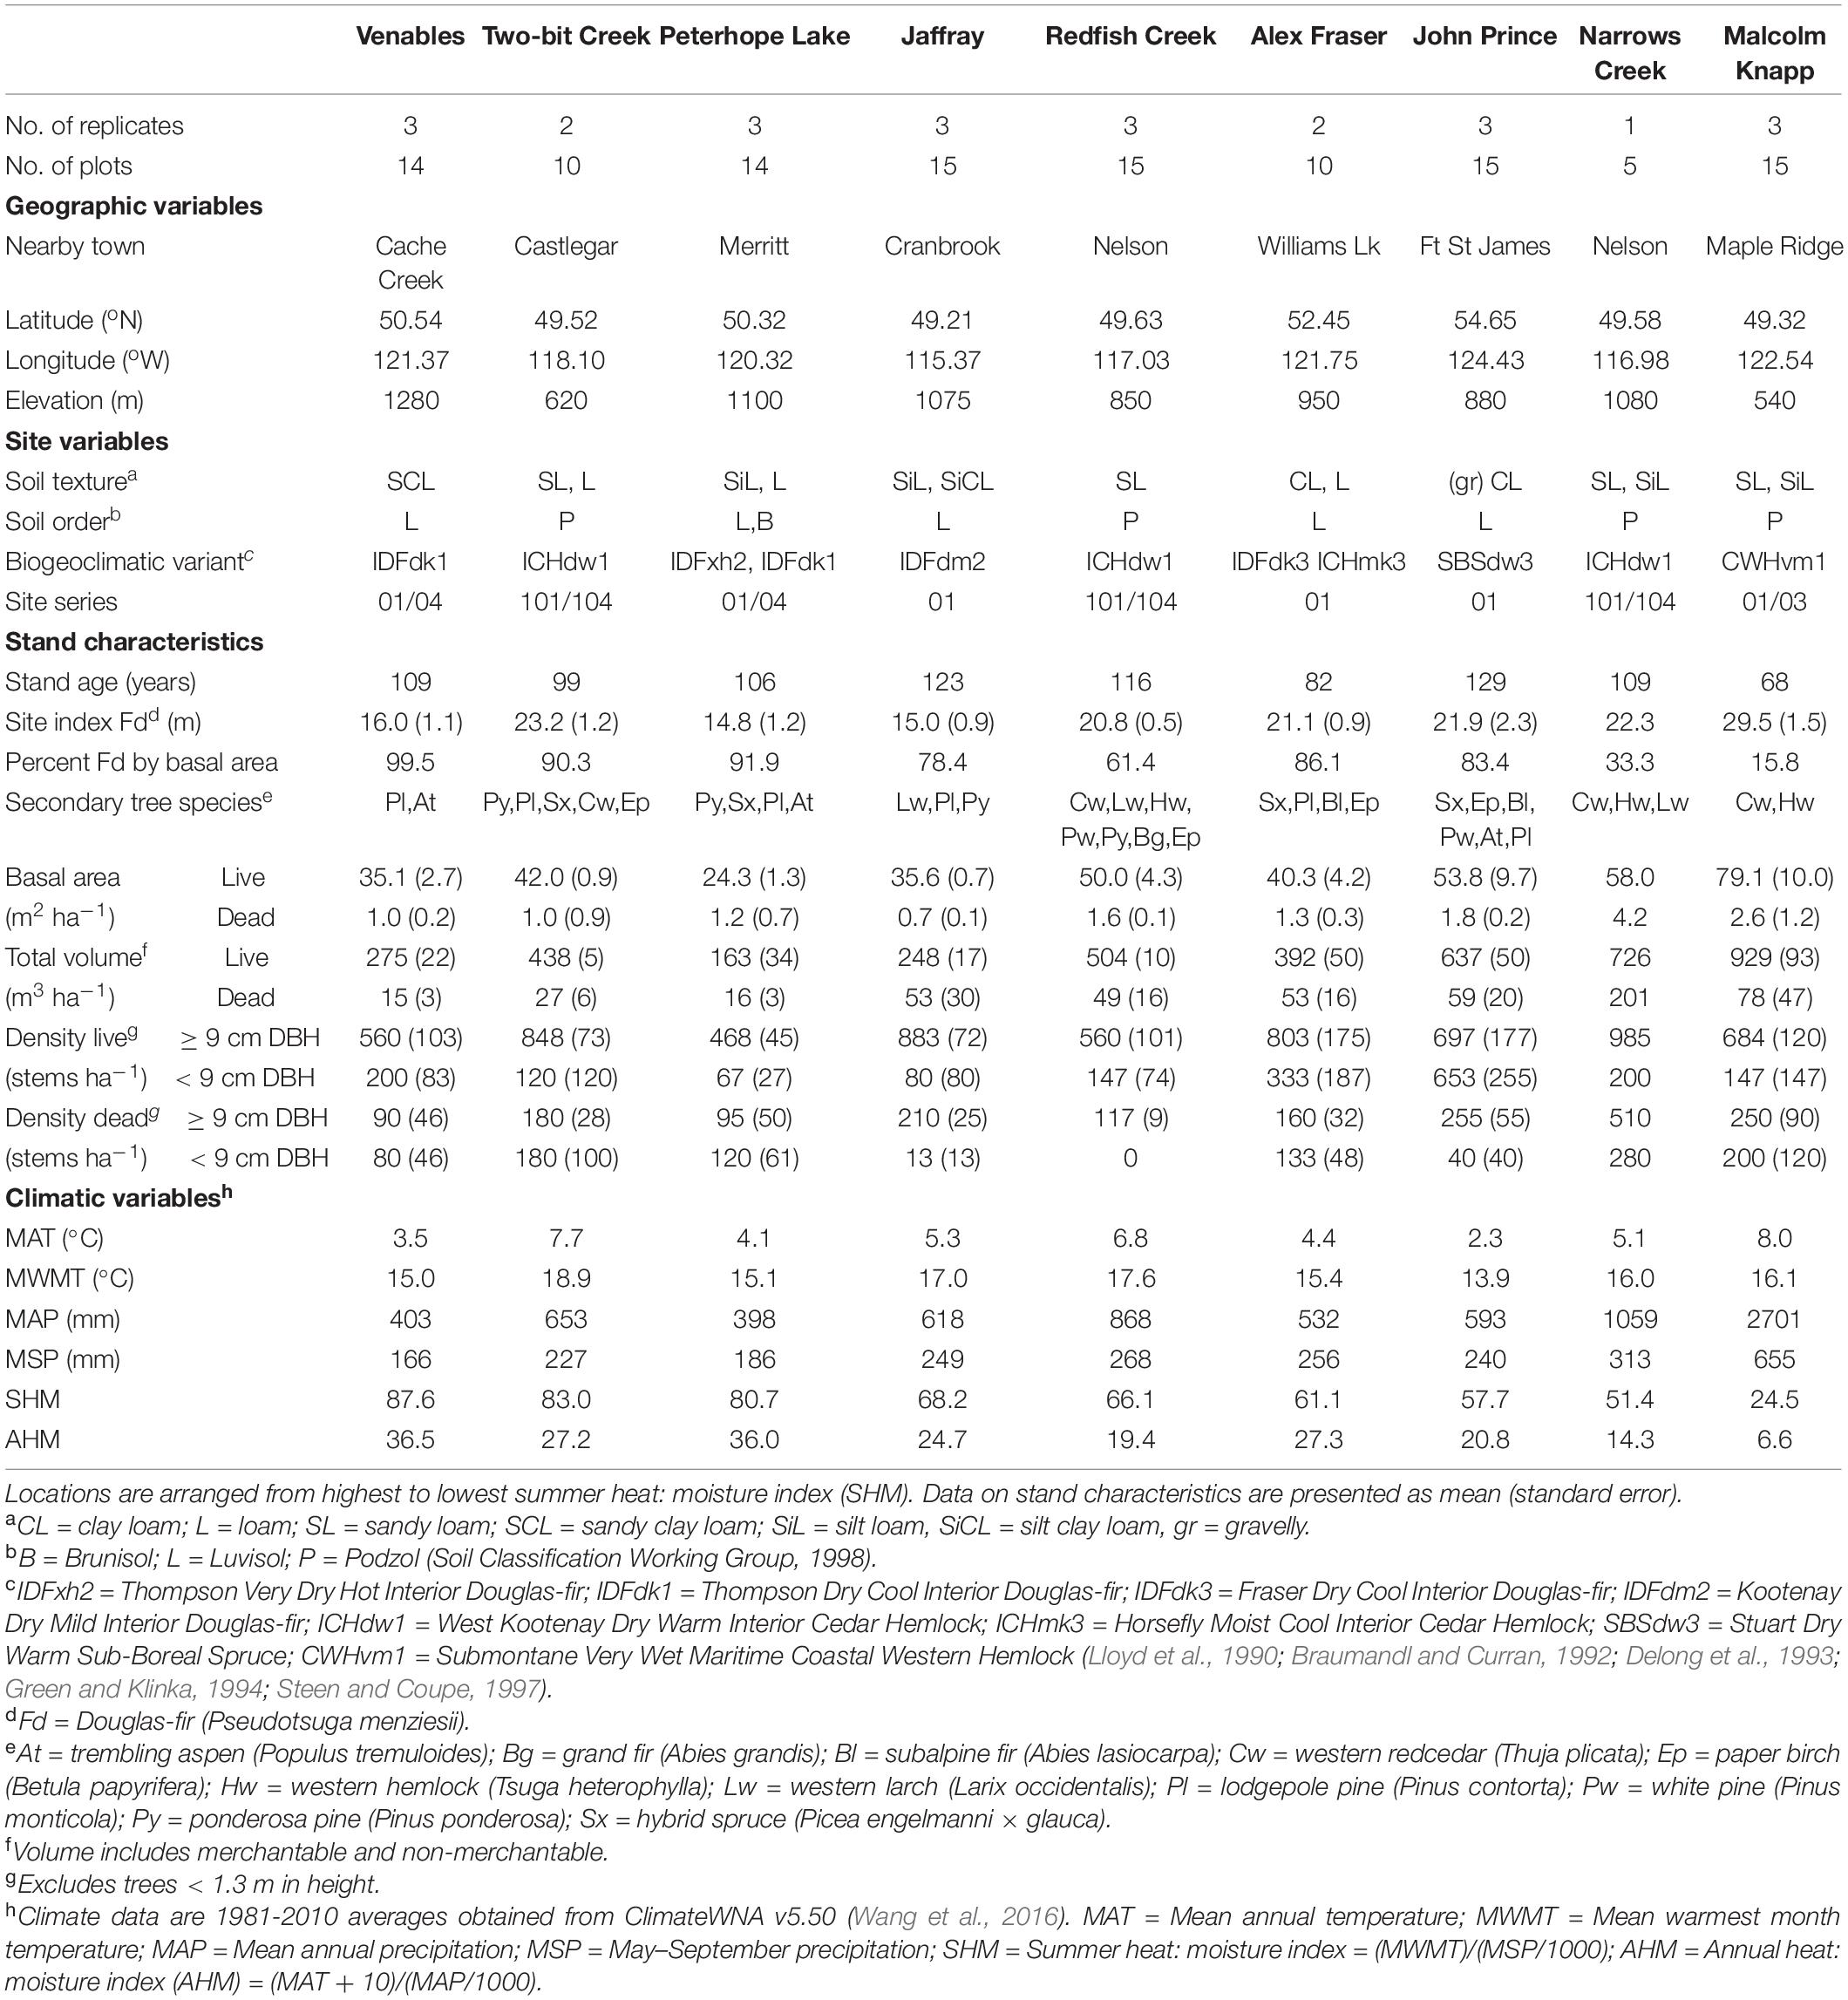
Table 1. Geographic, site, stand and climatic characteristics of each research site.
At seven of the nine locations, Douglas-fir made up more than 50% of basal area and at all locations Douglas-fir occupied a dominant position in the canopy. At the wettest interior location it comprised 33% of the basal area and at the coastal site 16%. Each location featured other common tree species that varied among zones: Ponderosa pine (Pinus ponderosa Dougl. ex P. & C. Laws.) and western larch (Larix occidentalis Nutt.) in the IDF zone; hybrid white spruce (Picea glauca × engelmannii) in the Sub-boreal Spruce zone; western larch, western red-cedar (Thuja plicata (Donn ex D Don), western hemlock, (Tsuga heterophylla (Raf.) Sarg.), and grand fir (Abies grandis Dougl. ex D. Don) Lindl.) in the Interior Cedar-Hemlock zone; and western redcedar and western hemlock in the Coastal Western Hemlock zone. Several other tree species were present in minor amounts and there were up to eight tree species per location. The understory was dominated by grasses at the driest sites (Interior Douglas-fir zone), shrubs and herbs at sites with moderate moisture, and was sparse at the two wettest locations.
Climate data for our 23 sites was obtained from the ClimateWNA, version 5.50, based on their latitude, longitude and elevation, using the 1981-2010 climate normal dataset (Wang et al., 2016). The sites had medium moisture regimes (mesic-submesic), warm aspects, mid-slope positions, and gentle slope gradients (<30 percent). The soil texture at the interior locations tended to be coarsest in the Interior Cedar-Hemlock zone, followed by the Interior Douglas-fir, and finest in the Sub-boreal Spruce. The dominant soil orders were Podzols in the Interior Cedar-Hemlock and Coastal Western Hemlock, Luvisols, and Brunisols in the Interior Douglas-fir, and Luvisols in the Sub-boreal Spruce (Soil Classification Working Group, 1998), and are representative of these zones. Coarse fragment content of the mineral soils ranged from approx. 25 to 50 percent.
Measurement and Sampling Methods
Field data was collected in 2017-2018 according to the Canadian National Forest Inventory (NFI) ground sampling guidelines (Canadian Forest Inventory Committee, and Canadian Forest Service, 2008). We measured the height and diameter of all live and dead trees with a diameter at breast height (1.30 m; DBH) = 9 cm within a circular 0.04 ha fixed radius plot. Plots of this approximate size are standard for national forest inventories across much of the temperate zone (McRoberts et al., 2010), and while very large trees may be missed in these relatively small plots and forest inventory precision increases with plot size (Johnson and Hixon, 1952; Spetich and Parker, 1998; Gray, 2003; Becker and Nichols, 2011), it is expected that the plots were sufficiently large, given that very large trees were either absent from our forests (five locations), or so widely dispersed (<1 tree per hectare) that missing them had little effect on the tree C pool. We collected increment cores to determine the age of at least one undamaged codominant or dominant live tree of each major tree species at each plot according to British Columbia Ministry of Forests and Range (2009), for use in determining site index. Nested within each 0.04 ha plot was one circular 50 m2 subplot (r = 3.99 m) in which we assessed size and density of live and dead trees and shrubs < 9 cm DBH and > 1.3 m tall, and height, diameter and decay class of stumps > 4 cm diameter and < 1.3 tall. Visual assessments were made of percent cover of all live tree and shrub species occurring within a 314 m2 subplot (r = 10.0 m) and percent cover of all herbaceous and bryoid species occurring within a 100 m2 (r = 5.64 m) subplot. Coarse woody debris (>7.5 cm diameter) was measured along two perpendicular 30-m line transects and small woody debris (1.1–7.5 cm diameter) pieces were counted by size class along 10 m of each transect. Ground substrate type, and depth of organic and decayed wood, was recorded every 2 m along each coarse woody debris transect (total 30 stations per NFI plot).
In each NFI plot, samples were collected for laboratory analysis at one circular 1 m2 microplot at each end of the coarse woody debris transects (four microplots per NFI plot). All bryoids, herbs, shrubs/trees ≤ 1.3 m in height, and fine woody debris (<1 cm diameter) occurring within the microplots were collected. A 20 × 20 cm area of forest floor extending from the ground surface to the underlying substrate was measured for thickness and collected. Mineral soil, including rocks ≤ 7.5 cm diameter and roots, was collected from all four microplots in 10-cm diameter holes at 0-15 cm depth. At two microplots, mineral soil was also collected from 15 to 35 cm depth, and at one microplot soil was collected from 35 to 55 cm depth. The excavated holes were lined with plastic and the volume of water that filled the hole was measured with a graduated cylinder for use in calculating bulk density (Walter et al., 2016; Al-Shammary et al., 2018). Cobbles (rocks > 7.5 cm across) were weighed in the field and discarded.
Site data was collected to describe the ecological properties of each NFI plot. A soil pit was dug to = 60 cm depth. Mineral soil horizons were delineated, and their depth, texture and coarse fragment content were estimated. Mineral soil and forest floor were classified to Order (Green et al., 1993; Soil Classification Working Group, 1998). The biogeoclimatic variant of each NFI plot was determined from field maps (British Columbia Ministry of Forests, and Lands and Natural Resource Operations, 2019a) and soil moisture regime, nutrient status and site series were estimated using vegetation, soil, and site features (Lloyd et al., 1990; Braumandl and Curran, 1992; Delong et al., 1993; Green and Klinka, 1994; Steen and Coupe, 1997).
Laboratory Methods
The plant, fine woody debris, forest floor and mineral soil microplot samples were oven dried for 72 h at 70°C, then the plant and fine woody debris samples were weighed and discarded. The dried mineral soil samples were sieved and separated into roots, particles < 2 mm, and gravel (2-7.5 cm) components, which were then weighed. Roots, charcoal, and gravel were removed from the forest floor samples and weighed, then the remaining forest floor material was sieved into < 8 mm and > 8 mm fractions. A subsample from each microplot of the < 2 mm mineral and < 8mm forest floor fractions was sent to the Ministry of Environment laboratory in Victoria, British Columbia for determination of percent C using combustion analysis in an Elemental Analyzer.
Data Analysis
Descriptive statistics for tree and plant biodiversity, site index, and C storage in each major pool were determined for each replicate at the nine locations. Potential productivity was estimated with site index (tree height at a reference age of 50 years; see Nyland, 2016). Age at DBH and height of the live tree with the largest DBH in the 0.04 ha plot were measured. As well, the age and height of dominant or codominant trees of each major species (>20% of basal area) in each quadrant of the plot were measured. Site index was determined by inputting measured height and age at DBH of undamaged, unsuppressed, non-residual trees into SiteTools ver. 4.1b (British Columbia Ministry of Forests, 2017). In this article we focus on site index for Douglas-fir only because other tree species were inconsistently represented in the plots, but Supplementary Table I-1 lists the site index of all the other major species at each location. Carbon storage (Mg ha–1) in dead and live trees > 1.3 m tall, stumps (≤1.3 m tall), downed woody debris (coarse, small, and fine), understory plants, forest floor, and mineral soil were calculated according to the Canadian Forest Service protocols. Tree biomass was calculated using allometric equations which included both height and DBH and although they were considered to be the most biologically relevant equations available for the study areas, they generally were not site-specific. Of the 72 equations used, 55 are from Ung et al. (2008), and the remainder from Young et al. (1980); Standish et al. (1985), Ter-Mikelian and Korzukhin (1997); Lambert et al. (2005). Biomass was converted to C by multiplying by 0.5. Root biomass was calculated as aboveground biomass multiplied by 0.32 or 0.23 for coniferous forests with an aboveground biomass of 50-150 Mg ha–1 or >150 Mg ha–1, respectively, as suggested in Supplementary Table I-3 A.1.8 (Intergovernmental Panel on Climate Change [IPCC], 2003). These conversion factors for C and root biomass vary between species and size, but such individual factors are unavailable, so the reader is cautioned that the results can include some error.
Biodiversity was estimated with two measures: richness and Shannon’s diversity index. Richness of trees and plants was calculated as the number of species occurring in a 0.0314 ha plot for trees and shrubs, and in a 0.01 ha plot for herbs and bryoids. Shannon’s diversity index (Shannon and Weaver, 1949) was calculated as H′ = 1 –Σ [pi ln(pi)] where H′ is Shannon’s index and pi is the proportion of total density of species i. Statistical analyses were conducted in R version 3.6.1 (R Development Core Team, 2019) and results were considered statistically significant at p < 0.05. We first explored relationships among study locations using a principal component analysis. We investigated how biodiversity, site index, and C storage responded to climatic factors by fitting linear mixed-effects models or generalized linear mixed-effects models. Before analysis the model predictors (climatic variables) were standardized and centered. Where necessary, to meet the assumptions of normal distribution and homoscedasticity of the residual errors, response variables were transformed (log10 or square root). Climatic variables for the 30-year climatic normal period 1981-2010 (mean annual temperature + mean annual precipitation); annual heat: moisture index (calculated as (mean annual temperature + 10)/(mean annual precipitation/1000)); and summer heat: moisture index (calculated as (mean warmest month temperature)/(mean summer precipitation/1000)) were added as fixed factors while location and replication were added as nested random factors (the plot level was not added as a nested random factor because the number of observations at this level was insufficient). We used the ‘lmer’ function for linear mixed effects models and ‘glmer’ for generalized linear mixed-effects models from the package lme4 (Bates et al., 2018). Models were fitted by restricted maximum likelihood. For linear mixed effects models, we used the function ‘step’ from the lmerTest package to eliminate non-significant fixed effects from models based on the Akaike information criterion (Venables and Ripley, 2002). When fitting generalized linear mixed effects models, we ranked all competing models via the Akaike information criteria because the function ‘step’ cannot be used in this case. We checked model adequacy (multicollinearity, QQ-plots, normal distribution of the residuals, and homoscedasticity) with the ‘plot_model’ function from the sjPlot package (Lüdecke, 2018). We assessed model fit using conditional (variance explained by the entire model, including both fixed and random effects) and marginal R2 (variance explained by the fixed effects) values, estimated following Nakagawa and Schielzeth (2013). Model significance was tested with a likelihood ratio test and significance of fixed effects with a type II Wald χ2 test. Standardized beta coefficients and their 95% confidence intervals were extracted with the ‘plot_model’ function from the sjstats package.
Results
Growth and Site Index
Average stand volume, basal area, DBH, height and tree density varied across the nine climatic locations, and all except tree density tended to increase as aridity decreased (Table 1). Total volume (merchantable plus non-merchantable) varied from 163 to 637 m3 ha–1 at the interior locations and was 929 m3 ha–1 at the coastal location. Live basal area ranged from 24.3 to 53.8 m2 ha–1 at the interior locations and was 79.1 m2 ha–1 at the coast. Density of live trees > 9 cm diameter at 1.3 m (DBH) was between 468 and 985 stems ha–1, and understory tree (<9 cm DBH and >1.3 m height) density varied from 67 to 653 stems ha–1. Average DBH of canopy layer (codominant and dominant) trees varied from 25.9 to 40.0 cm, and average height varied from 19.2 to 31.1 m (data not shown).
Douglas-fir site index varied between 10.0 m and 40.6 m in individual plots across the climate gradient (Supplementary Table I-2) and was highest at the coastal location. Site index (log10 transformed) of Douglas-fir increased with mean annual precipitation and decreased with aridity (summer heat: moisture index and annual heat moisture index) (Figures 2, 3). At the interior locations, average Douglas-fir site index was 28% lower in the most arid compared to the least arid site. Douglas-fir site index in the interior was highest at Two-bit Creek, one of the most arid locations, and this site did not fall within the overall pattern. The site index of species other than Douglas-fir followed the same trends as Douglas-fir (i.e., lowest values are at the arid locations, except the highest values are at Two-bit Creek) (Supplementary Table I-1).
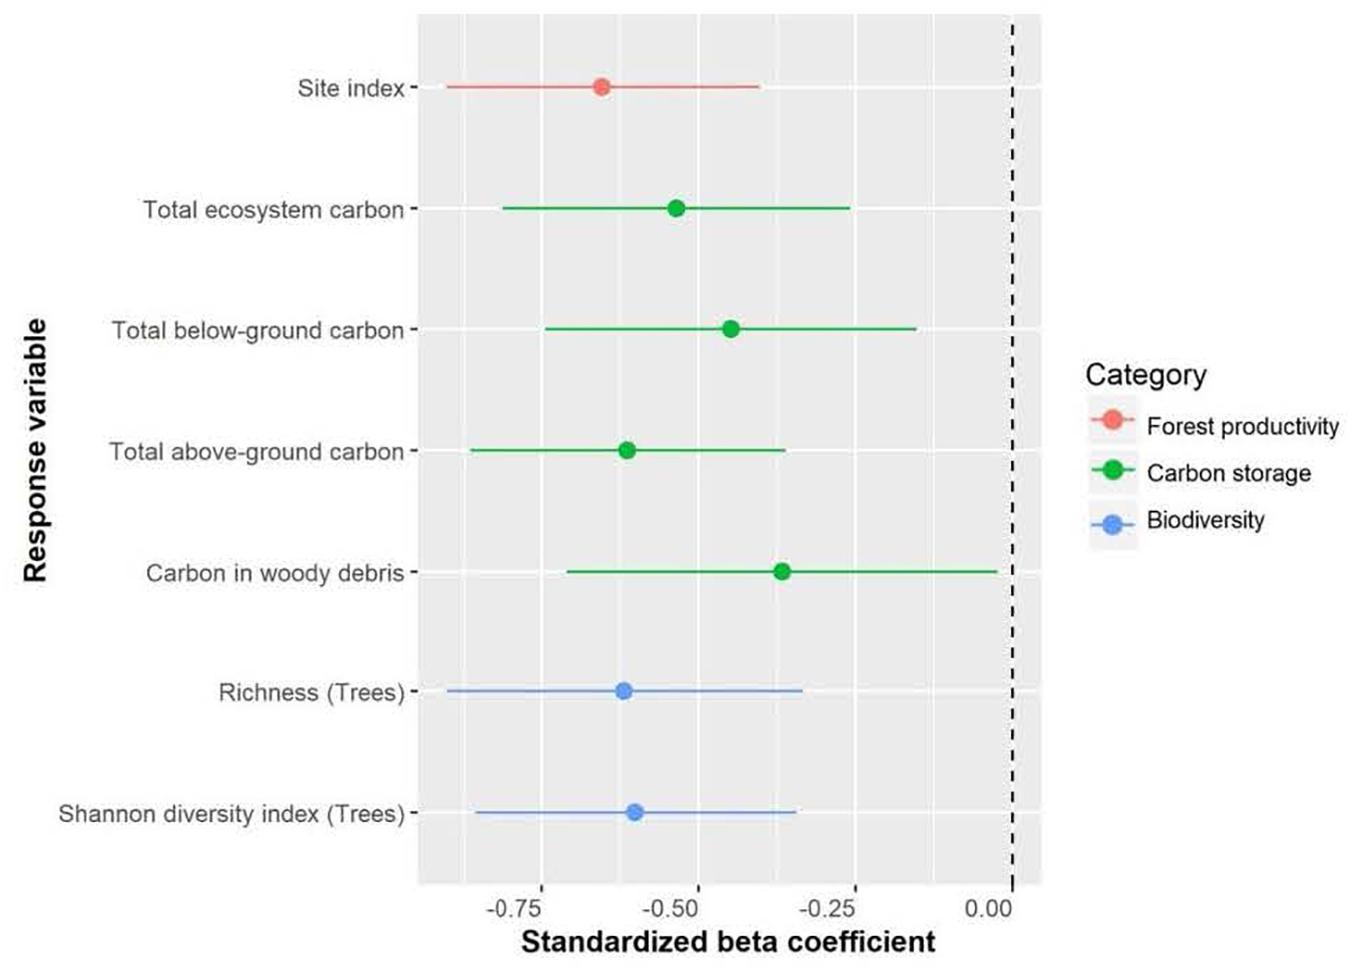
Figure 2. Effect of annual heat moisture index (AHM, 1981-2010, calculated as (mean annual temperature + 10)/(mean annual precipitation/1000), used as an aridity index) on site index, carbon storage and biodiversity of Douglas-fir-dominated forests. Circles indicate average estimates and lines indicate 95% confidence intervals.
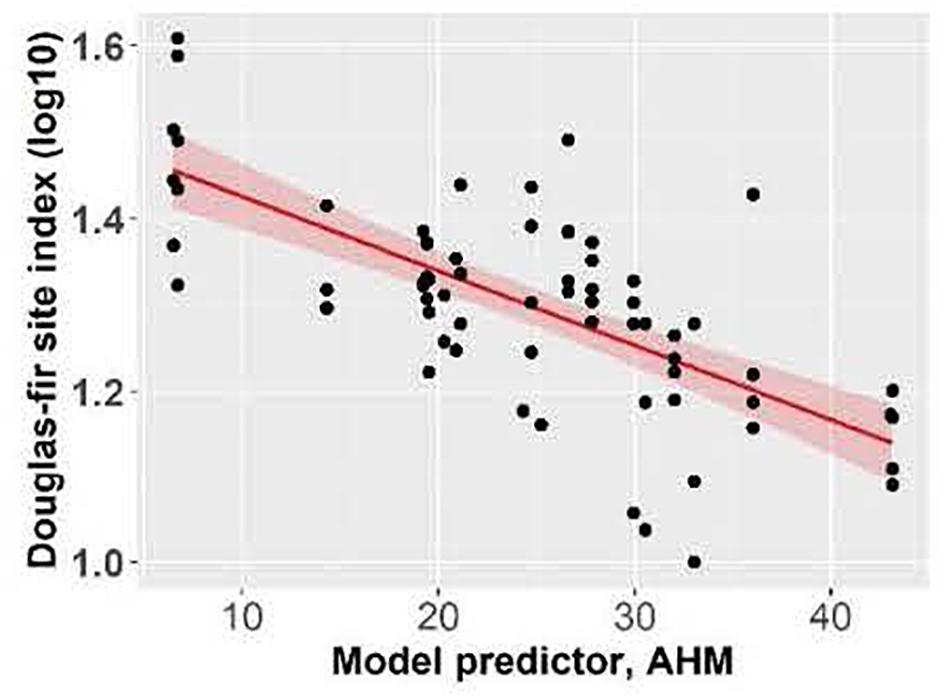
Figure 3. Effect of annual heat moisture index (AHM) on Douglas-fir site index. Linear mixed-effects models were used to estimate marginal R2 = 0.41. Each point represents one measurement per plot (113 plots in total). Douglas-fir site index was log-transformed, and the figure presents log10-transformed data.
Carbon Storage
Total ecosystem C, C stored aboveground (sum of live and dead trees of all sizes, downed woody debris, stumps, vegetation), and C stored belowground (sum of roots, forest floor, mineral soil) all significantly increased with increasing mean annual precipitation and decreasing aridity (summer heat moisture index and annual heat moisture index) (Figures 4, 5). Carbon stored in total downed woody debris and in coarse woody debris or fine woody debris alone decreased with increasing aridity (summer heat moisture index and annual heat moisture index). C stocks in mineral soil in each of the three sample layers (0-15 cm, 15-35 cm, and 35-55 cm) and in all three layers combined increased with increasing mean annual precipitation. Carbon storage at a depth of 15-35 cm and for all three depths combined increased with decreasing summer heat moisture index. The amount of C stored was not correlated with the climate variables we tested for the following pools: large aboveground live trees (sum of stem, bark, branches and foliage of trees > 9 cm DBH and > 1.3 m in height), small aboveground live trees (sum of stem, bark, branches and foliage of trees < 9 cm DBH and > 1.3 m in height), large or small dead standing trees (sum of stem, bark, branches), tree roots, small woody debris, the forest floor, and understory plants (trees/shrubs ≤ 1.3 m tall, herbs and bryoids). Aboveground to belowground C ratio was also not correlated with climatic variables. There was a non-significant trend of increasing C stored in aboveground live trees as mean annual precipitation increased and aridity (summer heat moisture index and annual heat moisture index) decreased. There were no clear relationships between the distribution of C amongst the three understory plant groups and climatic variables.
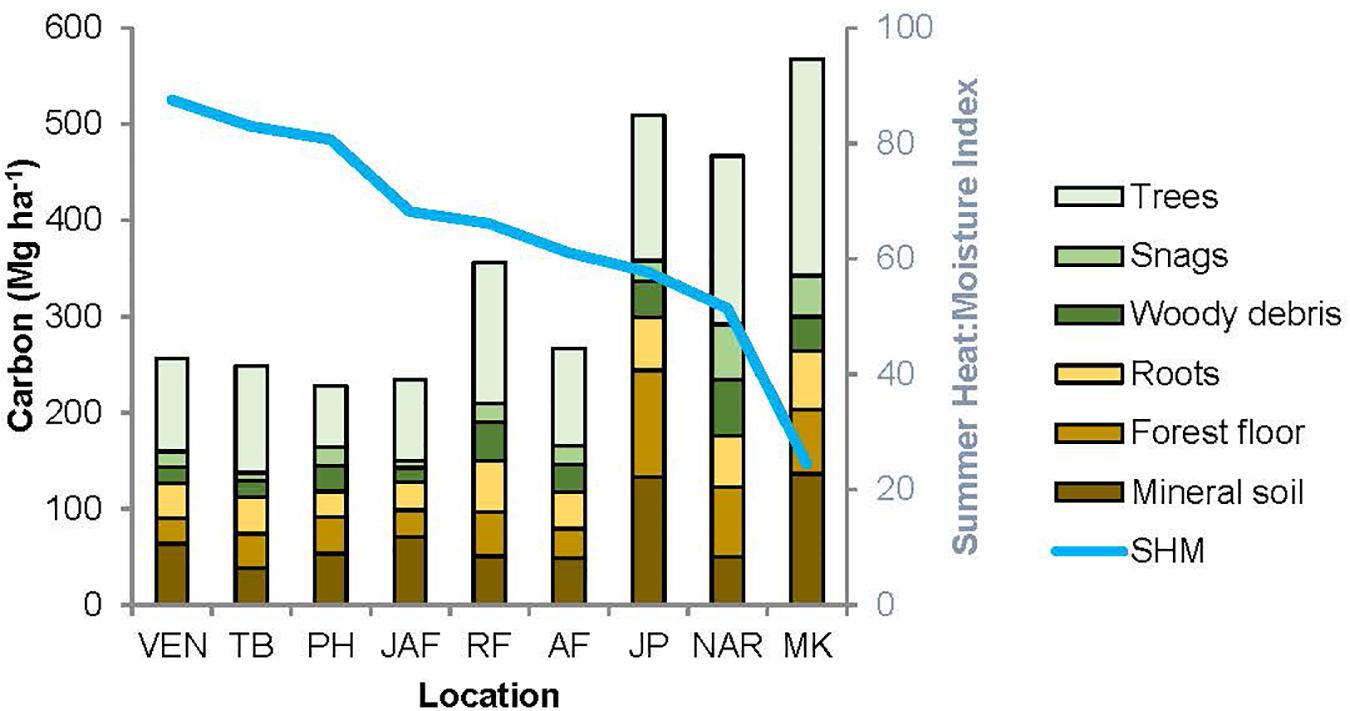
Figure 4. Distribution of carbon amongst the major pools, for the nine study locations. The locations are arranged in order of decreasing summer heat: moisture index (SHM), shown by the blue line. VEN, Venables; TB, Two-bit Creek, PH, Peterhope Lake; JAF, Jaffray; RF, Redfish Creek; AF, Alex Fraser; JP, John Prince; NAR, Narrows Creek, MK, Malcolm Knapp.
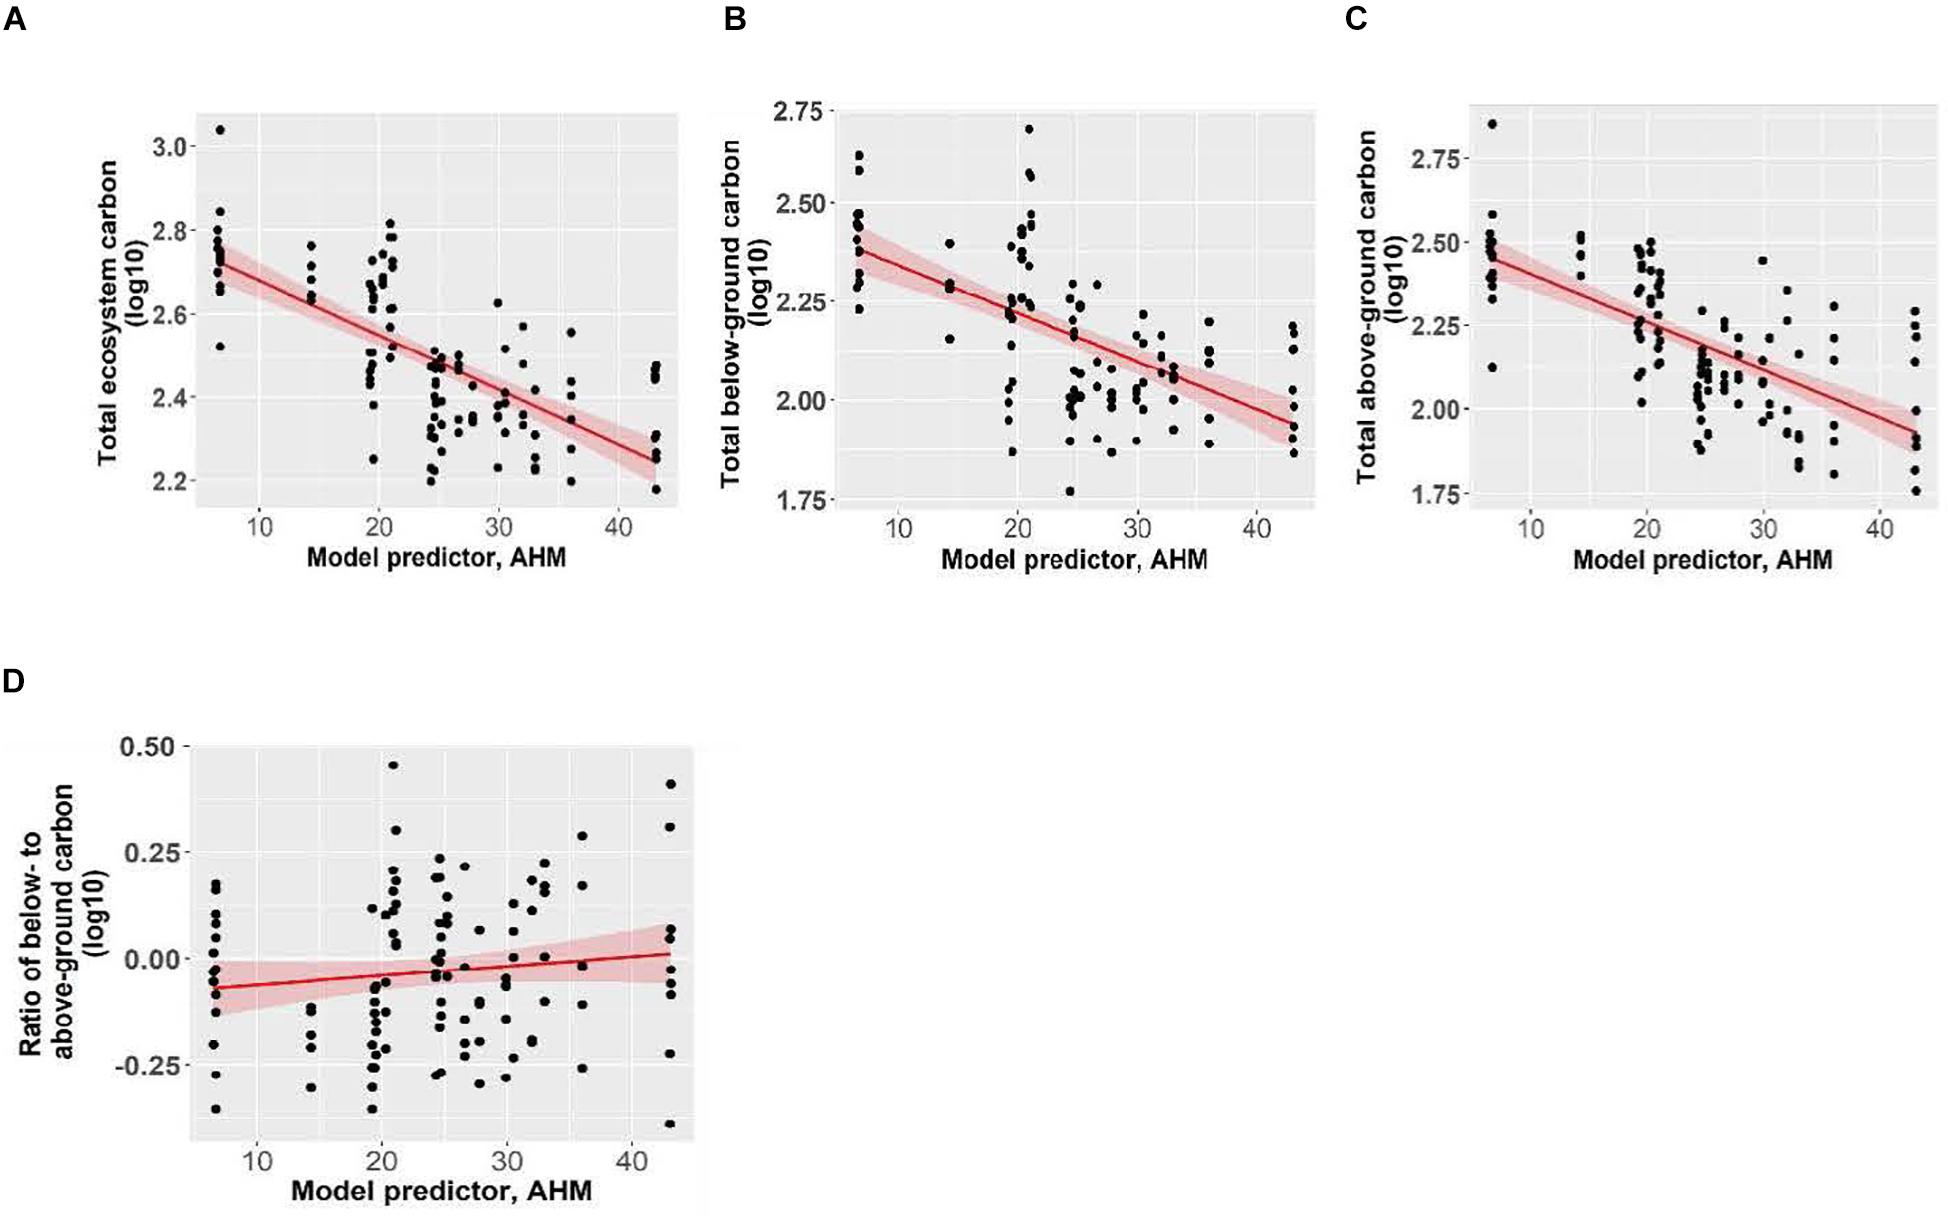
Figure 5. The effect of annual heat moisture index (AHM; 1981-2010) on panels (A) total ecosystem carbon, (B) total belowground carbon, (C) total aboveground carbon, and (D) ratio of below- to above-ground carbon of Douglas-fir dominated forests. Pseudo coefficients of determination were obtained for linear mixed effects models. Marginal R2 = 0.34 for total ecosystem carbon, R2 = 0.40 for total above-ground carbon, R2 = 0.23 for total below-ground carbon and R2 = 0.01 for the ratio (non-significant). Each point represents one measurement per plot (113 plots in total). The figures present log10-transformed data.
The relative size of C pools averaged across all sites was aboveground live trees (122.6 Mg ha–1) > mineral soils (74.6 Mg ha–1) > forest floor (50.5 Mg ha–1) > roots (47.4 Mg ha–1) > large deadwood (snags + coarse woody debris) (40.6 Mg ha–1) > small and fine woody debris (5.4 Mg ha–1) > understory plants (0.5 Mg ha–1) and stumps (< 0.1 Mg ha–1). Supplementary Table I-3 lists C stocks (Mg ha–1) in each pool by location.
Aboveground C in the interior and coastal forests was dominated by live trees > 9 cm DBH, which comprised an average of 73% and a maximum of 82% of the aboveground C, and 30-45% of the total ecosystem C (Table 2). Small live or dead trees (<9 cm DBH) were a relatively minor pool at all locations (average 6.3 Mg ha–1, or about 3% of total ecosystem C). On average, aboveground live trees (all sizes) contained the same amount of C as the forest floor combined with the upper 55 cm of mineral soil. Understory plants were a particularly small pool at the two wettest locations where canopy cover was high and the understory shaded. While downed woody debris was typically an important C pool, some individual plots in arid locations had almost none (1.1 Mg ha–1). Coarse woody debris was the dominant downed woody debris pool, storing maximums of 17% of aboveground C and10% of total ecosystem C. Although small woody debris and fine woody debris were generally small pools, at several plots in the most arid locations their combined C storage exceeded that stored in coarse woody debris. C stored in dead standing trees was highly variable between and within locations, but on average this pool comprised about 12% of the aboveground C.
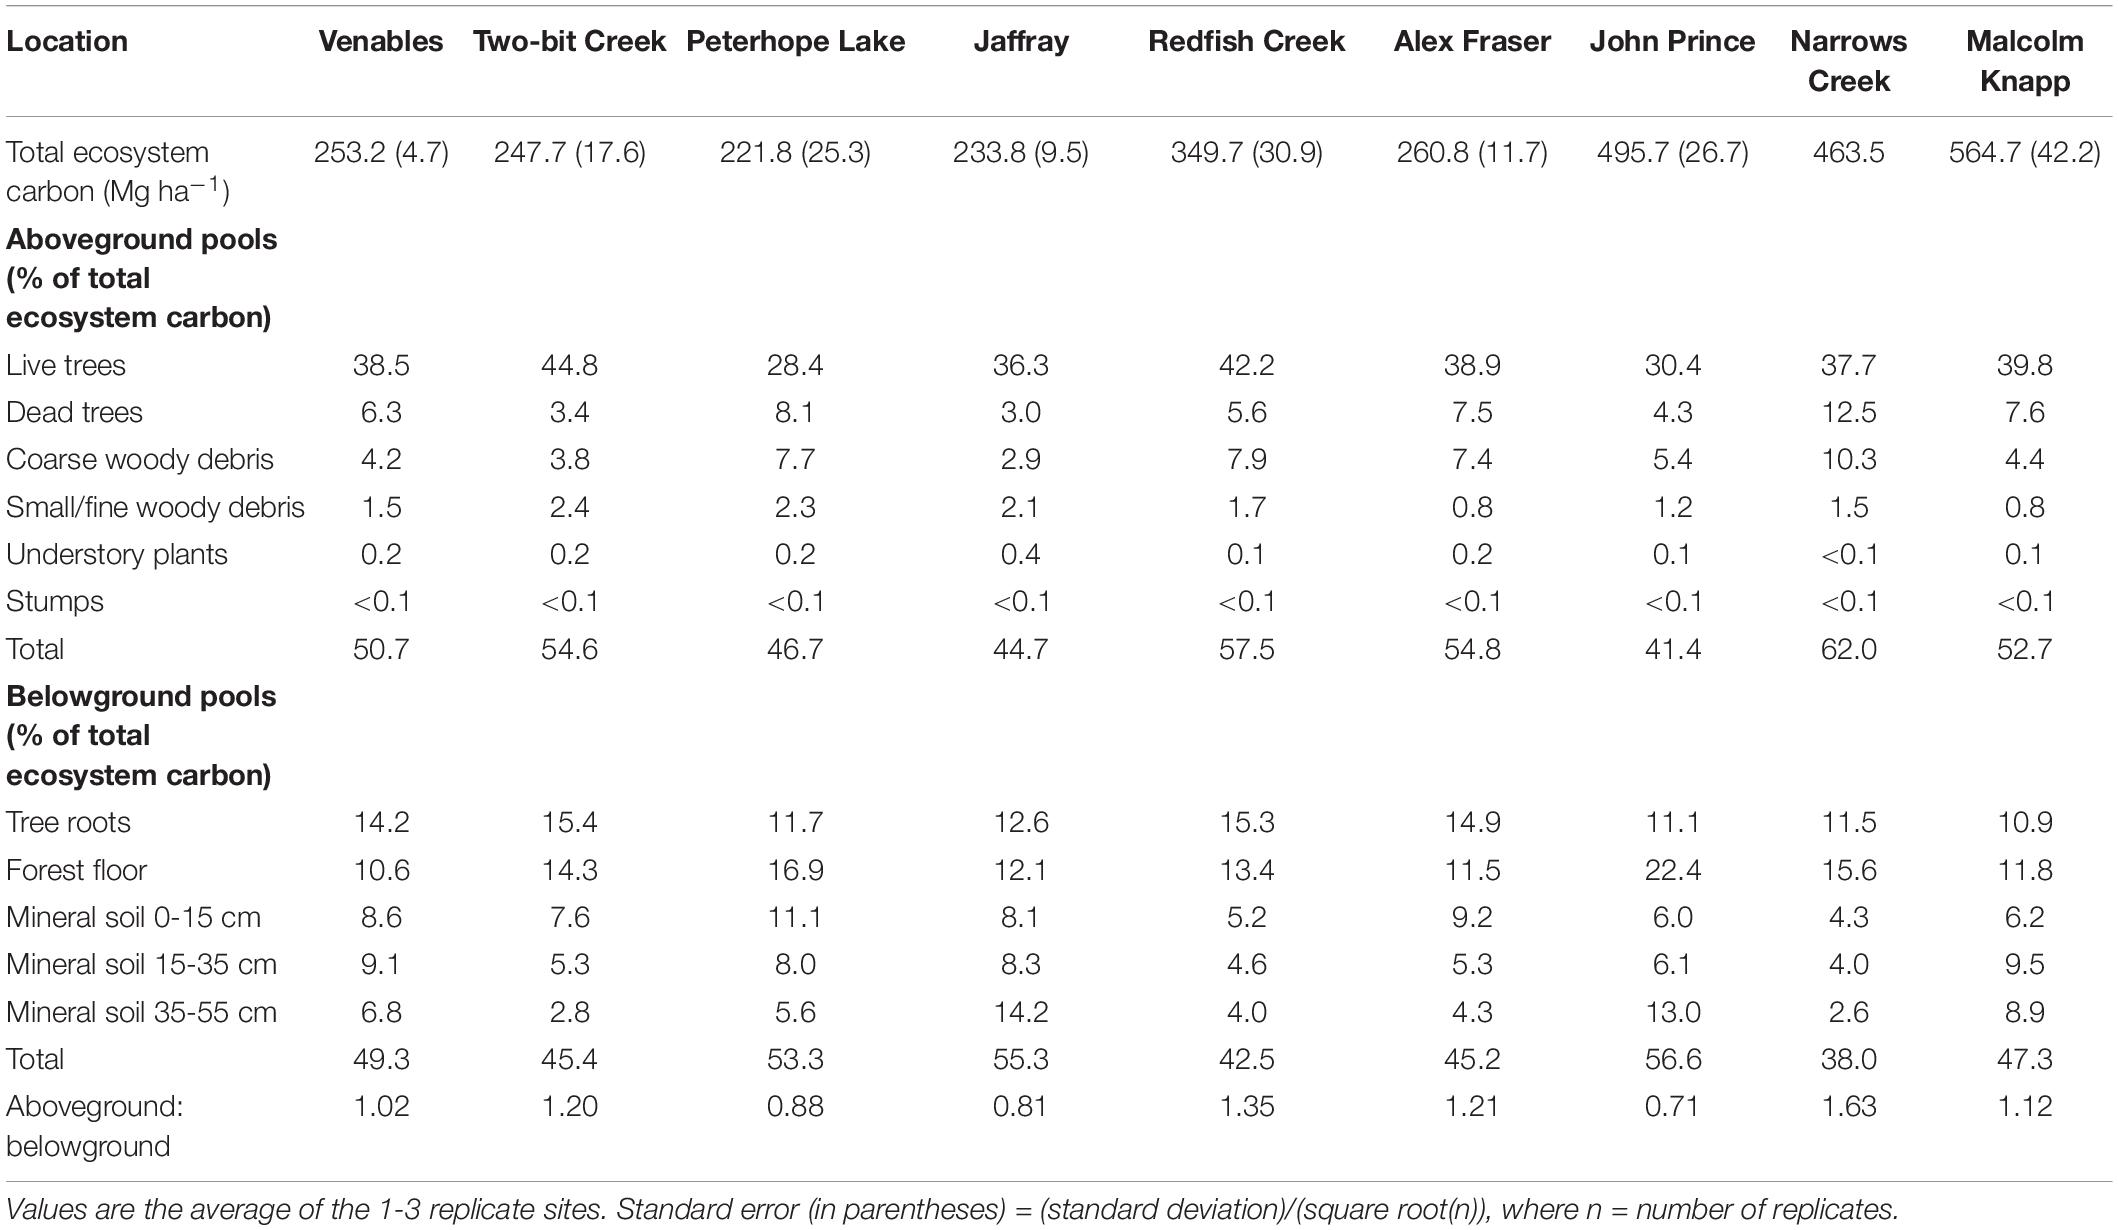
Table 2. Ecosystem carbon, percent carbon by pool, and aboveground to belowground carbon ratio.
The amount of C stored belowground was highly variable among locations, but mineral soil (0-55 cm depth) was consistently the dominant belowground C pool. At most locations mineral soil was the second largest pool in the forest ecosystem, surpassed only by aboveground live trees. At one-third of the locations (i.e., the coldest site and two sites with low total ecosystem C) more C was stored belowground than in aboveground pools. At the interior locations, mineral soil to a depth of 55 cm comprised up to two-thirds of the C stored belowground, and up to one third of the total ecosystem C. For the coastal location, the top 55 cm of mineral soil contained an average of about half of the belowground C and one-quarter of the total ecosystem C. On average, mineral soil at a depth of 15-55 cm stored two to three times as much C per hectare as the top 15 cm. Mineral soil C storage generally decreased with depth but at two locations (the coldest site and the coastal site) it increased. The forest floor generally stored about 20-35% of the belowground C and about 10-20% of the total ecosystem C. The forest floor was a particularly important C pool at the coldest, most northern location (John Prince), where on average forest floor C storage was more than twice as much per hectare as at warmer, more southerly interior locations. Tree roots were calculated to store about one-fifth to one-third of the belowground C and about 10-15% of total ecosystem C.
Biodiversity
Richness of tree species increased as summer heat moisture index and annual heat moisture index decreased, with tree species richness increasing from an average of one to four species with decreasing aridity (Figure 6 and Supplementary Table I-4). Herb richness increased from an average of 2 to 14 species with decreasing mean annual precipitation. Shrub and bryoid richness (average 5 and 6 species, respectively) were not linearly correlated with the climate variables we tested. Shannon’s diversity index of tree species increased as summer heat moisture index and annual heat moisture index decreased. Shannon’s diversity index of the three understory plant groups was not correlated with the climate variables. With the exception of goatsbeard (Tragopogon dubius) and orange hawkweed (Hieracium aurantiacum), which comprised <1% cover in <5% of plots at the Interior Douglas-fir zone sites, invasive species were not encountered in the forests.
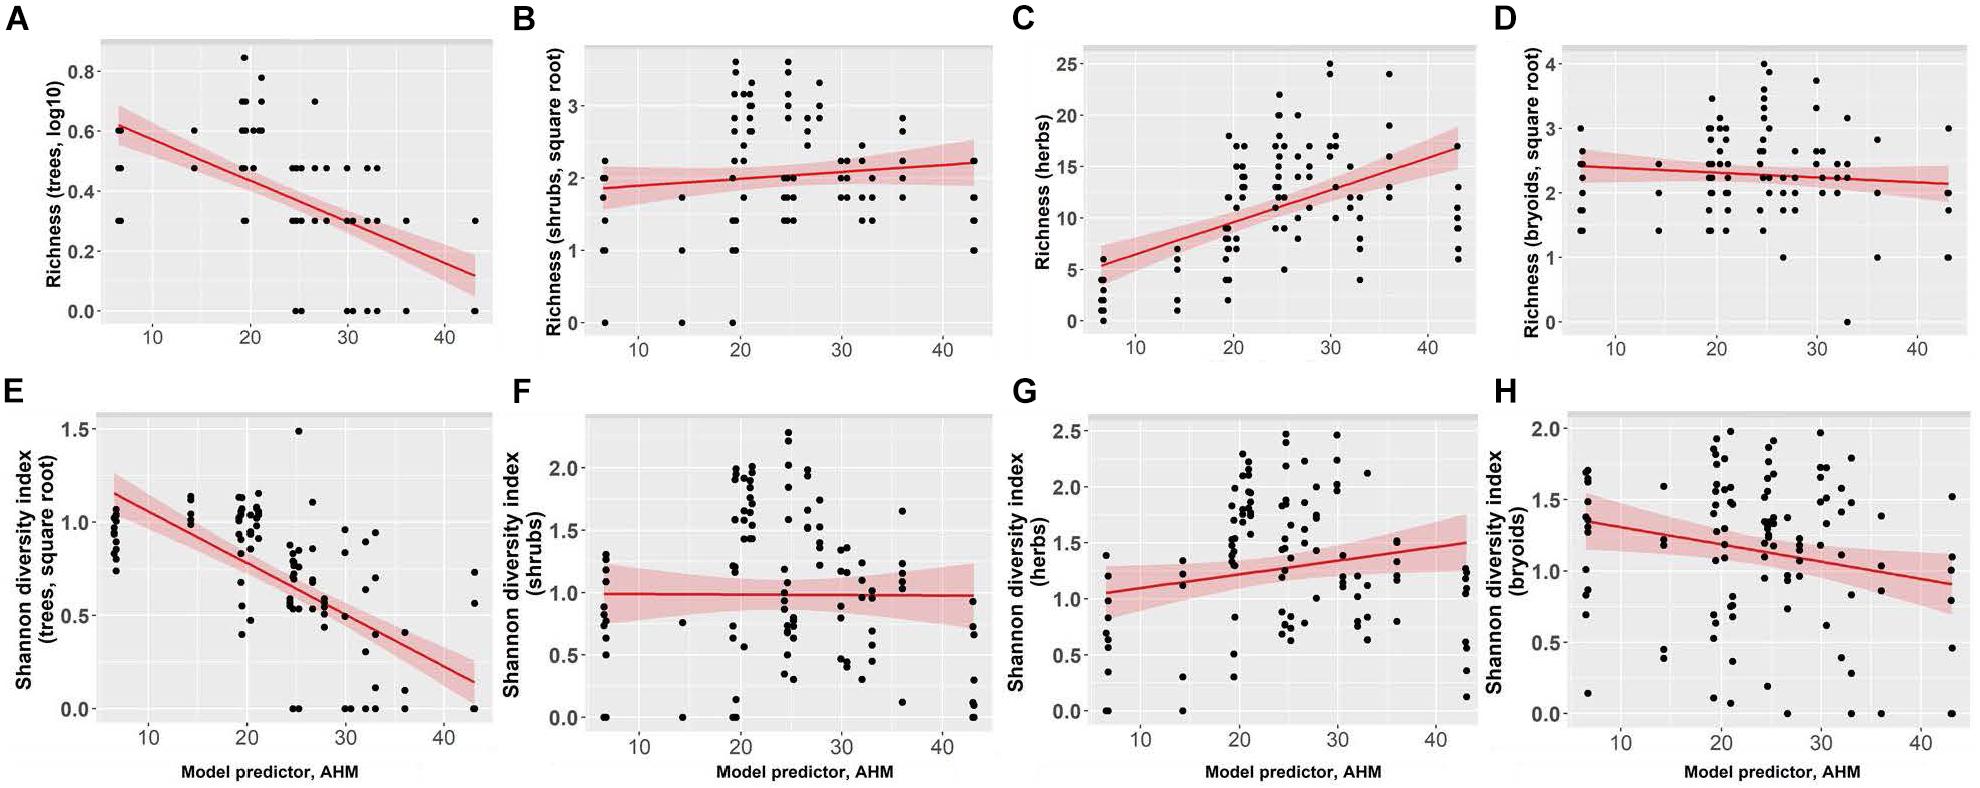
Figure 6. Effect of annual heat moisture index (AHM) on richness for panels (A) trees, (B) shrubs, (C) herbs, and (D) bryoids, and Shannon’s diversity index for panels (E) trees, (F) shrubs, (G) herbs, and (H) bryoids. In each figure each point represents one measurement per plot (113 plots in total). Shannon’s diversity index (trees) and tree richness were square root and log-transformed, respectively. Figures present square root and log10-transformed data.
Total ecosystem C storage increased with richness of tree species and decreased with richness of all functional groups combined (Figure 7). Carbon stored in aboveground live trees decreased with increasing herb richness and Shannon’s diversity index of herbs (Figure 8).
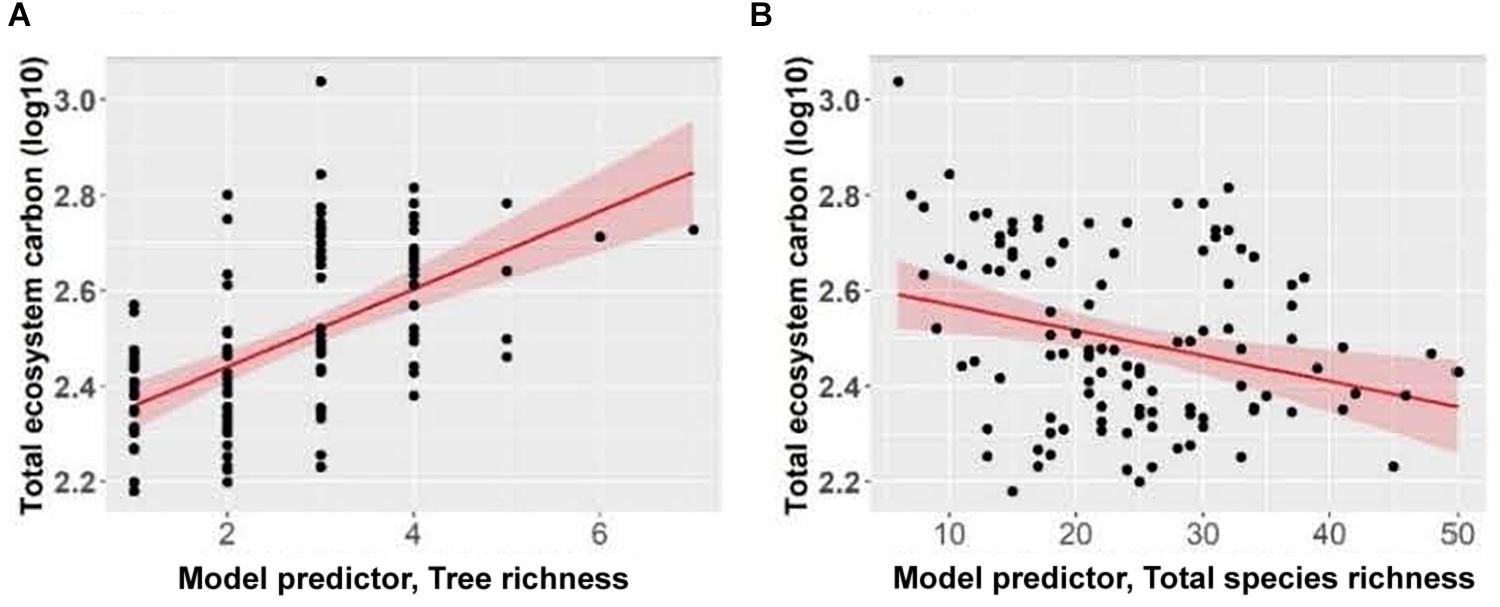
Figure 7. Effect of panels (A) tree richness and (B) total species richness on total ecosystem carbon of Douglas-fir dominated forests. Each point represents one measurement per plot (113 plots in total). Total ecosystem carbon (Mg ha–1) was log10-transformed, and the figure presents log10-transformed data.
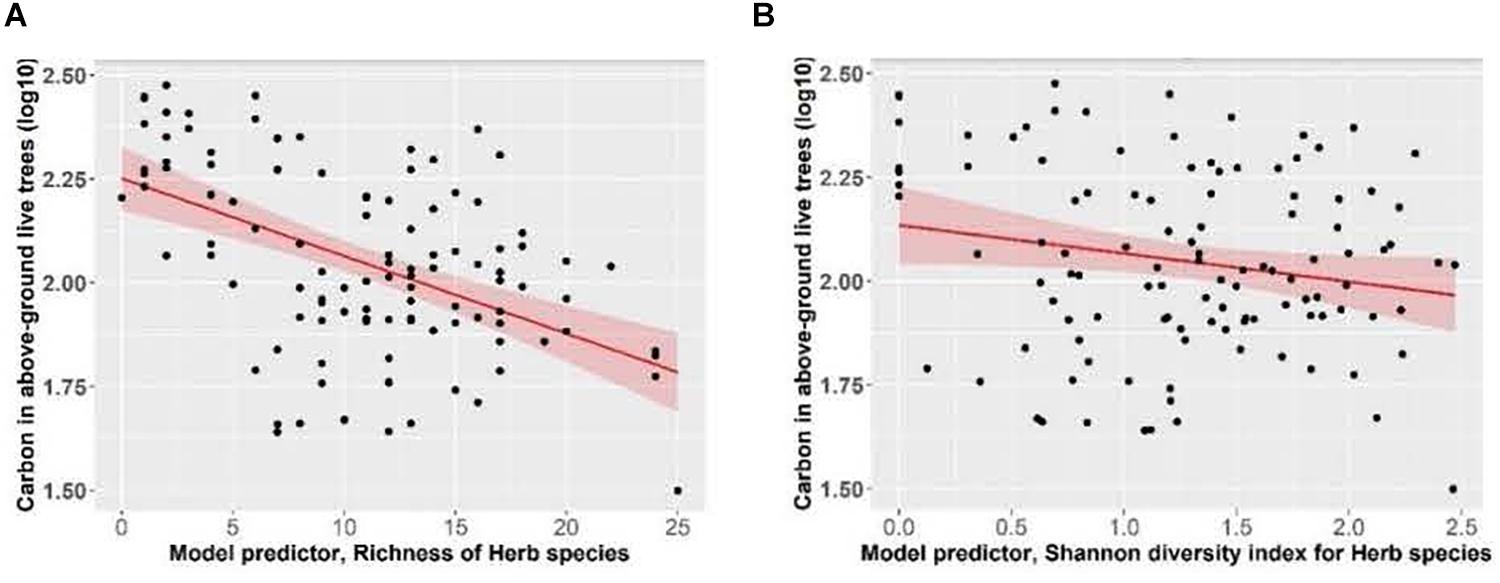
Figure 8. Effect of panels (A) herb species richness and (B) herb species Shannon diversity index, on carbon stored in above-ground live trees (live trees that have a DBH > 1.3 cm; data includes stems, foliage, branches and bark) of Douglas-fir dominated forests. Linear mixed-effects models were used to estimate the Marginal R2 = 0.17 (A) and R2 = 0.04 (B). Each data point represents one measurement per plot (113 plots in total). Carbon in above-ground live trees (Mg ha–1) was log10-transformed, and the figure presents log10-transformed data.
Discussion
In general, tree diversity, potential productivity as measured by site index, and C storage each decreased with increasing aridity. Thus, the forecast of warmer temperatures and drier summers (i.e., increased aridity) over the coming decades in southern Canada (Zhang et al., 2019) suggests there will be a future decline in tree diversity, timber production, and C storage in British Columbia’s interior Douglas-fir forests. Conversely, the species richness of herbaceous plants was positively correlated with increasing aridity, emphasizing the need to consider more than just the tree layer when assessing vegetation diversity in forests. At a third of our locations, more C was stored belowground than in aboveground pools, and at two of the nine locations mineral soil C storage increased with depth. These findings underlie the need to consider both above and belowground C storage in forest management.
Relationship Between Site Index and Climate
Overall, site index increased with increasing precipitation and declining aridity, supporting our first hypothesis. Boisvenue and Running’s (2006) review of 49 papers indicated that warming climatic conditions from 1950 to 2005 have generally had a positive impact on forest productivity when water is not limiting, but the positive effect declines when warming is combined with limited water availability (Food and Agriculture Organization [FAO], 2012). Our finding reflects the strong influence of moisture limitations on Douglas-fir growth, as has been reported extensively in the literature (Littell et al., 2008; Chen et al., 2010; Griesbauer and Green, 2010; Griesbauer et al., 2011; Restaino et al., 2016). Using the 3-PG process-based model and data from the biogeoclimatic ecosystem classification system, Coops et al. (2010) estimated that site index of interior Douglas-fir in British Columbia could decline by as much as 40% on individual sites by 2100. On our sites, we found that interior Douglas-fir site index averaged 28% lower on the most arid compared to the least arid site. However, in contrast to the overall trend, average site index was highest at one of our most arid sites. Here it is likely that non-climatic factors were more influential for site index, including parent material, topography, or soil quality. The latter integrates soil texture, structure, depth and organic matter content and is particularly important in regions with drought periods during the active growing season (Grier et al., 1989; Kayahara and Pearson, 1996). As climate changes, negative impacts of drought on Douglas-fir productivity are expected to overshadow growth benefits of a longer growing season, reduced frost frequency, and fertilization effects of atmospheric CO2 enrichment (Gedalof and Berg, 2010; Restaino et al., 2016). An exception may be cool, high elevation interior Douglas-fir stands where temperature limits growth more than water availability; here, projected climate change scenarios may actually increase productivity (Case and Peterson, 2005; Littell et al., 2008; Griesbauer and Green, 2010) but such sites were not part of our study.
Relationship Between Carbon Stocks and Climate
Total ecosystem, total aboveground, total belowground, mineral soil and CWD carbon stocks significantly increased with increasing precipitation and declining aridity, supporting our first hypothesis. However, when considered individually, C storage in aboveground live trees, roots, standing dead trees, forest floor, and understory plants were not significantly correlated with the climatic variables we tested. The lack of a significant relationship between aboveground live tree C stocks and precipitation or aridity contrasts with our site index findings and is surprising given the close relationship between productivity and C storage in trees (Food and Agriculture Organization [FAO], 2012). Many studies from around the world have found that C stored in live trees is related to precipitation and temperature, either positively or negatively (Heimann and Reichstein, 2008; Food and Agriculture Organization [FAO], 2012). Our C analysis did not account for variation in stand age amongst the nine sites, whereas site index estimates overcome stand age differences by modeling tree heights to a standard reference age, which may explain these different outcomes.
We examined multiple C pools whereas most field studies investigating climatic impacts on variation in C storage within a forest type consider only one or two pools. Of those studies that measured total ecosystem C stocks, Larocque et al. (2014) found that in Eastern Canadian balsam fir (Abies balsamea) and black spruce (Picea mariana) forests, C in trees, understory plants, downed logs, litter, and soil organic and mineral layers did not vary significantly between sites differing in mean annual temperature by 4°C. In European Scots pine (Pinus sylvestris) forests, total ecosystem C decreased non-linearly as latitude increased and temperature decreased (Vucetich et al., 2000).
In our study, woody debris C stocks generally increased as aridity decreased, although the correlations were weak and variability within stands was high, in agreement with Bond-Lamberty and Gower (2008). The correlation between climatic factors and C in coarse woody debris was stronger than between climate and C in small woody debris, supporting the findings of Woodall and Liknes (2008) who, in a nationwide United States survey, found that woody debris C stocks were positively correlated with available moisture and negatively correlated with maximum temperature.
Forest floor C storage was high at our coldest site, which fits with literature reporting a slower decomposition rate and greater C storage in forest floors as mean annual temperature decreases (Currie et al., 2002). However, our other sites did not fit this pattern closely, nor was forest floor C related to precipitation or aridity, perhaps due to factors such as differences in litter characteristics of secondary tree species. In contrast to our first hypothesis, the ratio of aboveground to belowground C was not correlated with climatic factors, likely due to non-significant correlations between some important C pools and climate.
Relationship Between Mineral Soil Carbon Stocks, Depth, and Climate
Our finding that the amount of C stored in mineral soil increased with increasing mean annual precipitation and decreasing summer heat moisture index agrees with Post et al. (1982); Jobbágy and Jackson (2000). However, our second hypothesis was rejected because correlations between mineral soil C and precipitation did not decline with soil depth, contrasting with Jobbágy and Jackson (2000). We also expected to find decreasing mineral soil C stocks with depth, as reported by others (Li et al., 2013; Lawrence et al., 2015; Chandler, 2016), but this was not consistently the case. Our finding that mineral soil C storage at 15-55 cm could be three times greater than C stored at 0-15 cm confirms the need to measure mineral soil C below 15 cm when calculating total ecosystem C, as recommended by Grand and Lavkulich (2011). In Pacific Northwest coastal forests, at least 50% of soil C storage is below 20 cm depth (Homann et al., 2005; Grand and Lavkulich, 2011; Defrenne et al., 2016) and Batjes (1996) reported an approximately 60% increase in the global soil organic C budget estimate if a second meter of soil is included in the calculation.
Distribution of Ecosystem Carbon
Our third hypothesis concerned the distribution of total C storage amongst ecosystem pools, which was as expected, and similar to estimates in the literature (e.g., Turner et al., 1995 reported approx. 50% of C in mineral soils, 33% in trees, 10% in woody debris and 6% in the forest floor in temperate forests). In our study, trees were generally a larger C pool than mineral soils, probably because we did not sample the entire mineral soil profile. We found that C stored in aboveground live trees in our 82-123 year-old stands varied from 62.9 to 224.6 Mg ha–1 compared to Harmon et al.’s (1990) estimates of 131.8 Mg ha–1 for 60-year old and 325.5 Mg ha–1 for 450 year-old coastal Douglas-fir-western hemlock forests. Hudiburg et al. (2009) illustrate that tree C storage estimates from different studies vary widely, ranging from 5 Mg ha–1 (Canada) to 315 Mg ha–1 (Coast Range, Pacific Northwest, United States) assuming that 1 Mg of biomass = 0.5 Mg C. We found that live trees stored 28-45% of ecosystem C (40-60%, including roots), which is comparable to proportions reported in field and modeling studies in Douglas-fir-western hemlock forests (Harmon and Marks, 2002). The range for coarse woody debris C storage was 6.8–47.7 Mg C ha–1 (3–103% of total ecosystem C) in our study compared to estimates in the literature of 3.8–19 and 97 Mg C ha–1 for 60 and 450 year-old Douglas-fir-western hemlock stands, respectively (Harmon et al., 1990). Coarse woody debris accounted for 9% of C storage in old-growth forests in wet and very wet Interior Cedar-Hemlock subzones in east-central BC (Matsuzaki et al., 2013), and 4-10% in a survey of six forest ecosystems (Vogt, 1991). Higher percentages (15-25%) were reported by Harmon and Marks (2002); Pregitzer and Euskirchen (2004) for temperate forests. Most woody debris studies focus on coarse woody debrisunder the assumption that smaller debris is an insignificant C pool (e.g., Kranabetter, 2009), but we found that C storage in smaller pieces (≤7.5 cm diameter) can be comparable to that in coarse woody debris in arid locations. In our study, the forest floor stored about 11-22% of ecosystem C, compared to only about 2-5% in several field and one modeling study in Douglas-fir-western hemlock forests (Harmon and Marks, 2002). Understory plants were consistently insignificant C pools on our sites, supporting Brown’s (2002) recommendation to exclude them from forest C accounting for most temperate upland sites. Similarly, Hudiburg et al. (2009), found that understory biomass ranged from 1 to 5% of live biomass in most ecoregions in the Pacific Northwest of the United States, and concluded that their exclusion from C accounting would not significantly underestimate biomass. Johnson et al. (2017) determined that average aboveground C stocks in live understory vegetation across the United States was 0.98 Mg ha–1, which is about double what we found. Understory plants can be significant C pools where deep moss layers occur, such as in boreal forests (Bona et al., 2013), but moss layers were thin on our sites. We used standardized equations rather than direct measurements to estimate tree root C, so we could not determine whether aridity increased the fraction of net primary production allocated belowground as reported by others including Coops et al. (2010).
Relationship Between Biodiversity, Carbon Storage, and Climate
Most but not all studies included in literature reviews and meta-analyses show that tree biodiversity is positively associated with forest productivity, C storage, and ecosystem resilience (Thompson et al., 2011, 2012; Zhang et al., 2012; Forrester and Bauhus, 2016), and predicted future increases in aridity are expected to have a negatively affect on biodiversity (Walther et al., 2002). This led to development of our fourth hypothesis that biodiversity measures for vegetation would be positively correlated with C storage and negatively correlated with aridity. Our results partially support this hypothesis in that we found that high tree species richness was associated with both increased C storage and lower aridity. However, we found that high richness of all functional groups combined was associated with decreased C storage. We also found that richness of herbaceous species increased with decreasing precipitation and increasing aridity. Carbon stored in aboveground live trees was negatively associated with herb richness and Shannon’s diversity index for herbs. Higher herb richness on dry, arid sites is likely related to open stand conditions, compared to closed canopies in the productive, wetter, more humid climates where low light levels are unfavorable to the growth of many herbaceous species. Most forest studies examining linkages between vegetation biodiversity and C storage only consider the tree layer (Liang et al., 2016; Buotte et al., 2020), even though most species richness in forests is found in the understory. A trade-off between vascular plant richness and C storage has been described previously by Burton et al. (2013) who noted that forest management practices that maximize tree C storage tend to create low light levels in the understory unfavorable to development of rich understory plant communities. Alien invasive species are a major cause of biodiversity loss (Thompson et al., 2011), but such species were generally absent in our forests even though the four biogeoclimatic zones where our sites occurred support more invasive species than other zones in British Columbia (British Columbia Ministry of Forests and Lands and Natural Resource Operations, 2019b).
Advantages and Limitations of the Methodology
We took the approach of conducting current field measurements of biodiversity, site index and C stocks across a natural aridity gradient where Douglas-fir grows in British Columbia., using the gradient as a proxy for climate change. Estimating climatic effects on single or multiple C pools has been carried out by others using a similar methodology (Simmons et al., 1996; Case and Peterson, 2005; Tewksbury and Van Miegroet, 2007; Gevana et al., 2013; Yohannes et al., 2015; Chen et al., 2017; Tesfaye et al., 2019). Advantages of this method are that C pools are directly measured in the field and assessments can be made along large climatic gradients representing long time-periods. These studies are also relatively inexpensive because they do not require the infrastructure costs associated with manipulating environmental factors (Baldocchi et al., 2001; Jones et al., 2014). By applying this stock-based approach to examining differences in C storage in biomass and soils our data provide a snapshot of total forest C storage rather than the rates of C uptake and release that can be ascertained with flux-based approaches (e.g., Amiro et al., 2010). Each of these types of study (examinations of stocks and of fluxes) makes different but important contributions to our understanding of forest C dynamics.
Our results must be considered in the context that, for practical reasons, it was not possible to eliminate inter- and intra-site variability along the aridity gradient. For example, lateral variability exists for most soil properties, even within small areas, as was described decades ago (Mader, 1963; Beckett and Webster, 1971). Soil properties also change and develop interactively with climate and vegetation cover, and these changes in climate-vegetation-soil are another source of potential variance along the climate gradient. Total ecosystem C storage for a single climatic region and forest type can also vary along a soil productivity gradient (Kranabetter, 2009). However, with careful site selection and site replication within climatic regions, as we employed in this study, this methodology can prove very useful, especially if the data is compared with that from controlled experiments (Rustad et al., 2001; Garten, 2004). Despite potential sources of variability, we found significant trends across the climate gradient.
Finally, it is important to note that environmental and climatic factors such as nitrogen deposition, air pollution and ozone may alter or even dominate the carbon balance in the future (Heimann and Reichstein, 2008). Additionally, terrestrial ecosystems do not respond to a mean climate, but to the series of actual weather events, including extremes which can “undo” carbon sequestration in prior years (Heimann and Reichstein, 2008).
Conclusion
Our study investigated relationships between climatic factors (mean annual precipitation, mean annual temperature, and two measures of aridity) and biodiversity, potential productivity as measured by site index, and C storage in the Douglas-fir forest type in British Columbia. Tree species richness, Douglas-fir site index and total aboveground, belowground and ecosystem C storage declined with increasing aridity and decreasing precipitation, but were not correlated with temperature as a single factor. Tree species richness was positively correlated with ecosystem C storage and herb species richness was negatively correlated with live tree C stocks. Across the climatic gradient, C storage by ecosystem compartment was in the following order: aboveground live tree biomass > mineral soils to 55 cm depth > coarse woody debris and dead standing trees > forest floor > small and fine woody debris > understory plants. Our study measured mineral soil C to depths greater than in most other studies (55 cm versus 20 cm), finding that mineral soil C stocks at 15-55 cm depth were 2-3 times that of C stocks in the upper 15 cm of the mineral soil profile. Because temperatures in British Columbia’s interior are expected to continue to rise over the coming decades under all RCP scenarios, along with decreased or more variable summer precipitation (Zhang et al., 2019), empirical data is critically needed to aid in forecasting future biodiversity, productivity, and C storage in forests so that appropriate management plans can be developed. Our study contributes to our understanding of C storage in Douglas-fir forest ecosystems and the data will be useful both in the calibration of models for forecasting climate change effects and also for prioritizing forest types for carbon and biodiversity conservation.
Data Availability Statement
The original contributions presented in the study are included in the article/Supplementary Material, further inquiries can be directed to the corresponding author/s.
Author Contributions
WR, SS, BP, and LL conceived the ideas and designed the methodology. WR and SS collected the data. WR and CD analyzed the data. WR, SS, and BP led the writing of the manuscript. All authors contributed critically to the drafts and gave final approval for publication.
Funding
The Natural Sciences and Engineering Research Council of Canada (Grant STPGP 478832-15) funded field work and the Forest Enhancement Society of British Columbia funded field work and preparation of this article.
Conflict of Interest
The authors declare that the research was conducted in the absence of any commercial or financial relationships that could be construed as a potential conflict of interest.
Acknowledgments
This work took place on the traditional lands of the Ktunaxa, Nlaka’pamux, Secwepemc, Dakelh and Halkomelem First Nations. We thank the staff of Brinkman and Associates, the B.C. Ministry of Forests, Lands, Natural Resource Operations and Rural Development, the University of British Columbia, and each of the local partners (Alex Fraser Research Forest, Aspen Planers, B.C. Timber Sales, Canfor, Cooks Ferry Indian Band, Harrop-Procter Community Forest, Interfor, John Prince Research Forest, Kalesnikoff Lumber Co., and Malcolm Knapp Research Forest) for their contributions in locating the study sites. We also thank the many members of the Simard Lab who assisted in collecting the field data and processing the samples, the B.C. Ministry of Environment for soil carbon analysis, and the Canadian Forest Service for assistance in carbon budget calculations. A portion of this work has been authored by UT-Battelle, LLC under Contract No. DE-AC05-00OR22725 with the United States Department of Energy. The publisher, by accepting the article for publication, acknowledges that the United States Government retains a non-exclusive, paid-up, irrevocable, world-wide license to publish or reproduce the published form of this manuscript, or allow others to do so, for United States Government purposes. The Department of Energy will provide public access to these results of federally sponsored research in accordance with the DOE Public Access Plan (http://energy.gov/downloads/doe-public-access-plan).
Supplementary Material
The Supplementary Material for this article can be found online at: https://www.frontiersin.org/articles/10.3389/ffgc.2021.682076/full#supplementary-material
References
Al-Shammary, A. A. G., Kouzani, A. Z., Kaynak, A., Khoo, S. Y., Norton, M., and Gates, W. (2018). Soil bulk density estimation methods: a review. Pedosphere 28, 581–596. doi: 10.1016/s1002-0160(18)60034-7
Amiro, B. D., Barr, A. G., Barr, J. G., Black, T. A., Bracho, R., Brown, M., et al. (2010). Ecosystem carbon dioxide fluxes after disturbance in forests of North America. J. Geophys. Res. 115:G00K02.
Anderegg, W. R. L., Schwalm, C., Biondi, F., Camarero, J. J., Koch, G., Litvak, M., et al. (2015). Pervasive drought legacies in forest ecosystems and their implications for carbon cycle models. Science 349, 528–532. doi: 10.1126/science.aab1833
Arrouays, D., and Pelissier, P. (1994). Modeling carbon storage profiles in temperate forest humic loamy soils in France. Soil Sci. 157, 185–192. doi: 10.1097/00010694-199403000-00007
Baldocchi, D., Falge, E., Gu, L., Olson, R., Hollinger, D., Running, S., et al. (2001). FLUXNET: a new tool to study the temporal and spatial variability of ecosystem-scale carbon dioxide, water vapour, and energy flux densities. Bullet. Am. Meteorol. Soc. 82, 2415–2434. doi: 10.1175/1520-0477(2001)082<2415:fantts>2.3.co;2
Bates, D., Maechler, M., Bolker, B., Walker, S., Christensen, R. H. B., Singmann, H., et al. (2018). lme4: Linear Mixed-Effects Models using “Eigen” and S4. Available online at: https://cran.r-project.org/web/packages/lme4/index.html (accessed June 1, 2020).
Batjes, N. H. (1996). Total carbon and nitrogen in the soils of the world. Eur. J. Soil Sci. 47, 151–163. doi: 10.1111/j.1365-2389.1996.tb01386.x
Becker, P., and Nichols, T. (2011). Effects of basal area factor and plot size on precision and accuracy of forest inventory estimates. North. J. Appl. For. 28, 152–156. doi: 10.1093/njaf/28.3.152
Boisvenue, C., and Running, S. W. (2006). Impacts of climate change on natural forest productivity – evidence since the middle of the 20th century. Glob. Chang. Biol. 12, 862–882. doi: 10.1111/j.1365-2486.2006.01134.x
Bona, K. A., Fyles, J. W., Shaw, C., and Kurz, W. A. (2013). Are mosses required to accurately predict upland black spruce forest soil carbon in national-scale forest C accounting models? Ecosystems 16, 1071–1086. doi: 10.1007/s10021-013-9668-x
Bond-Lamberty, B., and Gower, S. T. (2008). Decomposition and fragmentation of coarse woody debris: re-visiting a boreal black spruce chronosequence. Ecosystems 11, 831–840. doi: 10.1007/s10021-008-9163-y
Brandt, P., Abson, D. J., DellaSala, D. A., Feller, R., and von Wehrden, H. (2014). Multifunctionality and biodiversity: ecosystem services in temperate rainforests of the Pacific Northwest, USA. Biol. Conserv. 169, 362–371. doi: 10.1016/j.biocon.2013.12.003
Braumandl, T. F., and Curran, M. P. (1992). A Field Guide for Site Identification and Interpretation for the Nelson Forest Region. Land Management Handbook 20. Victoria: British Columbia.
British Columbia Ministry of Forests (2017). SiteTools Vers, 4.1 beta. Forest Inventory and Analysis Branch, Victoria, B.C. Victoria: British Columbia.
British Columbia Ministry of Forests and Range (2009). SIBEC Sampling and Data Standards. Version 5.3. Victoria: British Columbia.
British Columbia Ministry of Forests, and Lands and Natural Resource Operations (2019a). Biogeoclimatic Ecosystem Classification Program. Available online at: www.for.gov.bc.ca/hre/becweb/resources/maps/FieldMaps.html (accessed June 1, 2020).
British Columbia Ministry of Forests, and Lands and Natural Resource Operations (2019b). Plants and Animals. Available online at: www.env.gov.bc.ca/soe/indicators/plants-and-animals/invasive-species.html (accessed June 1, 2020).
Brown, S. (2002). Measuring, monitoring, and verification of carbon benefits for forest-based projects. Philos. Trans. R. Soc. Lond. 360, 1669–1683. doi: 10.1098/rsta.2002.1026
Buchholz, T., Friedland, A. J., Hornig, C. E., Keeton, W. S., Zanchi, G., and Nunery, J. (2014). Mineral soil carbon fluxes in forests and implications for carbon balance assessments. Glob. Chang. Biol. Bioenergy 6, 305–311. doi: 10.1111/gcbb.12044
Buotte, P. C., Law, B. E., Ripple, W. J., and Berner, L. T. (2020). Carbon sequestration and biodiversity co-benefits of preserving forests in the western United States. Ecol. Appl. 30:e02039.
Buotte, P. C., Levis, S., Law, B. E., Hudiburg, T. W., Ruopp, D. E., and Kent, J. J. (2019). Near-future forest vulnerability to drought and fire varies across the western United States. Glob. Chang. Biol. 25, 290–303. doi: 10.1111/gcb.14490
Burton, J. I., Ares, A., Mulford, S. E., Olson, D. H., and Puettmann, K. J. (2013). Above-Ground Carbon Storage, Down Wood and Understory Plant Species Richness after Thinning in Western Oregon. Gen. Tech. Rep. GTR-880. Washington, DC: USDA.
Canadell, J. G., Le Quéré, C., Raupach, M. R., Field, C. B., Buitenhuis, E. T., Ciais, P., et al. (2007). Contributions to accelerating atmospheric CO2 growth from economic activity, carbon intensity, and efficiency of natural sinks. Proc. Natl. Acad. Sci. U.S.A. 104, 18866–18870. doi: 10.1073/pnas.0702737104
Canadian Forest Inventory Committee, and Canadian Forest Service (2008). Canada’s National Forest Inventory: Ground Sampling Guidelines. Version 5.0. Ottawa, ON: Canadian Forest Service.
Case, M. J., and Peterson, D. L. (2005). Fine-scale variability in growth-climate relationships of Douglas-fir, North Cascades Range, Washington. Can. J. For. Res. 35, 2743–2755. doi: 10.1139/x05-191
Chandler, R. D. (2016). Soil Organic Carbon Distribution with Depth: Implications for Ecosystem Services. All Theses. 2542. Available online at: https:T1\textbackslash\tigerprints.clemson.edu/all_theses/2542 (accessed June 1, 2020).
Chen, D., Yu, M., Gonzáles, G., Zou, X., and Gao, Q. (2017). Climate impacts on soil carbon processes along an elevation gradient in the tropical luquillo experimental forest. Forests 8:90. doi: 10.3390/f8030090
Chen, P.-Y., Welsh, C., and Hamann, A. (2010). Geographic variation in growth response of Douglas-fir to inter-annual variability and projected climate change. Glob. Chang. Biol. 16, 3374–3385. doi: 10.1111/j.1365-2486.2010.02166.x
Coops, N., Hember, R. A., and Waring, R. H. (2010). Assessment of the impact of current and projected climates on Douglas-fir productivity in British Columbia, Canada, using a process-based model (3-PG). Can. J. For. Res. 40, 511–524. doi: 10.1139/x09-201
Currie, W. S., Yanai, R. D., Piatek, K. B., Prescott, C. E., and Goodale, C. L. (2002). “Processes affecting carbon storage in the forest floor and in downed woody debris,” in The Potential of U.S. Forest Soils to Sequester Carbon and Mitigate the Greenhouse Effect, eds J. M. Kimble, R. Lal, R. Birdseye, and L. S. Heath (Boca Raton, FL: CRC Press).
Dawson, T. P., Jackson, S. T., House, J. I., Prentice, I. C., and Mace, G. M. (2011). Beyond predictions: bio::diversity conservation in a changing climate. Science 332, 53–58.
Defrenne, C. E., Wilson, J. E., Simard, S. W., and Lavkulich, L. M. (2016). Disturbance legacy on soil carbon stocks and stability within a coastal temperate forest of southwestern British Columbia, Canada. Open J. For. 6, 305–323. doi: 10.4236/ojf.2016.65025
Delong, C., Tanner, D., and Jull, M. J. (1993). A Field Guide for Site Identification and Interpretation for the Southwest Portion of the Prince George Forest Region. Land Management Handbook 24. Victoria: British Columbia.
Food and Agriculture Organization [FAO] (2012). Forest Management and Climate Change: A Literature Review. Forests and Climate Change Working Paper 10. Rome: Food and Agricultural Organization of the United Nations.
Food and Agriculture Organization [FAO] (2018). The State of the World’s Forests 2018 – Forest Pathways to Sustainable Development. Rome: Food and Agricultural Organization of the United Nations.
Forrester, D. L., and Bauhus, J. (2016). A review of processes behind diversity-productivity relationships in forests. Curr. For. Rep. 2, 45–61. doi: 10.1007/s40725-016-0031-2
Garten, C. T. Jr. (2004). Soil Carbon Dynamics along an Elevation Gradient in the Southern Appalachian Mountains. Report no. ORNL/TM-2004/50. Oak Ridge, TEN: Oak Ridge National Lab.
Gedalof, Z. E., and Berg, A. A. (2010). Tree ring evidence for limited direct CO2 fertilization of forests over the 20th century. Glob. Biogeochem. Cycles 24:GB3027.
Gevana, D. T., Pillisco, J. P. T., Pampolina, N. M., Kim, D., and Im, S. (2013). Plant diversity and aboveground carbon stock along altitudinal gradients in Quezon mountain range in southern Mindanao, Philippines. J. Environ. Sci. Manag. 16, 20–28.
Goodale, C. L., Apps, M. J., Birdseye, R. A., Field, C. B., Heath, L. S., Houghton, R. A., et al. (2002). Forest carbon sinks in the northern hemisphere. Ecol. Appl. 2, 891–899. doi: 10.1890/1051-0761(2002)012[0891:fcsitn]2.0.co;2
Gough, C. M., Vogel, C. S., Schmid, H. P., and Curtis, P. S. (2008). Controls on annual forest carbon storage: lessons from the past and predictions for the future. BioScience 58, 609–622. doi: 10.1641/b580708
Grand, S., and Lavkulich, L. M. (2011). Depth distribution and predictors of soil organic carbon in podzols of a forested watershed in southwestern Canada. Soil Sci. 176, 164–174. doi: 10.1097/ss.0b013e3182128671
Gray, A. (2003). Monitoring stand structure in mature coastal Douglas-fir forests: effect of plot size. For. Ecol. Manage. 175, 1–16. doi: 10.1016/s0378-1127(02)00078-6
Green, R. N., and Klinka, K. (1994). A Field Guide to Site Identification and Interpretation for the Vancouver Forest Region. Land Management Handbook 24. Victoria: British Columbia.
Green, R. N., Trowbridge, R., and Klinka, K. (1993). Towards a taxonomic classification of humus forms. For. Sci. Monogr. 29, 1–48.
Grier, C. C., Lee, K. M., Nadkarni, N. M., Klock, G. O., and Edgerton, P. J. (1989). Productivity of Forests of the United States and its Relation to Soil and Site Factors and Management Practices: A Review. Gen. Tech. Rep. PNW-GTR-222. Washington, DC: USDA.
Griesbauer, H. P., and Green, D. S. (2010). Regional and ecological patterns in interior Douglas-fir climate-growth relationships in British Columbia, Canada. Can. J. For. Res. 40, 308–321. doi: 10.1139/x09-197
Griesbauer, H. P., Green, D. S., and O’Neill, G. A. (2011). Using a spatiotemporal climate model to assess population-level Douglas-fir growth sensitivity to climate change across large climatic gradients in British Columbia, Canada. For. Ecol. Manage. 261, 589–600. doi: 10.1016/j.foreco.2010.11.012
Hamann, A., and Wang, T. (2006). Potential effects of climate change on ecosystem and tree species distribution in British Columbia. Ecology 87, 2773–2786. doi: 10.1890/0012-9658(2006)87[2773:peocco]2.0.co;2
Harmon, M. E., and Marks, B. (2002). Effects of silviculture practices on carbon stores in Douglas-fir western hemlock forests in the Pacific Northwest, USA: results from a simulation model. Can. J. For. Res. 32, 863–877. doi: 10.1139/x01-216
Harmon, M. E., Ferrell, W. K., and Franklin, J. F. (1990). Effects of carbon storage on conversion of old-growth forests to young forests. Science 247, 699–702. doi: 10.1126/science.247.4943.699
Harmon, M. E., Moreno, A., and Domingo, J. B. (2009). Effects of partial harvest on the carbon stores in Douglas-fir/western hemlock forests: a simulation study. Ecosystems 12, 777–791. doi: 10.1007/s10021-009-9256-2
Heimann, M., and Reichstein, M. (2008). Terrestrial ecosystem carbon dynamics and climate feedbacks. Nature 451, 289–292. doi: 10.1038/nature06591
Homann, P. S., Harmon, M., Remillard, S., and Smithwick, E. A. H. (2005). What the soil reveals: potential ecosystem C stores of the Pacific Northwest region, USA. For. Ecol. Manage 220, 270–283. doi: 10.1016/j.foreco.2005.08.035
Hudiburg, T., Law, B., Turner, D. P., Campbell, J., Donato, D., and Duane, M. (2009). Carbon dynamics of Oregon and Northern California forests and potential land-based carbon storage. Ecol. Appl. 19, 163–180. doi: 10.1890/07-2006.1
Intergovernmental Panel on Climate Change [IPCC] (2003). Annex 3A.1, Table 3A.1.8. Biomass default tables for Section 3.2 Forest Land. Geneva: IPCC.
Intergovernmental Panel on Climate Change [IPCC] (2014). “Climate Change 2014: synthesis report of the IPCC fifth assessment report (AR5),” in Fifth Assessment Report of the Intergovernmental Panel on Climate Change, eds R. K. Pachauri and L. A. Meyer (Geneva: IPCC), 151.
Jobbágy, E. G., and Jackson, R. B. (2000). The vertical distribution of soil organic carbon and its relation to climate and vegetation. Ecol. Appl. 10, 423–436. doi: 10.1890/1051-0761(2000)010[0423:tvdoso]2.0.co;2
Johnson, F. A., and Hixon, H. J. (1952). The most efficient size and shape of plot to use for cruising in old-growth Douglas-fir timber. J. For. 50, 17–20.
Johnson, K. D., Domke, G. M., Russell, M. B., Walters, B., Hom, J., Peduzzi, A., et al. (2017). Estimating live understory vegetation carbon in the United States. Environ. Res. Lett. 12:125010. doi: 10.1088/1748-9326/aa8fdb
Jones, A. G., Scullion, J., Ostle, N., Levy, P. E., and Gwynne-Jones, D. (2014). Completing the FACE of elevated CO2 research. Environ. Int. 73, 252–258. doi: 10.1016/j.envint.2014.07.021
Kayahara, G. I., and Pearson, A. F. (1996). Relationship Between Site Index, and Soil Moisture and Nutrient Regimes for Western Hemlock and Sitka Spruce. Working Paper 08/1996. Victoria: British Columbia.
Keith, H., Mackey, B. G., and Lindenmayer, D. B. (2009). Re-evaluation of forest biomass carbon stocks and lessons from the world’s most carbon-dense forests. Proc. Natl. Acad. Sci. U.S.A. 106, 11635–11640. doi: 10.1073/pnas.0901970106
Kranabetter, J. M. (2009). Site carbon storage along productivity gradients of a late-seral southern boreal forest. Can. J. For. Res. 39, 1053–1060. doi: 10.1139/x09-031
Kurz, W. A., Dymond, C. C., Stinson, G., Rampley, G. J., Neilson, E. T., Carroll, A. L., et al. (2008). Mountain pine beetle and forest carbon feedback to climate change. Nature 452, 987–990. doi: 10.1038/nature06777
Lambert, M.-C., Ung, C.-H., and Raulier, F. (2005). Canadian national biomass equations. Can. J. For. Res. 35, 1996–2018. Customized version for ecozones. Unpublished. doi: 10.1139/x05-112
Larocque, G. R., Paré, D., Boutin, R., Sarr, L., Lacerte, V., and Ansseau, C. (2014). Comparing carbon pools and tree growth in balsam fir (Abies balsamea) and black spruce (Picea mariana) forest ecosystems located along a climate gradient. Ecoscience 21, 265–277. doi: 10.2980/21-(3-4)-3701
Law, B. E., Hudiburg, T. W., Berner, L. T., Kent, J. J., Buotte, P. C., and Harmon, M. E. (2018). Land use strategies to mitigate climate change in carbon dense temperate forests. Proc. Natl. Acad. Sci. U.S.A. 115, 3663–3668. doi: 10.1073/pnas.1720064115
Lawrence, C. R., Harden, J. W., Xu, X., Schulz, M. S., and Trumbore, S. E. (2015). Long-term controls on soil organic carbon with depth and time: a case study from the Cowlitz River chronosequence, WA, U.S.A. Geoderma 247, 73–87. doi: 10.1016/j.geoderma.2015.02.005
Lecina-Diaz, J., Alvarez, A., Regos, A., Drapeau, P., Paquette, A., Messier, C., et al. (2018). The positive carbon stocks-biodiversity relationship in forests: co-occurrence and drivers across five subclimates. Ecol. Appl. 28, 1481–1493. doi: 10.1002/eap.1749
Li, M., Zhang, X., Pang, G., and Han, F. (2013). The estimation of soil organic carbon distribution and storage in a small catchment area of the loess plateau. Catena 101, 11–16. doi: 10.1016/j.catena.2012.09.012
Liang, J., Crowther, T. W., Picard, N., Wiser, S., Zhou, M., Alberti, G., et al. (2016). Positive biodiversity-productivity relationship predominant in global forests. Science 354:aaf8957.
Littell, J. L., Peterson, D. L., and Tjoelker, M. (2008). Douglas-fir growth in mountain ecosystems: water limits tree growth from stand to region. Ecol. Monogr. 78, 349–368. doi: 10.1890/07-0712.1
Lloyd, D., Angove, K., Hope, G., and Thompson, C. (1990). A Guide to Site Identification and Interpretation for the Kamloops Forest Region. Land Management Handbook 23. Victoria: British Columbia.
Lüdecke, D. (2018). sjPlot: Data Visualization for Statistics in Social Science. R package version 2.6.1.
Mader, D. L. (1963). Soil variability: a serious problem in the Northeast. Soil Sci. Soc. Am. Proc. 27, 707–709. doi: 10.2136/sssaj1963.03615995002700060040x
Malhotra, A., Todd-Brown, K., Nave, L. E., Batjes, N. H., Holmquist, J. R., Hoyt, A. M., et al. (2019). The landscape of soil carbon data: emerging questions, synergies and databases. Progr. Phys. Geogr. 43:030913331987330.
Matsuzaki, E., Sanborn, P., Fredeen, A. L., Shaw, C. H., and Hawkins, C. (2013). Carbon stocks in managed and unmanaged old-growth western redcedar and western hemlock stands of Canada’s inland temperate rainforests. For. Ecol. Manage. 297, 108–119. doi: 10.1016/j.foreco.2012.11.042
McRoberts, R. E., Tomppo, E. O., and Naesset, E. (2010). Advances and emerging issues in national forest inventories. Scand. J. For. Res. 25, 368–381. doi: 10.1080/02827581.2010.496739
Mokany, K., Raison, R. J., and Prokushkin, A. S. (2006). Critical analysis of root: shoot ratios in terrestrial biomes. Glob. Chang. Biol. 12, 84–96. doi: 10.1111/j.1365-2486.2005.001043.x
Morin, X., Fahse, L., Jactel, H., Scherer-Lorenzen, M., Garcia-Valdes, R., and Bugmann, H. (2018). Long-term response of forest productivity to climate change is mostly driven by changes in tree species composition. Sci. Rep. 8:5627.
Nakagawa, S., and Schielzeth, H. (2013). A general and simple method for obtaining R2 from generalized linear mixed-effects models. Methods Ecol. Evol. 4, 133–142. doi: 10.1111/j.2041-210x.2012.00261.x
Nyland, R. D. (2016). Silviculture: Concepts and Applications, 3rd Edn. Long Grove, IL: Waveland Press.
Pike, R. G., Spittlehouse, D. L., Bennett, K. E., Eggington, V. N., Tschaplinski, P. J., Murdock, T. Q., et al. (2008). Climate change and watershed hydrology: part I—recent and projected changes in British Columbia. Streamline 11, 1–7.
Post, W. M., Emanuel, W. R., Zinke, P. J., and Stangenberger, A. G. (1982). Forest carbon soils and world life zones. Nature 298, 156–159.
Pregitzer, K. S., and Euskirchen, E. S. (2004). Carbon cycling and storage in worlds forests: biome patterns related to forest age. Glob. Chang. Biol. 10, 2052–2077. doi: 10.1111/j.1365-2486.2004.00866.x
R Development Core Team (2019). R: A Language and Environment for Statistical Computing. Vienna: R Foundation for Statistical Computing.
Restaino, C. M., Peterson, D. L., and Littell, J. (2016). Increased water deficit decreases douglas-fir growth throughout western US forests. Proc. Natl. Acad. Sci. U.S.A. 113, 9557–9562. doi: 10.1073/pnas.1602384113
Rustad, L. E., Campbell, J. J., Marion, G. M., Norby, R. J., Mitchell, M. J., Hartley, J., et al. (2001). A meta-analysis of the response of soil respiration, net nitrogen mineralization, and aboveground plant growth for experimental ecosystem warming. Oceologia 126, 543–562. doi: 10.1007/s004420000544
Ryan, M. G., Harmon, M. E., Birdseye, R. A., Giardina, C. P., Heath, L. S., Houghton, R. A., et al. (2010). A synthesis of the science on forests and carbon for U.S. forests issues in ecology, report number 13. Ecol. Soc. Am. 13, 1–16. doi: 10.1016/s0378-1127(01)00729-0
Shannon, C. E., and Weaver, W. (1949). The Mathematical Theory of Communication. Urbana, IL: University of Illinois Press, 1–117.
Simmons, J. A., Fernandez, I. J., Briggs, R., and Delaney, M. T. (1996). Forest floor carbon pools and fluxes along a regional climate gradient in Maine, USA. For. Ecol. Manage. 84, 81–95. doi: 10.1016/0378-1127(96)03739-5
Soil Classification Working Group (1998). Canadian System of Soil Classification, 3rd Edn. Canada: NRC Research Press.
Spetich, M. A., and Parker, G. R. (1998). Plot size recommendations for biomass estimation in a midwestern old-growth forest. North. J. Appl. For. 15, 165–168. doi: 10.1093/njaf/15.4.165
Standish, J. T., Manning, G. H., and Demershchalk, J. P. (1985). Development of Biomass Equations for British Columbia tree Species. Information Report BC-X-264. Victoria: Pacific Forest Research Centre.
Steen, O., and Coupe, R. A. (1997). A Field Guide to Forest Site Identification and Interpretation for the Cariboo Forest Region. Land Management Handbook 39. Victoria: British Columbia.
Ter-Mikelian, M. T., and Korzukhin, M. D. (1997). Biomass equations for sixty-five North American tree species. For. Ecol. Manage. 97, 1–24. doi: 10.1016/s0378-1127(97)00019-4
Tesfaye, M. A., Gardi, O., Bekele, T., and Blaser, J. (2019). Temporal variation of ecosystem carbon pools along altitudinal gradient and slope: the case of Chilimo dry afromontane natural forest, Central Highlands of Ethiopia. J. Ecol. Environ. 43:17.
Tewksbury, C. E., and Van Miegroet, H. (2007). Soil organic carbon dynamics along a climatic gradient in a southern Appalachian spruce-fir forest. Can. J. For. Res. 37, 1161–1172. doi: 10.1139/x06-317
Thompson, I. D., Ferreira, J. N., Gardner, T. A., Guariguata, M. R., Koh, L. P., Okabe, K., et al. (2012). “Forest biodiversity, carbon and other ecosystem services – relationships and impacts of deforestation and forest degradation,” in Understanding Relationships between Biodiversity, Carbon, Forests and People: The Key to Achieving REDD+ Objectives, eds J. Parrotta, C. Wildburger, and S. Mansourian (Vienna: IUFRO). A Global Assessment Report. IUFRO World Series 31.
Thompson, I. D., Okabe, K., Tylianakis, J. M., Kumar, P., Brockerhoff, E. G., Schellhorn, N. A., et al. (2011). Forest biodiversity and the delivery of ecosystem goods and services: translating science into policy. BioScience 61, 972–981. doi: 10.1525/bio.2011.61.12.7
Tifafi, M., Guenet, B., and Hatté, C. (2017). Large differences in global and regional total soil carbon estimates based on SoilGrids, HWSD and NCSCD: intercomparison and evaluation based on field data from USA, England, Wales, and France. Glob. Biogeochem. Cycles 32, 42–56. doi: 10.1002/2017gb005678
Trumbore, S., Brando, P., and Hartmann, H. (2015). Forest health and global change. Science 49, 814–818.
Turner, D. P., Koerper, G. J., Harmon, M. E., and Lee, J. L. (1995). A carbon budget for the conterminous United States. Ecol. Appl. 5, 421–436. doi: 10.2307/1942033
Ung, C.-H., Bernier, P., and Guo, X.-J. (2008). Canadian national biomass equations: new parameter estimates that include British Columbia data. Can. J. For. Res. 38, 1123–1132. doi: 10.1139/x07-224
Venables, W. N., and Ripley, B. D. (2002). Modern Applied Statistics with S. New York, NY: Springer-Verlag.
Vogt, K. (1991). Carbon budgets of temperate forest ecosystems. Tree Physiol. 9, 69–96. doi: 10.1093/treephys/9.1-2.69
Vucetich, J. A., Reed, D. D., Breymeyer, A., Degórski, M., Mroz, G. D., Solon, J., et al. (2000). Carbon pools and ecosystem properties along a latitudinal gradient in northern Scots pine (Pinus sylvestris) forests. For. Ecol. Manage. 136, 135–145. doi: 10.1016/s0378-1127(99)00288-1
Walter, K., Don, A., Tiemeyer, B., and Freibauer, A. (2016). Determining soil bulk density for carbon stock calculations: a systematic method comparison. Soil Sci. Soc. Am. J. 80, 579–591. doi: 10.2136/sssaj2015.11.0407
Walther, G.-R., Post, E., Convey, P., Menzel, A., Parmesam, C., Beebee, T. J. C., et al. (2002). Ecological responses to recent climate change. Nature 416, 389–395.
Wang, T., Hamann, A., Spittlehouse, D., and Carroll, C. (2016). Locally downscaled and spatially customizable climate data for historical and future periods for North America. PLoS One 11:e0156720. doi: 10.1371/journal.pone.0156720
Wang, X., Thompson, D. K., Marshall, G. A., Tymstra, C., Carr, R., and Flannigan, M. D. (2015). Increasing frequency of extreme fire weather in Canada with climate change. Clim. Change 130:573. doi: 10.1007/s10584-015-1375-5
Watson, J. E. M., Evans, T., Venter, O., Williams, B., Tulloch, A., Stewart, C., et al. (2018). The exceptional value of intact forest ecosystems. Nat. Ecol. Evol. 2, 599–610.
Woodall, C. W., and Liknes, G. C. (2008). Climatic regions as an indicator of forest coarse and fine woody debris carbon stocks in the United States. Carbon Balance Manag. 3:5.
Wotton, B. M., Flannigan, M. D., and Marshall, G. A. (2017). Potential climate change impacts on fire intensity and key wildfire suppression thresholds in Canada. Environ. Res. Lett. 12:9.
Yohannes, H., Soromessa, T., and Argaw, M. (2015). Carbon stock analysis along altitudinal gradient in Gedo forest: implications for forest management and climate change mitigation. Am. J. Environ. Prot. 4, 237–244. doi: 10.11648/j.ajep.20150405.14
Young, H. E., Ribe, J. H., and Wainwright, K. (1980). Weight tables for tree and shrub species in Maine. maine life science and agriculture experiment station. Misc. Rep. 230:24.
Zhang, X., Flato, G., Kirchmeier-Young, M., Vincent, L., Wan, H., Wang, X., et al. (2019). “Changes in temperature and precipitation across canada,” in Canada’s Changing Climate Report, eds E. Bush and D. S. Lemmen (Ottawa, ON: Government of Canada), 112–193.
Keywords: biodiversity, carbon storage, climate change, Douglas-fir, productivity, site index, soil
Citation: Roach WJ, Simard SW, Defrenne CE, Pickles BJ, Lavkulich LM and Ryan TL (2021) Tree Diversity, Site Index, and Carbon Storage Decrease With Aridity in Douglas-Fir Forests in Western Canada. Front. For. Glob. Change 4:682076. doi: 10.3389/ffgc.2021.682076
Received: 17 March 2021; Accepted: 25 May 2021;
Published: 23 June 2021.
Edited by:
Isabel Cañellas, Centro de Investigación Forestal (INIA), SpainReviewed by:
Patricia Adame, Instituto Nacional de Investigación y Tecnología Agroalimentaria, SpainThomas J. Dean, Louisiana State University, United States
Copyright © 2021 Roach, Simard, Defrenne, Pickles, Lavkulich and Ryan. This is an open-access article distributed under the terms of the Creative Commons Attribution License (CC BY). The use, distribution or reproduction in other forums is permitted, provided the original author(s) and the copyright owner(s) are credited and that the original publication in this journal is cited, in accordance with accepted academic practice. No use, distribution or reproduction is permitted which does not comply with these terms.
*Correspondence: Winnifred Jean Roach, anJvYWNoMTJAdGVsdXMubmV0