 Johanna Clara Metzger
 Janett Filipzik1
 Beate Michalzik
 Anke Hildebrandt
- 1Group of Ecohydrology, Institute of Geoscience, Friedrich Schiller University Jena, Jena, Germany
- 2Chair of Soil Science, Institute of Geography, Friedrich Schiller University Jena, Jena, Germany
- 3German Centre for Integrative Biodiversity Research (iDiv), Leipzig, Germany
- 4Department of Computational Hydrosystems, Helmholtz Centre for Environmental Research – UFZ, Leipzig, Germany
In stemflow, rainfall is collected and channeled to a concentrated soil water input. It can constitute up to 30% of incident precipitation in some ecosystems. However, the size of the zone influenced by stemflow is unclear, and statistically representative measurement of stemflow (on and in between sites) is scarce. Therefore, whether stemflow creates hotspots of infiltration and potential impacts on forest soils remain subject to controversy. In this study, we investigated the areal dimension of infiltrating stemflow fluxes as well as effects on near-stem soils. We measured throughfall, stemflow and soil properties in high-resolution statistical designs on a mixed forest plot in Germany receiving moderate stemflow. From this data, we modeled the spatial distribution of net precipitation infiltration depth on the plot. Furthermore, we examined soil chemical and physical properties around tree stems to test for and assess a stemflow impact. Results show that stemflow infiltration areas are much smaller than typically assumed and constitute strong infiltration hotspots compared to throughfall. This is also mirrored in soil properties, which are significantly altered near stems. Here, accelerated soil formation and enhanced translocation processes indicate increased soil water fluxes due to high inputs. Additionally, altered soil hydraulic properties enable quicker soil water fluxes near stems. Our findings attest that even comparatively low stemflow fractions (of gross precipitation) can generate strong hotspots of water and matter inputs, which are impactful to subsequent hydrological and biogeochemical processes and properties. Trees shape their direct soil environment, thereby establishing pathways of preferential water flow connecting the canopy and the deeper subsurface.
Introduction
In forests, the contact of precipitation with the land is mediated by plant canopies. Here, precipitation is intercepted, leading to a reduced total water input to the forest soil. What is more, the interception leads to a redistribution of rain inputs via the pathways of throughfall (precipitation dripping through or from the canopy) and stemflow (precipitation flowing along branches and stems).
Stemflow has received much attention in forest ecohydrological research. It funnels rainfall and concentrates it at tree stems. As a result, the water arriving at the surface can be locally increased compared to the incident precipitation by a factor ranging between 3 and 30 [the so-called funneling ratio, Herwitz (1986)] on annual average. Much higher factors are reported for individual trees and events (Levia and Germer, 2015). Also, stemflow is found to be chemically enriched (Levia and Frost, 2003). Consequently, it stands to reason that stemflow fluxes play a special role in water and nutrient dynamics of forest ecosystems. In this context, stemflow has been suggested to locally increase recharge (Liang et al., 2011; Germer, 2013; Spencer and van Meerveld, 2016) and nutrient inputs (Chang and Matzner, 2000; Johnson and Lehmann, 2006; Michalzik et al., 2016). Also, abundant evidence of preferential soil water flow of stemflow inputs has been found, suggesting bypass flow [fast flow “bypassing most of the subsurface medium” (Nimmo, 2020)] in near-stem soils (Martinez-Meza and Whitford, 1996; Taniguchi et al., 1996; Johnson and Lehmann, 2006; Li et al., 2009; Liang et al., 2011; Schwärzel et al., 2012).
In contrast, it has recently been argued that, statistically, stemflow might not be a hotspot, or even the opposite – a cold spot (Van Stan and Allen, 2020): Stemflow funneling can be close to zero for many trees and stemflow contributes little (0–5%) to the overall precipitation input on the stand scale. Observation locations of stemflow are typically not chosen randomly, and existing studies might over-represent stemflow-promoting sites and trees/shrubs. In combination with decreased throughfall inputs here, near-stem areas could be subject to “resource limitation” rather than resource concentration (Van Stan and Gordon, 2018). Actually, only few stemflow studies incorporate statistical sampling designs (Van Stan et al., 2020).
In summary, despite much qualitative and exemplary evidence of stemflow hotspots, there is a lack of statistically representative sampling to quantitatively evaluate stemflow hotspots, especially when it comes to the fate of stemflow entering the soil. This is true for subsurface dynamics of both water and nutrients: Subsurface processes are hard to observe, especially if they take place locally (making them hard to identify) and short-term (making them hard to capture). But even at the point of infiltration, stemflow water and nutrient concentrations are unknown. This is because stemflow might spread on the forest floor near the tree trunk before infiltrating, and these infiltration areas are undefined (Carlyle-Moses et al., 2018, 2020; Van Stan and Allen, 2020). Additionally, stemflow and throughfall mix within those areas, which could either diminish or amplify the hotspot effect attributed to stemflow. Therefore, knowledge of stemflow infiltration areas is critical for quantifying below-canopy input fluxes to soils and their spatiotemporal behavior.
However, it is difficult to measure stemflow infiltration areas (Carlyle-Moses et al., 2018, 2020). Existing methods are either based on assumptions (e.g., infiltration marks) or require a lot of effort (e.g., dye tracer experiments) and are bound to exemplary locations and/or time points. For example, stemflow infiltration has been assessed in the field by observation of marks on the soil surface (Tanaka et al., 1991; Iida et al., 2005; Rashid and Askari, 2014), soil water content dynamics (Voigt, 1960; Buttle et al., 2014), direct visual observation of the infiltration process during natural rainfall (Pressland, 1976; Návar, 2011), or irrigation (Buttle et al., 2014), and destructive dye tracing experiments (Schwärzel et al., 2012; Carlyle-Moses et al., 2018; Tischer et al., 2020).
A calculation method for stemflow infiltration areas has also been introduced (Reynolds and Henderson, 1967; Herwitz, 1986), using classical concepts of hydrology (Horton, 1933; Smith and Goodrich, 2006). They relate the stemflow volume to the area accounting for infiltration being limited by the soil hydraulic conductivity. However, this information is rarely available. Therefore, proxies for stemflow funneling to the floor, only depending on aboveground information, are widely used. Herwitz (1987) introduced the funneling ratio, which relates the stemflow volume to the rainfall received over an area of the size of the basal area of the tree. Tanaka et al. (1991) [cited in Tanaka et al. (1996)] used stemflow marks observed at the Keyaki stand (Zelkova serrata Maki.) in Tsukuba, Japan, and related them to the tree’s diameter at breast height (DBH). Assuming an annular formed distribution area for the stemflow, this two-parameter equation yields an estimate of the maximum zone of influence around the stem, based only on visual inspection. This method was also frequently used later on without local observations and applying the parameters from Keyaki stand (Tanaka et al., 1996; Aboal et al., 1999; Liang et al., 2011), only some authors re-adjusted parameters based on locally observed litter marks (Iida et al., 2005; Rashid and Askari, 2014).
The approaches assuming an annular zone of stemflow influence around the tree stem are easy to apply (Voigt, 1960; Majima and Tase, 1982; Tanaka et al., 1996; Buttle et al., 2014), yet, unpractical for the estimation of the actual stemflow infiltration area, as neither stemflow volume nor stemflow infiltration area increase proportionally with tree diameter (Van Stan and Levia, 2010; Buttle et al., 2014; Metzger et al., 2019). In contrast, the calculation method first applied by Reynolds and Henderson (1967) [note: corresponds to the method attributed to Herwitz (1986) in Carlyle-Moses et al. (2020)] models the infiltration process, and directly yields the infiltration area (whose localization around the stem is not further determined). Therefore, it has been repeatedly used and further developed (Herwitz, 1986; Návar and Bryan, 1990; Gómez et al., 2002; Carlyle-Moses et al., 2018) and is state of the art according to community consensus (Carlyle-Moses et al., 2018, 2020; Van Stan and Allen, 2020). Because of often lacking soil information and representative stemflow data, the model has not yet been used for a plot scale calculation of stemflow infiltration. Also, stemflow infiltration has not yet been studied in combination with throughfall infiltration.
Overall, reported stemflow infiltration areas range widely from 0.03 m2 (Návar, 2011) to >>3 m2 (Rashid and Askari, 2014) depending on the ecosystem as well as the used method. Carlyle-Moses et al. (2018) recently hypothesized that stemflow infiltration areas have been generally overestimated by obtaining them from extreme precipitation conditions, i.e., high precipitation sums and intensities. This is supported by statements made by Durocher (1990), saying that stemflow infiltrated in direct proximity to the tree trunk without overland flow, and Reynolds and Henderson (1967), who argued that general estimations “for the area of spread of stemflow [were] rather too large for most storms.”
Gaining insight into the percolation behavior of infiltrated stemflow is all the more difficult. Directly tracking water flux patterns in the soil is difficult and requires substantial effort, but provides only exemplary results. Conceptually, indirect evidence could be derived from soil properties. Stemflow has been attributed to creating islands of fertility in semiarid shrublands (Whitford et al., 1997; Li et al., 2009; Zuo et al., 2009). In contrast, other studies, mostly in temperate forests, have discussed near-stem forest soil areas as areas of depletion (Wilke et al., 1993; Knoerzer and Gärtner, 2003) or concentrated pollution and acidification (Neite and Runge, 1986; Falkengren-Grerup, 1989; Rampazzo and Blum, 1992). Generally and throughout climates and ecosystems, tree distance has been identified as a potential correlative factor for soil properties in forests in these and some other studies: differences in soil chemistry depending on the tree distance were reported, e.g., for soil organic carbon, exchangeable cations and pH (Zinke, 1962; Gersper and Holowaychuk, 1971; Rampazzo and Blum, 1992; Nacke et al., 2016). Metzger et al. (2017) found soil water content to be significantly lower in near-stem areas due to reduced soil water retention (same site as in the present study), supporting also the findings of Rashid et al. (2015), who likewise observed differences in soil hydraulic properties depending on the tree distance in an oil palm plantation.
Soil hydraulic properties, in turn, affect soil water dynamics. Specifically, the properties stated above, e.g., lower soil water retention near trees, are conducive to enhance infiltration and soil water flow. This could systematically increase the passage of stemflow-induced water inputs through the soil. Furthermore, soil properties are also an archive of the processes the soil has been exposed to. By affecting soil water percolation, precipitation is an important driver of pedogenesis (Blume et al., 2010). Increased percolation rates enhance chemical weathering, soil acidification and transport of solutes and particles, thereby driving profile-building processes such as podsolization and clay translocation (Blume et al., 2010). As net precipitation patterns have been found to be highly stable over time (Raat et al., 2002; Keim et al., 2006; Staelens et al., 2006; Metzger et al., 2017, 2019; Van Stan et al., 2020), they spatially might develop the soil at different rates, leaving an imprint on soil chemistry, texture and structure. Therefore, soil properties in the profile in near-stem and stem distant areas might give insight into past and current pedogenetic processes and allow to draw conclusions on differences in pedogenetic drivers, especially percolation.
In this study, we aim to investigate whether below-canopy precipitation hotspots are maintained during soil infiltration and percolation, and give a quantitative estimation of stemflow fluxes and their impacts at the soil level. We evaluate a large data set of net precipitation in a European mixed deciduous forest dominated by Fagus sylvatica L. Stemflow generation (percentage of gross precipitation) at this site is medium to low based on stemflow reviews (Levia and Frost, 2003; Levia and Germer, 2015; Carlyle-Moses et al., 2018). On the basis of this dataset, the study’s objectives are: (1) investigating the role of stemflow versus throughfall for the spatial distribution of net precipitation infiltration and deriving the cumulative stemflow infiltration area at the plot scale. (2) Characterizing tree-induced soil microsites by analyzing soil properties indicative of soil formation processes, including percolation, and determining their spatial extent. This provides insight into the actual effective power of stemflow, which could continue to impact water-related processes in the deeper subsurface.
Materials and Methods
Field Measurements and Sampling
Study Site and Sampling Design
The field study was conducted in a mixed European beech forest in the Hainich National Park in Central Germany. The mean annual temperature is ca. 8°C with annual rainfall sums of 600–900 mm (Küsel et al., 2016). The experimental site was established as part of the AquaDiva Critical Zone Exploratory (Küsel et al., 2016). Study site, sampling design and net precipitation data were introduced in Metzger et al. (2017, 2019). Only the essential information is repeated here.
For determining the spatial variance of infiltration, information on the spatial variance of throughfall and stemflow is needed. For this purpose, they were measured in stratified random designs based on Zimmermann et al. (2010). The designs were applied on a subplot grid (Zimmermann et al., 2016), subdividing the total plot area of 1 ha into 10 m × 10 m subplots (Metzger et al., 2017). Throughfall was measured in all subplots with two randomly distributed samplers each (in total 200 samplers). Stemflow was measured on all trees within 11 subplots distributed within the plot in a regular pattern. The tree properties of the stemflow subplots (65 trees) were representative for the whole plot (581 trees) (Metzger et al., 2019).
The plot comprises 581 trees with a basal area of 38 m2. The stand consists of European beech (F. sylvatica L., 67%), Sycamore maple (Acer pseudoplatanus L., 20%) and European ash trees (Fraxinus excelsior L., 9%), accompanied by European hornbeam (Carpinus betulus L.), Large-leafed linden (Tilia platyphyllos Scop.), Norway maple (Acer platanoides L.), and Scots elm (Ulmus glabra L.). As the stand has been unmanaged since 1997 and was used for selective cutting before, the age and size structures are very heterogeneous, with a median DBH of 0.15 m and a maximum DBH of 0.87 m. The soils on the study plot are shallow, silty and clayey Cambisols and Luvisols (IUSS Working Group WRB, 2006) derived from a bedrock of lime- and marlstones with a thin loess cover.
Survey of Stand Properties
All trees with a DBH ≥0.05 m were included in the study. They were given an identification number and the species was determined. The position coordinates were detected using a differential GPS and total station (both Topcon, Tokyo, Japan). Tree circumference at breast height was measured with a measuring tape and then DBH and basal area calculated assuming the tree bole is circular in cross section.
Measurement of Rainfall and Stand Precipitation
Precipitation was sampled on an event basis in campaigns from May to August in the years 2014, 2015, and 2016. All components (gross precipitation, throughfall, and stemflow) were collected in samplers that were read out and emptied manually after each event. Between the end of rainfall and the beginning of sampling, there was a waiting period of 2 h minimum. If rainfall started anew during sampling, sampling was stopped and started from the beginning as described above. The previous (partial) event was then added to the current one. Since sampling itself lasted 6 h, single events had to be separated by a minimum of 8 h without rainfall.
Gross precipitation and throughfall were collected in funnel-type samplers. Gross precipitation samplers were placed on an adjacent grassland in about 250 m distance. Gross precipitation and throughfall depths were calculated referring the collected water amount to the funnel area (ca. 0.01 m2). Stemflow was collected by collars of lay-flat hose cut open and wrapped around the tree. Collars were sealed with silicone and connected to a water barrel. Stemflow depth was calculated by dividing the sum of stemflow volume of all trees per subplot by the subplot area.
A total of 39 precipitation events were recorded. Events, where overflow occurred, and very small events with almost no stemflow (median stemflow per tree <0.5 L) were excluded, leaving 26 precipitation events. Stemflow data gaps (gap rate: 6.2%) were closed using a linear mixed effects model described in Metzger et al. (2019).
Soil Sampling
Undisturbed soil samples were taken by stainless steel cylinders of 100 cm3 at 210 locations on the forest plot, at 5–10 cm (topsoil) and 25–30 cm (subsoil) soil depth each. Sampling locations were distributed in a stratified random design with random transects (Zimmermann et al., 2010). The sampling cylinders were driven into the soil with a Teflon hammer, carefully excavated and the soil surfaces prepared to be even. To first assess properties of near-stem soils, the locations falling randomly within 1 m from a tree were selected (n = 71).
Disturbed soil samples were taken at 50 locations in both soil depths. 19 locations thereof fall randomly within 1 m distance from a tree.
Precipitation Time Series
To evaluate the events of the observation period at the plot with respect to the region’s climate, we considered the 30-year precipitation record (1986–2015) of the nearest weather station of the German national weather service (Deutscher Wetterdienst, DWD, “Mühlhausen/Thüringen-Windeberg,” station ID 5593, located at 10.5123 long., 51.2712 lat., at an elevation of 345 m a.s.l., about 20 km distance to the study plot).
Precipitation time series for rainfall intensity evaluation were collected from two weather stations: (1) Weather measurements at the Eddy Flux Tower in the Hainich National Park provided by the Group of Bioclimatology, Faculty of Forest Sciences and Forest Ecology at the Georg August University of Göttingen, Germany. It is located at 10.4530 long., 51.0792 lat. at an elevation of 430 m a.s.l. in about 5 km distance to the study plot. Data was provided in 30-min intervals for the years 2014 and 2015. (2) Weather measurements of the DFG (Deutsche Forschungsgemeinschaft), CRC 1076 “AquaDiva,” subproject D03 (“Site management and central experiments,” Principal Investigators K. Küsel and K.U. Totsche) at the Friedrich Schiller University Jena, Germany. The station is located at H1/Reckenbühl in the AquaDiva Critical Zone Exploratory at the Hainich ridge in about 1.5 km distance to the plot (Küsel et al., 2016). Data were provided in 10-min intervals for the year 2016 and aggregated to 30-min intervals. Timing of events from the precipitation campaigns on the study plot compared well with the precipitation data from the stations. Precipitation sums differed, but showed a strong linear relationship with a R2 of 0.95 and 0.74 (for station 1 and 2). We therefore assumed that the precipitation intensity has a similar temporal evolution at the study plot and those climate stations. The precipitation time series were corrected according to the linear regressions with precipitation measured on the study plot to render rainfall intensities comparable between the two weather stations.
Laboratory Analysis of Soil Samples
Hydraulic Properties
The undisturbed 100 cm3 cylinder samples were saturated stepwise over several days. For measurement of field capacity, samples were placed in a sand bed with the manual appliance of a hanging water column of −60 cm and left to equilibrate for 72 h. After re-saturation, saturated hydraulic conductivity (Ks) was measured using the constant head method (Stolte and Veerman, 1997). The head was kept stable with a Mariotte’s Bottle and the outflow per time measured with a graduated cylinder and a stop watch. After all measurements, samples were oven-dried at 105°C for 24 h. They were left to cool down in a desiccator before measuring the dry weight to determine bulk density and calculate weighted water contents (saturated and at field capacity).
Texture Analysis
Soil texture was determined from disturbed soil samples using wet sieving and hydrometer measurements. For preparation, the samples were air-dried and the organic compounds destroyed with 15% hydrogen peroxide solution, let sit under a fume hood for 16 h and after that placed in an 80°C water bath for about 1 day. The emulsion was then sieved using stacked sieves of 2, 0.63, 0.2, and 0.063 mm (sand fractions). The silt and clay fractions were determined from density measurements with a hydrometer in a 1 L suspension of the sieve passing: After washing the sample twice with 15 drops of magnesium chloride in a centrifuge, it was dispersed mechanically in a mixer and chemically by adding 15 ml of sodium pyrophosphate. The hydrometer was read after 30 s, 1, 2, 5, 15, and 45 min, and 1, 2, 6, and 24 h.
Soil Chemistry
Soil chemistry was measured on the undisturbed soil samples. We measured pH and organic carbon content (Corg) as prominent chemical soil characteristics potentially impacted by stemflow (Gersper and Holowaychuk, 1971; Falkengren-Grerup, 1989; Knoerzer and Gärtner, 2003). The samples were air-dried, sieved for organic residues and coarse soil >2 mm, and grinded prior to chemical analyses.
From each sample, carbon content was measured for one subsample that had been combusted in a muffle oven at 450°C to destroy organic compounds (leaving only inorganic carbon), and one subsample that was left original (yielding total carbon), by an element analyzer using high-temperature combustion at 1,200°C and subsequent chromatographic gas analysis (“Vario Max CN,” Elementar Analysensysteme GmbH, Langenselbold, Germany). The difference of the two subsamples gives the organic carbon content. Tungstic oxide was added to the sample prior to analysis as an oxidation catalyst, and result values were corrected after determining the dry weight of the material by oven-drying at 105°C for 24 h.
For pH measurement, a soil sample was extracted in high-purity water (1:2.5 by weight), shook for 30 min by an overhead shaker, and then let sit for another 30 min. The pH-value was derived from the electrical potential at a single-rod glass electrode (“pH 538,” WTW by Xylem Analytics Germany Sales GmbH & Co. KG, Weilheim, Germany).
Data Analyses and Modeling
Statistical Analyses
All analyses were carried out using R (R Core Team, 2016).
For descriptive statistics, quantile-based values were used: The median and the coefficient of quartile variation (CQV),
where Q1 and Q3 are the lower and upper quartile of the sample.
To test the significance of the difference between two samples, if normal distribution was given, a Student’s t-test was used, if one of the samples was not normally distributed, the Mann–Whitney U test (two-sample-Wilcoxon rank sum test) was used.
Estimating Tree Microsite Sizes With Linear Mixed Effects Models
For each soil property showing differences between tree-close and tree-far, we further examined whether changing the distance affected the results. To this end, a series of linear mixed effects models was set up using the R packages lme4 (Bates et al., 2015) and lmerTest (Kuznetsova et al., 2016). A series started with a null model (no tree distance effect) followed by testing the effect of different tree distances: 0.1 m (n (close:far) = 5:205, 0.2 (14:196), 0.3 (28:182), 0.4 (29:181), 0.5 (37:173), 0.6 (52:158), 0.7 (56:154), 0.8 (63:147), 0.9 (68:142), and 1 m (59:131). Each location in the sample was assigned to a random effect category “tree-close” and “tree-far,” which changed according to the tested “critical distance.” As only other random effect, the identification number of the next tree was included in the model to correct for repeated sampling. The best model (based on the Akaike information criterion, AIC) was assumed to best represent the scale of the tree influence for that soil property. We tested distances <1 m for all soil properties. Distances >1 m were only tested for a critical tree distance of 1 m to check whether the model further improved. Ks, as a logarithmically distributed variable, was log-transformed for the modeling.
Modeling of Net Precipitation Distribution at the Ground Level
To estimate the spatial variation of water available for infiltration over the plot area, measured stemflow and throughfall volumes were allocated to areas receiving specific net precipitation intensity, as described below. The realized distribution of infiltration depends on the infiltration capacity: In hotspots, especially near stems, the available water can exceed the infiltration capacity, leading to small-scale surface runoff and increase of the infiltration area around the stem. We therefore used a method accounting for the infiltration process during the observed event to derive the spatial distribution of infiltration. In order to allow comparison of those results with the literature, we also calculated the net precipitation intensity distribution for two conceptual stemflow funneling approaches commonly used for estimating the area of influence of stemflow. Mixing of stemflow and throughfall in stemflow infiltration areas and zones of stemflow influence was accounted for.
Stemflow Infiltration
Stemflow infiltration areas (Ai SF) were calculated using the method first proposed by Reynolds and Henderson (1967) and further developed by Herwitz (1986) and Carlyle-Moses et al. (2018). The method is based on the fundamental hydrological principle of rainfall excess runoff (also Hortonian runoff) (Horton, 1933; Smith and Goodrich, 2006): The infiltration area is determined as the area required to absorb the stemflow input of a given intensity for a given infiltration capacity of the soil. Basically, Ai SF is calculated as
where, AiSF,mod is the modeled stemflow infiltration area (m2), ISF is the stemflow intensity (L h–1) and ci SF is the soil infiltration capacity (mm h–1 = L m–2 h–1) [after Carlyle-Moses et al. (2018)]. However, in order to account for throughfall, we implemented
where, Ks T is the saturated hydraulic conductivity of the topsoil (mm h–1) and FTF is the throughfall infiltration (mm h–1) (which is equal to throughfall depth, as throughfall never exceeded the soil infiltration capacity).
Stemflow intensity (volume per time) was derived from event stemflow volumes using rainfall time series [as proposed by Carlyle-Moses et al. (2018)]. We calculated stemflow intensity proportionally from rainfall intensity using three intensity categories under consideration of a threshold for the onset of stemflow. Infiltration capacity of the soil near trees was assumed to be represented by Ks,T of topsoil samples within 1 m distance from a tree (median Ks,T = 151.07 mm h–1, n = 61). Throughfall infiltration was calculated from event median throughfall (TF) and gross precipitation intensity following the same procedure as for stemflow intensity. Precipitation input in AiSF,mod was calculated for each event, tree and intensity category. The event AiSF,mod is then calculated as the time-weighted average over the intensity category periods.
Throughfall Infiltration
Throughfall never exceeded the infiltration capacity of the soil. Therefore, for the area not affected by stemflow spatial distribution of infiltration was taken to correspond to the observed spatial distribution of throughfall.
Comparison to Conceptual Stemflow Funneling Approaches
Due to the lack of information on soil hydraulic properties, or stemflow intensities, stemflow funneling is often quantified from conceptual approaches. To allow comparison, we additionally implemented two common approaches from literature. Note that these methods do not estimate infiltration.
Tanaka et al. (1996) established a conceptual approach assuming an annular stemflow influence around the tree stem, the size of which depends on the DBH:
where, ri is the radius from the center of the trunk, dtree is the tree’s DBH, and a and b are constants, which Tanaka et al. (1991) empirically fitted to 12 Japanese zelkova trees at their research site based on infiltration marks (a = 23.36 and b = 34.92). In the literature this approach has been adopted in two ways: (a) by using the equation and parameters from Japan without change (Aboal et al., 1999; Liang et al., 2011) (b) by adopting the equation, but fitting to local observations of litter marks (Iida et al., 2005; Rashid and Askari, 2014). At our site, infiltration or litter marks were not occurring. We therefore chose option (a) and adopted the parameterization from Japan. According to the model, the stemflow affected area becomes:
where, Atree is the basal area of the tree. Within the stemflow infiltration areas, we added the mean event throughfall to stemflow inputs. We call this approach the annular (index A) approach below, referring to the assumed annular shape of the area of influence.
The funneling ratio by Herwitz (1986) is an established estimate to assess stemflow funneling, often considered as the maximum possible funneling. It attributes the stemflow volume to the tree basal area. In this case, the stemflow affected area becomes:
There is no mixing of stemflow and throughfall. We call this the funneling ratio (index FR) approach below (Herwitz, 1986).
Net Precipitation and Infiltration Distribution
The spatial distribution of infiltration depth (or net precipitation at the ground level for the funneling approaches) was calculated on an event basis. From this we derived the distribution of cumulative annual infiltration depth per plot area.
Stemflow funneling was calculated according to the same concept as by Herwitz (1986) but based on the area of stemflow infiltration (or influence, see above):
where, RFi is the stemflow funneling ratio at infiltration (-), VSF is the stemflow volume and Pg is the gross precipitation [after Herwitz (1986)]. For the conceptual approaches, the equation was applied equivalently using AiSF,A and AiSF,FR, respectively.
Results
Representativeness of Rainfall During the Study Periods
Rainfall distribution of event sizes during study periods agrees well with the 30-year-climate in the region (Figure 1) during the summer months, when campaigns only took place. Just the most extreme daily precipitation sums of the climate time series (>20 mm) were not represented in the weather during the campaign. This might partly be a consequence of comparing daily precipitation data (as events spanning from before to after midnight are split up into two smaller events). On an event basis, the extremes were captured by the precipitation campaigns, e.g., 10 events >20 mm, including one event of 65 mm. Thus, the precipitation as well as throughfall and stemflow yields observed during our short campaigns can be taken to represent the general climate in this region.
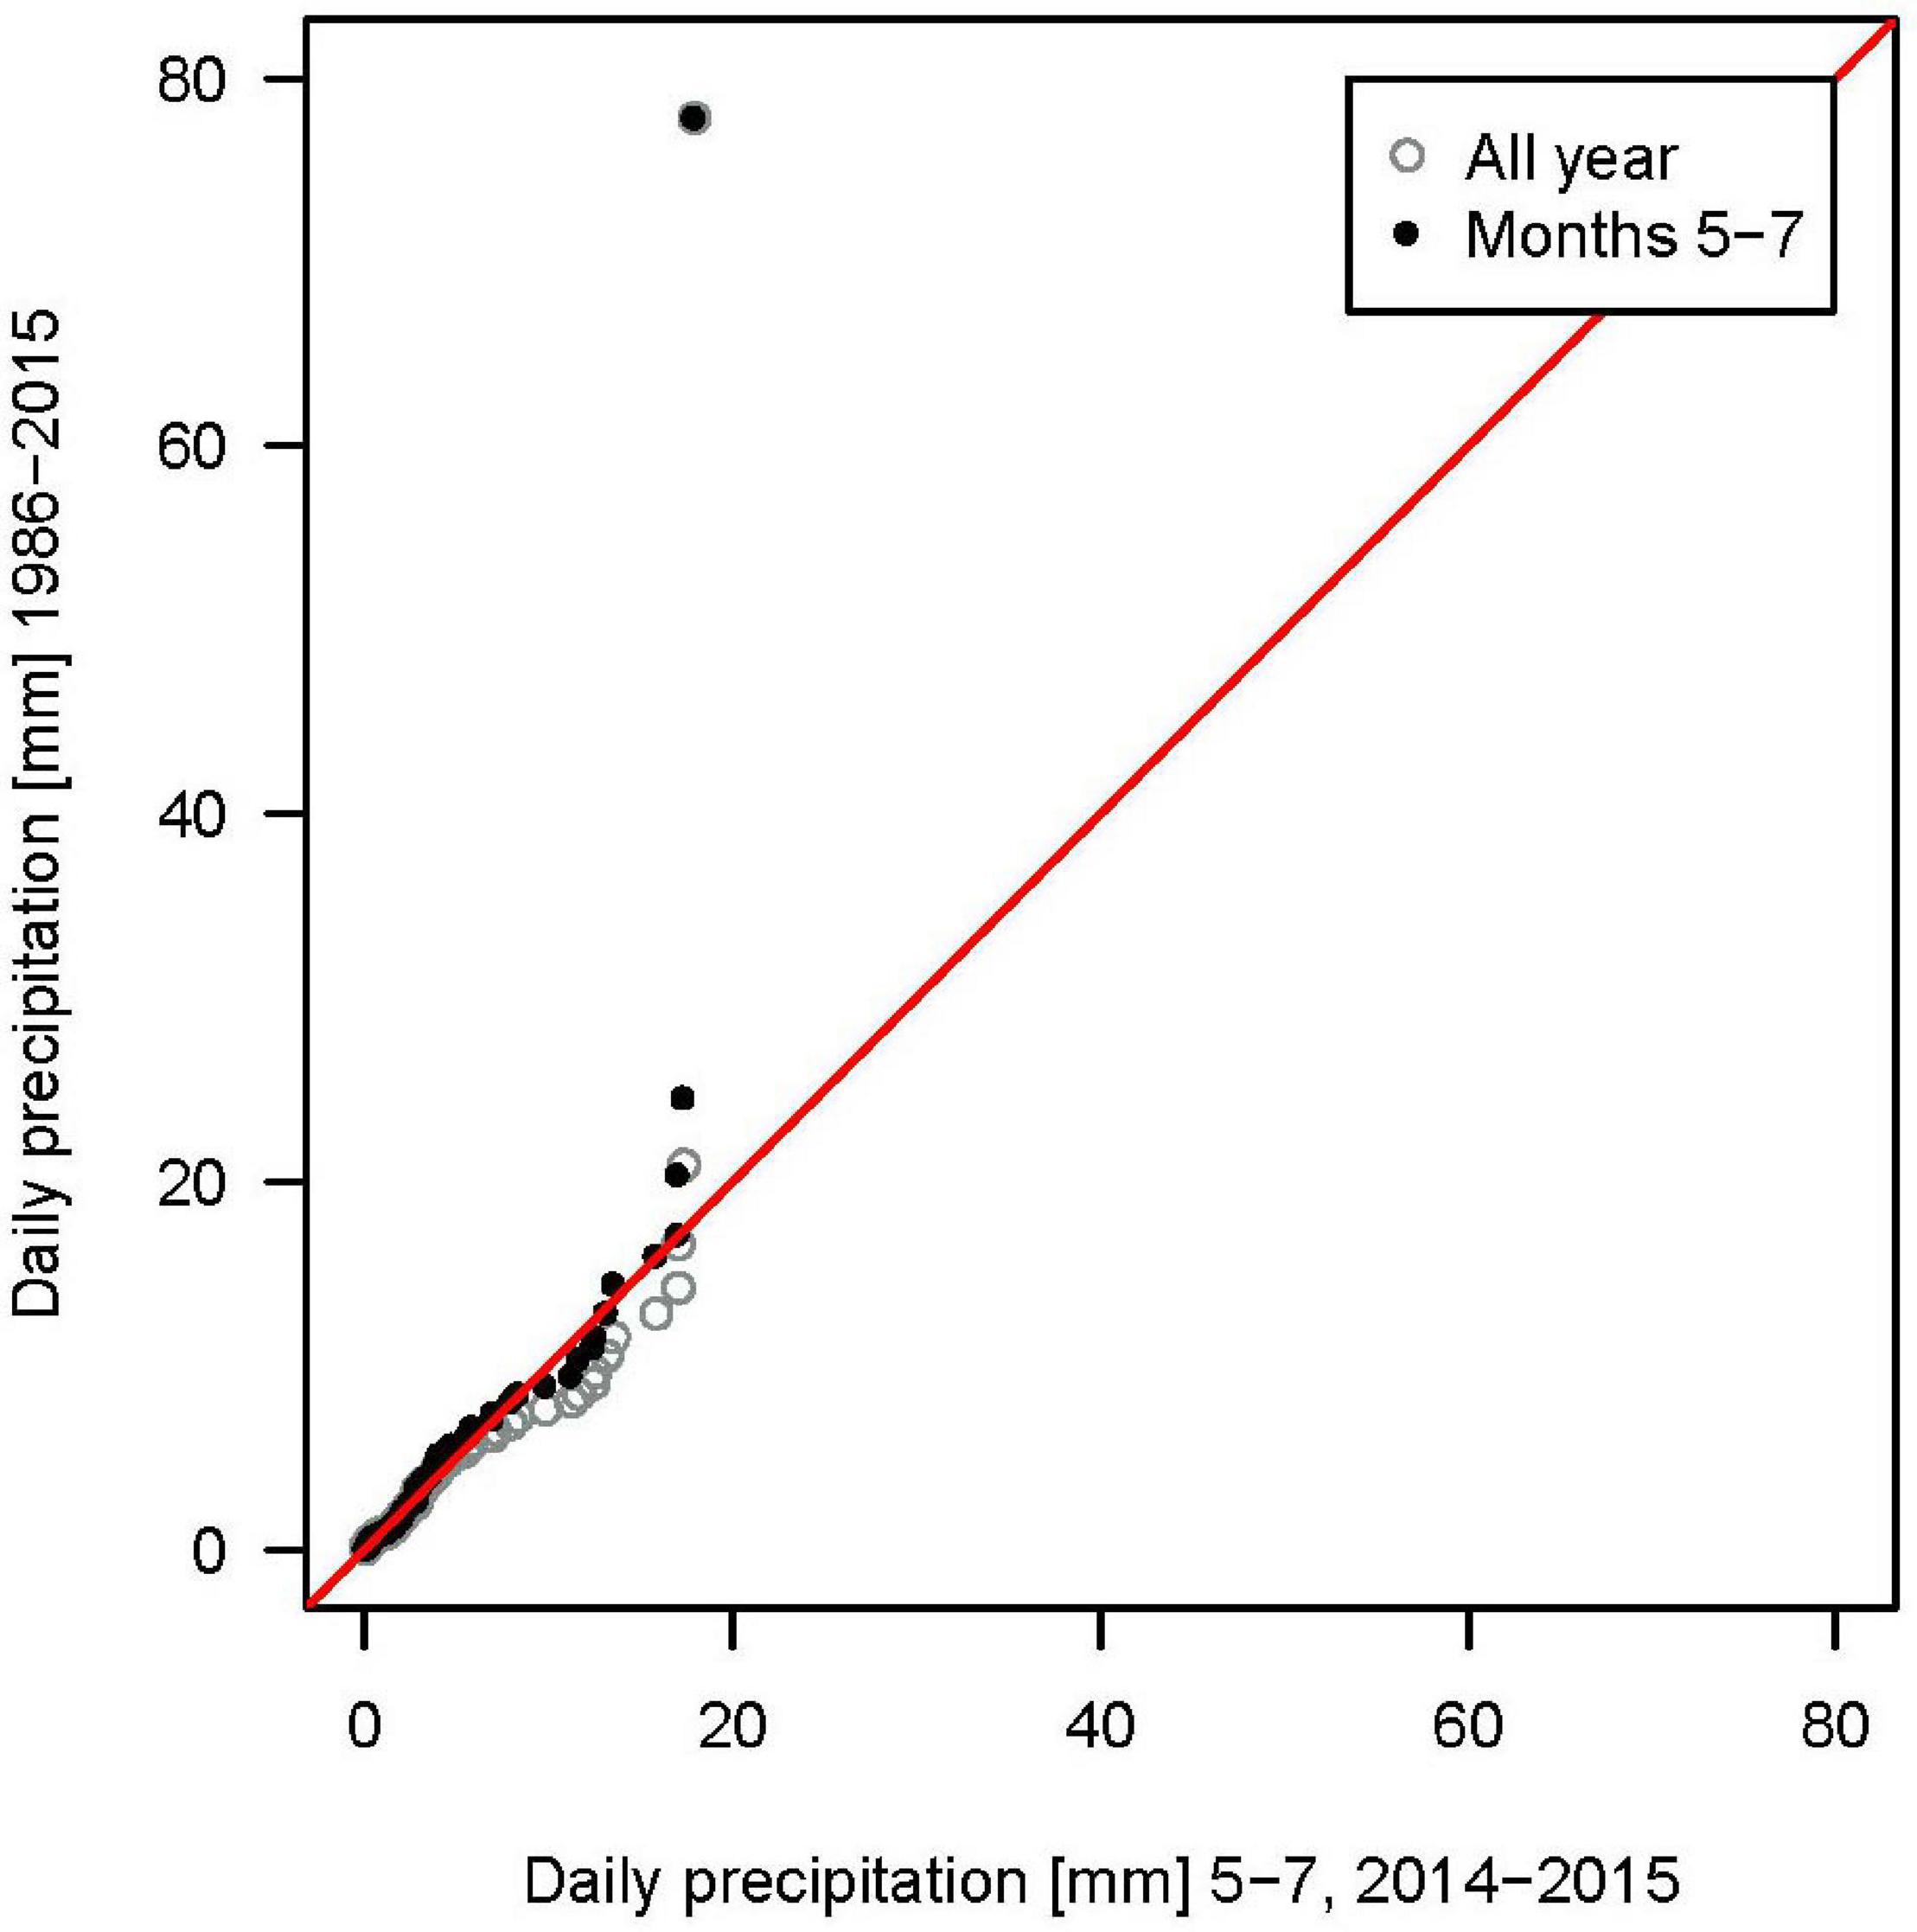
Figure 1. Quantile-Quantile plot of daily precipitation sums of the 30-year climate measured at the German Weather Service (DWD) station in Mühlhausen in relation to the weather during the periods when stand precipitation measurement campaigns took place (May–July 2014 and 2015).
Stemflow Infiltration Areas and Spatial Infiltration Distribution
Infiltration areas (Figure 2) dynamically calculated from stemflow intensity and soil hydraulic conductivity are much smaller (median of 0.0029 m2) at the study site than frequently used conceptual approaches would suggest (annular approach: median of 0.19 m2), and even smaller than the tree’s basal area (median of 0.01 m2). Consequently, stemflow concentration is underestimated by 2–3 orders of magnitude (annular infiltration area approach) and still one order of magnitude by the “classic” basal area funneling ratio presented by Herwitz (1986). It is also noteworthy that the range of stemflow infiltration areas is smaller than the zone of stemflow influence in the funneling ratio approach, in other words, the size of the infiltration area varies less than the tree size.
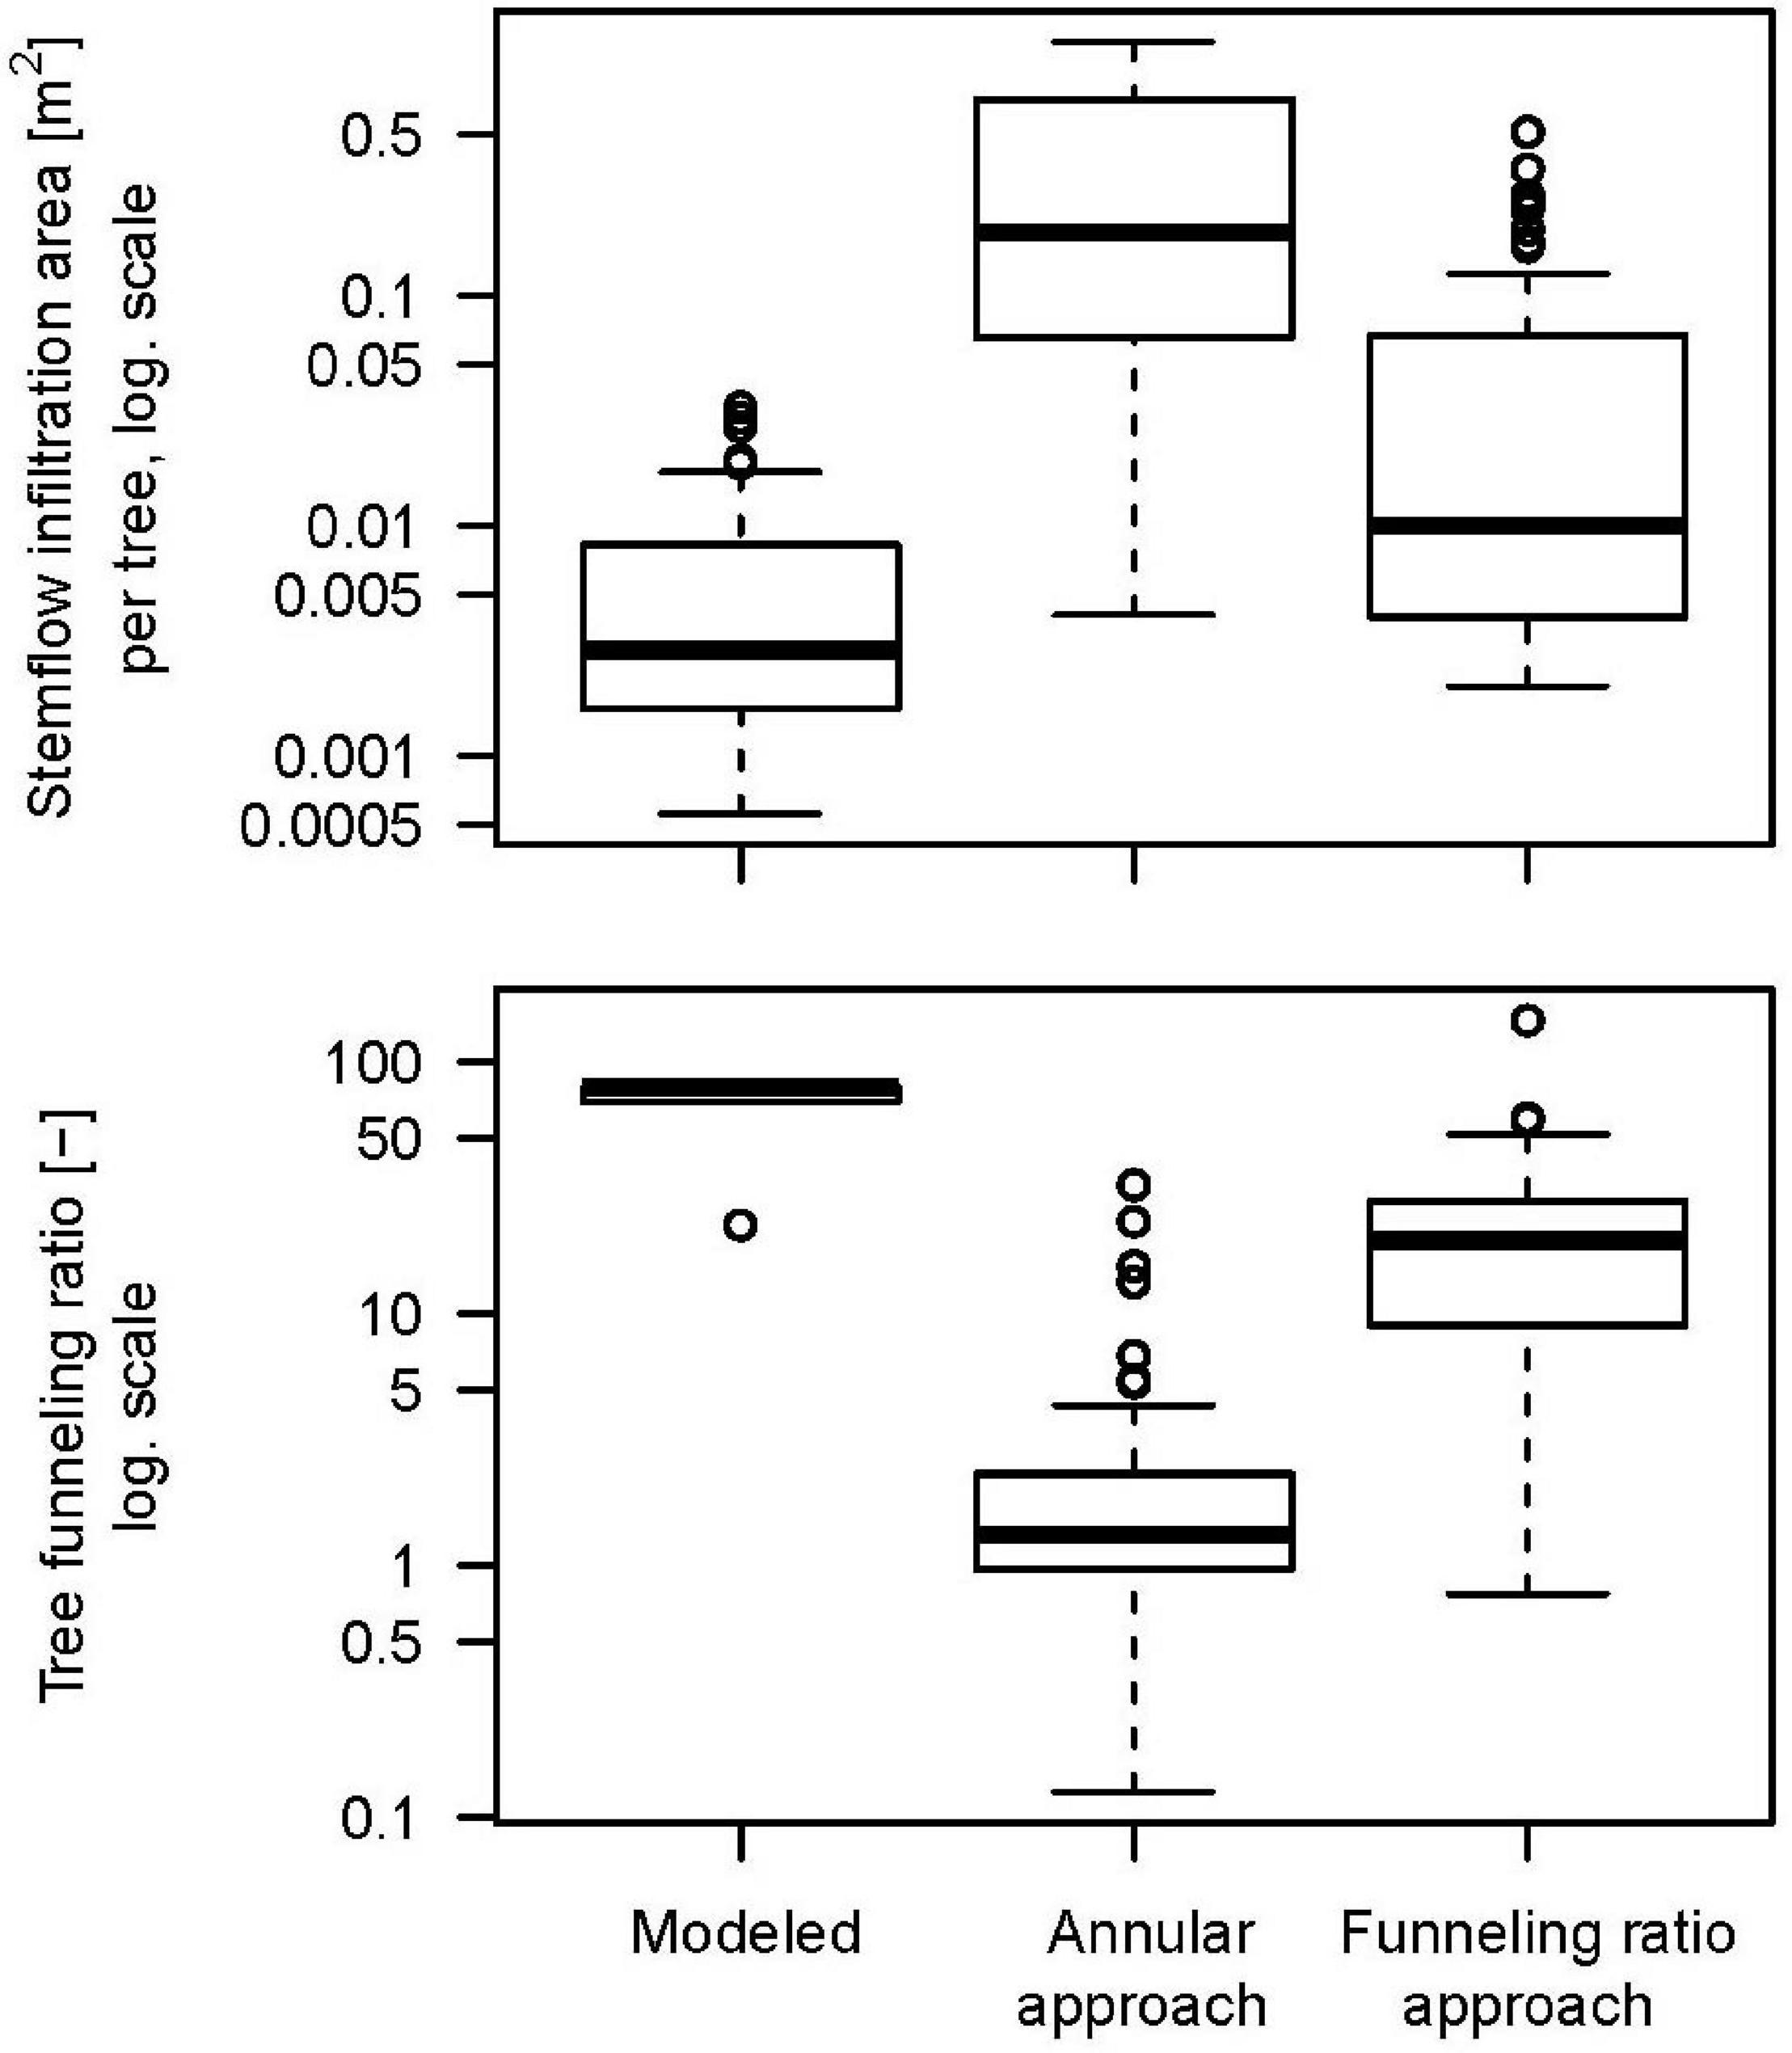
Figure 2. Stemflow infiltration areas and tree funneling ratios for all 65 trees, for the model (Reynolds and Henderson, 1967) and the two funneling approaches (Herwitz, 1986; Tanaka et al., 1996).
Figure 3 shows the spatial distribution of the total infiltration volume on the plot area, i.e., which fractions of the plot area take up which fractions of rainfall volume, ordered from high to low infiltration depths (L m–2 = mm). Dark color of the curve indicates the contribution of stemflow vs. throughfall (light color) to infiltration. Throughfall infiltration depths are distributed rather evenly on the plot, as they follow a slope of ca. –1. In contrast, infiltration depths of stemflow are distinctly higher, creating a steep slope between stemflow and throughfall dominated locations. As a consequence, the contribution of throughfall to infiltration depth in stemflow infiltration areas is minor. Notably, also throughfall dripping points do not form hotspots as powerful as those induced by stemflow (1–2 orders of magnitude difference). All stemflow infiltrates within an extremely small fraction (0.036%) of the plot area.

Figure 3. Distribution of infiltration over the forest plot floor, for the model (Reynolds and Henderson, 1967) and the two funneling approaches (Herwitz, 1986; Tanaka et al., 1996). Shown is the cumulative fraction of net precipitation (sum of stemflow and throughfall) per area fractions of the study plot. Stemflow fractions are in color code.
The comparison of the infiltration area estimates to the popular conceptual funneling approaches of annular area of stemflow influence and funneling ratio show, that both underestimate stemflow hotspots and overestimate the plot area fraction affected by stemflow input. This is best illustrated by the distribution of the total net precipitation into locations with varying precipitation depths (Figure 4): With precipitation being the same (the total stemflow and throughfall measured on the forest plot), the depths are locally multiples higher in the model compared to those estimated by the conceptual funneling approaches. This is because the hydraulic conductivity of the forest soil is sufficiently large to infiltrate all stemflow water to the soil within a very small area. In brief, this suggests that stemflow infiltration is focused on even smaller infiltration areas and forms even stronger hotspots than commonly assumed.
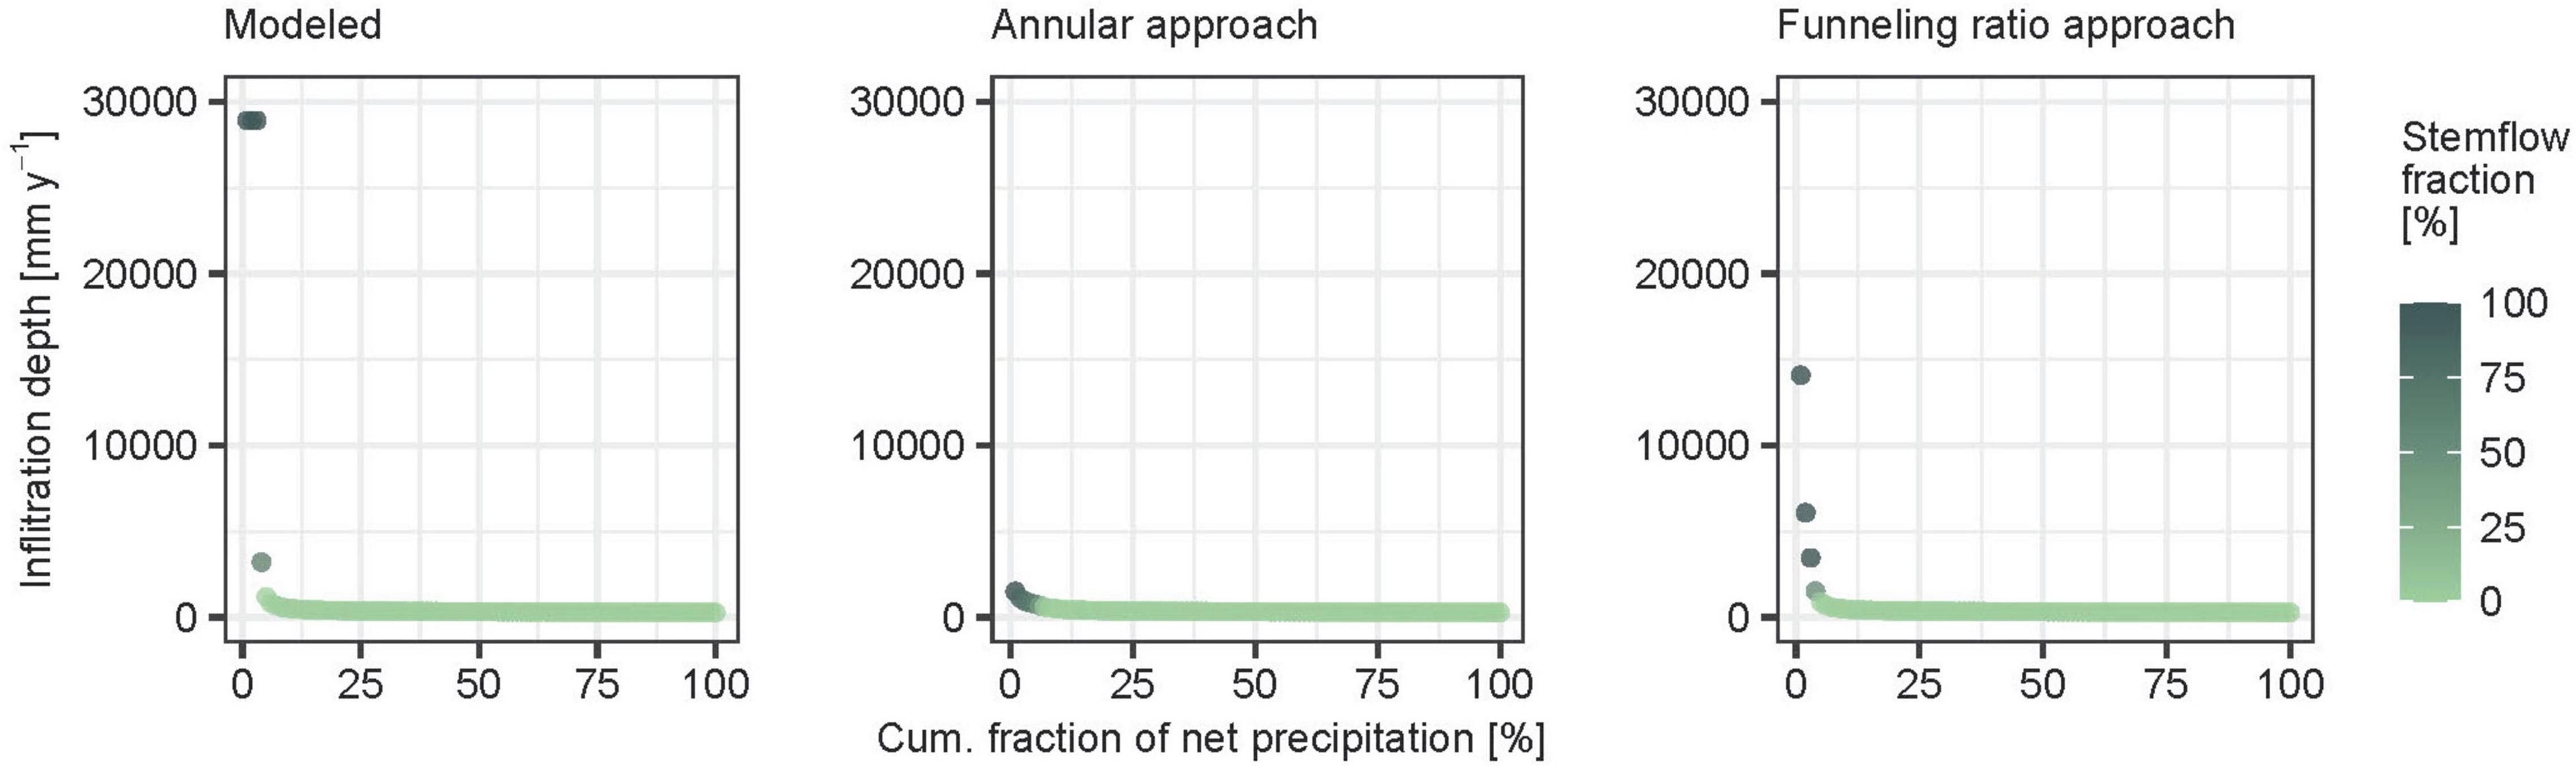
Figure 4. Transfer of net precipitation into infiltration intensity, for the model (Reynolds and Henderson, 1967) and the two funneling approaches (Herwitz, 1986; Tanaka et al., 1996). Shown is the fraction of net precipitation (sum of stemflow and throughfall) contributing to a given infiltration depth. For example, in the center panel 1% of the total annual net precipitation over the forest plot concentrates to a location with infiltration depth of more than 1,500 mm per year, while in the left panel 1% contribute to an infiltration depth of 30,000 mm per year. Stemflow fractions are in color code.
Soil Properties
Soil Characterization and Pedogenic Processes
In general, the soil is shallow (median depth = 0.38 m). It developed from Triassic layered marl- and limestones with periglacial cover/admixture of loess. Silt is the dominant particle size with a median of 75%, followed by clay (21%), and a minor sand fraction (4%) [texture class: Ut4/silt loam according to Ad-Hoc-Arbeitsgruppe Boden (2005)/IUSS Working Group WRB (2006)] (Figure 5). With a median clay content of 19% in the topsoil and 25% in the subsoil, the soils qualify mostly as Luvisols (IUSS Working Group WRB, 2006). The pH is a median of 4.7 in the topsoil and ∼6 in the subsoil. Water content at field capacity in the profile and Ks are a median of ∼42% and ∼300 mm h–1 (Figure 6).
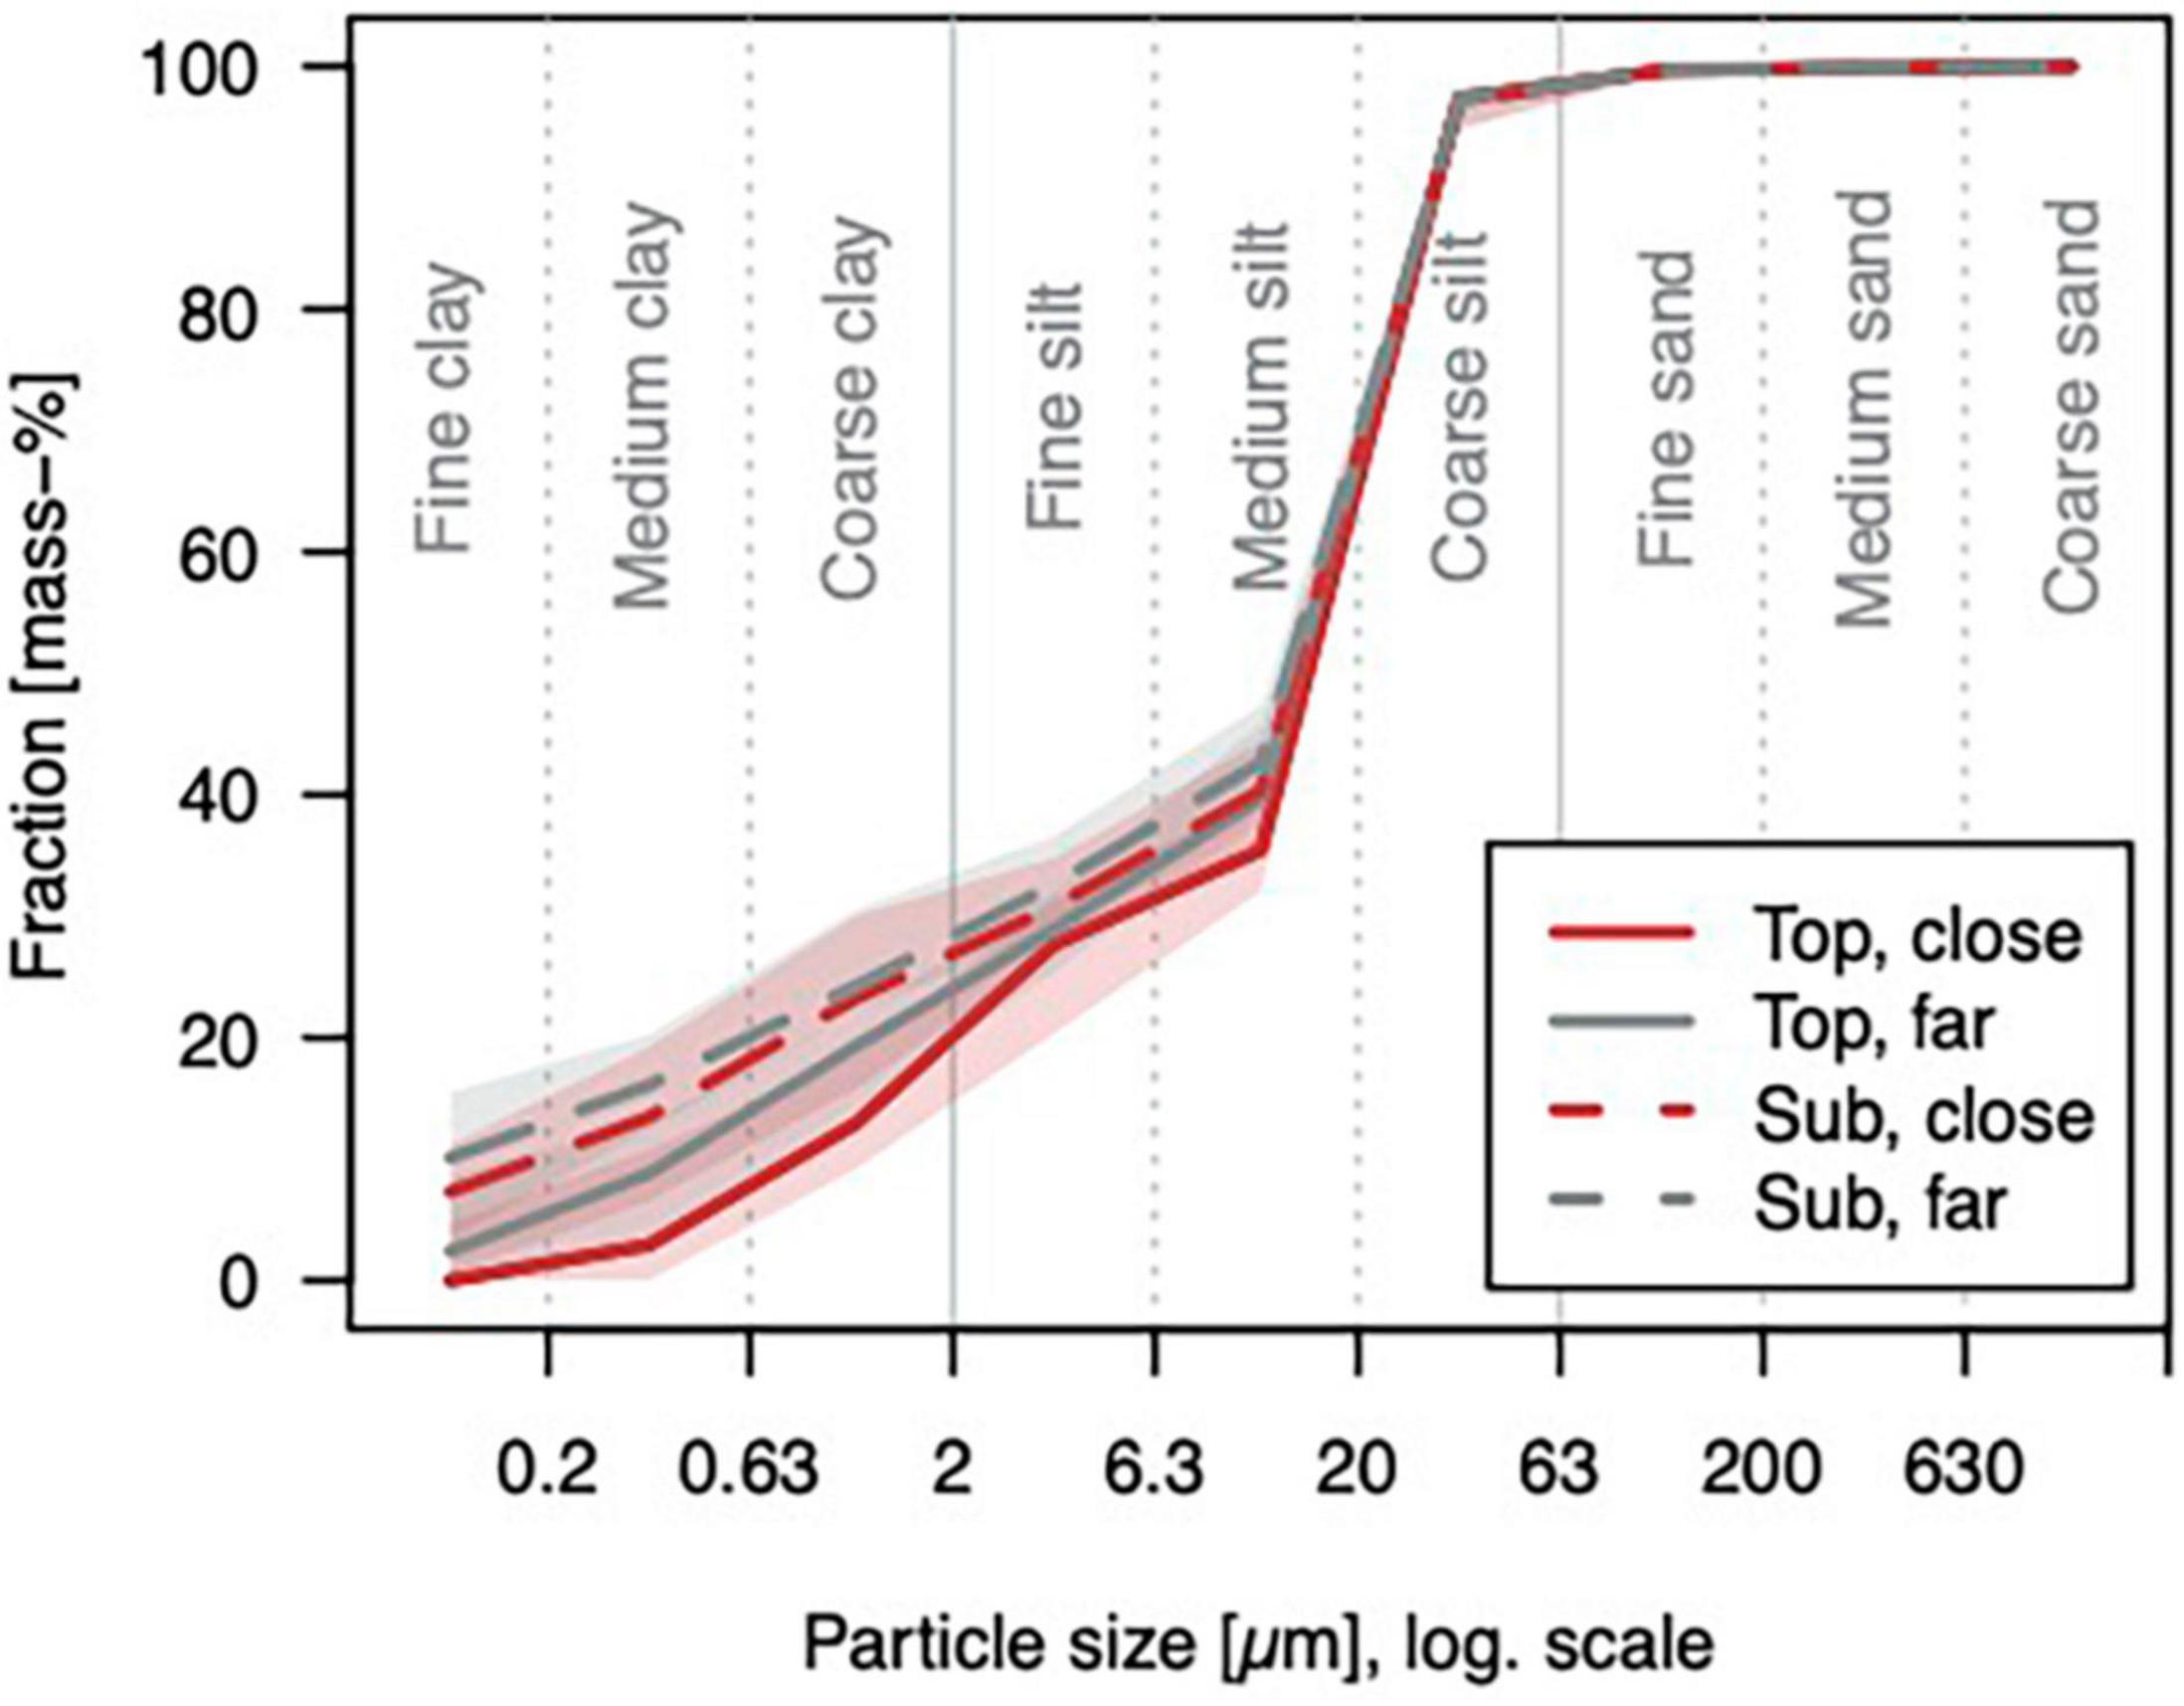
Figure 5. Grain size distribution curves: Medians and quartiles for the topsoil (5–10 cm depth, “top”) and the subsoil (25–30 cm depth, “sub”) close to trees (<1 m distance to a stem, “close”) or further from trees (>1 m distance to a stem, “far”), n in order of appearance: 18, 25, 27, and 28. The clay fraction is significantly different for tree-close and -far in the topsoil (p = 0.03).
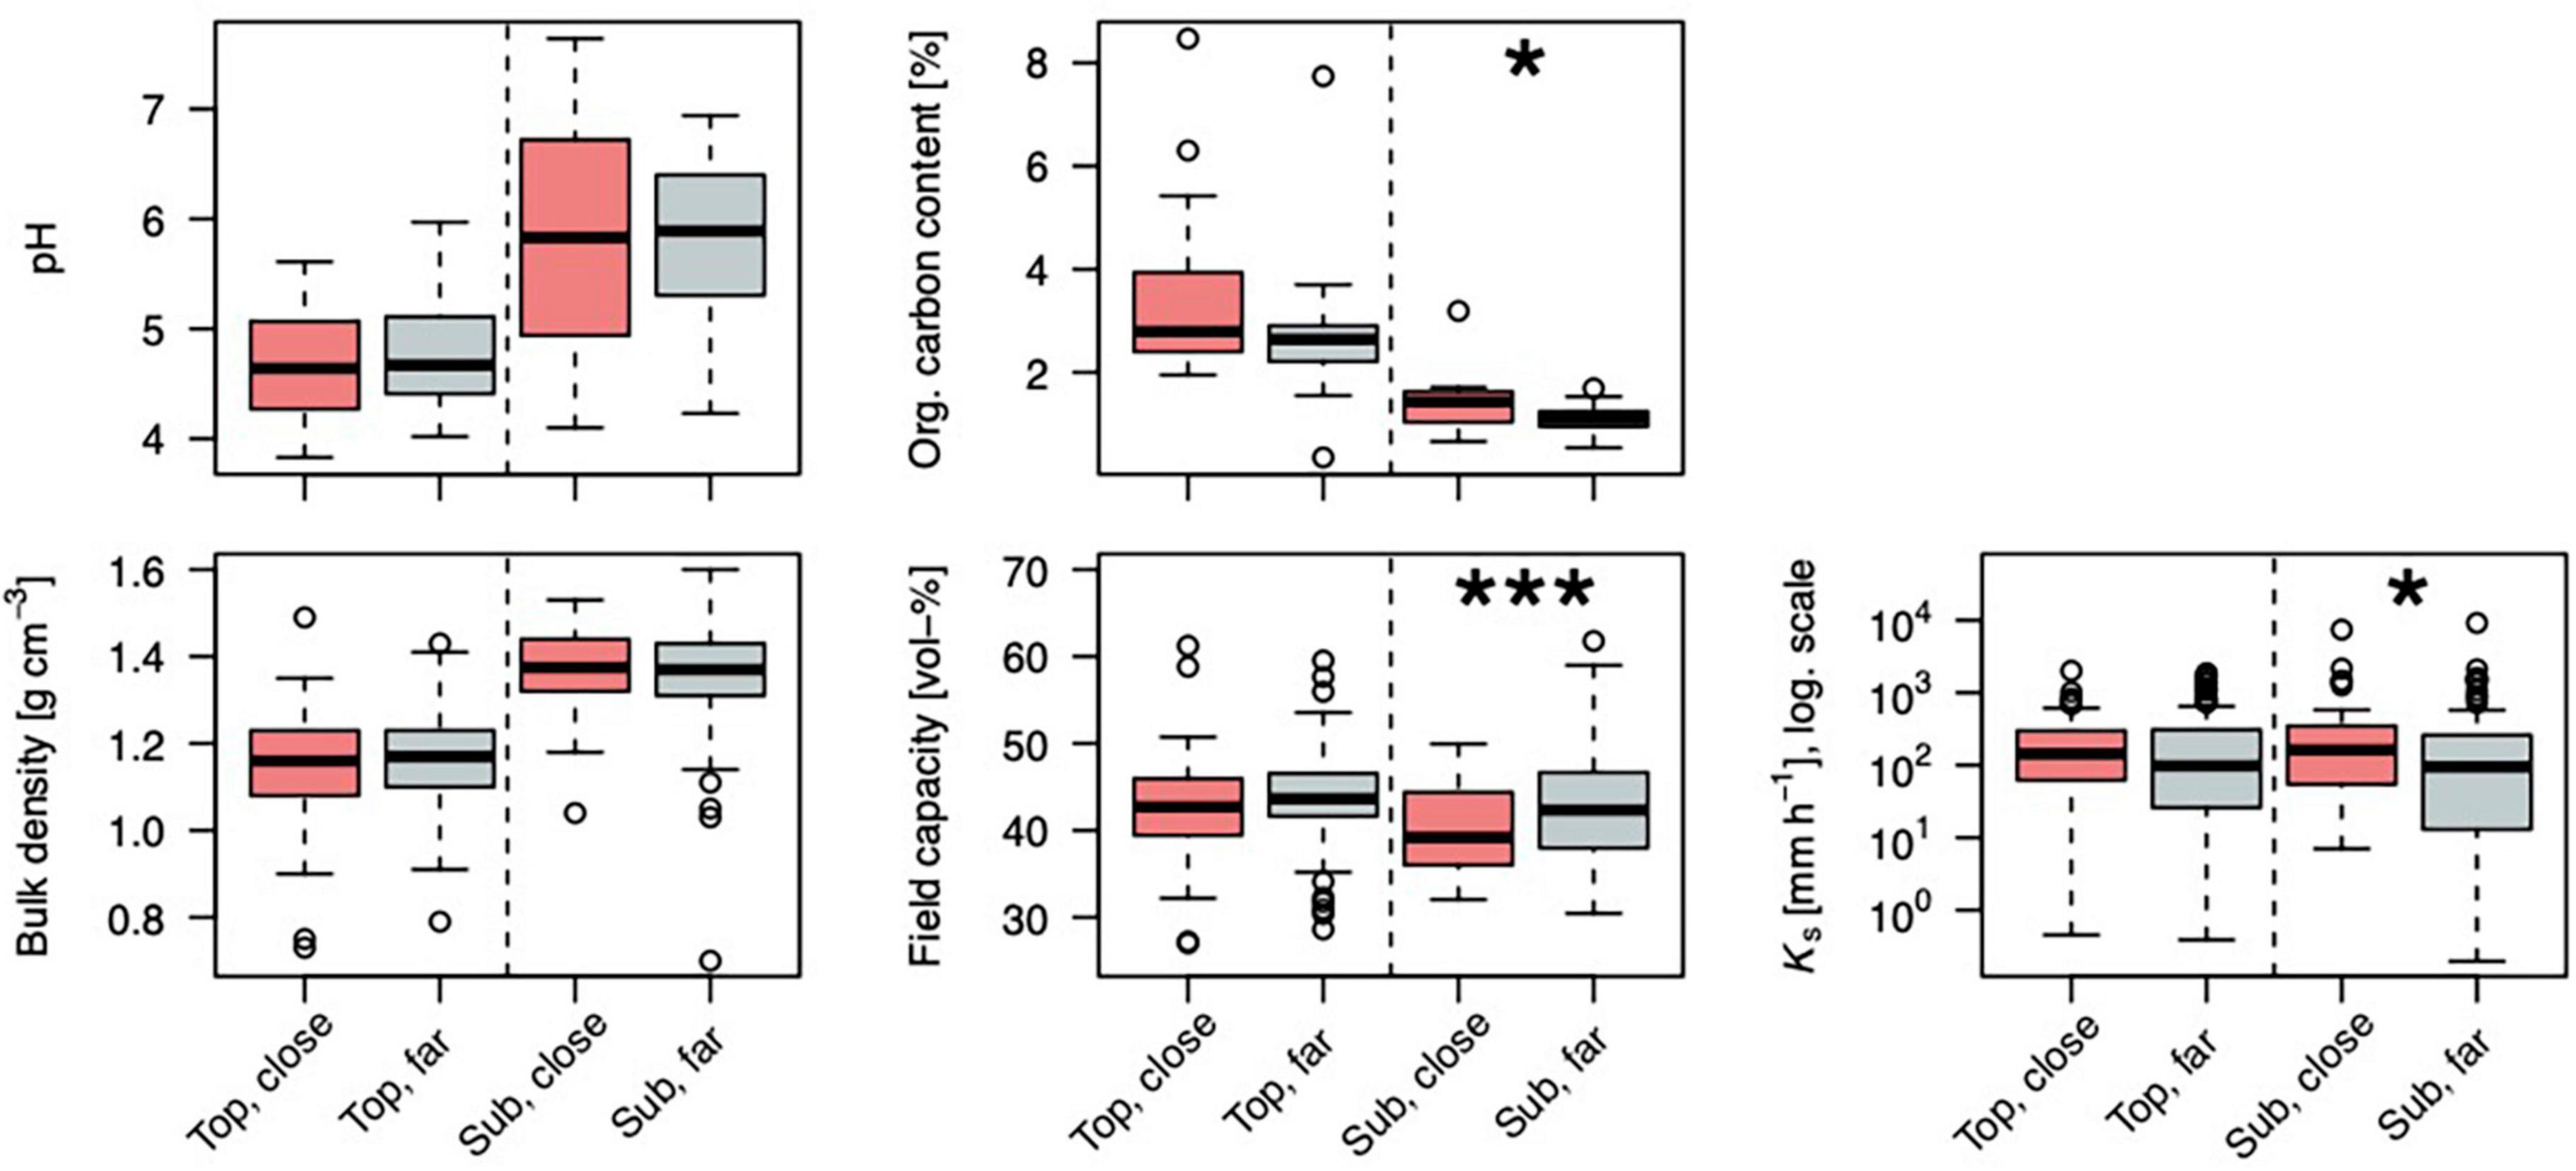
Figure 6. Distributions of soil properties for locations in the topsoil (5–10 cm depth, “top”) and the subsoil (25–30 cm depth, “sub”) close to trees (<1 m distance to a stem, “close”) or further from trees (>1 m distance to a stem, “far”), n (close:far) in order or appearance: 63:136, 62:136, 64:136, 60:122, 19:31, and 19:30. Asterisks mark a significant difference between tree-close and tree-far samples. Field capacity: soil water content at −60 hPa; Ks: saturated hydraulic conductivity. Levels of significance: ∗∗∗p < 0.001, ∗p < 0.05.
Differences of Soil Properties Near Stems Compared to Further Away
Several soil properties were significantly different near and far from stems (Figures 5, 6): In the topsoil, the clay content [and organic carbon content (Corg) as a trend]; in the subsoil, field capacity, saturated hydraulic conductivity (Ks), and Corg. No differences with tree distance were observed for bulk density and soil pH.
In topsoil, the clay fraction is significantly lower close to stems compared to further away, while the other texture fractions show no significant differences. Organic carbon content is considerably higher near trees compared to further away both in the top- and in the subsoil. Hydraulic differences show the same tendency in both top- and subsoil, but are significant only in the subsoil: field capacity is lower near trees, while Ks is higher there. Both findings indicate a higher macroporosity near trees.
Extent of Soil Microsites
Soil microsite extents around trees differed for different soil properties and soil depths (Figure 7). In the topsoil, the critical tree distance was 0.3–0.4 m for soil organic carbon and 0.7 m for clay content; for every other soil property, a tree distance categorization did not improve the model. In the subsoil, the critical tree distance was 0.6 m for soil organic carbon, 0.8 m for hydraulic conductivity (Ks), and 1 m for field capacity. For coarse silt content, the model improved for a critical tree distance of 0.7 m, yet, not significantly. Soil microsites at tree stems, thus, are non-uniform concerning different soil properties. Also, microsites increased with soil depth: On average of all soil properties, critical tree distance increased from ∼0.5 m in the topsoil to ∼0.8 m in the subsoil. For the one property, which differed in both top- and subsoil at microsites, Corg, the critical distance increased from 0.35 to 0.6 m with soil depth.
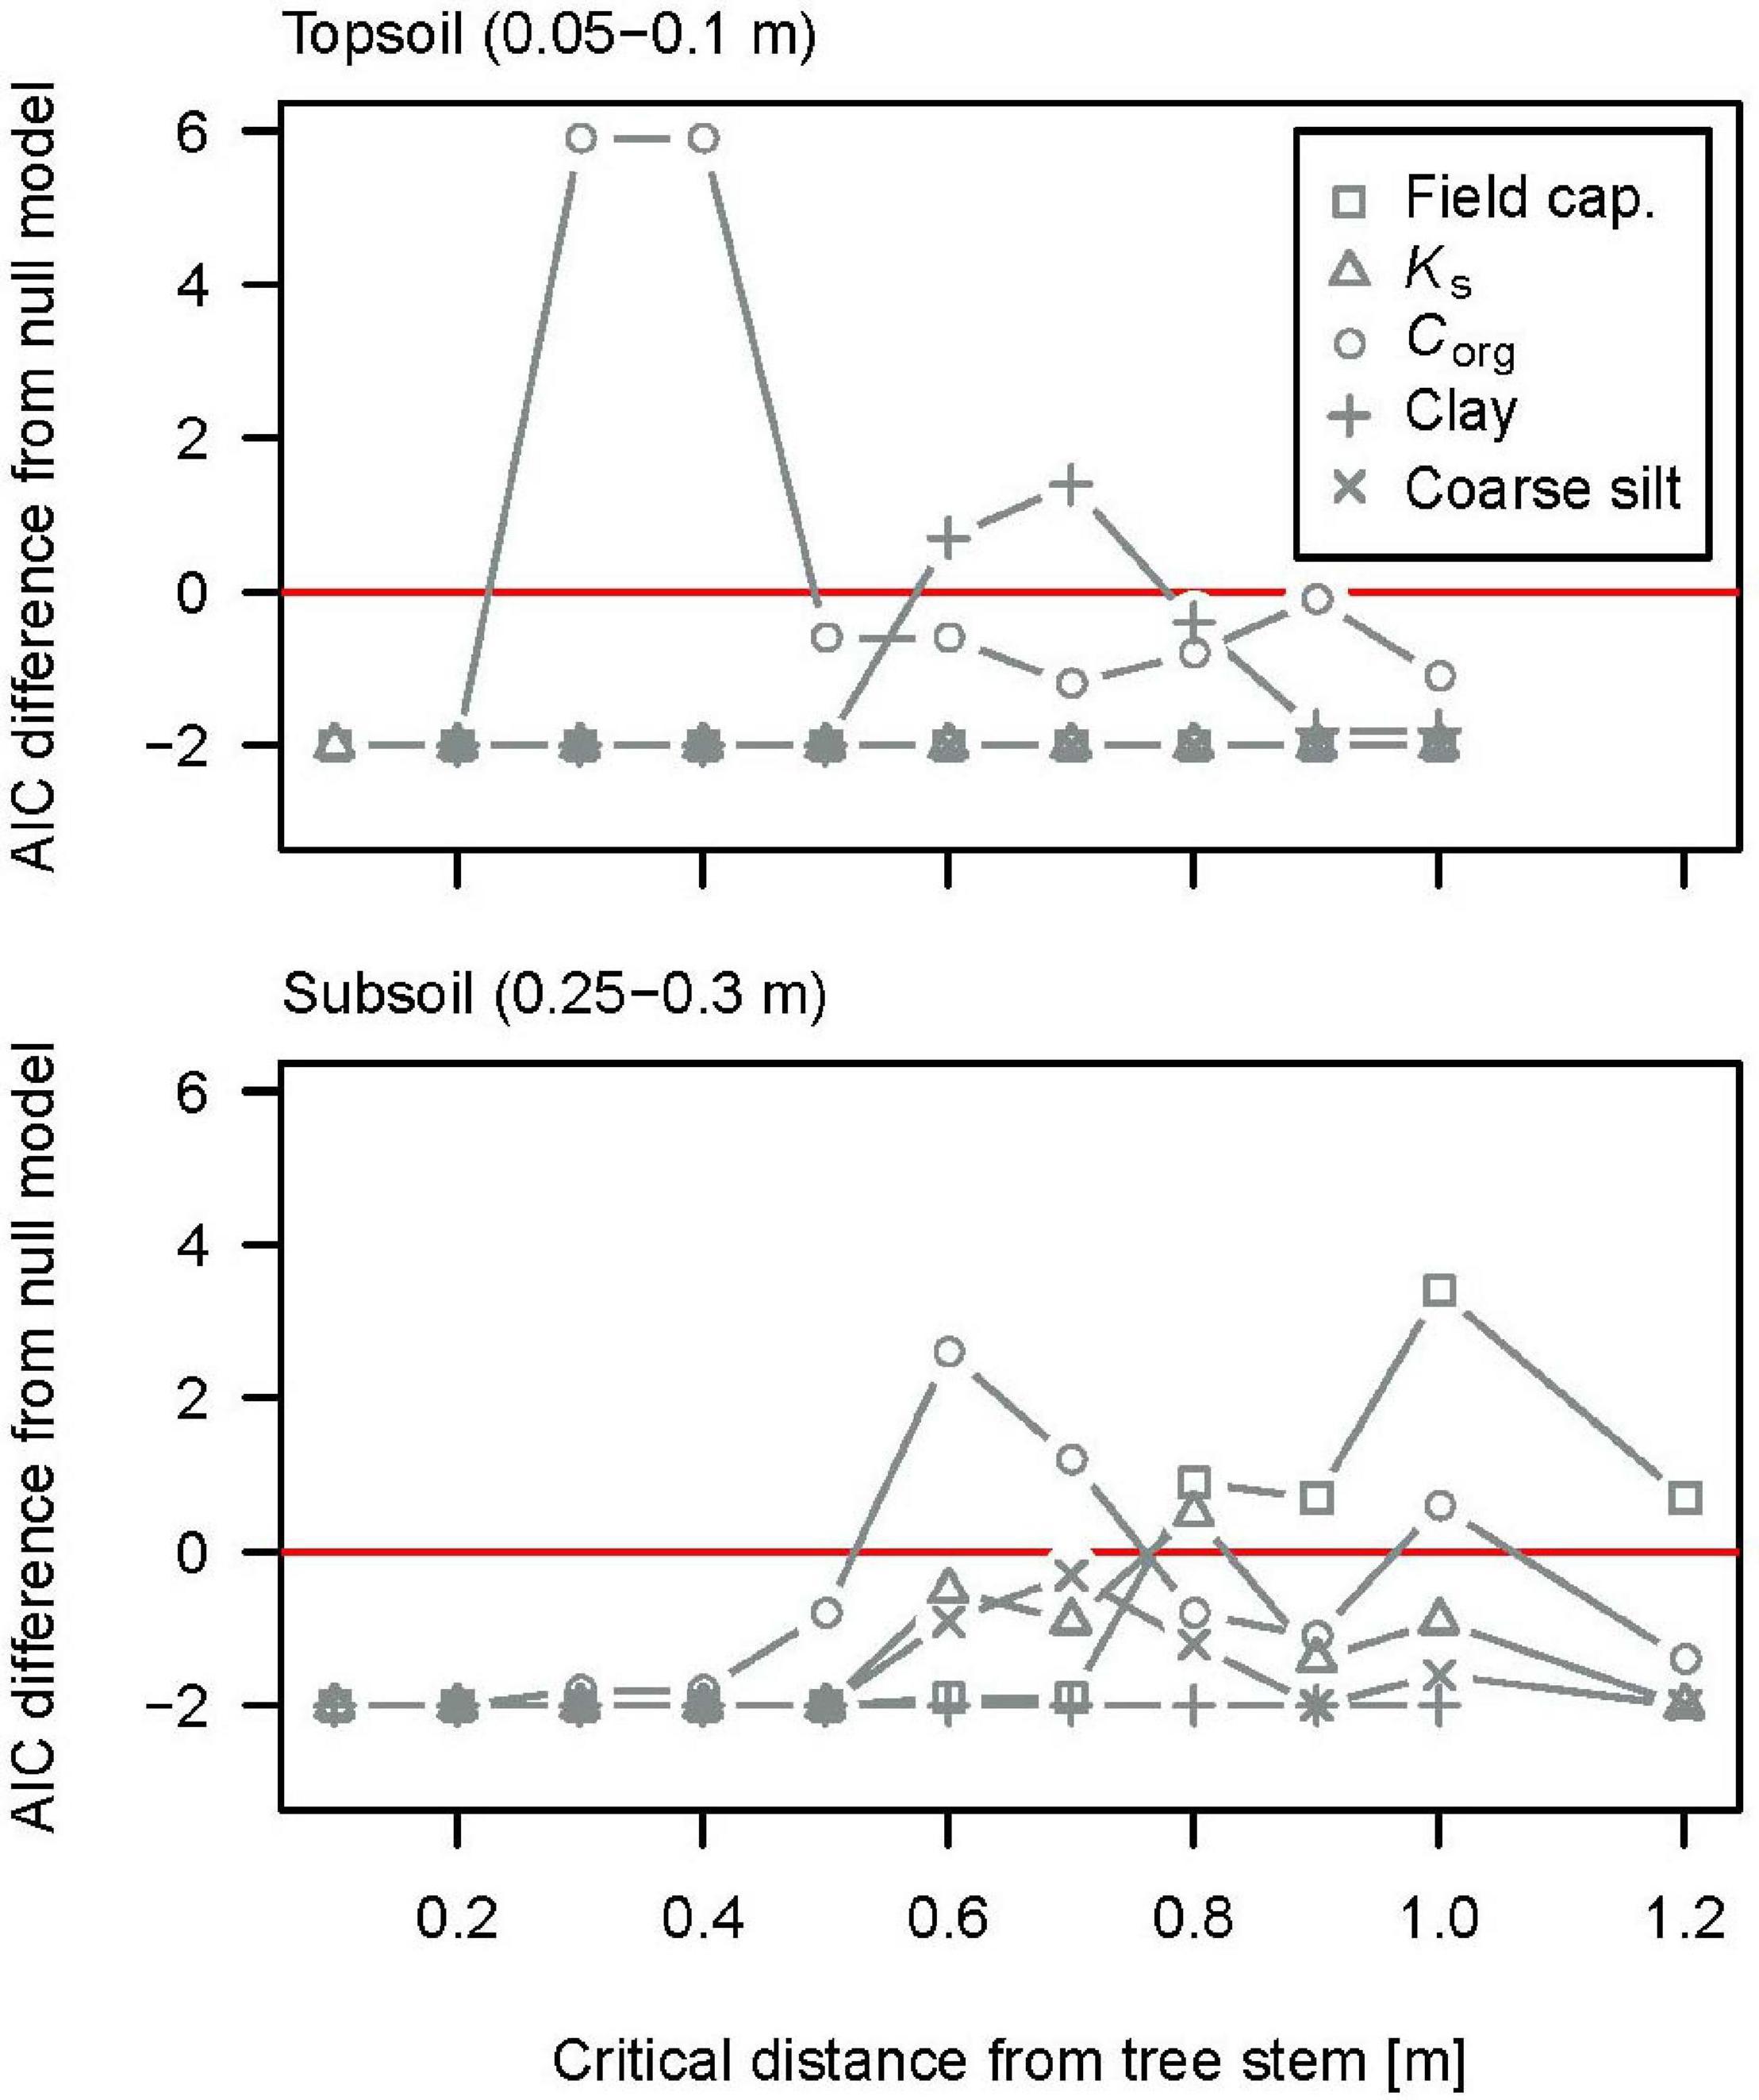
Figure 7. Results for linear mixed-effects models separating the sample in microsites near and forest sites far from stem, for different microsite sizes. Values on the x-axis give the microsite extent in terms of distance from the stem. The y-axis gives the difference between the Akaike information criterion (AIC) of the Null model (no distance classification included) and the microsite model. Positive values on the x-axis imply model improvement when microsites are accounted for. The highest positive value on the y-axis was taken to indicate the best fit model for the size of the tree microsite for each soil property. Field cap.: soil water content at field capacity (vol-%); Ks: saturated soil hydraulic conductivity (mm h–1) (log-transformed); Corg: soil organic carbon content (%); Clay: clay content (%); Coarse silt: coarse silt content (%).
Discussion
Stemflow Infiltration Areas Might be Much Smaller, and Stemflow Funneling Much Stronger, Than Generally Assumed
We found much smaller stemflow infiltration areas (Ai SF) modeled hydrologically based from stemflow intensity and soil infiltration capacity (Horton, 1933; Reynolds and Henderson, 1967; Herwitz, 1986; Carlyle-Moses et al., 2018) compared to conceptual funneling approaches (Herwitz, 1986; Tanaka et al., 1996). Approaches assuming an annular area of stemflow influence only require aboveground information, and therefore have been frequently used (Leonard, 1961; Majima and Tase, 1982; Aboal et al., 1999; Iida et al., 2005; Liang et al., 2011; Rashid and Askari, 2014; Bialkowski and Buttle, 2015). While they were employed to obtain initial estimates of stemflow infiltration areas; it has since become apparent that they are not able to account for the comparatively fast infiltration process, which admits all stemflow water into the ground within a very small area around the stem (Carlyle-Moses et al., 2018). The hydrological infiltration modeling requires an extensive measurement data basis, which is often not available. We were able to apply the hydrological modeling of net precipitation infiltration grounded on a high-resolution dataset (sampling points on 1 ha: 200 throughfall, 65 stemflow, 210 soil; 24 precipitation events). Notably, the derived infiltration areas are smaller than the basal area, implying that stemflow concentration is even stronger than Herwitz’s (1986) often-used funneling ratio. This means that stemflow funneling has likely been generally underestimated.
Our results for Ai SF fit with values reported in literature, despite being much smaller than most of them, considering their specific experimental settings: infiltration areas were mostly obtained for single precipitation or artificial events, often of large volumes and high rates (Reynolds and Henderson, 1967; Herwitz, 1986; Návar and Bryan, 1990; Návar, 2011; Schwärzel et al., 2012). Likewise, Ai SF derived from the stem distance of “infiltration scours” or “litter marks” (Tanaka et al., 1991; Iida et al., 2005; Rashid and Askari, 2014) tend to be due to maximum stemflow rates rather than averages (Carlyle-Moses et al., 2018, 2020). Such maximum-oriented approaches yield Ai SF in the range of dm3 to m3 (Herwitz, 1986; Návar and Bryan, 1990; Tanaka et al., 1996; Iida et al., 2005; Návar, 2011; Rashid and Askari, 2014). In the few studies set up to capture average rainfall conditions, resulting Ai SF were much smaller. E.g., in two dye tracer experiments, Schwärzel et al. (2012) found a larger Ai SF of 0.245 m2 applying a comparatively large quantity of water (180 L during 3 h, European beech), while Carlyle-Moses et al. (2018) found a much smaller Ai SF of 0.0017 m2 investigating three natural precipitation events (5.9–16 mm, lodgepole pine). Also using dye tracer, Tischer et al. (2020) yielded Ai SF ∼0.03 m2 from three average-sized rain events for two dominant trees (sum of ∼23 mm during three weeks, European beech and sycamore maple, DBH > 0.4 m) near this study’s site.
Results from calculations of Ai SF in literature using the hydrological model of Reynolds and Henderson (1967) mirror the range of values obtained from experimental studies (Reynolds and Henderson, 1967; Herwitz, 1986; Návar and Bryan, 1990) (unfortunately, no studies exist giving a direct comparison of calculated and measured values). Furthermore, the results illustrate that Ai SF strongly differ with rainfall/irrigation intensity. Such, Gómez et al. (2002) found a Ai SF of 0.097 m2 vs. 0.373 m2 for the mean of event maxima (average of 15 mm, unfortunately, event means were not given) compared to the total maximum (event of 77.1 mm). Carlyle-Moses et al. (2018) found a mean Ai SF of 0.0016 m2. Considering the intensities, our results agree with these literature values: On average, stemflow infiltration area was 0.0029 m2, while the absolute maximum amounted to 0.45 m2. Based on the aforementioned findings of extremely small infiltration areas in those recent studies (Carlyle-Moses et al., 2018; Tischer et al., 2020) and our own visual observation when present in the field (no overland flow, no litter/infiltration marks), we consider the small stemflow infiltration areas we found to be realistic.
Small Ai SF, at the same time, imply large local stemflow infiltration depths. In comparison, throughfall infiltration is negligible within stemflow infiltration areas (<2% of infiltration depth in Ai SF). Throughfall and stemflow infiltration depths differ by several orders of magnitude (stemflow is an 80-fold of the highest throughfall dripping point), suggesting that throughfall and stemflow represent two totally different input types. This confirms earlier studies, which differentiated “diffuse” and “point” inputs due to throughfall and stemflow (Reynolds and Henderson, 1967; Durocher, 1990; Bialkowski and Buttle, 2015; Liang et al., 2015). These two input types could trigger two different subsurface flow regimes, a slow matrix flow for throughfall and a fast-preferential flow for stemflow. Soil preferential flow of stemflow inputs has been frequently observed throughout climates and species (Johnson and Lehmann, 2006; Liang et al., 2009; Takahashi et al., 2011; Schwärzel et al., 2012; Li et al., 2013; Bialkowski and Buttle, 2015; Spencer and van Meerveld, 2016). Tischer et al. (2020) provide experimental evidence of preferential flow of stemflow close to our study site. On our study plot, stemflow inputs were not recovered in soil water storage near trees (Metzger et al., 2017), suggesting bypass flow of stemflow inputs to deeper subsurface layers.
The relative amount of stemflow observed on the study plot (2.8%) is in the lower medium range of global stemflow observations (see Supplementary Table 1). Interestingly, European beech trees, which are known to be stemflow-prolific (André et al., 2008; Levia et al., 2010), only yielded average stemflow compared to the other species present on the study plot (Metzger et al., 2019). Statistically representative sampling of stemflow is uncommon, as stemflow is often measured on few individual trees that are also not selected randomly (Van Stan et al., 2020). The differences between the literature and our study may be due to the statistically representative sampling of stemflow in a stand of heterogeneous age structure and high tree density, which results from the forest being unmanaged since 30 years. Also, Ks at the study site with a median of 150 mm h–1 (n = 182) lies within the lower range of literature values, e.g., 713 mm h–1 (Durocher, 1990), 415 (Schwärzel et al., 2012), 372 (Herwitz, 1986), 300 (Tang, 1996), 266 (Buttle et al., 2014), 81 (Gómez et al., 2002), 57 (Pressland, 1976), and 50 mm h–1 (Reynolds and Henderson, 1967). We therefore consider that our results are representative and infiltration areas most likely have not been underestimated by the model.
Smaller stemflow infiltration areas, as suggested by our research, could consequently impact landscape water and biogeochemical balances, travel times and storm response. What is more, water and nutrient infiltration hotspots have the potential to impact on subsurface environmental patterns, first of all in the soil.
Altered Soil Properties Indicate Accelerated Soil Formation at Tree-Induced Soil Microsites
Soil properties near tree stems differ significantly from the bulk forest area, forming distinguished microsites. This concerns both the top- and the subsoil, and different soil properties comprising texture, structure and chemistry.
In contrast to much of the available literature on soil properties near stems (Gersper and Holowaychuk, 1971; Neite and Runge, 1986; Falkengren-Grerup, 1989; Wilke et al., 1993; Knoerzer and Gärtner, 2003; Rosier et al., 2016), we found no differences of soil pH between stem close and distant areas at this study’s site. Increased soil acidity near stems has been attributed to a lower pH in stemflow than in rainfall, often with particular attention to the effect of acidic air pollution in the 1970s to 1990s (Neite and Runge, 1986; Falkengren-Grerup, 1989; Rampazzo and Blum, 1992). Without pollution, however, stemflow has also been observed to be more alkaline than rainfall (Jung and Chang, 2013; Shiklomanov and Levia, 2014). At this study’s site, stemflow pH is very similar to rainfall, with a tendency to be more alkaline [data not shown, see also Tischer et al. (2020) for neighboring site]. pH is therefore not expected to have caused the observed differences in soil properties.
Increased Lessivation From Near-Stem Topsoils
Topsoil textures reveal stronger clay translocation (lessivation) at soil microsites near stems. Lessivation occurs during the advance of the soil formation process (in this study’s setting) after decalcification (Blume et al., 2010). The observed pH <6 throughout the profile indicates complete decalcification at the study site. Within the pH range of 6.5–5, lessivation occurs. Notably, soil pH on our site is independent of tree distance, which indicates that enhanced lessivation within near-stem microsites is not related to pH effects. Additionally, clay transport is affected by water fluxes and macroporosity (Blume et al., 2010). With also macroporosity being independent of tree distance (at least in the topsoil), re-occurring enhanced soil water flow due to stemflow input most likely fuels the clay translocation causing the observed texture difference between near-stem and stem distant locations at the study site. Those are also prevalent, but less pronounced, in the subsoil. This suggests that the development of microsites is an ongoing process, and microsites likely grow in depth and distinction over the lifespan of a tree. The lessivation effect demonstrates an enhancement of water-driven soil formation processes in the area of influence of stemflow. While lessivation occurs in soils from calcareous substrates, water flow in general is an important driver for pedogenetic processes. It generally affects weathering/acidification and specifically in Si-rich, permeable substrates it drives podsolization (Blume et al., 2010). Indeed, higher weathering indices and faster podsolization have been observed in tree-proximal areas at other sites (Gersper and Holowaychuk, 1971; Rampazzo and Blum, 1992). Therefore, accelerated soil formation near trees due to increased stemflow inputs might be a global but potentially overlooked phenomenon.
The distance from the stem within which clay translocation from the topsoil significantly influenced soil texture was 0.7 m. This seems to contrast with the above observation that stemflow infiltration areas are very small. Yet, the data need to be interpreted with caution because they refer to temporary, non-localized areas in the case of stemflow infiltration areas, contrasting long-term effects and tree distances in the case of soil microsites. Such, stemflow infiltration areas shift in space between precipitation events and during the tree’s growth. Soil microsites reflect the cumulative effect of this spatiotemporal variability. Also, the extent of soil microsites corresponds better with stemflow infiltration areas during larger events, which amount up to 0.45 m2 (mean: 0.1 m2). Large events represent the major part of total water fluxes at stemflow hotspots (Metzger et al., 2019), and they develop the strongest potential for transport within the soil (Lehmann et al., 2020). Consequently, in spite of their rare occurrence, extreme events might most importantly impact water-driven soil development.
Improved, Macropore-Rich Structure in Near-Stem Subsoils
A lower field capacity and higher hydraulic conductivity (Ks) indicate higher macroporosity at soil microsites near stems. Similarly, Rashid et al. (2015) observed changed van Genuchten parameters (θs, α, n) indicating higher macroporosity near stems. Soil structure is the main driver of soil hydraulic properties besides soil texture, and especially forms medium- and macropores. While the field capacity is the ability to retain water in the finer soil pores, Ks corresponds to the fraction of middle- and macropores allowing infiltration, transport and ventilation (Hillel, 1998; Blume et al., 2010). We infer that the lower field capacity and higher Ks at our site can be attributed to a shift in pore size distribution towards larger pores (Metzger et al., 2017). Soil is aggregated by physical (swelling and shrinking), chemical (electrostatic interactions and coagulation) and biological (gluing by organic compounds and bioturbation) processes (Hillel, 1998; Blume et al., 2010). Within the subsoil, several drivers of aggregation differ near and far from stems. Most importantly, organic carbon content (Corg) is increased at microsites. Higher Corg in tree-proximal areas was also observed in earlier studies, e.g. by Rashid et al. (2015); Chang and Matzner (2000), and Gersper and Holowaychuk (1971) In those works, they had been attributed to high organic loads in the stemflow (Gersper and Holowaychuk, 1971; Chang and Matzner, 2000; Levia and Frost, 2003; Michalzik et al., 2016) as well as higher leaf, root and bark litter accumulation around tree stems (Zinke, 1962; Gersper and Holowaychuk, 1971). In fact, systematically higher Corg in near-stem areas are likely multi-factorial (Gersper and Holowaychuk, 1971; Nacke et al., 2016) and interrelated, as Corg could be accompanied by higher microbial activity near stems (Nacke et al., 2016; Rosier et al., 2016). At our site, carbon enrichment at soil microsites is stronger in the subsoil. Elevated water fluxes and a high proportion of macropores in the near-stem subsoil could have contributed to organic inputs being carried deeper. This would be in line with findings of increased soil organic carbon in preferential flow paths (Bundt et al., 2001) and high particular and colloidal transport observed in soil seepage, especially in extreme events (Lehmann et al., 2020). Regardless of its origin, the elevated Corg in near-stem soils on our study site acts consolidating on the soil structure. Clay content, as another factor of aggregation, is not increased near stems. Yet, stronger shrinking and swelling of clay because of higher amplitudes in the drying-wetting cycle [compare soil water content time series in Metzger et al. (2017)] might additionally consolidate soil structure. Additionally, the tree itself, by growth and decay of roots and push-and-pull movements due to the tree swaying in the wind, could foster aggregation of the clayey soil.
Critical tree distances of hydraulic properties and Corg suggest that soil microsites spread out with increasing soil depth. This might be due to the double-funneling effect which has been observed for stemflow (Johnson and Lehmann, 2006; Schwärzel et al., 2012), suggesting that concentrated stemflow spreads laterally again in the soil along roots. Also, tortuosity of flow paths creates a lateral flow component, and flow vectors might be highly non-uniform according to the observations of Tischer et al. (2020). Additionally, non-water flow related impacts of the tree could play a role. Microsites differ in extent between properties. Such, conductivity (0.7 m) and field capacity (1 m) are not correlated in the subsoil (see the Supplementary Materials for correlation charts). This might be due to gradual shifts in pore size distribution. In contrast, the extent of the enhanced saturated hydraulic conductivity coincides with the extent of enriched coarse silt content, and those properties are also correlated (see Supplementary Materials). A positive feedback would be possible due to the facilitation of clay transport by higher conductivities.
Studying the systematic spatial variability of soil properties has shown to provide a great deal of insight. Our findings clearly show distinct soil microsites at tree stems. In addition, the observed soil property patterns draw a coherent picture of the processes forming the microsites: Increased water fluxes enhance the transport potential within the soil, accelerating soil formation and consolidating soil structure. This creates also a larger fraction of secondary (macro-)pores, further enabling quick preferential soil water flow near trees. The extent of the microsites, exceeding the size of average stemflow infiltration areas, illustrates the strong impact of increased water fluxes for soil development already at low occurrence. We have shown that stemflow importantly shapes its environment and thus directly and indirectly influences hydrological and biogeochemical processes near stems.
Conclusion
We calculated average stemflow infiltration areas per tree based on spatially and temporally representative field measurements of gross and net precipitation and soil hydraulic properties using a dynamic model (Reynolds and Henderson, 1967). The study site is representative to many previous studies in terms of soil properties and stemflow production. Our results suggest, that stemflow infiltration areas generally are two orders of magnitude smaller than previously estimated, and even one order of magnitude smaller than the tree’s basal area. Consequently, the stemflow funneling effect at the soil surface has probably been strongly underestimated. While the area in which stemflow infiltrates is a vanishingly small fraction of the plot, it is subject to a strong infiltration intensity. We showed that throughfall is a negligible contribution to input within stemflow infiltration areas. Stemflow and throughfall inputs form two separate flow regimes, differing by two orders of magnitude. Stemflow creates strong water flow hotspots, which persist at soil infiltration.
In a second step, we approached the effect of stemflow hotspots on soil properties. The spatial distribution of soil properties revealed distinct soil microsites at tree stems. They differ from the bulk soil concerning texture, structure and chemistry. The results indicate accelerated soil formation at microsites.
For some properties (texture difference due to clay translocation) we presented strong evidence that higher percolation due to high stemflow inputs can be identified as an important driver for the evolution of soil microsites. For others, like Corg and soil hydraulic properties, stemflow could likely be an amplifying factor. Furthermore, soil microsites have a larger extent than average stemflow infiltration areas, meaning that stemflow fluxes impact soil properties already at low occurrence: Probably, large and extreme events, during which infiltration areas are increased, have the highest impact on soil formation processes.
While the stemflow percentage of gross precipitation and stemflow-impacted soil areas might be small, the imprint of stemflow is substantial. Stemflow hotspots activate different flow pathways and play a different role for subsurface flow and transport than bulk or average infiltration, with a subsequent impact on hydrological and biogeochemical processes up to the hillslope and catchment scale. The fate of stemflow in the deeper subsurface is hardly observable and therefore largely unknown. Soil microsites at stems highlight the consequences of infiltration hotspots induced by stemflow. Its influence is capable to change soil properties across a remarkable distance even within the short life span of a tree. The changed soil properties further accelerate stemflow-borne fluxes in the subsurface and might activate flow pathways that bypass the main rooting zone, and therefore the forest ecosystem.
Data Availability Statement
The raw data supporting the conclusions of this article will be made available by the authors, without undue reservation.
Author Contributions
JM was the primary author of the manuscript, co-designed the experiment, mainly managed the field work and part of the lab work, and did the data management and analyses. JF contributed to the field work and data management and mainly managed the lab work. BM contributed ideas to the data analysis and interpretation, and contributed to the manuscript. AH co-designed the experiment, advised the data collection, the analyses and the writing process, and contributed to the manuscript. All authors contributed to the article and approved the submitted version.
Funding
This study was funded by the Collaborative Research Centre AquaDiva of the Deutsche Forschungsgemeinschaft (DFG, German Research Foundation) – SFB 1076 – Project Number 218627073.
Conflict of Interest
The authors declare that the research was conducted in the absence of any commercial or financial relationships that could be construed as a potential conflict of interest.
Publisher’s Note
All claims expressed in this article are solely those of the authors and do not necessarily represent those of their affiliated organizations, or those of the publisher, the editors and the reviewers. Any product that may be evaluated in this article, or claim that may be made by its manufacturer, is not guaranteed or endorsed by the publisher.
Acknowledgments
We thank the master students Christoph Grauer, Danny Schelhorn, and Joseph Weckmüller for their contribution to the soil sampling. Some content of this manuscript previously appeared in the Ph.D. thesis of Johanna Clara Metzger (2021).
Supplementary Material
The Supplementary Material for this article can be found online at: https://www.frontiersin.org/articles/10.3389/ffgc.2021.701293/full#supplementary-material
References
Aboal, J. R., Morales, D., Hernández, M., and Jiménez, M. S. (1999). The measurement and modelling of the variation of stemflow in a laurel forest in Tenerife, Canary Islands. J. Hydrol. 221, 161–175. doi: 10.1016/s0022-1694(99)00086-4
Ad-Hoc-Arbeitsgruppe Boden (2005). Bodenkundliche Kartieranleitung (KA 5). Stuttgart: Schweizerbart.
André, F., Jonard, M., and Ponette, Q. (2008). Influence of species and rain event characteristics on stemflow volume in a temperate mixed oak–beech stand. Hydrol. Processes 22, 4455–4466. doi: 10.1002/hyp.7048
Bates, D., Maechler, M., Bolker, M., and Walker, S. (2015). Fitting linear mixed-effects models using lme4. J. Statist. Softw. 67, 1–48.
Bialkowski, R., and Buttle, J. M. (2015). Stemflow and throughfall contributions to soil water recharge under trees with differing branch architectures. Hydrol. Processes 29, 4068–4082. doi: 10.1002/hyp.10463
Blume, H.-P., Brümmer, G. W., Horn, R., Kandeler, E., Kögel-Knabner, I., Kretzschmar, R., et al. (2010). Scheffer/Schachtschabel, Lehrbuch der Bodenkunde. Berlin: Springer-Verlag, 16.
Bundt, M., Widmer, F., Pesaro, M., Zeyer, J., and Blaser, P. (2001). Preferential flow paths: biological ‘hot spots’ in soils. Soil Biol. Biochem. 33, 729–738. doi: 10.1016/s0038-0717(00)00218-2
Buttle, J. M., Toye, H. J., Greenwood, W. J., and Bialkowski, R. (2014). Stemflow and soil water recharge during rainfall in a red pine chronosequence on the Oak Ridges Moraine, southern Ontario, Canada. J. Hydrol. 517, 777–790. doi: 10.1016/j.jhydrol.2014.06.014
Carlyle-Moses, D. E., Iida, S. I., Germer, S., Llorens, P., Michalzik, B., Nanko, K., et al. (2018). Expressing stemflow commensurate with its ecohydrological importance. Adv. Water Resour. 121, 472–479. doi: 10.1016/j.advwatres.2018.08.015
Carlyle-Moses, D. E., Iida, S. I., Germer, S., Llorens, P., Michalznik, B., Nanko, K., et al. (2020). Commentary: What We Know About Stemflow’s Infiltration Area. Front. For. Glob. Change 3:105. doi: 10.3389/ffgc.2020.577247
Chang, S. C., and Matzner, E. (2000). The effect of beech stemflow on spatial patterns of soil solution chemistry and seepage fluxes in a mixed beech/oak stand. Hydrol. Processes 14, 135–144. doi: 10.1002/(sici)1099-1085(200001)14:1<135::aid-hyp915>3.0.co;2-r
Durocher, M. G. (1990). Monitoring spatial variability of forest interception. Hydrol. Processes 4, 215–229. doi: 10.1002/hyp.3360040303
Falkengren-Grerup, U. (1989). Effect of stemflow on beech forest soils and vegetation in southern Sweden. J. Appl. Ecol. 26, 341–352. doi: 10.2307/2403671
Germer, S. (2013). Development of near-surface perched water tables during natural and artificial stemflow generation by babassu palms. J. Hydrol. 507, 262–272. doi: 10.1016/j.jhydrol.2013.10.026
Gersper, P. L., and Holowaychuk, N. (1971). Some effects of stem flow from forest canopy trees on chemical properties of soils. Ecology 52, 691–702. doi: 10.2307/1934160
Gómez, J. A., Vanderlinden, K., Giráldez, J. V., and Fereres, E. (2002). Rainfall concentration under olive trees. Agric. Water Manag. 55, 53–70. doi: 10.1016/s0378-3774(01)00181-0
Herwitz, S. R. (1986). Infiltration-excess caused by stemflow in a cyclone-prone tropical rainforest. Earth Surf. Processes Landf. 11, 401–412. doi: 10.1002/esp.3290110406
Herwitz, S. R. (1987). Raindrop impact and water flow on the vegetative surfaces of trees and the effects on stemflow and throughfall generation. Earth Surf. Processes Landf. 12, 425–432. doi: 10.1002/esp.3290120408
Hillel, D. (1998). Environmental Soil Physics Considerations. San Diego, CA: Elsevier Academic Press.
Horton, R. E. (1933). The role of infiltration in the hydrologic cycle, Eos. Trans. Am. Geophys. Union 14, 446–460. doi: 10.1029/tr014i001p00446
Iida, S. I., Kakubari, J. I., and Tanaka, T. (2005). Litter marks indicating infiltration area of stemflow-induced water. Tsukuba Geoenviron. Sci. 1, 27–31.
IUSS Working Group WRB (2006). World Reference Base for Soil Resources, World soil Resources Reports. Rome: Food and Agriculture Organization of the United Nations, 103.
Johnson, M. S., and Lehmann, J. (2006). Double-funneling of trees: stemflow and root-induced preferential flow. Ecoscience 13, 324–333. doi: 10.2980/i1195-6860-13-3-324.1
Jung, K., and Chang, S. X. (2013). Soil and tree chemistry reflected the cumulative impact of acid deposition in Pinus banksiana and Populus tremuloides stands in the Athabasca oil sands region in western Canada. Ecol. Indic. 25, 35–44. doi: 10.1016/j.ecolind.2012.09.008
Keim, R. F., Tromp-van Meerveld, H. J., and McDonnell, J. J. (2006). A virtual experiment on the effects of evaporation and intensity smoothing by canopy interception on subsurface stormflow generation. J. Hydrol. 327, 352–364. doi: 10.1016/j.jhydrol.2005.11.024
Küsel, K., Totsche, K. U., Trumbore, S. E., Lehmann, R., Steinhäuser, C., and Herrmann, M. (2016). How deep can surface signals be traced in the critical zone? Merging biodiversity with biogeochemistry research in a central German Muschelkalk landscape. Front. Earth Sci. 4:32. doi: 10.3389/feart.2016.00032
Kuznetsova, A., Bruun Brockhoff, P., and Haubo Bojesen Christensen, R. (2016). lmerTest package: tests in linear mixed effects models. J. Stat. Soft. 82.1 (Innsbruck, Austria: Universität Innsbruck Institut f r Statistik), 1–26.
Lehmann, K., Lehmann, R., and Totsche, K. U. (2020). Event-driven dynamics of the total mobile inventory in undisturbed soil account for significant fluxes of particulate organic carbon. Sci. Total Environ. 756, 143774. doi: 10.1016/j.scitotenv.2020.143774
Leonard, R. E. (1961). Interception of Precipitation by Northern Hardwoods, Station Paper NE-159. Upper Darby, PA: US Department of Agriculture, 16.
Levia, D. F., and Frost, E. E. (2003). A review and evaluation of stemflow literature in the hydrologic and biogeochemical cycles of forested and agricultural ecosystems. J. Hydrol. 274, 1–29. doi: 10.1016/s0022-1694(02)00399-2
Levia, D. F., and Germer, S. (2015). A review of stemflow generation dynamics and stemflow-environment interactions in forests and shrublands. Rev. Geophys. 53, 673–714. doi: 10.1002/2015rg000479
Levia, D. F., Van Stan, II, Mage, S. M., and Kelley-Hauske, P. W. (2010). Temporal variability of stemflow volume in a beech-yellow poplar forest in relation to tree species and size. J. Hydrol. 380, 112–120. doi: 10.1016/j.jhydrol.2009.10.028
Li, X.-Y., Hu, X., Zhang, Z.-H., Peng, H.-Y., Zhang, S.-Y., Li, G.-Y., et al. (2013). Shrub hydropedology: preferential water availability to deep soil layer. Vadose Zone J. 12, 1–12.
Li, X.-Y., Yang, Z.-P., Li, Y.-T., and Lin, H. (2009). Connecting ecohydrology and hydropedology in desert shrubs: stemflow as a source of preferential flow in soils. Hydrol. Earth Syst. Sci. 13, 1133–1144. doi: 10.5194/hess-13-1133-2009
Liang, W.-L., Kosugi, K. I., and Mizuyama, T. (2009). A three-dimensional model of the effect of stemflow on soil water dynamics around a tree on a hillslope. J. Hydrol. 366, 62–75. doi: 10.1016/j.jhydrol.2008.12.009
Liang, W. L., Kosugi, K. I., and Mizuyama, T. (2011). Soil water dynamics around a tree on a hillslope with or without rainwater supplied by stemflow. Water Resour. Res. 47, 1–16.
Liang, W. L., Kosugi, K. I., and Mizuyama, T. (2015). Soil water redistribution processes around a tree on a hillslope: the effect of stemflow on the drying process. Ecohydrology 8, 1381–1395. doi: 10.1002/eco.1589
Majima, M., and Tase, N. (1982). Spatial variation of rainfall in a red pine forest. Bull. Environ. Res. Cen. Univ. Tsukuba 6, 75–82.
Martinez-Meza, E., and Whitford, W. G. (1996). Stemflow, throughfall and channelization of stemflow by roots in three Chihuahuan desert shrubs. J. Arid Environ. 32, 271–287. doi: 10.1006/jare.1996.0023
Metzger, J. C. (2021). Hotspots of Soil Water Movement Induced by Vegetation Canopies, Ph.D. thesis. Jena: Friedrich Schiller University.
Metzger, J. C., Schumacher, J., Lange, M., and Hildebrandt, A. (2019). Neighbourhood and stand structure affect stemflow generation in a heterogeneous deciduous temperate forest. Hydrol. Earth Syst. Sci. 23, 4433–4452. doi: 10.5194/hess-23-4433-2019
Metzger, J. C., Wutzler, T., Dalla Valle, N., Filipzik, J., Grauer, C., Lehmann, R., et al. (2017). Vegetation impacts soil water content patterns by shaping canopy water fluxes and soil properties. Hydrol. Processes 31, 3783–3795. doi: 10.1002/hyp.11274
Michalzik, B., Levia, D. F., Bischoff, S., Näthe, K., and Richter, S. (2016). Effects of aphid infestation on the biogeochemistry of the water routed through European beech (Fagus sylvatica L.) saplings. Biogeochemistry 129, 197–214. doi: 10.1007/s10533-016-0228-2
Nacke, H., Goldmann, K., Schöning, I., Pfeiffer, B., Kaiser, K., Castillo-Villamizar, G. A., et al. (2016). Fine spatial scale variation of soil microbial communities under European beech and Norway spruce. Front. Microbiol. 7:2067. doi: 10.3389/fmicb.2016.02067
Návar, J. (2011). Stemflow variation in Mexico’s northeastern forest communities: its contribution to soil moisture content and aquifer recharge. J. Hydrol. 408, 35–42. doi: 10.1016/j.jhydrol.2011.07.006
Návar, J., and Bryan, R. (1990). Interception loss and rainfall redistribution by three semi-arid growing shrubs in northeastern Mexico. J. Hydrol. 115, 51–63. doi: 10.1016/0022-1694(90)90197-6
Neite, H., and Runge, M. (1986). Kleinräumige differenzierung von vegetation und boden durch den stammablauf in einem buchenwald auf kalkgestein. Abhandl. Westfäl. Landesmuseum Naturkunde 48, 303–316.
Nimmo, J. R. (2020). The processes of preferential flow in the unsaturated zone. Soil Sci. Soc. Am. J. 85, 1–27.
Pressland, A. J. (1976). Soil moisture redistribution as affected by throughfall and stemflow in an arid zone shrub community. Aust. J. Bot. 24, 641–649. doi: 10.1071/bt9760641
R Core Team (2016). R: A Language and Environment for Statistical Computing. Vienna: R Foundation for Statistical Computing.
Raat, K. J., Draaijers, G. P. J., Schaap, M. G., Tietema, A., and Verstraten, J. M. (2002). Spatial variability of throughfall water and chemistry and forest floor water content in a Douglas fir forest stand. Hydrol. Earth Syst. Sci 6, 363–374. doi: 10.5194/hess-6-363-2002
Rampazzo, N., and Blum, W. E. (1992). Changes in chemistry and mineralogy of forest soils by acid rain. Water Air Soil Pollut. 61, 209–220. doi: 10.1007/bf00482605
Rashid, N. S. A., and Askari, M. (2014). Litter marks” around oil palm tree base indicating infiltration area of stemflow-induced water. Natl. Semin. Civil Eng. Res. 2014, 14–15.
Rashid, N. S. A., Askari, M., Tanaka, T., Simunek, J., and van Genuchten, M. T. (2015). Inverse estimation of soil hydraulic properties under oil palm trees. Geoderma 241, 306–312. doi: 10.1016/j.geoderma.2014.12.003
Reynolds, E. R. C., and Henderson, C. S. (1967). Rainfall interception by beech, larch and Norway spruce. Forestry 40, 165–184. doi: 10.1093/forestry/40.2.165
Rosier, C. L., Levia, D. F., Van Stan, J. T., Aufdenkampe, A., and Kan, J. (2016). Seasonal dynamics of the soil microbial community structure within the proximal area of tree boles: possible influence of stemflow. Eur. J. Soil Biol. 73, 108–118. doi: 10.1016/j.ejsobi.2016.02.003
Schwärzel, K., Ebermann, S., and Schalling, N. (2012). Evidence of double-funneling effect of beech trees by visualization of flow pathways using dye tracer. J. Hydrol. 470, 184–192. doi: 10.1016/j.jhydrol.2012.08.048
Shiklomanov, A. N., and Levia, D. F. (2014). Stemflow acid neutralization capacity in a broadleaved deciduous forest: the role of edge effects. Environ. Pollut. 193, 45–53. doi: 10.1016/j.envpol.2014.06.011
Smith, R. E., and Goodrich, D. C. (2006). “Rainfall excess overland flow,” in Encyclopedia of Hydrological Sciences, eds M. G. Anderson and J. J. McDonnell (Hoboken, NJ: Wiley).
Spencer, S. A., and van Meerveld, H. J. (2016). Double funnelling in a mature coastal British Columbia forest: spatial patterns of stemflow after infiltration. Hydrol. Processes 30, 4185–4201. doi: 10.1002/hyp.10936
Staelens, J., De Schrijver, A., Verheyen, K., and Verhoest, N. E. (2006). Spatial variability and temporal stability of throughfall deposition under beech (Fagus sylvatica L.) in relationship to canopy structure. Environ. Pollut. 142, 254–263. doi: 10.1016/j.envpol.2005.10.002
Stolte, J., and Veerman, G. (1997). Manual of Soil Physical Measurements, Technical Document: 37. Wageningen: DLO Winand Staring Centre.
Takahashi, K., Uemura, S., and Hara, T. (2011). A forest-structure-based analysis of rain flow into soil in a dense deciduous Betula ermanii forest with understory dwarf bamboo. Landsc. Ecol. Eng. 7, 101–108. doi: 10.1007/s11355-010-0124-1
Tanaka, T., Taniguchi, M., and Taniguchi, M. (1996). Significance of stemflow in groundwater recharge. 2: A cylindrical infiltration model for evaluating the stemflow contribution to groundwater recharge. Hydrol. Process. 10, 81–88. doi: 10.1002/(SICI)1099-1085(199601)10:1<81::AID-HYP302>3.0.CO;2-M
Tanaka, T., Tsujimura, M., and Taniguchi, M. (1991). Infiltration Area of Stemflow-Induced Water, Annual Report-Institute of Geoscience. Tsukuba: University of Tsukuba, 30–32.
Tang, C. (1996). Interception and recharge processes beneath a Pinus elliotii forest. Hydrol. Processes 10, 1427–1434. doi: 10.1002/(sici)1099-1085(199611)10:11<1427::aid-hyp382>3.0.co;2-3
Taniguchi, M., Tsujimura, M., and Tanaka, T. (1996). Significance of stemflow in groundwater recharge. 1: evaluation of the stemflow contribution to recharge using a mass balance approach. Hydrol. Processes 10, 71–80. doi: 10.1002/(sici)1099-1085(199601)10:1<71::aid-hyp301>3.0.co;2-q
Tischer, A., Michalzik, B., and Lotze, R. (2020). Nonuniform but highly preferential stemflow routing along bark surfaces and actual smaller infiltration areas than previously assumed: a case study on European beech (Fagus sylvatica L.) and sycamore maple (Acer pseudoplatanus L.). Ecohydrology 13:e2230.
Van Stan, J. T. II, and Allen, S. T. (2020). What we know about stemflow’s infiltration area. Front. For. Gob. Change 3:61. doi: 10.3389/ffgc.2020.00061
Van Stan, J. T., and Gordon, D. A. (2018). Mini-review: stemflow as a resource limitation to near-stem soils. Front. Plant Sci. 9:248. doi: 10.3389/fpls.2018.00248
Van Stan, J. T., Hildebrandt, A., Friesen, J., Metzger, J. C., and Yankine, S. A. (2020). “Spatial variability and temporal stability of local net precipitation patterns,” in Precipitation Partitioning by Vegetation, eds E. Gutmann and J. Friesen (Cham: Springer), 89–104. doi: 10.1007/978-3-030-29702-2_6
Van Stan, J. T., and Levia, D. F. (2010). Inter-and intraspecific variation of stemflow production from Fagus grandifolia Ehrh.(American beech) and Liriodendron tulipifera L.(yellow poplar) in relation to bark microrelief in the eastern United States. Ecohydrology 3, 11–19.
Whitford, W. G., Anderson, J., and Rice, P. M. (1997). Stemflow contribution to the ‘fertile island’effect in creosotebush, Larrea tridentata. J. Arid Environ. 35, 451–457. doi: 10.1006/jare.1996.0164
Wilke, B., Bogenrieder, A., and Wilmanns, O. (1993). Differenzierte streuverteilung im walde, ihre ursachen und folgen. Phytocoenologia 23, 129–155. doi: 10.1127/phyto/23/1993/129
Zimmermann, A., Voss, S., Metzger, J. C., Hildebrandt, A., and Zimmermann, B. (2016). Capturing heterogeneity: the role of a study area’s extent for estimating mean throughfall. J. Hydrol. 542, 781–789. doi: 10.1016/j.jhydrol.2016.09.047
Zimmermann, B., Zimmermann, A., Lark, R. M., and Elsenbeer, H. (2010). Sampling procedures for throughfall monitoring: a simulation study. Water Resour. Res. 46:W01503.
Zinke, P. J. (1962). The pattern of influence of individual forest trees on soil properties. Ecology 43, 130–133. doi: 10.2307/1932049
Keywords: forest ecohydrology, net precipitation, stemflow infiltration area, stemflow funneling, soil hydrology, soil formation, soil properties
Citation: Metzger JC, Filipzik J, Michalzik B and Hildebrandt A (2021) Stemflow Infiltration Hotspots Create Soil Microsites Near Tree Stems in an Unmanaged Mixed Beech Forest. Front. For. Glob. Change 4:701293. doi: 10.3389/ffgc.2021.701293
Received: 27 April 2021; Accepted: 21 June 2021;
Published: 23 July 2021.
Edited by:
Ling Zhang, Jiangxi Agricultural University, ChinaReviewed by:
Xinping Wang, Chinese Academy of Sciences, ChinaZachary E. Kayler, University of Idaho, United States
Copyright © 2021 Metzger, Filipzik, Michalzik and Hildebrandt. This is an open-access article distributed under the terms of the Creative Commons Attribution License (CC BY). The use, distribution or reproduction in other forums is permitted, provided the original author(s) and the copyright owner(s) are credited and that the original publication in this journal is cited, in accordance with accepted academic practice. No use, distribution or reproduction is permitted which does not comply with these terms.
*Correspondence: Johanna Clara Metzger, am9oYW5uYS5jbGFyYS5tZXR6Z2VyQHVuaS1qZW5hLmRl; Anke Hildebrandt, YW5rZS5oaWxkZWJyYW5kdEB1bmktamVuYS5kZQ==