 Chukwuebuka J. Nwobi1*
 Mathew Williams1,2
- 1School of GeoSciences, University of Edinburgh, Edinburgh, United Kingdom
- 2National Centre for Earth Observation, University of Edinburgh, Edinburgh, United Kingdom
Mangrove forests are important coastal wetlands because of the ecosystem services they provide especially their carbon potential. Mangrove forests productivity in the Niger Delta are poorly quantified and at risk of loss from oil pollution, deforestation, and invasive species. Here, we report the most extensive stem girth survey yet of mangrove plots for stand and canopy structure in the Niger Delta, across tidal and disturbance gradients. We established twenty-five geo-referenced 0.25-ha plots across two estuarine basins. We estimated aboveground biomass (AGB) from established allometric equations based on stem surveys. Leaf area index (LAI) was recorded using hemispherical photos. We estimated a mean AGB of 83.7 Mg ha–1 with an order of magnitude range, from 11 to 241 Mg ha–1. We found significantly higher plot biomass in close proximity to a protected site and tidal channels, and the lowest in the sites where urbanization and wood exploitation was actively taking place. The mean LAI was 1.45 and ranged fivefold from 0.46 to 2.41 and there was a significant positive correlation between AGB and LAI (R2 = 0.31). We divided the plots into two disturbance regimes and three nipa palm (Nypa fruticans) invasion levels. Lower stem diameter (5–15 cm) accounted for 70% of the total biomass in disturbed plots, while undisturbed regimes had a more even (∼25%) contribution of different diameter at breast height (DBH) size classes to AGB. Nipa palm invasion also showed a significant link to larger variations in LAI and the proportion of basal area removed from plots. We conclude that mangrove forest degradation and exploitation is removing larger stems (>15 cm DBH), preferentially from these mangroves forests and creates an avenue for nipa palm colonization. This research identifies opportunities to manage the utilization of mangrove resources and reduce any negative impact. Our data can be used with remote sensing to estimate biomass in the Niger Delta and the inclusion of soil, leaf properties and demographic rates can analyze mangrove-nipa competition in the region.
Introduction
Mangroves are very productive ecosystems due to their tropical coastal location (Alongi, 2009). These ecosystems provide a range of ecosystem services, including provisioning services (e.g., fisheries and fuelwood), regulatory services (e.g., carbon storage, nutrient cycling and shoreline protection), and cultural/aesthetic values (McLeod and Salm, 2006; Bouillon et al., 2008; Feka and Ajonina, 2011; Kauffman et al., 2011; Mukherjee et al., 2014; Friess, 2016). Mangroves act as a valuable carbon sink contributing ∼15% to coastal sediment storage of carbon, despite inhabiting up about 0.5% of the world coastal area (Alongi, 2014). However, mangrove ecosystems are threatened by deforestation and contribute ∼10% of the total global deforestation emissions of CO2 (Donato et al., 2011). The relevance of carbon storage in mangrove sediments and deforestation rates has made mangrove an essential focus for climate change mitigation through conservation and reforestation projects, for instance under the Reducing Emissions from Deforestation and forest Degradation (REDD+) program (McElwee et al., 2017).
Nigeria’s coastal zone includes lagoons, deltas and estuaries comprising mangrove forests and sandy beaches, with a semi-diurnal tidal regime. The mangrove wetland in Nigeria is ranked the fifth country with the largest mangrove area globally (Giri et al., 2011; Hutchison et al., 2014; Lucas et al., 2014). The Niger Delta contains about 60% of Nigerian mangroves, measuring about 801,774 ha in 2017 (FAO, 2005; Fatoyinbo and Simard, 2011; Nwobi et al., 2020). Mangrove forests have relatively low species diversity in Nigeria, with only three genera which include Rhizophora sp. (red mangrove), Laguncularia racemosa (white mangrove) and Avicennia sp. (black mangrove) (Food and Agriculture Organization, 2007). Pristine mangrove forests in Nigeria serve as important sources of seafood including shellfish, finfish and nursery grounds for these organisms (Feka and Ajonina, 2011). These aquatic organisms are also vital indicators of undisturbed mangrove ecosystems in coastal Nigeria (Amadi et al., 2014). Similarly, the presence, absence or abundance of specific floral species are indicators of mangrove perturbation (Mmom and Arokoyu, 2010). However, increasing population, resultant development and industrial activities are changing this valuable ecosystem. Coastal development, aquaculture expansion and over-harvesting have led to a 30–50% reduction in global mangroves over the past 50 years (Kauffman et al., 2011). Loss of mangrove wetlands in the Niger Delta is prominently due to oil spills, land reclamation for housing, road, electricity power lines, port development and dredging waterworks (Feka and Ajonina, 2011). Local communities depend on mangrove cutting for fuelwood and commercially for sale in the Niger Delta. Mangroves also provide wood products to the wood industry in Nigeria; however, this practice is unsustainable and threatens mangrove forests sustainability (Kinako, 1977). Unchecked logging of mangrove trees leads to a reduction in mangrove extension and has been linked to the expansion of the invasive Nypa fruticans within the Niger Delta (Okugbo et al., 2012; Global Invasive Species Database (GISD), 2015). Information on patterns of mangrove loss is sparse, but vital to support conservation measures. Limited research in mangrove forests in Nigeria is primarily due to social unrest, restricted access and security. These hindrances to mangrove forest research have resulted in limited data on mangrove forest structure in the Niger Delta. Mangrove research in Nigeria is restricted to community structure relationship with soil properties, carbon dynamics and productivity, remote sensing of forest area and remediation/remediation (Ukpong, 1994, 2000b; James et al., 2007, 2013; Jackson, 2011; Fatoyinbo and Simard, 2013; Edu E.A. et al., 2014; Edu E.A.B. et al., 2014). One viable option for mangrove research in Nigeria include the use of remote sensing due to the challenge of field surveys in the region (Nwobi et al., 2020). However, remote sensing analysis relies on sound ground data for calibration, and hence fieldwork is still an important requirement.
Field estimates of stand structure [e.g., basal area (BA) and stem size], canopy properties [e.g., leaf area index (LAI)] and aboveground biomass (AGB) are needed to build a baseline to monitor mangrove forest change, develop restoration plans, and support calibration of remote sensing data. For instance, BA is the basis for monitoring the removal of mangrove stands from logging activities (Ngoc Le et al., 2016). Both LAI (Clough et al., 1997) and change in AGB (Alongi, 2009) can be used as indicators of net primary productivity. In-situ measurement of ABG and LAI over a forested landscape are also vital for integration with satellite imagery forest assessment with both optical and radar data (De Kauwe et al., 2011; McNicol et al., 2017). However, in order to monitor local disturbance such as targeted logging or determine the expansion rate of invasive species, a fine scale of observations need to be adopted in mangrove monitoring programs.
Selective harvesting in natural forests is a subtle activity being carried out by local communities in the Niger Delta. This wood exploitation can result in the change in stand size and canopy structure (Walters, 2005b), since this extraction targets particular tree size classes when harvesting wood. These tree sizes exploited are called the target tree size, which is the most economical range of tree size harvested in order to maximize profit. For mangrove forests located along creeks, target stems are those with maximum harvestable tree sizes that allow efficient water transport to the point of sale. The target size class depend on the type of forest, wood species, the distance of forest stands from the point of sale, type of harvesting tool, the harvester gender and transportation method (Allen et al., 2001; Walters, 2005a; Feka and Ajonina, 2011). On Kosrae, Micronesia they reported a favorable species for harvesting as Lumnitzera littorea and a target diameter size of 10–30 cm (Allen et al., 2001). The change in mangrove stand size structure has a direct effect on stand biomass by altering the relative contribution of different stem sizes to the total forest AGB (Feka and Ajonina, 2011). Selective harvesting can also result in light gaps which are prominent natural process in mangrove forests. Forest gaps can be created from natural (hurricane or lightning) or anthropogenic (wood exploitation) disturbance (Amir and Duke, 2009). Selective harvesting and the resulting light gaps are detrimental to mangrove forests of the Niger Delta because of the presence of the alien invasive nipa palm (Nypa fruticans). Light gaps from tree cutting creates an avenue for either colonization by invasive species or reestablishment of mangrove species (Schnitzer et al., 1991; Harun Rashid et al., 2009; Potin, 2013). Mangrove and nipa palm shrubs growing together within light gaps formed by logging are common features in the Niger Delta.
This is the first report on mangrove biomass in the Niger Delta that spans two states in Nigeria and covers a wider area from the Niger Delta creeks in the Rivers State to the Imo river estuary (IRE) in the Akwa Ibom State. Previous biomass surveys were restricted to one location using small plot size (Nwigbo et al., 2013; Numbere and Camilo, 2018). This is also the first report on mangrove biomass spatial distribution across the Niger Delta from the ocean, tidal channel and settlement areas. Previous reports have studied mangrove distribution in relation to soil patterns but there is no report on AGB in the delta proper (Ukpong, 1994, 2000a, 2000b). We also provide a first step to monitor mangrove productivity by establishing a relationship between the forest canopy structure and woody biomass. The invasion of nipa palm in mangrove forests is a subtle issue in the Delta, slowly replacing the natural mangrove stands because of deforestation. Nipa palm was first introduced in the early 1900s to control beach erosion but due to poor management, has been growing unchecked in coastal Nigeria. Nipa palm has continually increased by sevenfold between 2007 and 2017 (11,774 ha), naturally invading mangrove forests after disturbance (Nwobi et al., 2020). Thus, we report the possible effect of wood exploitation on the colonization of nipa on mangrove forests. Nipa palm has been termed a secondary successor to destroyed mangrove forests in the Niger Delta (Ukpong, 2015). Previous reports have estimated area coverage per state (Isebor et al., 2003) and nipa influence in changing habitat (Ukpong, 2015), but there is no assessment on the relationship between nipa invasion and mangrove forest anthropogenic disturbance. We also report here the first largest stem size survey in the Niger Delta and how local disturbance is altering the contribution of these stands to the biomass stock of Niger Delta mangrove forests. The relationship among biomass, disturbance and stand structure in the Niger Delta can inform restoration projects on target stand size and help develop management plan.
The objective in this research is to provide a large survey of the relationships amongst mangrove stand, canopy structure and biomass structural and spatial patterns in the Niger Delta. We address the following questions: (a) what is the natural variation of AGB and LAI across the Niger Delta study site? (b) What are the effects of anthropogenic factors on the structure of mangrove forests? (c) Is mangrove wood exploitation a precursor to nipa palm invasion in the Niger Delta? We hypothesize that higher biomass plots will be closer to tidal channels and farther from human settlements. We also hypothesize a positive linear relationship between AGB and LAI. We test the hypothesis that disturbance is removing mangrove stands with higher diameter at breast height (DBH) size thus altering their contribution to the total forest AGB. Lastly, we test the effect of wood exploitation as a precursor to nipa palm invasion in the Niger Delta. Understanding the interplay of local anthropogenic disturbance and nipa palm invasion on mangrove structure can assist in the management of unsustainable wood harvesting.
Materials and Methods
The Niger Delta
The Niger Delta is the largest coastal delta in Africa (Figure 1A) and the ninth largest wetland in the world with an estimated area of 19,135 km2 (Dupont et al., 2000). The delta contains all three-mangrove genera characteristic of the Atlantic coasts: Rhizophora, Avicennia, and Laguncularia. These species are Rhizophora racemosa, Rhizophora mangle, Rhizophora harrisonii, Avicennia germinans, and Laguncularia racemosa species. Temperature ranges from 21 to 33°C. Mean annual precipitation of 2,436 mm (Amechi et al., 2014) ranging between 1,500 to 4,000 mm (NDDC, 2006). There are two seasons in Nigeria with the highest temperatures between February and April (28–33°C); and lowest temperatures (21–23°C) during the peak of the rainy season between June and September (NDDC, 2006).
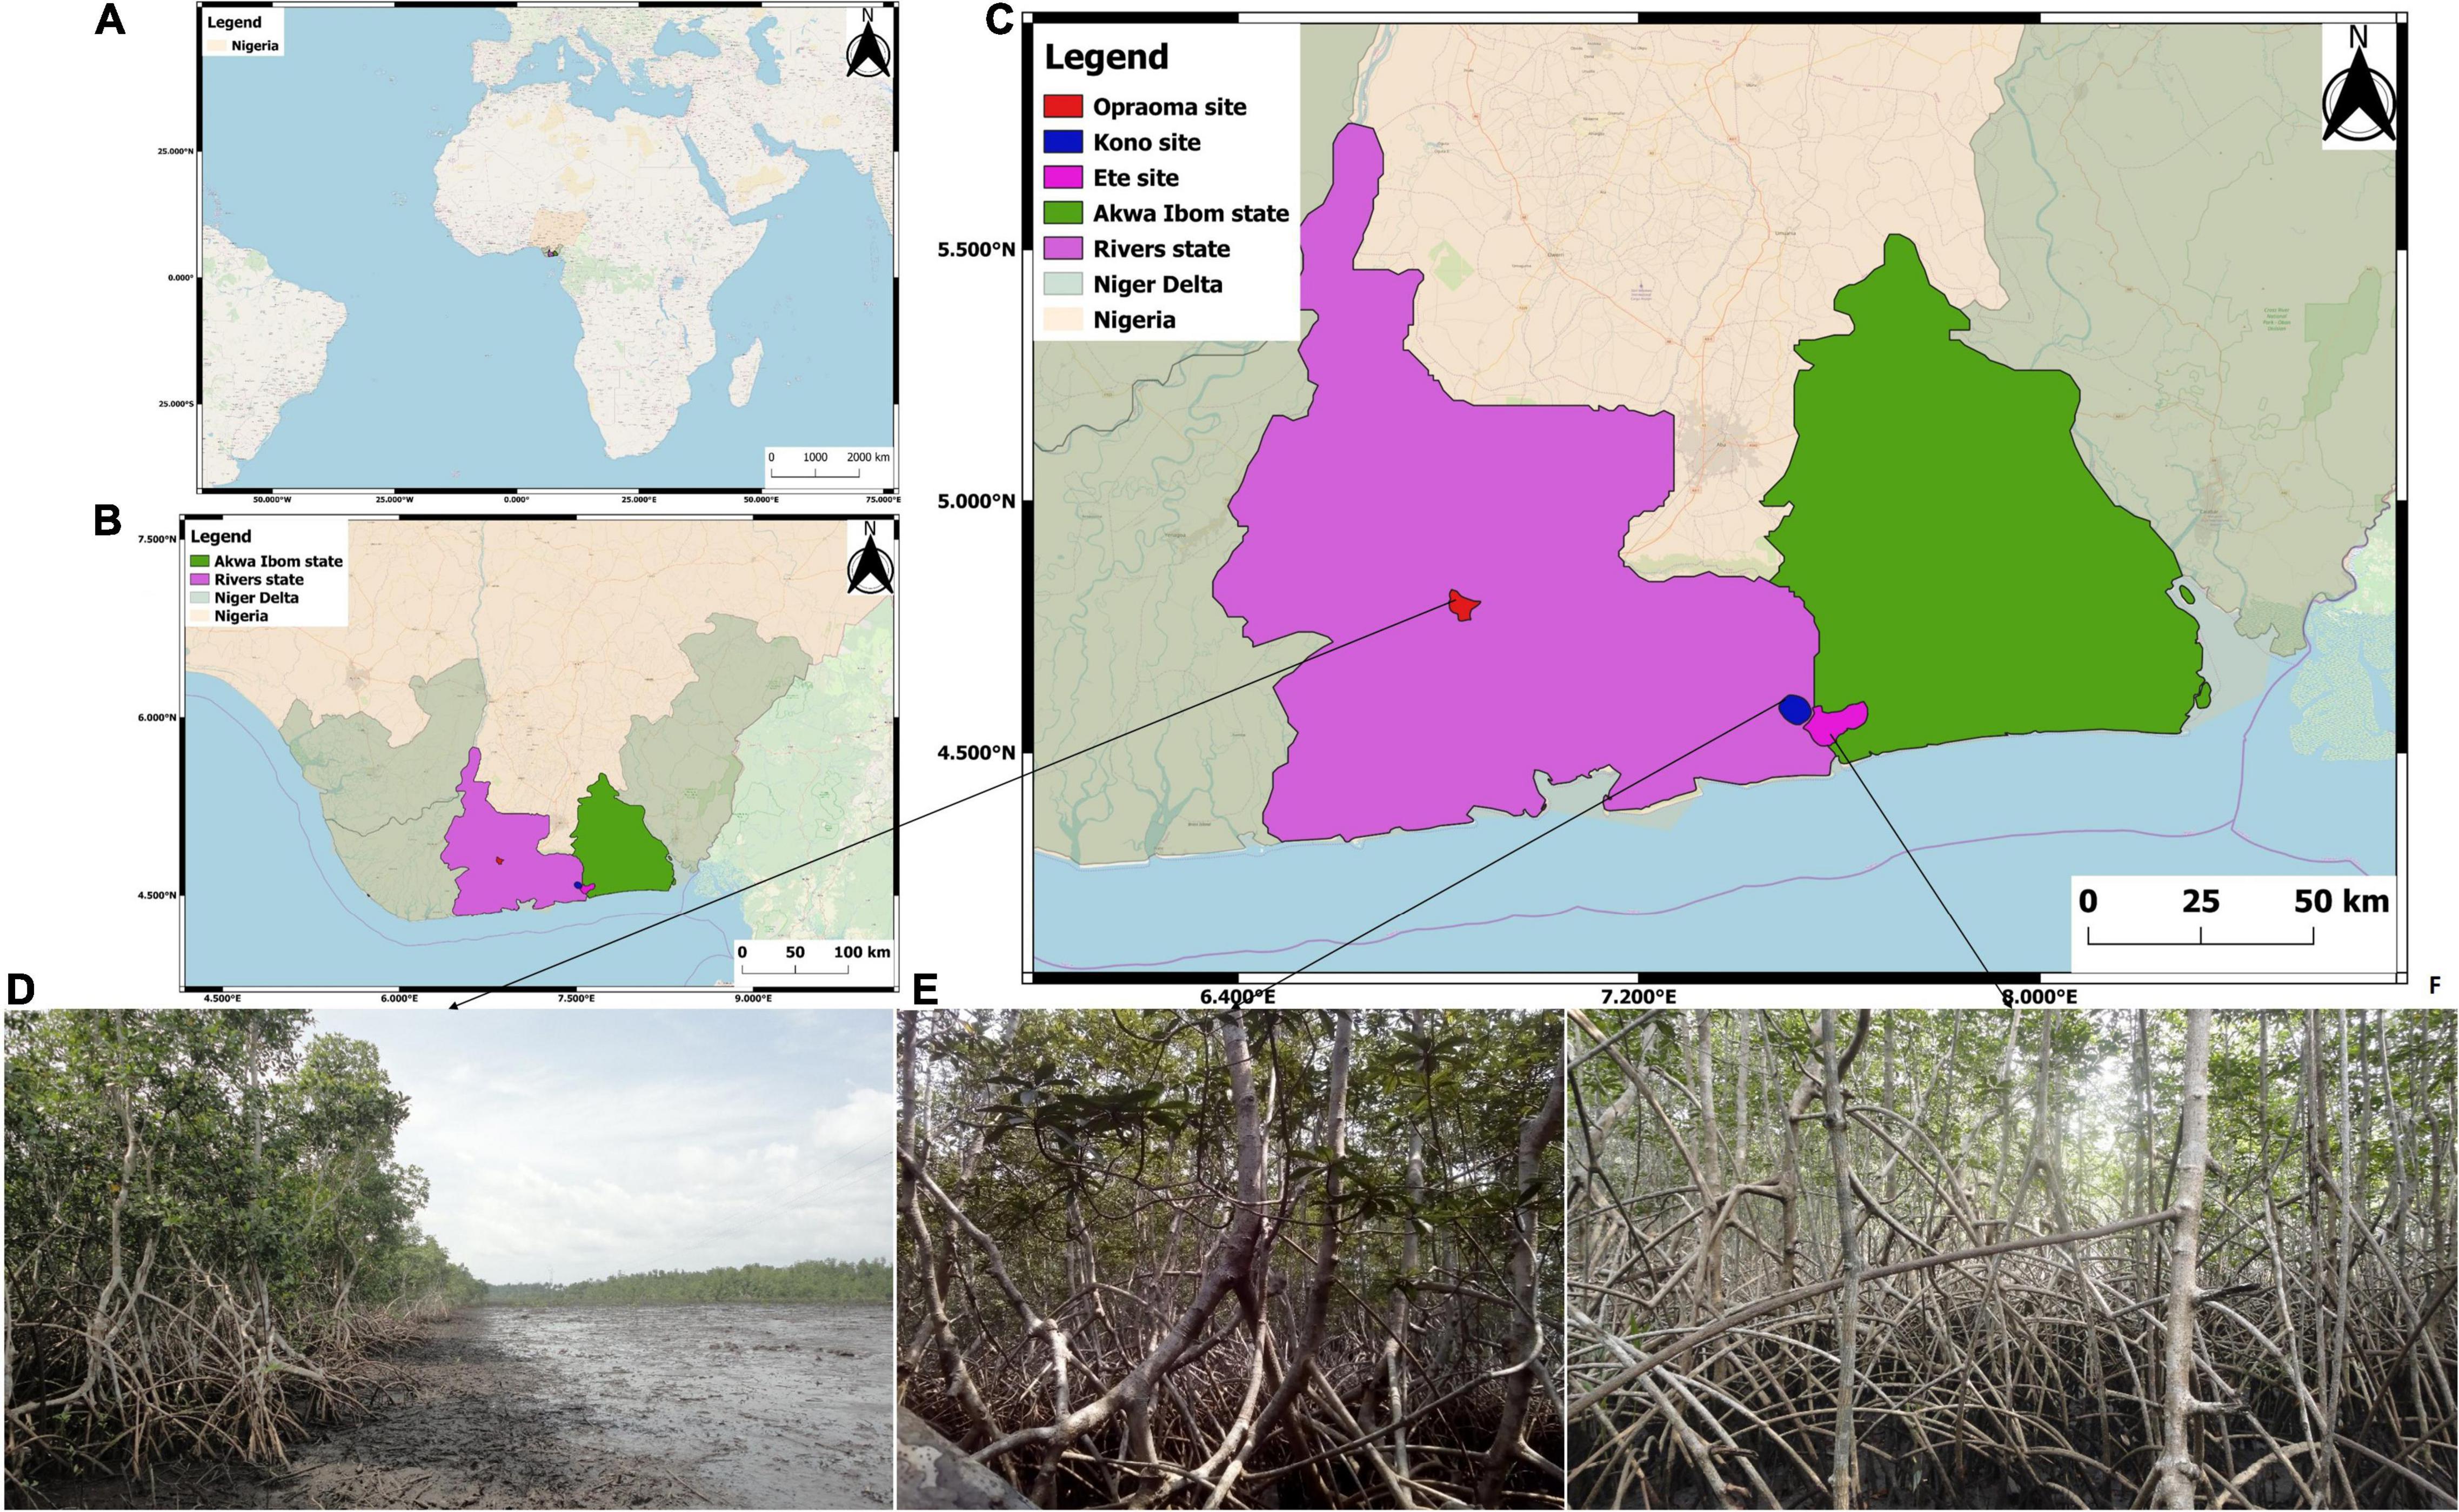
Figure 1. Location of the Nigeria in West Africa (A), the Niger Delta states (B), and field sites location (C). Oproama (D), Kono (E), and Ete (F).
Study Area
The study was carried out in two states of the Niger Delta—the Rivers and Akwa Ibom states (Figure 1B). We established three mangrove study sites within two estuarine basins: Imo River Estuary (IRE) and Sombreiro River Estuary (SRE). The common feature between all sites was their location in the Niger Delta. The site selection was based on mangrove extent, accessibility, security and management regime. Limited access to mangrove forests in the Niger Delta is the result of security issues ranging from kidnapping, oil bunkering and militancy (Aduloju and Okwechime, 2016). However, we used the global forest height map (Simard et al., 2011) to randomly select a wide range of mangrove biomass values within the selected sites. These three locations are Ete creek, Oproama community, and Kono creek (Figures 1C–F). These sites were selected to represent the wide range of mangrove community types and ecosystem disturbance regimes experienced by this deltaic region. Field plots were established where data collection was performed. There has been no report of mangrove structure, biomass, and disturbance within this region.
Ete creek is located in Ikot Abasi Local Government Area (LGA), Akwa Ibom State (Supplementary Figure 1). This creek runs from Ikot Akan and empties into the Imo river estuary (IRE) at Ikot Abasi. The major economic activity of this region is fishing. However, commercial fishing has resulted in a shift to lumbering (Supplementary Figure 1A). This shift in economic activity has caused a high incident of logging and wood exploitation. There are also two oil wells around the creek with the one occurrence an oil spill during fieldwork, which was evident from the presence oil film along the creek (Supplementary Figure 1B). Ete creek is fringed on either side with mangrove forests, which expands into rainforests or farmland. Despite having high logging activity, mangroves in Ete creek are as high as 15 m (Supplementary Figure 1C). The landward extent of mangrove forests along this creek is dependent on the economic activity of the locals inhabiting the region including primarily farming with minor activities of fishing and sand mining.
Oproama community is located in Asari Toru LGA, Rivers state (Supplementary Figure 2). This community is crisscrossed with creeks that discharge into the Sombreiro river estuary (SRE). The mangrove forests around this community is riverine type that gradually changes into a tropical forest (Supplementary Figure 2A). However, urban development is gradually reducing the landward extent of mangrove wetlands which results in complete or partial loss of forest stands (Supplementary Figure 2B). This is evident from forest clearance for power lines and road construction (Supplementary Figure 2C). The community believe that illegal cutting can result in annoying a deity which is common in the Niger Delta (James et al., 2013). The main economic activity within this region is fisheries and some lumbering in the closest rain forest.
Kono creek is located in the Khana LGA, Rivers state and it empties into the IRE (Supplementary Figure 3). There is a protected area along the creek established by the Centre for Environment, Human Rights and Development (CEHRD), where there are dense pristine mangrove forests (Supplementary Figure 3A). The communities along the creek protect mangrove forests from any foreign activities that does not involve fishing. However, poor management of the protected area resulted in nipa vegetation expansion. Thus, the creek is fringed with dense nipa vegetation which makes access to mangrove vegetation difficult (Supplementary Figure 3C). The main economic activities along this creek are fishing and farming (Supplementary Figures 3B,E).
Sampling Strategy
We set up plots to measure stem density, stem size, LAI, and AGB in each study site. Four transects were established in the Oproama community (O- field plot designation), Asari Toru Local Government Area (LGA) in Rivers state. Transects included three plots each, but the fourth transect included only two plots due to local community restrictions. This local community value mangrove forests, but there is an ongoing clearance for the development of roads and power lines. One transect with two plots was established in Kono community (K), Khana LGA, Rivers state; due to a high level of nipa invasion at the fringes which made mangrove access difficult. We established five transects in Ete (E) Kingdom of Ikot Abasi LGA in Akwa Ibom State; two transects with three plots and three transects with two plots each.
Transects established within each site were deployed based on mangrove extension from the tidal channel and variation in mangrove biomass, stand structure and local disturbance. Plots, each 0.25 ha (50 × 50 m), were established within each transect 10 m apart. One of the factors used to define the same size (50 × 50 m) for each plot was because of the use of plot AGB in establishing a relationship between radar sensors and AGB. Varying plot size would compromise the applicability in remote sensing analysis. The plot sizes were also chosen to maximize sampling time within very dense mangrove forests. The first plot within each transect was established 15 m from the tidal channel (Figure 2). Overall, we established twenty-five sample plots (SRE- n = 11, IRE- n = 14) from October 2016 to September 2017. During the field survey, we observed mono-generic plots of Rhizophora species, with very sparse Avicennia species or Laguncularia racemosa identified around the plots. We collected global positioning system (GPS) points of the field plots and closest settlement during the field survey using a Garmin eTrex 20x device. The distance of the field plots from distance from the ocean, tidal channel, and closest settlement was also measured. This distance was measured by collecting the GPS locations of the established plots and closest human settlements. The closest settlement was located through communication with the field assistant. We measured the distance between the field plots and settlement from the preferred transportation method (land or water) using Google Earth Pro 7.3.2.5776 (March, 2019). The distance between the field plots and the closest estuarine mouth to the ocean was measured using Google Earth Pro in the direction of tidal flow. We used the ruler tool in Google Earth Pro to trace a path between the settlement and the field plots, either through a road or through the water path. The ruler tool on Google Earth Pro automatically calculated the distance between the settlement and the field plots. We measured the distance to establish the spatial representation of mangrove productivity, population pressure and tidal influence.
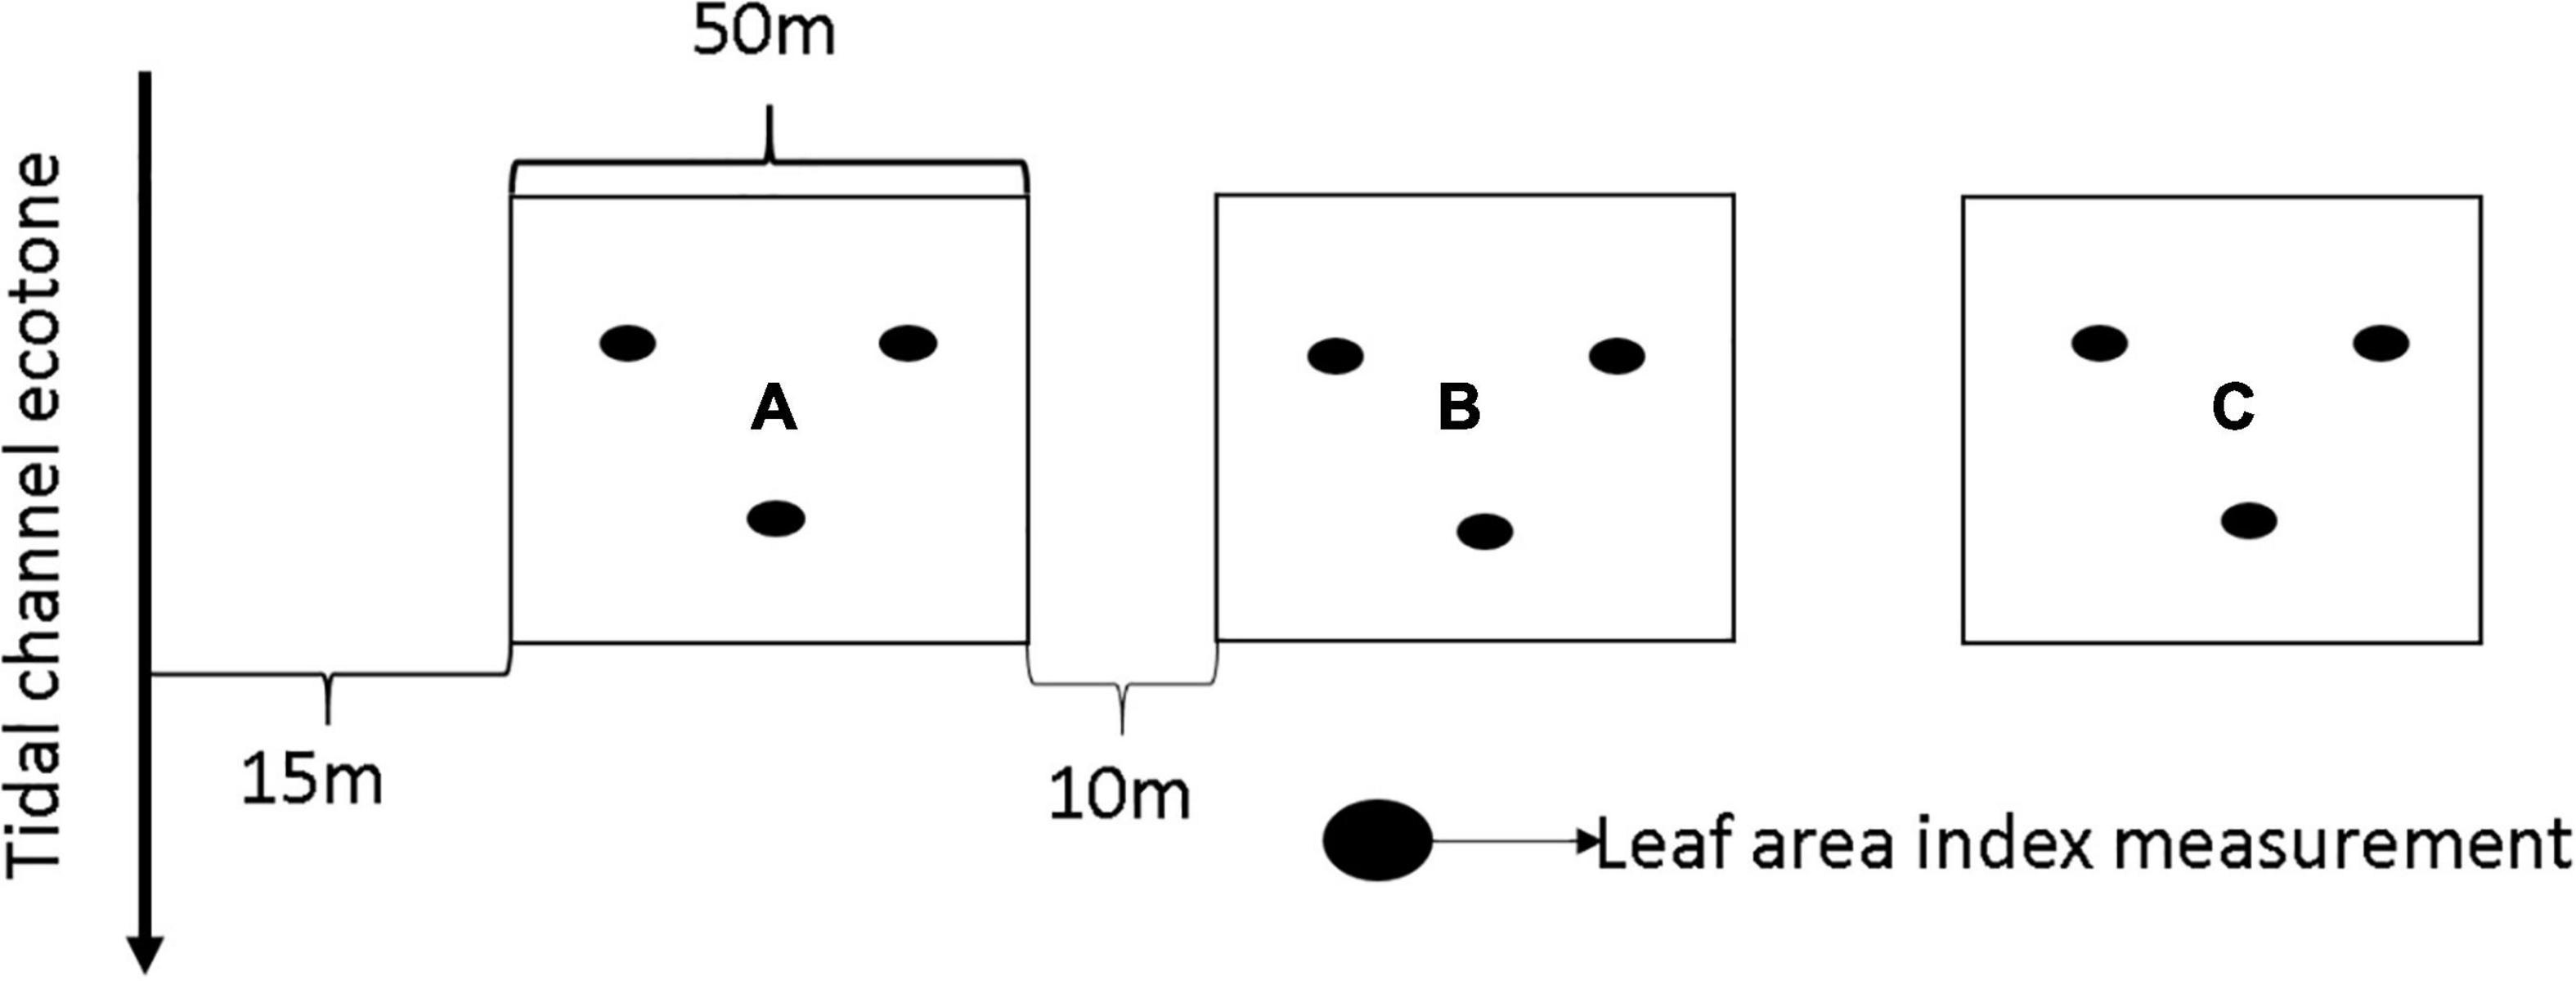
Figure 2. Schematic plot layout for mangrove forest sampling. Letters A–C represent plot distance from tidal channel in all plot identifiers (O, K, E). Letter A represents plot closest to the tidal channel. Plot identifier: O1B (O: location, 1: transect number, B: plot distance from tidal channel).
We classified the plots into disturbed and undisturbed regimes. We based the classification on visual evidence of disturbance (logging or clearance), mangrove undergrowth and presence of mangrove and nipa undergrowth within forest gaps caused by disturbance. Forest gaps were only considered if there was presence of wood exploitation from logging or clearance. Within each plot, individual nipa palm was counted and the ratio between nipa stand to mangrove stand estimated. Plots were classified into three invasion classes: no invasion (NI- 0%), moderate invasion (MI- 0–10%) and high invasion (HI- >10%) based on the ratio of nipa to mangrove stands within each plot. This division was used to check for the incident of mangrove cutting as a precursor for nipa invasion.
Forest Structure Measurements
We measured, and recorded all trees with a DBH >5 cm within the sampling plot because despite smaller trees can dominate stand composition, we defined a 5 cm minimum as mangrove trees (Food and Agriculture Organization, 1994; Scales and Friess, 2019). DBH was measured at 1.3 m height above the ground, and if the tree branched below 1.3 m, individual stems were measured and counted as one tree (Howard et al., 2014). However, there were unusual cases where we used modified DBH measurement due to the structural complexities of Rhizophora spp. (Dahdouh-Guebas and Koedam, 2006; Mahmood et al., 2016). The measured DBH was divided into four size classes: 5–10 cm, 10–15 cm, 15–20 cm and >20 cm; to account for the DBH range, stand density and stand size structure. Basal area (BA) was calculated by summing over all (n) trees per plot (Equation 1) using DBH in cm (DBH) as described by Cintron and Novelli (1984). BA was reported in meters per hectare (m2 ha–1).
Aboveground Biomass
We calculated aboveground biomass (AGB, Babove) using a common allometric model (Equation 2) for mangrove trees developed by Komiyama et al. (2005):
Where ρ = mean wood density of the three indigenous Rhizophora species R. racemosa = 0.9330 g cm–3, R. harrisonii = 0.86 g/cm3, R. mangle = 0.9064 g/cm3 (Wood Density database Website) and DBH is the diameter at breast height in cm (ICRAF, 2010). We used this equation due to the absence of site-specific allometric models. This was the preferred allometric equation over two other allometric equations developed in Cameroun (Ajonina, 2008) and an inventory data from the Niger Delta (Nwigbo et al., 2013). The general allometric equation used was developed from 104 trees of 10 mangrove species with DBH range 5–48.9 cm. The DBH range from this study ranged from 5 to 42 cm falling within the range of the stands used to generate the allometric equation. The inclusion of wood density in the general allometric equation could account for site variation in species. This inclusion is important in estimating the different parts of the tree biomass (Komiyama et al., 2005). The wood density used is similar to values reported by a local study in Nigeria (Adedeji et al., 2013).
We investigated how variations in AGB are related to differences in stand structure, disturbance regime and the distribution of stem sizes. We calculated the proportional contribution of each DBH size class to the total measured AGB within each plot and established the relation between AGB and LAI.
Leaf Area Index
Canopy cover and LAI were from hemispherical photographs taken at three points within each plot (Figure 2) using a Nikon D500 camera fitted with a Sigma EX DC HSM (4.5 mm; 1:2.8) circular fisheye lens and Jessop’s ultraviolet filter. In order to attain even sky illumination, fish eye photos were captured between 9 am and 3 pm at the peak of exposure and conditions of even skylight and cloud cover (Bequet et al., 2011); when conditions were not too sunny nor too dark. Adequate periods of canopy properties, i.e., dusk and dawn, were not possible as a result of accessibility to field plots. We also waited for minimal wind movement to obtain adequate shutter speed to freeze any foliage movement using small International Organization of Standardization (ISO) settings. We set the aperture at f-9, camera auto exposure so that shutter speed would automatically compensate for changes in ISO. We analyzed hemispherical photographs using the Gap Light Analyzer (GLA) imaging software used to extract forest canopy structure and gap light transmission indices (Frazer et al., 1999). Default threshold levels used in defining leaf and sky features during image analysis were adjusted manually in order to reduce the contribution of sunlight and cloud cover shades to canopy features.
Data Analyses
Linear regression models were used to establish the correlation between biomass (AGB) and canopy characteristics (LAI). Spearman’s correlation was used to test for the significant relationship among plot level stand parameters, AGB and canopy properties. We checked the relationship between stem density and AGB, AGB and distance from closest human settlement, distance from coast and AGB, LAI, and AGB. We also performed spearman’s correlation to test the relationship between nipa invasion and disturbance. We specifically checked the relationship between nipa stand population and distance from the sea, proportion of basal area removed and LAI variation, nipa stand population and relative contribution of different DBH classes to AGB. We carried out a one-way analysis of variance (ANOVA) to assess significant differences in stand, AGB and canopy properties amongst plots of broadly similar disturbance regimes, DBH size classes and nipa invasion. ANOVA was followed by a Tukey HSD post-ad hoc tests. Plot stem density, AGB and LAI were tested independently for differences among sites (Ete, Kono, and Oproama) and disturbance regimes (Undisturbed, Exploited) using a one-way ANOVA. Plot LAI variation, DBH size class 3 contribution to basal area and AGB were tested individually for differences among sites and disturbance regime using a two-way ANOVA. Number of nipa stands within each plot was tested for difference among sites and location using a one-way ANOVA. Plot LAI variation, proportion of basal area removed and DBH size class 3 contribution to basal area and AGB were tested individually for differences among level of nipa invasion (No invasion, Moderate Invasion and High Invasion) using a one-way ANOVA. Where data was not normal, it was log transformed before performing analysis of variance. All data analyses were performed using RStudio version 0.99.491 (R Core Team, 2020).
Results
Forest Inventory
We measured 5,729 mangrove stands (50–560 stand per plot) across 6.25 ha mangrove area. Mean stem density was 903 stems ha–1 and mean DBH was 9.9 cm (median = 9 cm). DBH distribution was skewed and unimodal, indicative of a reverse J-shaped DBH distribution (Supplementary Figure 4). The highest stem density (4,037 stems ha–1) was recorded in Ete (E3A) and the lowest in O1C (204 stems ha–1). The highest plot mean DBH (13.9 cm) was recorded in Kono (plot K1B) and the lowest (7.5 cm) in Ete (plot E4A). We recorded a mean plot basal area of 8.9 m2 ha–1 and a median of 6.34 m2 ha–1. The highest basal area (27.24 m2 ha–1) was recorded in Ete (E3A) and the lowest basal area (1.36 m2 ha–1) in Oproama (O1C) (Supplementary Table 1).
Total stem measurements were divided into stem size classes as follows: Class 1 (5–10 cm) n = 3,709, Class 2 (10–15 cm) n = 1,509, Class 3 (15–20 cm) n = 360 and Class 4 (>20 cm) n = 151. The lowest size classes accounted for a majority (65%) of the stem density (Table 1). However, the DBH size class 4 (>20 cm) make up 22% of the total AGB of the region. We also discovered that stem size 15–20 cm accounted for the lowest contribution (19%) to AGB in the study area, while the 10–15 cm strata accounted for the highest AGB contribution (32%).
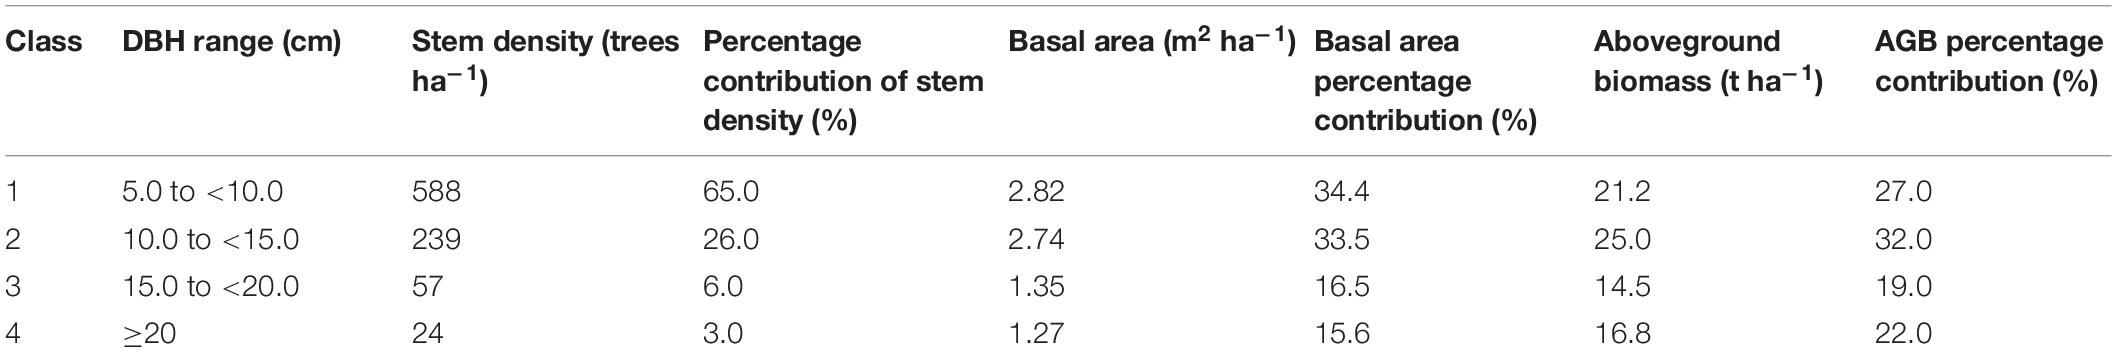
Table 1. Proportional contribution of different diameter at breast height (DBH) size classes to stem density, basal area and aboveground biomass (AGB) of the study region.
Aboveground Biomass
We estimated a mean plot AGB of 83.7 Mg ha–1 (±63) ranging from 11.1 to 241.2 Mg ha–1 (Supplementary Table 1). Plots with the highest biomass were found in the community protected site plots in Ete site, and Kono located close to the mouth of the Imo estuary. The lowest biomass was observed in the inland creek (Oproama) sites where shrub red mangroves (Rhizophora mangle) were dominant and urbanization actively taking place (Supplementary Table 1). The highest AGB (241 Mg ha–1) in the study was observed in the undisturbed plot in Ete (E3A) where mangroves wetlands were protected from logging. In contrast, the lowest AGB (11 Mg ha–1) was found in the disturbed plot in Oproama (O1C) community where a power line was constructed to bring electricity to the community. There was a significant difference between the two river estuaries (Sombreiro and Imo) of the study area following a one-way ANOVA. SRE had a significantly higher AGB compared to IRE (p < 0.001, mean difference = 69 Mg ha–1).
We observed that stem density had a significant positive correlation with AGB [p ≤ 0.00001, Spearman’s rho (rs) = 0.88], thus the higher the stem density, the higher the AGB in the plots. Results of the Spearman’s correlation indicated there was a significant positive relationship (p < 0.05, rs = 0.47) between AGB and distance from closest settlement. The farther the plots were from the settlement, the higher the AGB in the region. There was also a significant negative correlation between AGB and distance from the sea (p < 0.05, rs = −0.41) and tidal channel (p < 0.05, rs = −0.50).
Leaf Area Index
Leaf area index across the study ranged from 0.08 to 2.78, with a mean of 1.45. The highest plot mean LAI (2.41) was recorded in Ete (E1C), which is a heavily exploited site with nipa palm (Nypa fruticans) colonization. We recorded the lowest plot mean (0.42) in Oproama (O1C) another heavily exploited site with less dense vegetation. We observed a significant difference in LAI between the SRE and IRE. Post hoc comparisons using Tukey test indicated that IRE had a significantly higher mean LAI of 0.64 compared to SRE. We also analyzed the LAI measurements variance within each plot to determine the data spread. We found the highest variation (1.17) in E1A at Ete, a heavily exploited site, which can account for irregular canopy cover. We found the lowest variation (0.01) in the protected sites Kono. However, there was no significant difference in LAI variance between the two river estuaries.
There was a significant positive correlation between LAI and AGB (p < 0.01, rs = 0.62), stem density (p < 0.001, rs = 0.63) and basal area (p < 0.01, rs = 0.60) at plot scale (n = 25). Linear regression models, performed on 60% of plot data, indicated that 31% of LAI accounted for plot AGB (R2 = 0.31, p < 0.001) (Figure 3). The root mean square error (RMSE) was 59 Mg ha–1 from the calibration data while independent validation had an RMSE of 48 Mg ha–1.
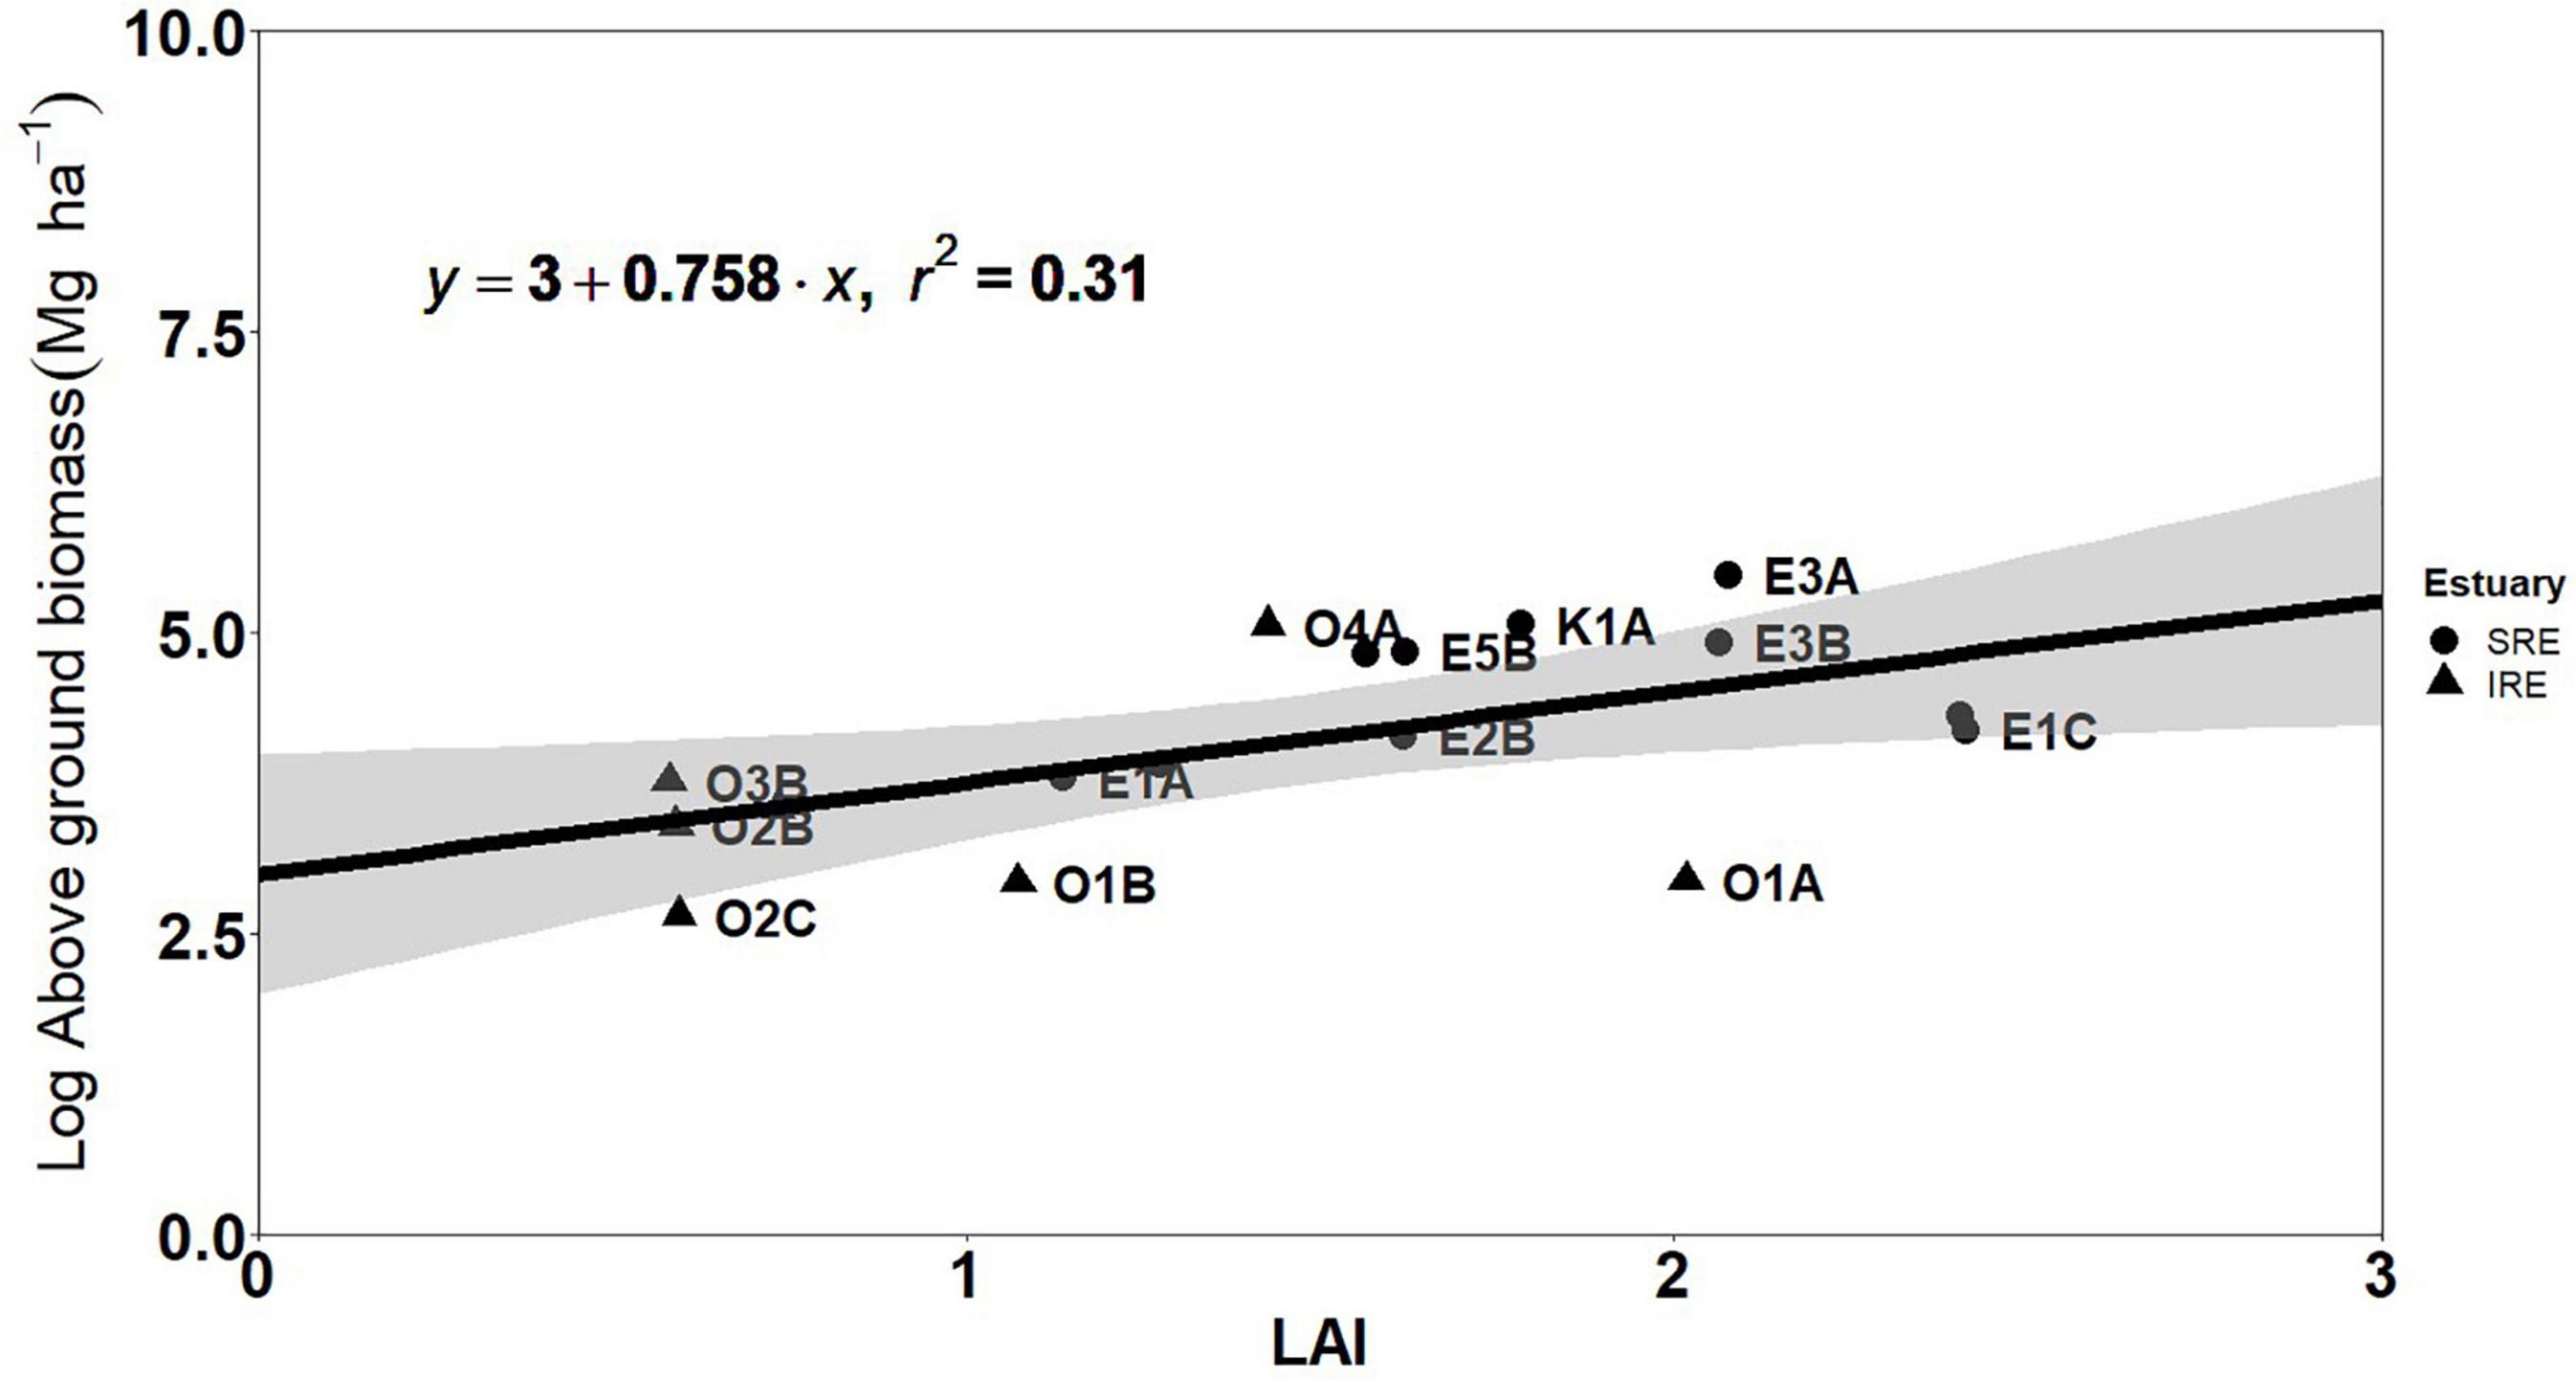
Figure 3. Fitted linear regression of plot of leaf area index (LAI) and aboveground biomass (AGB). Each point represents the plot during the field survey.
Disturbance Regime
The process of classifying plots into different disturbance regimes is complicated as various factors could contribute to the measured and observed criteria for characterization. For example, the presence of nipa was only prominent in the seaward IRE (Kono and Ete). The second complication is the mode of exploitation of different plots depending on location. Mode of exploitation ranged from logging for fuelwood (IRE: Ete), total clearance for construction activities (SRE: Oproama) and passage for boat transport (all locations). Disturbed plots in the Ete site were primarily affected by stem cutting for fuel, which is the primary source of income in the region. The nipa palm is now gradually invading these plots (Supplementary Figure 5A). We surveyed fourteen (14) disturbed and eleven (11) undisturbed plots (Supplementary Table 1). The resulting exploited plots in Oproama site was primarily due to a historical disturbance. About 6 ha of mangrove forest was cleared in 2013 to create a path for the construction of power lines (Supplementary Figure 5B). The high level of shell fishing was also evident in these plots where mangrove was cleared in order to make more waterways to the mangrove interiors, hence reducing travel time to fishing site. The plots in Kono are located adjacent to a protected mangrove site but there was presence of nipa along the fringes of mangrove forests (Supplementary Figure 3E). The locals culturally protect the Kono plots by manually removing nipa seedlings from the mangrove forest floor. We observed numerous nipa seedlings on the forest floor of this site (Supplementary Figure 5C).
Disturbance Regime, Aboveground Biomass, and Leaf Area Index
We observed significant difference in plot structural characteristics between disturbance regimes using a one-way ANOVA. Undisturbed plots had a significantly higher AGB (p < 0.0001) and LAI (p < 0.01) than disturbed plots. There was no significant difference in LAI variation between the disturbance regimes. A two way ANOVA was carried out on plot AGB and LAI variation independently by disturbance and river estuary. There was no significant interaction between the effects of disturbance regime and estuary on AGB and LAI variance.
Disturbance Regime and Stand Structure
We observed significantly different plot stem density amongst disturbance regime using a one way ANOVA. Tukey’s HSD post hoc tests indicated that disturbed plots had significantly lower stem density than undisturbed plots (mean difference = 1,158 stem ha–1, p < 0.001). A one way ANOVA was conducted to check the significant contribution of DBH size classes contribution to plot density, basal area and AGB among disturbance regime. There was significantly higher contribution of DBH size class 15–20 cm to plot density [F(1, 23) = 2.428, p < 0.05, mean difference = 6%], basal area [F(1, 23) = 1.426, p < 0.05, mean difference = 8%] and AGB [F(1, 23) = 365.3, p < 0.05, mean difference = 8%] in undisturbed plots compared to disturbed plots. There was significantly higher contribution of DBH size class 10–15 cm to basal area [F(1, 23) = 312.5, p < 0.05, mean difference = 7%] in disturbed plots compared to undisturbed plots. In the undisturbed regime, the highest DBH size class (>20 cm) made up about 3% of the mean plot stem density, but contributed 24% of the AGB. The percentage contribution of each DBH size class to the AGB in the undisturbed regime were more evenly distributed (20–30%) compared to the HE and ME regimes, where the lowest two DBH size classes 5–10 cm and 10–15 cm made up about 70% of the AGB (Figure 4 and Table 2).
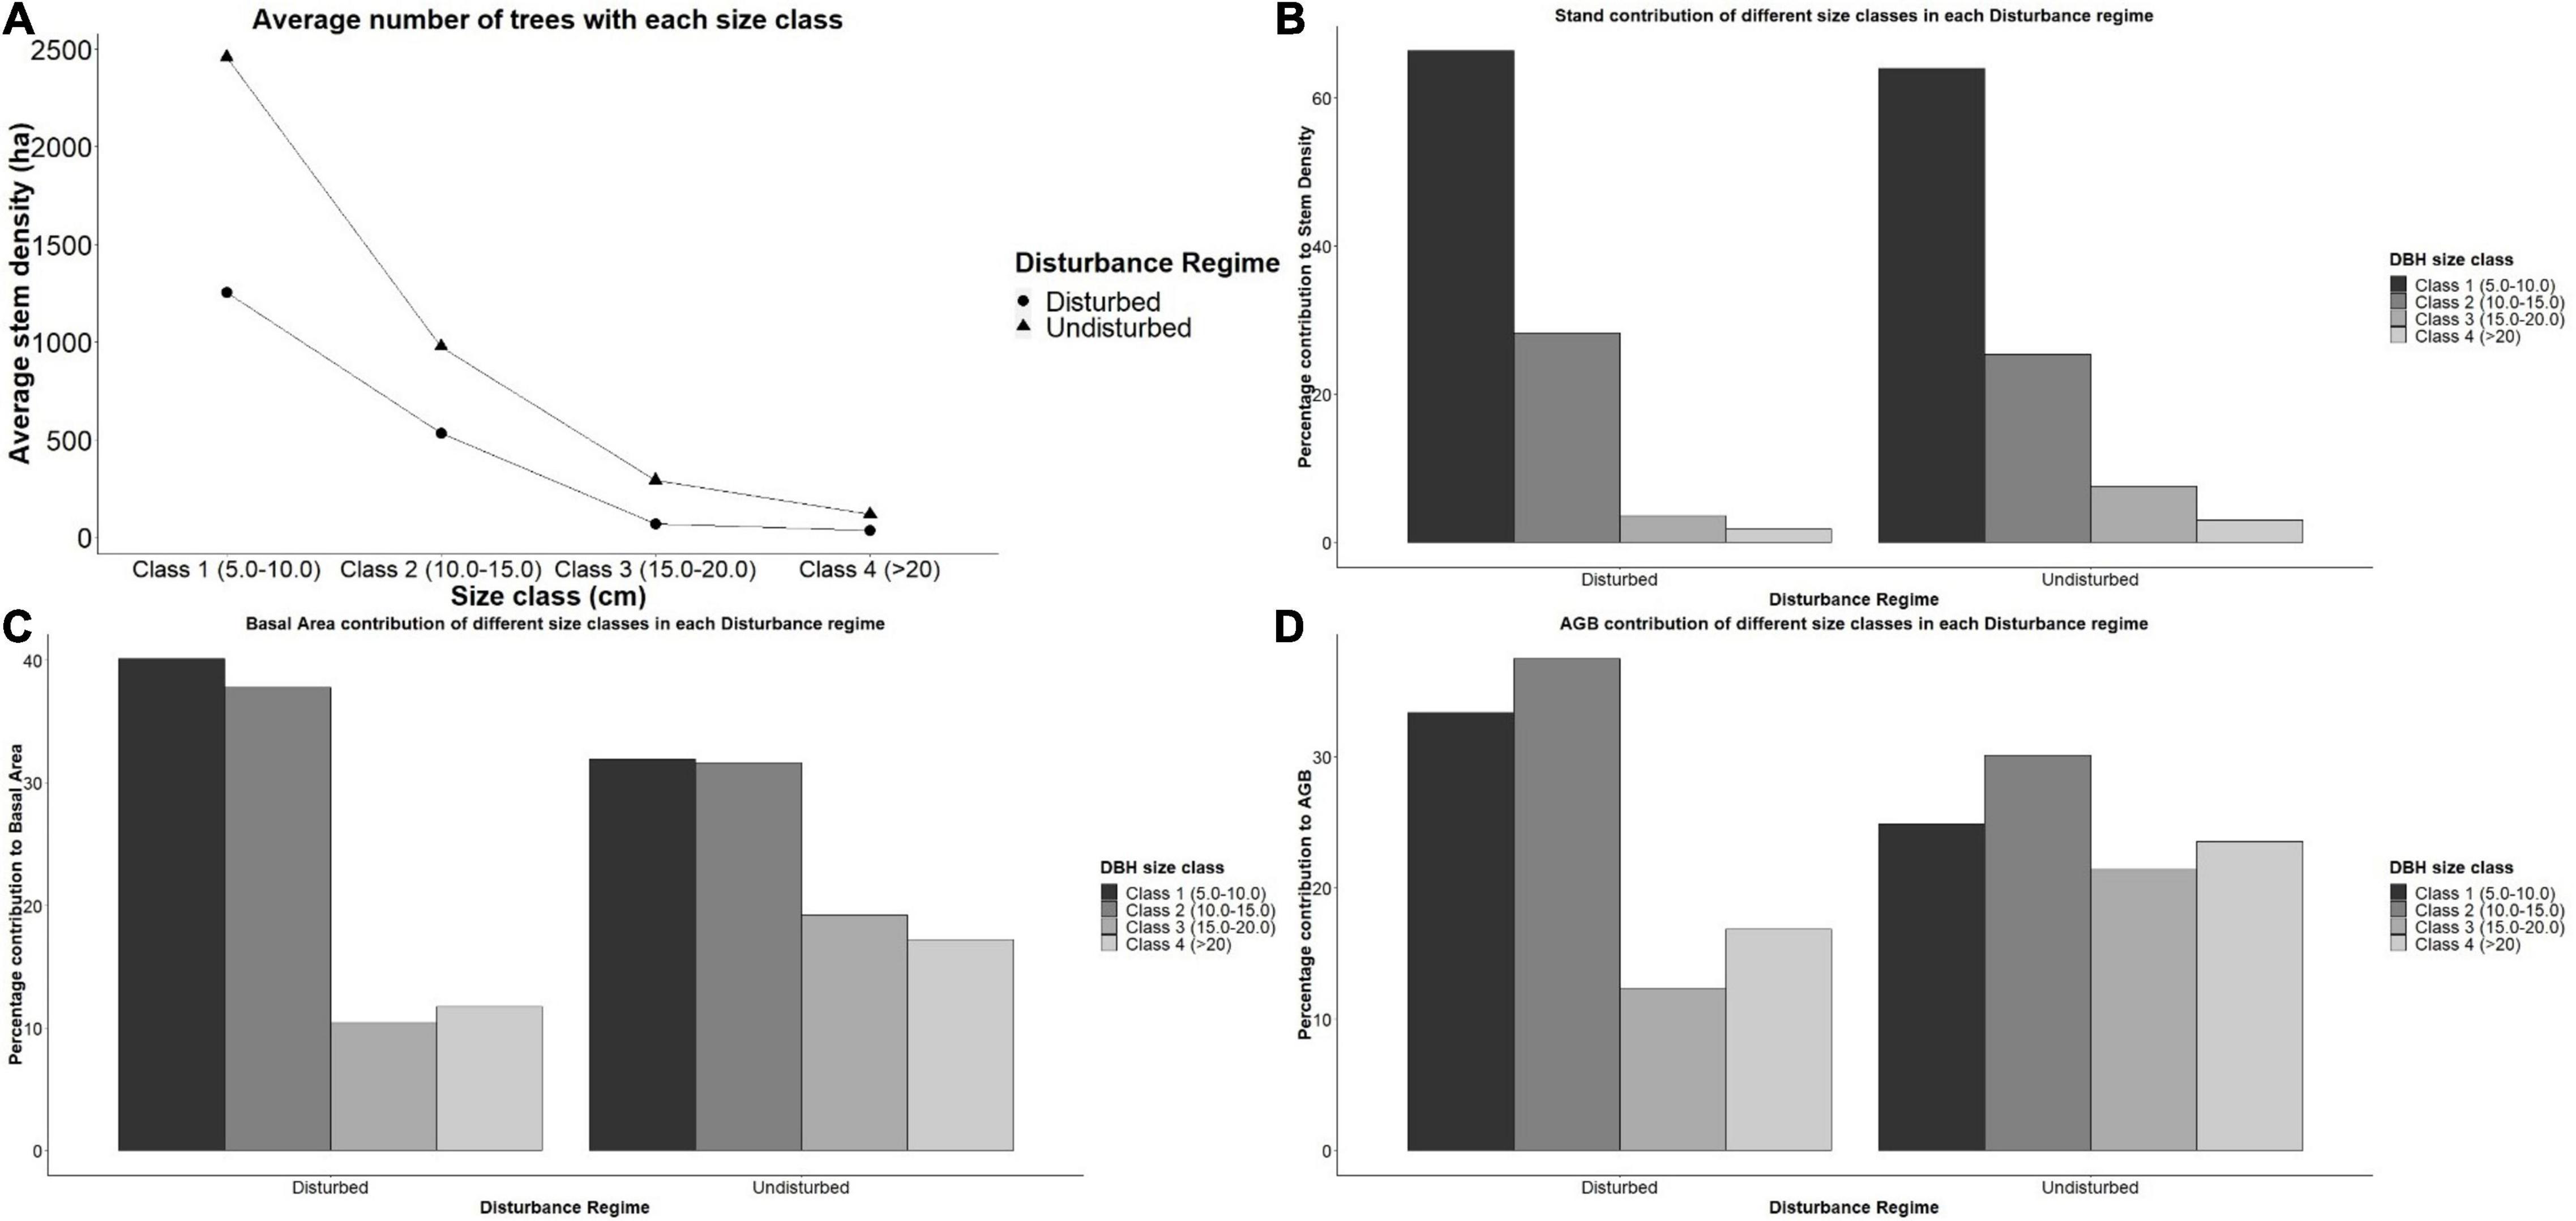
Figure 4. Percentage contribution of size classes to within plots of the same disturbance group. (A) Average number of trees with each size class. (B) Stand contribution of different size classes in each Disturbance regime. (C) Basal Area contribution of different size classes in each Disturbance regime. (D) AGB contribution of different size classes in each Disturbance regime.
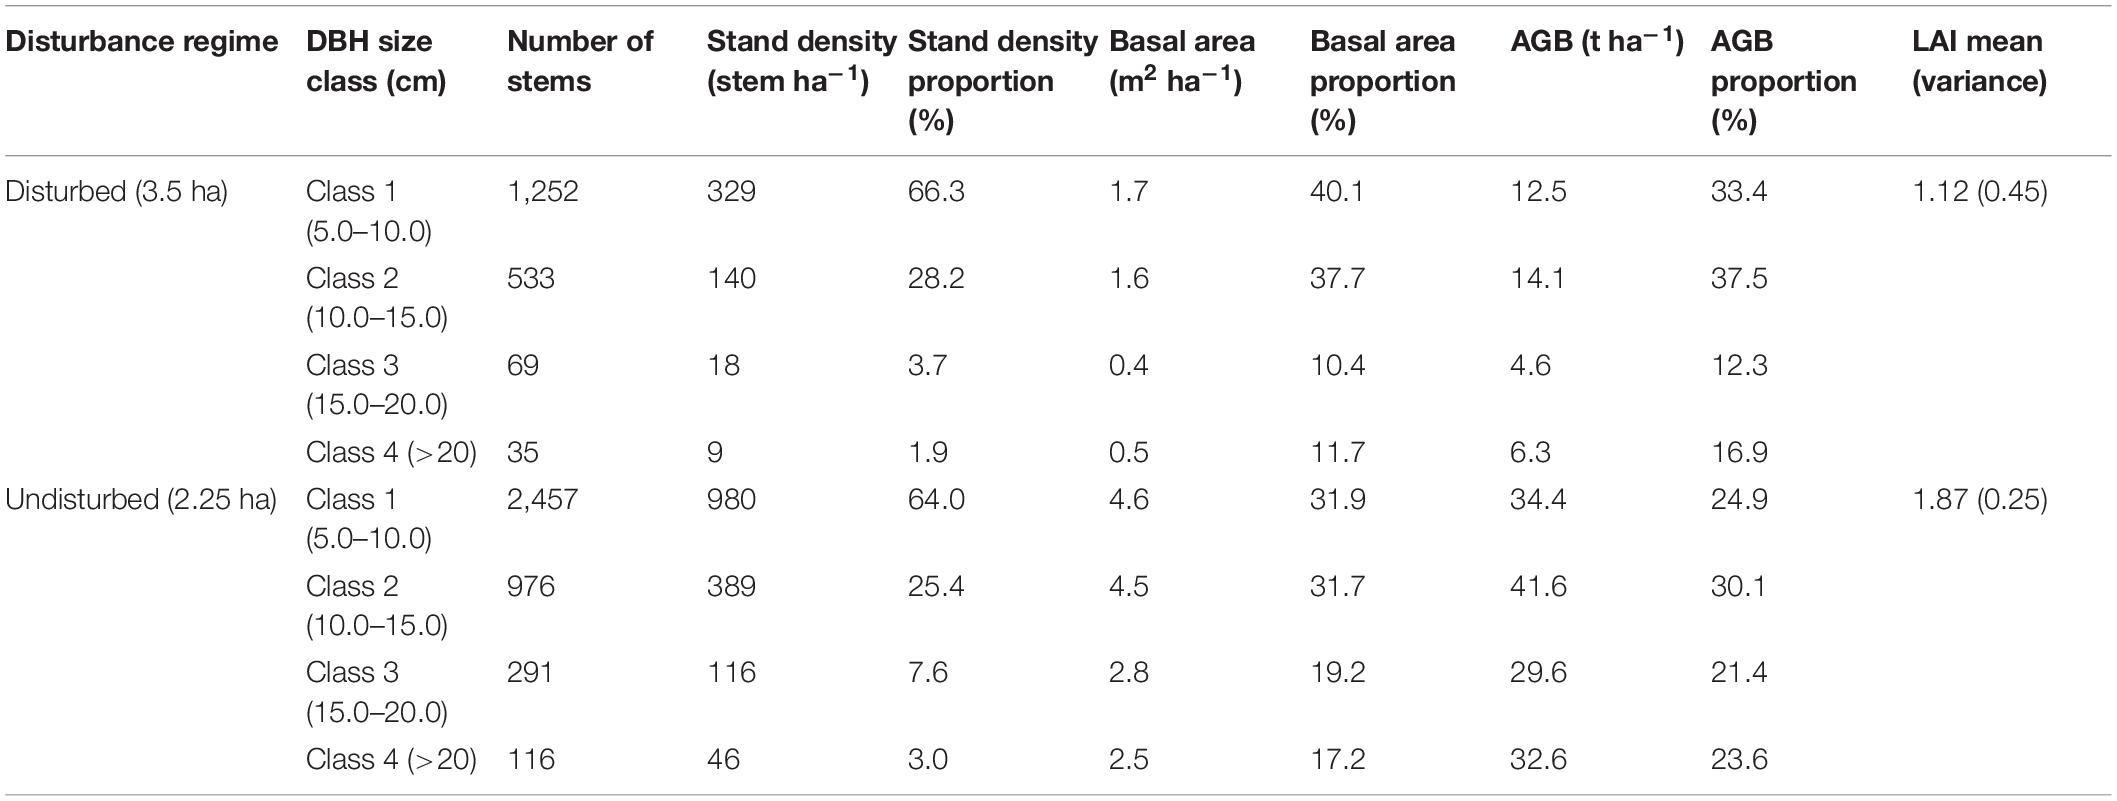
Table 2. Proportion of diameter at breast height (DBH) size classes contributing to stand density, basal area, and aboveground biomass (AGB) in different disturbance regime.
Nipa Stand Patterns
We recorded 179 (0–33) nipa palm stands during the survey (Supplementary Table 1). We observed no nipa palm colonization in the inland Oproama plots (SRE) but recorded nipa palm invasion in seaward Ete and Kono (IRE). The absence of nipa palm in SRE is because it is further inland from the point of introduction. We recorded five plots with high nipa invasion (HI), seven plots with moderate invasion (MI) and two plots with no nipa (NI) stand during the field study in IRE (Supplementary Table 1). We excluded plots in SRE from further analysis because there was no sign of nipa invasion. Analysis of nipa population in IRE showed significant negative correlation with mangrove basal area (p < 0.01; rs = −0.74), AGB (p < 0.01; rs = −0.77), stem density (p < 0.05; rs = −0.57). There was no correlation with LAI. However, nipa population had a significant positive correlation with plot LAI variation (p < 0.05; rs = 0.71) and proportion of basal removed (p < 0.05; rs = 0.73). Nipa stand density showed a negative correlation to the contribution of DBH size class 2 (10–15 cm) to basal area (p < 0.05; rs = −0.45) and AGB (p < 0.05; rs = −0.45). There was significantly higher nipa stands in disturbed plots than undisturbed plots following a one-way ANOVA (p < 0.001). We also performed one way ANOVA of LAI variance and proportion of basal area removed individually amongst the level of nipa invasion. No invasion plots showed significantly lower LAI variation to MI (p < 0.05, mean difference = 0.6) and HI plots (p < 0.01, mean difference = 0.8). Heavily invaded plots also showed significantly higher proportion of BA removed to MI (p < 0.01, mean difference = 40%) and NI (p < 0.01, mean difference = 60%) plots.
Discussion
We performed the most comprehensive mangrove stem, biomass and canopy structure survey in Nigeria, the largest mangrove forest in Africa. We showed a general pattern of AGB across gradients from sea, tidal channel and closest settlement. We also showed the degree of disturbance (wood exploitation and clearance for development) affecting AGB in the region. We also addressed the subtle effect of local disturbance on stem size distribution, the possible target size class by locals and the resultant invasion of nipa palm (Nypa fruticans) in mangrove forests of the Niger Delta. We provided evidence of the relationship between mangrove clearing and the invasion of nipa palm. This is the first report in West Africa to give evidence of the relationship between stand structure and invasive species colonization in mangrove forests.
Aboveground Biomass and Leaf Area Index Patterns in the Niger Delta
Forest productivity has a direct influence from nutrient availability and external influence by anthropogenic disturbance (Alongi, 2009). Here, we report the relationship between AGB and tidal influence of mangrove forests in the Niger Delta. We observed that higher AGB and BA were located in plots with closer proximity to the ocean and tidal channel. This could be because of the influence of nutrient mixing effect of tide on mangrove forests (Harris et al., 2010; Carugati et al., 2018). Castaneda (2010) reported that mangrove productivity in South Florida mangrove forests may be limited by phosphorus fertility which showed a negative gradient with distance from the ocean. He also gave evidence that tidal inundation duration and frequency influences the fertility of mangrove soils, hence productivity (Castañeda-Moya et al., 2013). Although there has been no reports of mangrove AGB and salinity in the region, Ukpong (1991) reported that Rhizophora racemosa (salinity range: 1.7–5.9%) was more adapted to saline conditions than R. mangle (salinity range: 1.4–4.4%). The significant difference in mangrove forest structure and biomass across the tidal gradient during this study may be linked to this influence. Soil nutrient and salinity variation explained the main relationship between mangrove vegetation and soil in the western Niger Delta (Ukpong, 1994). Sherman et al. (2003) reported a trend in AGB across tidal gradient being a function of salinity stress. However, like our study, he showed that more inland mangrove forests had lower stands compared to the seaward forests. Further affecting the biomass pattern of mangrove forests in the Niger Delta could be the proximity to settlements, which may alter the productivity of mangrove forests through anthropogenic disturbance and nutrient pollution (Lewis et al., 2011; Maiti and Chowdhury, 2013; Scales and Friess, 2019). Mangrove productivity patterns can be altered by pollution in the Niger Delta, evident from increased litter fall (Numbere and Camilo, 2018). Although, some studies have reported that seaward distance has more effect on soil organic carbon (SOC) than AGB (de Jong Cleyndert et al., 2020). Tidal flooding which maybe as a result of heavy rainfall may contribute to the phosphorus balance of mangrove forests (Chen and Twilley, 1999). Our study showed that AGB were lower at plots closer to settlements, which could be as a result of either nutrient modification, pollution, or a consequence of perturbation through logging and fishing.
Our field measurements of LAI (0.08–2.78) are within range of LAI measured by hemispherical photograph (Wong and Fung, 2013; Prananda et al., 2020). The recorded LAI in this study are also lower compared to alternative field LAI measuring methods such as Plant Canopy Analyzer (Clough et al., 1997; Kamal et al., 2016). Our low records of LAI (<3) could be because of the stage of the mangrove forests, disturbance and methodology. We employed the indirect method for estimating LAI in this study using hemispherical photography, which has been seldom employed in the estimation of LAI in mangrove forests. This method has been known to underestimate LAI and could explain the high difference in LAI from comparative studies using direct methods (Ishil and Tateda, 2004). Hence, multiple measuring techniques should be used in comparison for mangrove canopy structure. Low recorded LAI in our study could also be a representation of the state of the mangrove forests in the Niger Delta. A study by Pool (1973), showed that mangrove forests in early succession have reduced LAI while higher LAI can be characteristic of later succession, especially in mixed stands (Pool, 1973). This was evident in this study where we recorded the lowest LAI in a site that was cleared in 2013 (Oproama) for a power line construction. This low LAI in some of the plots could be as a result of the sites being in early succession as a result of a previous disturbance (Pool, 1973). Another reason for the low values of LAI in this study could be the monospecific Rhizophora nature of the sample plots. Clough et al. (1997) characterized Rhizophora spp. as canopy shy (shade intolerant) because of the numerous light gaps between trees, which could increase the area of light penetration within plots. Higher LAI have also been recorded heterogeneous forests compared to homogeneous forests in Australia (Kamal et al., 2016). The relationship between LAI and the state of mangrove forests creates an opportunity to map mangrove productivity in Niger Delta from a relationship between LAI and vegetative indices of earth observation satellites (Kovacs et al., 2009; Manna and Raychaudhuri, 2020). Monitoring landscape productivity is a vital means of assessing rate of deforestation in mangrove forests. LAI is a proxy for primary production through its relation to photosynthetic capacity of the canopy (Pool, 1973; Araujo et al., 1997; Williams et al., 1997). We showed a significant positive correlation (rs = 0.63) and a regression equation (R2 = 0.39) between LAI and AGB indicating the potential for LAI to be used as a proxy for mangrove productivity in the Niger Delta.
Local Disturbance Effect on Biomass, Stand Structure, and Canopy Properties
Stand structure in a forest landscape provides a means to monitor the effects of disturbances on forests ecosystems. Natural sources of perturbation such as hurricane and anthropogenic sources such as wood harvesting can modify the stand structure of the ecosystem thereby affecting the productivity of mangrove forests (Wan Norilani et al., 2014). The DBH size class in our study showed a reverse J-shaped distribution, which has been reported by other mangrove stand reports (Kuei-Chu, 2008; Nguyen et al., 2020). Nguyen et al. (2020) reported this reverse J-shaped distribution in erosion sites, while Kuei-Chu (2008) gave this as an evidence of regeneration. Despite showing this reverse J-shaped distribution, indicative of disturbance or regeneration, our study excluded DBH <5 cm. Hence, we could not make further inference of this distribution. Further study can include DBH <5 cm and include evidence of regeneration in plots. We observed that DBH size class contribution to AGB had a significant difference between disturbance regimes with disturbed plots having an uneven contribution to AGB. Wan Norilani et al. (2014) reported that there was a uniform distribution of stem size classes in a naturally disturbed area compared with a harvested region at Kisap Forest Reserve, Malaysia (Wan Norilani et al., 2014). This uniformity was also reflected in this research where the contribution of each stem size class to the AGB in undisturbed plots was more even (20–30%) than exploited plots, where the lowest two classes (5–10 cm and 10–15 cm) made up about 70% of the AGB. Symmetrically distributed diameter of mangrove stands have also been observed in Malaysia (Jusoh and Aziz, 2014). Wah et al. (2011) reported that disturbed mangrove stands in Semporna, Malaysia had lower DBH range (10–20 cm) and less dense stands compared to undisturbed plots (20–35 cm). Natural disturbance can alter stand structure of mangrove forests (Castañeda-Moya et al., 2010; Biswas et al., 2012; Cox et al., 2016), however, our results have shown that anthropogenic disturbance from wood extraction for fuel wood and development can also alter the stand properties of mangrove forests in the Niger Delta.
The stem size class 3 (15–20 cm) had the lowest contribution to AGB in all disturbance groups. This has an implication on the target stem size for harvest. This stem size class is the target tree size within the region. Scales and Friess (2019) also indicated a preferential selection of DBH >10 cm of Rhizophora mucronata trees in the Bay of Assassins, Madagascar. The target tree size is the most convenient tree size to harvest in order to maximize the effort of loggers by reducing the cost of logging and transportation in order to increase profit. Another possible reason for the targeted DBH size class is the location of the larger stem size class close to the tidal channel would have resulted in harvested wood falling into the creek. The implication of selectively harvesting mangrove stand is the resulting shift in forest stand structure (Scales and Friess, 2019). Walters (2005a) also reported the species and size selectivity of mangrove stands based on its utilization. He reported that Rhizophora spp. was primarily cut for local use in fishing and fuel wood due to its slow decay property. Selective cutting practices could also be used to conserve older trees which contribute to larger carbon pools (Rasquinha and Mishra, 2020). The effect of target harvesting of mangrove stands results in the change in stand structure and light gap creation within mangrove stands (Clarke and Kerrigan, 2000; Duke, 2001; Amir and Duke, 2009; Mohamed et al., 2009).
The incidence of cutting mangroves in the Niger Delta could be because of a shift in economy. There was a historical reason for the cutting of mangroves as a source of income due to a shift from fishing primarily because of bad fishing practice, including chemical harvesting and use of small mesh sizes (Personal Communication, 2017). The use of Gamallin-20 (a paralyzing fish chemical) and small net mesh sizes resulted in depleting fish stock in the region (Olaoye and Ojebiyi, 2018). This shift in economy and the dependence of local communities on mangrove stands for fuel wood puts a further pressure on the mangrove forests in the Niger Delta. A similar dependence on mangrove stands by local communities in Southern Cameroun also caused damage to mangrove stands and environmental changes in mangrove forests (Nfotabong-Atheull et al., 2011). Mangrove stem is one of the major sources of income in local communities in the Niger Delta, who also use it for fuel wood. Wood harvesting practices can be employed to create sustainable management of mangrove forest resources.
The change in stand structure of mangrove forests as a result of wood exploitation also has an effect on canopy properties, hence, modifying LAI (Araujo et al., 1997). Anthropogenic disturbance within the study region resulted in LAI variation where exploited plots had a higher variation in LAI than undisturbed plots. Light gaps in mangrove forests are naturally created from dead mangrove trunks caused by hurricane, lightening and diseases (Amir and Duke, 2009), but these can also be created by small-scale disturbance through wood extraction or clearance (Duke, 2001). Irregular harvesting, as seen in exploited plots in the study resulted in open gaps within these plots. These light gaps have an implication on regeneration and recruitment of mangrove trees (Duke, 2001; Mohamed et al., 2009). We observed regeneration in some of these plots within forest gaps in disturbed plots during field surveys. However, due to the invasion of nipa palm, the regeneration of mangrove stands in light gaps within the study region is hindered. We observed young mangrove and nipa stands growing in forest gaps, competing for forest resources. This is a common feature along the Imo estuary (Ete and Kono plots). However, nipa palm always outcompetes Rhizophora spp. (Numbere, 2019). The effect of selective harvesting can have a negative influence in the natural growth of a mangrove forest especially the presence of an invasive species to colonize available cleared mangrove area in the Niger Delta.
Pattern of Nipa Palm Invasion
There is a growing interest of invasion ecology globally due to its influence on ecosystem function and economic impacts (Secretariat of the Convention on Biologival Diversity, 2010). Ukpong (2015) has reported on Nypa fruticans zonation and soil conditions in Niger Delta mangrove forests. We reported here a possible cause of nipa palm (Nypa fruticans) colonization in Niger Delta mangrove forest. Reports have shown the close link between mangrove deforestation and non-native species colonization (Harun Rashid et al., 2009). Harun Rashid et al. (2009) gave evidence that the colonization of non-native invasive species in Bangladesh can be as a result of forest gaps formed from catastrophic events affecting mangrove forests (Harun Rashid et al., 2009). We reported a similar trend in this study where higher LAI variance and proportion of BA removed were significantly higher in plots classified as high nipa invasion (HI) compared to moderate (MI) and no invaded plots (NI). This relationship is an indication that nipa seedlings slowly colonize light gaps within disturbed mangrove forests. Ukpong (2015) also argued that the slow development process of red mangrove (Rhizophora spp.) regeneration and its inability to regenerate after being cut also aids in nipa outcompeting these natural species. The poor ability of Rhizophora spp. to regenerate from cut stem or from the root has been reported from various studies (Hamilton and Snedaker, 1984; Food and Agriculture Organization, 1994; Walters, 2005a,b). Hamilton and Snedaker (1984) reported that Rhizophora mangle cannot regenerate when cut from the roots, stump, and trunk but could grow back from loss of foliage of about 50% and cut branches more than 2 cm diameter. Numbere (2019) also gave evidence that nipa palm had a competitive advantage to mangrove based on soil properties, hence, further research can investigate the relationship among nipa invasion, mangrove recruitment and soil properties. A case can also be made for the inclusion of nipa palm in biomass estimates of mangrove forests in coastal Nigeria.
Data Availability Statement
The original contributions presented in the study are included in the article/Supplementary Material, further inquiries can be directed to the corresponding author.
Author Contributions
CN conceived the research and carried out the field measurements and statistical analyses. CN and MW designed the work, contributed to interpretation of results, and wrote the manuscript. Both authors contributed to the article and approved the submitted version.
Funding
This work received funding from the Presidential Scholarship Scheme for Innovation and Development (PRESSID); the Global Change Ecology Lab, School of GeoSciences, University of Edinburgh; the Elizabeth Sinclair Irvine Bequest and Centenary Agroforestry 89 Fund; and the National Environment Research Council.
Conflict of Interest
The authors declare that the research was conducted in the absence of any commercial or financial relationships that could be construed as a potential conflict of interest.
Publisher’s Note
All claims expressed in this article are solely those of the authors and do not necessarily represent those of their affiliated organizations, or those of the publisher, the editors and the reviewers. Any product that may be evaluated in this article, or claim that may be made by its manufacturer, is not guaranteed or endorsed by the publisher.
Acknowledgments
We would like to acknowledge the efforts of the fieldwork team in the Niger Delta: Goodluck, Davies, Major, and Asuquo. We want to appreciate the Oproama, Kono, and Ete communities for ease of access to mangrove forests (the Global Change Ecology Lab of the University of Edinburgh).
Supplementary Material
The Supplementary Material for this article can be found online at: https://www.frontiersin.org/articles/10.3389/ffgc.2021.746671/full#supplementary-material
References
Adedeji, G. A., Ogunsanwo, O. Y., and John, J. (2013). Density variations in red mangrove (Rhizophora racemosa GFW Meyer) in Onne, River State, Nigeria. Int. J. Sci. Nat. 4, 165–168.
Aduloju, A. A., and Okwechime, I. (2016). Oil and human security challenges in the Nigeria’s Niger delta. Critique 44, 505–525. doi: 10.1080/03017605.2016.1236495
Ajonina, G. N. (2008). Inventory and Modelling Mangrove Forest Stand Dynamics Following Different Levels of Wood Exploitation Pressures in the Douala-Edea Atlantic Coast of Cameroon, Central Africa (Faculty of Forest and Environmental Sciences, Albert-Ludwigs-Universitat Freiburg im Breisgau, Germany). Available online at: http://www.freidok.uni-freiburg.de/volltexte/6132/pdf/Gordon_N._Ajonina_Thesis.pdf (accessed April 24, 2016).
Allen, J. A., Ewel, K. C., and Jack, J. (2001). Patterns of natural and anthropogenic disturbance of the mangroves on the Pacific Island of Kosrae. Wetl. Ecol. Manag. 9, 291–301. doi: 10.1016/S0964-5691(02)00051-0
Alongi, D. M. (2014). Carbon cycling and storage in mangrove forests. Annu. Rev. Mar. Sci. 6, 195–219. doi: 10.1146/annurev-marine-010213-135020
Amadi, J. E., Adebola, M. O., and Eze, C. S. (2014). A survey of the mangrove vegetation in the niger delta region of Nigeria. Int. J. Res. 1, 1129–1138.
Amechi, H., Maureen, N., and Akudo, N. (2014). Analysis of rainfall variations in the niger delta region of Nigeria. IOSR J. Environ. Sci. Toxicol. Food Technol. 8, 25–30. doi: 10.9790/2402-08162530
Amir, A., and Duke, N. (2009). “A forever young ecosystem: light gap creation and turnover of subtropical mangrove forests in Moreton Bay, Southeast Queensland, Australia,” in Proceedings of the 11th Pacific Science Inter-Congress in Conjunction with the 2nd Symposium on French Research in the Pacific (Honolulu, HI), 1–5.
Araujo, R. J., Jaramillo, J. C., and Snedaker, S. C. (1997). LAI and leaf size differences in two red mangrove forest types in South Florida. Bull. Mar. Sci. 60, 643–647.
Bequet, R., Campioli, M., Kint, V., Vansteenkiste, D., Muys, B., and Ceulemans, R. (2011). Leaf area index development in temperate oak and beech forests is driven by stand characteristics and weather conditions. Trees Struct. Funct. 25, 935–946. doi: 10.1007/s00468-011-0568-4
Biswas, S. R., Khan, M. S. I., and Mallik, A. U. (2012). Invaders’ control on post-disturbance succession in coastal mangroves. J. Plant Ecol. 5, 157–166. doi: 10.1093/jpe/rtr050
Bouillon, S., Borges, A. V., Castañeda-Moya, E., Diele, K., Dittmar, T., Duke, N. C., et al. (2008). Mangrove production and carbon sinks: a revision of global budget estimates. Glob. Biogeochem. Cycles 22:12. doi: 10.1029/2007GB003052
Carugati, L., Gatto, B., Rastelli, E., Lo Martire, M., Coral, C., Greco, S., et al. (2018). Impact of mangrove forests degradation on biodiversity and ecosystem functioning. Sci. Rep. 8:13298. doi: 10.1038/s41598-018-31683-0
Castaneda, E. (2010). Landscape Patterns of Community Structure, Biomass and Net Primary Productivity of Mangrove Forests in the Florida Coastal Everglades as a Function of Resources, Regulators, Hydroperiod, and Hurricane Disturbance (Department of Oceanography and Coastal Sciences, Louisiana State University). Available online at: http://citeseerx.ist.psu.edu/viewdoc/download?doi=10.1.1.459.2550&rep=rep1&type=pdf (accessed November 6, 2015).
Castañeda-Moya, E., Twilley, R. R., and Rivera-Monroy, V. H. (2013). Allocation of biomass and net primary productivity of mangrove forests along environmental gradients in the Florida Coastal Everglades, USA. For. Ecol. Manage. 307, 226–241. doi: 10.1016/j.foreco.2013.07.011
Castañeda-Moya, E., Twilley, R. R., Rivera-Monroy, V. H., Zhang, K., Davis, S. E., and Ross, M. (2010). Sediment and nutrient deposition associated with hurricane wilma in mangroves of the Florida Coastal Everglades. Estuaries Coast. 33, 45–58. doi: 10.1007/s12237-009-9242-0
Chen, R., and Twilley, R. R. (1999). A simulation model of organic matter and nutrient accumulation in mangrove wetland soils. Biogeochemistry 44, 93–118. doi: 10.1023/A:1006076405557
Cintron, G. A., and Novelli, Y. S. (1984). “Methods for studying mangrove structure,” in The Mangrove Ecosystem: Research Methods, ed. S. C. Snedaker (Paris: UNESCO), 91–113.
Clarke, P. J., and Kerrigan, R. A. (2000). Do forest gaps influence the population structure and species composition of mangrove stands in northern Australia? Biotropica 32, 642–652. doi: 10.1111/j.1744-7429.2000.tb00511.x
Clough, B. F., Ong, J. E., and Gong, G. W. (1997). Estimating leaf area index and photosynthetic production in mangrove forest canopies. Mar. Ecol. Prog. Ser. 159, 285–292. doi: 10.3354/meps159285
Cox, L. E., Hart, J. L., Dey, D. C., and Schweitzer, C. J. (2016). Composition, structure, and intra-stand spatial patterns along a disturbance severity gradient in a Quercus stand. For. Ecol. Manage. 381, 305–317. doi: 10.1016/j.foreco.2016.09.040
Dahdouh-Guebas, F., and Koedam, N. (2006). Empirical estimate of the reliability of the use of the Point-Centred Quarter Method (PCQM): solutions to ambiguous field situations and description of the PCQM+ protocol. For. Ecol. Manage. 228, 1–18. doi: 10.1016/j.foreco.2005.10.076
de Jong Cleyndert, G., Cuni-Sanchez, A., Seki, H. A., Shirima, D. D., Munishi, P. K. T., Burgess, N., et al. (2020). The effects of seaward distance on above and below ground carbon stocks in estuarine mangrove ecosystems. Carbon Balance Manag. 15, 1–15. doi: 10.1186/s13021-020-00161-4
De Kauwe, M. G., Disney, M. I., Quaife, T., Lewis, P., and Williams, M. (2011). An assessment of the MODIS collection 5 leaf area index product for a region of mixed coniferous forest. Remote Sens. Environ. 115, 767–780. doi: 10.1016/j.rse.2010.11.004
Donato, D. C., Kauffman, J. B., Murdiyarso, D., Kurnianto, S., Stidham, M., and Kanninen, M. (2011). Mangroves among the most carbon-rich forests in the tropics. Nat. Geosci. 4, 293–297. doi: 10.1038/ngeo1123
Duke, N. C. (2001). Gap creation and regenerative processes driving diversity and structure of mangrove ecosystems. Wetl. Ecol. Manage. 9, 257–269. doi: 10.1023/A:1011121109886
Dupont, L. M., Jahns, S., Marret, F., and Ning, S. (2000). Vegetation change in equatorial West Africa: time-slices for the last 150 KA. Palaeogeogr. Palaeoclimatol. Palaeoecol. 155, 95–122. doi: 10.1016/S0031-0182(99)00095-4
Edu, E. A., Edwin-Wosu, N. L., Ononyume, M. O., and Nkang, A. E. (2014). Carbon credits assessment in a mixed mangrove forest vegetation of Cross River Estuary, Nigeria. Asian J. Plant Sci. Res. 4, 1–12.
Edu, E. A. B., Nsirim, L. E. W., and Martins, O. O. (2014). Monitoring and assessment of leaf litter dynamics in a mixed Mangal forest of the cross river estuary, Nigeria. Int. J. Environ. Monit. Anal. 2:163. doi: 10.11648/j.ijema.20140203.16
FAO (2005). Global Forest Resources Assessment 2005: Thematic Study on Mangroves. Nigeria Country Profile. Rome: Forestry Department FAO.
Fatoyinbo, T. E., and Simard, M. (2013). Height and biomass of mangroves in Africa from ICESat/GLAS and SRTM. Int. J. Remote Sens. 34, 668–681. doi: 10.1080/01431161.2012.712224
Fatoyinbo, T., and Simard, M. (2011). “Remote sensing of mangrove structure and biomass,” in Proceedings of the Workshop on Tropical Wetland Ecosystems on Indonesia: Science Needs to Address Climate Change Adaption and Mitigation (Bali), 5.
Feka, N. Z., and Ajonina, G. N. (2011). Drivers causing decline of mangrove in West-Central Africa: a review. Int. J. Biodivers. Sci. Ecosyst. Serv. Manage. 7, 217–230. doi: 10.1080/21513732.2011.634436
Food and Agriculture Organization (1994). Mangrove Forest Management Guidelines. Rome: Food and Agriculture Organization.
Food and Agriculture Organization (2007). The World’s Mangrove 1980-2005. FAO Forestry Paper, 153, 89. Rome: Food and Agriculture Organization.
Frazer, G. W., Canham, C. D., and Lertzman, K. P. (1999). Gap Light Analyzer (GLA), Version 2.0: Imaging Fisheye, Software to Extract Canopy Structure and Gap Light Transmission Indices from True-Colour Photographs, Users Manual and Program Documentation. Burnaby, BC: Simon Fraser University.
Friess, D. A. (2016). Ecosystem services and disservices of mangrove forests: insights from historical colonial observations. Forests 7:183. doi: 10.3390/f7090183
Giri, C., Ochieng, E., Tieszen, L. L., Zhu, Z., Singh, A., Loveland, T., et al. (2011). Status and distribution of mangrove forests of the world using earth observation satellite data. Glob. Ecol. Biogeogr. 20, 154–159. doi: 10.1111/j.1466-8238.2010.00584.x
Global Invasive Species Database (GISD). (2015). Full account for: nypa fruticans nypa. Invas. Spec. Special. Group 1, 1–4. doi: 10.1017/CBO9781107415324.004
Hamilton, L. S., and Snedaker, S. C. (1984). “Handbook for mangrove area management,” in Commission on Ecology (Honolulu: East-West Environment and Policy Institute), 1–123. Available online at: https://doi.org/http://hdl.handle.net/10125/26547
Harris, R. J., Milbrandt, E. C., Everham, E. M., and Bovard, B. D. (2010). The effects of reduced tidal flushing on mangrove structure and function across a disturbance gradient. Estuaries Coast. 33, 1176–1185. doi: 10.1007/s12237-010-9293-2
Harun Rashid, S., Biswas, S. R., Böcker, R., and Kruse, M. (2009). Mangrove community recovery potential after catastrophic disturbances in Bangladesh. For. Ecol. Manage. 257, 923–930. doi: 10.1016/j.foreco.2008.10.028
Howard, J., Hoyt, S., Isensee, K., Pidgeon, E., and Telszewski, M. (2014). Coastal Blue Carbon: Methods for Assessing Carbon Stocks and Emissions Factors in Mangroves, Tidal Salt Marshes, and Seagrass Meadows. Arlington, VA: International Union for Conservation of Nature, 1–180.
Hutchison, J., Manica, A., Swetnam, R., Balmford, A., and Spalding, M. (2014). Predicting global patterns in mangrove forest biomass. Conserv. Lett. 7, 233–240. doi: 10.1111/conl.12060
ICRAF (2010). Worldwride Open Access Tree Functional Attributes and Ecological Database. Nairobi: The International Council for Research in Agroforestry.
Isebor, C. E., Ajayi, T. O., and Anyanwu, A. (2003). The Incidence of Nypa fruticans (WURMB) and It’s Impact on Fisheries Production in the Niger Delta Mangrove Ecosystem. Available online at: https://core.ac.uk/download/pdf/11019219.pdf (accessed July 25, 2016).
Ishil, T., and Tateda, Y. (2004). “Leaf area index and biomass estimation for mangrove plantation in Thailand. IGARSS 2004,” in Proceedings of the 2004 IEEE International Geoscience and Remote Sensing Symposium, Vol. 4, (Anchorage, AK), 2323–2326.
Jackson, G. (2011). Mangrove resources utilization in Nigeria: an analysis of the Andoni Mangrove resources crisis. Sacha J. Environ. Stud. 1, 49–63.
James, G. K., Adegoke, J. O., Osagie, S., Ekechukwu, S., Nwilo, P., and Akinyede, J. (2013). Social valuation of mangroves in the Niger Delta region of Nigeria. Int. J. Biodivers. Sci. Ecosyst. Serv. Manage. 9, 311–323. doi: 10.1080/21513732.2013.842611
James, G. K., Adegoke, J. O., Saba, E., Nwilo, P., and Akinyede, J. (2007). Satellite-based assessment of the extent and changes in the mangrove ecosystem of the Niger Delta. Mar. Geod. 30, 249–267. doi: 10.1080/01490410701438224
Jusoh, I., and Aziz, M. A. (2014). Species composition and stand structure of an exploited mangrove forest. Kuroshio Sci. 8, 63–67.
Kamal, M., Phinn, S., Johansen, K., and Adi, N. S. (2016). Estimation of mangrove leaf area index from ALOS AVNIR-2 data (A comparison of tropical and sub-tropical mangroves). AIP Conf. Proc. 1755:040005. doi: 10.1063/1.4958480
Kauffman, J. B., Heider, C., Cole, T. G., Dwire, K. A., and Donato, D. C. (2011). Ecosystem carbon stocks of Micronesian mangrove forests. Wetlands 31, 343–352. doi: 10.1007/s13157-011-0148-9
Kinako, P. D. S. (1977). Conserving the mangrove forest of the Niger Delta. Biol. Conserv. 11, 35–39. doi: 10.1016/0006-3207(77)90025-8
Komiyama, A., Poungparn, S., and Kato, S. (2005). Common allometric equations for estimating the tree weight of mangroves. J. Trop. Ecol. 21, 471–477. doi: 10.1017/S0266467405002476
Kovacs, J. M., King, J. M. L., Flores de Santiago, F., and Flores-Verdugo, F. (2009). Evaluating the condition of a mangrove forest of the Mexican Pacific based on an estimated leaf area index mapping approach. Environ. Monit. Assess. 157, 137–149. doi: 10.1007/s10661-008-0523-z
Kuei-Chu, F. (2008). Population structure, allometry and above-ground biomass of Avicennia marina forest at the Chishui River Estuary, Tainan County, Taiwan. For. Res. Q. 30, 1–15.
Lewis, M., Pryor, R., and Wilking, L. (2011). Fate and effects of anthropogenic chemicals in mangrove ecosystems: a review. Environ. Pollut. 159, 2328–2346. doi: 10.1016/j.envpol.2011.04.027
Lucas, R., Rebelo, L. M., Fatoyinbo, L., Rosenqvist, A., Itoh, T., Shimada, M., et al. (2014). Contribution of L-band SAR to systematic global mangrove monitoring. Mar. Freshw. Res. 65, 589–603. doi: 10.1071/MF13177
Mahmood, H., Siddique, M. R. H., Abdullah, S. M. R., Akhter, M., and Islam, S. M. Z. (2016). Manual for Building Tree Volume and Biomass Allometric Equation for Bangladesh. Dhaka: Bangladesh Forest Department, Ministry of Environment and Forests.
Maiti, S. K., and Chowdhury, A. (2013). Effects of anthropogenic pollution on mangrove biodiversity: a review. J. Environ. Prot. 4, 1428–1434. doi: 10.4236/jep.2013.412163
Manna, S., and Raychaudhuri, B. (2020). Retrieval of Leaf area index and stress conditions for Sundarban mangroves using Sentinel-2 data. Int. J. Remote Sens. 41, 1019–1039. doi: 10.1080/01431161.2019.1655174
McElwee, P., Nguyen, V. H. T., Nguyen, D. V., Tran, N. H., Le, H. V. T., Nghiem, T. P., et al. (2017). Using REDD+ policy to facilitate climate adaptation at the local level: synergies and challenges in Vietnam. Forests 8, 1–24. doi: 10.3390/f8010011
McLeod, E., and Salm, R. V. (2006). Managing Mangroves for Resilience to Climate Change. Arlington, VA: The Nature Conservancy.
McNicol, I. M., Ryan, C. M., Dexter, K. G., Ball, S. M. J., and Williams, M. (2017). Aboveground carbon storage and its links to stand structure, tree diversity and floristic composition in South-Eastern Tanzania. Ecosystems 21, 740–754. doi: 10.1007/s10021-017-0180-6
Mmom, P. C., and Arokoyu, S. B. (2010). Mangrove forest depletion, biodiversity loss and traditional resources management practices in the Niger Delta, Nigeria. Res. J. Appl. Sci. Eng. Technol. 2, 28–34.
Mohamed, M. O. S., Neukermans, G., Kairo, J. G., Dahdouh-Guebas, F., and Koedam, N. (2009). Mangrove forests in a peri-urban setting: the case of Mombasa (Kenya). Wetl. Ecol. Manage. 17, 243–255. doi: 10.1007/s11273-008-9104-8
Mukherjee, N., Sutherland, W. J., Dicks, L., Hugé, J., Koedam, N., and Dahdouh-Guebas, F. (2014). Ecosystem service valuations of mangrove ecosystems to inform decision making and future valuation exercises. PLoS One 9:e107706. doi: 10.1371/journal.pone.0107706
NDDC (2006). “Niger delta region land and people,” in Niger Delta Regional Development Masterplan, ed. Niger Delta Development Commission (Port Harcourt: NDDC), 48–99. Available online at: http://www.nddc.gov.ng/NDRMPChapter1.pdf
Nfotabong-Atheull, A., Din, N., Essomè Koum, L., Satyanarayana, B., Koedam, N., and Dahdouh-Guebas, F. (2011). Assessing forest products usage and local residents’ perception of environmental changes in peri-urban and rural mangroves of Cameroon, Central Africa. J. Ethnobiol. Ethnomed. 7:41. doi: 10.1186/1746-4269-7-41
Ngoc Le, D. T., Van Thinh, N., The Dung, N., and Mitlöhner, R. (2016). Effect of disturbance regimes on spatial patterns of tree species in three sites in a tropical evergreen forest in Vietnam. Int. J. For. Res. 2016, 1–6. doi: 10.1155/2016/4903749
Nguyen, L. T. M., Hoang, H. T., Van Ta, H., and Park, P. S. (2020). Comparison of mangrove stand development on accretion and erosion sites in Ca Mau, Vietnam. Forests 11, 1–16. doi: 10.3390/F11060615
Numbere, A. O. (2019). Effect of soil types on growth, survival and abundance of mangrove (Rhizophora racemosa) and Nypa palm (Nypa fruticans) Seedlings in the Niger Delta, Nigeria. Am. J. Environ. Sci. 15, 55–63. doi: 10.3844/ajessp.2019.55.63
Numbere, A. O., and Camilo, G. R. (2018). Structural characteristics, above-ground biomass and productivity of mangrove forest situated in areas with different levels of pollution in the Niger Delta, Nigeria. Afr. J. Ecol. 56, 917–927. doi: 10.1111/aje.12519
Nwigbo, S. C., Azaka, O. A., Chukwuneke, J. L., and Nwadike, C. E. (2013). Establishing allometric relationships using crown diameter for estimating above ground combustible fuels in Southern Nigerian mangrove vegetations. Int. J. Multidiscip. Sci. Eng. 4, 43–52.
Nwobi, C., Williams, M., and Mitchard, E. T. (2020). Rapid Mangrove forest loss and Nipa palm (Nypa fruticans) expansion in the Niger Delta, 2007-2017. Remote Sens. 12, 2007–2017. doi: 10.3390/rs12142344
Okugbo, O. T., Usunobun, U., Adegbegi, J. A., and Okiemien, C. O. (2012). A review of Nipa palm as a renewable energy source in Nigeria. Res. J. Appl. Sci. Eng. Technol. 4, 2367–2371.
Olaoye, O. J., and Ojebiyi, W. G. (2018). Marine Fisheries in Nigeria: A Review. London: IntechOpen, 155–173. doi: 10.5772/57353
Pool, D. J. (1973). The Role of Mangrove Ecosystems: Mangrove Leaf Area Indices. Resource Management Systems Program, University of Florida. Available online at: https://fgcu.digital.flvc.org/islandora/object/fgcu%3A26332/datastream/OBJ/view/Role_of_Mangrove_Ecosystems.pdf (accessed January 30, 2018).
Prananda, A. R. A., Kamal, M., and Wijaya Kusuma, D. (2020). The effect of using different vegetation indices for mangrove leaf area index modelling. IOP Conf. Ser. 500:012006. doi: 10.1088/1755-1315/500/1/012006
R Core Team (2020). R: A Language And Environment for Statistical Computing. Vienna: R Foundation for Statistical Computing.
Rasquinha, D. N., and Mishra, D. R. (2020). Impact of wood harvesting on mangrove forest structure, composition and biomass dynamics in India. Estuarine Coast. Shelf Sci. 248:106974.
Scales, I. R., and Friess, D. A. (2019). Patterns of mangrove forest disturbance and biomass removal due to small-scale harvesting in southwestern Madagascar. Wetl. Ecol. Manage. 27, 609–625. doi: 10.1007/s11273-019-09680-5
Schnitzer, S. A., Mascaro, J., and Carson, W. P. (1991). Treefall gaps and the maintenance of plant species diversity in tropical forests. Ecology 82, 913–919.
Secretariat of the Convention on Biological Diversity (2010). Global biodiversity outlook 3. Montréal, 104, 1–94. Available online at: https://www.cbd.int/doc/publications/gbo/gbo3-final-en.pdf (accessed May 5, 2018).
Sherman, R. E., Fahey, T. J., and Martinez, P. (2003). Spatial patterns of biomass and aboveground net primary productivity in a mangrove ecosystem in the Dominican Republic. Ecosystems 6, 384–398. doi: 10.1007/s10021-002-0191-8
Simard, M., Pinto, N., Fisher, J. B., and Baccini, A. (2011). Mapping forest canopy height globally with spaceborne lidar. J. Geophys. Res. 116, 1–12. doi: 10.1029/2011JG001708
Ukpong, I. E. (1991). The performance and distribution of species along soil salinity gradients of mangrove swamps in Southeastern Nigeria. Vegetatio 95, 63–70.
Ukpong, I. E. (1994). Soil-vegetation interrelationships of mangrove swamps as revealed by multivariate analyses. Geoderma 64, 167–181. doi: 10.1016/0016-7061(94)90096-5
Ukpong, I. E. (2000a). Ecological classification of Nigerian mangrove using soil nutrient gradient analysis. Wetl. Ecol. Manage. 8, 263–272.
Ukpong, I. E. (2015). “Nypa fruticans invasion and the integrity of mangrove ecosystem functioning in the marginal estuaries of South Eastern Nigeria,” in Frontiers in Environmental Research and Sustainable Environment in the 21st Century, eds A. Gbadegesin, O. O. I. Orimoogunje, and O. A. Fashae (Ibadan: Ibadan University Press), 1–13.
Wah, L. M., Mojiol, A. R., and Saleh, E. (2011). Diversity of mangroves ecosystem in semporna mangrove forest. Borneo Sci. 28, 57–65.
Walters, B. B. (2005b). Patterns of local wood use and cutting of Philippine mangrove forests. Econ. Bot. 59, 66–76.
Walters, B. B. (2005a). Ecological effects of small-scale cutting of Philippine mangrove forests. For. Ecol. Manage. 206, 331–348. doi: 10.1016/j.foreco.2004.11.015
Wan Norilani, W. I., Wan Juliana, W. A., Latiff, A., and Salam, M. R. (2014). Community structure at two compartments of a disturbed mangrove forests at Pulau Langkawi. AIP Conf. Proc. 1614, 790–794. doi: 10.1063/1.4895303C
Williams, M., Rastetter, E. B., Fernandes, D. N., Goulden, M. L., Shaver, G. R., and Johnson, L. C. (1997). Predicting gross primary productivity in terrestrial ecosystems. Ecol. Appl. 7, 882–894.
Keywords: mangrove, aboveground biomass, leaf area index, disturbance, stand structure (tree size diversity), Niger Delta
Citation: Nwobi CJ and Williams M (2021) Natural and Anthropogenic Variation of Stand Structure and Aboveground Biomass in Niger Delta Mangrove Forests. Front. For. Glob. Change 4:746671. doi: 10.3389/ffgc.2021.746671
Received: 24 July 2021; Accepted: 28 October 2021;
Published: 26 November 2021.
Edited by:
Valerie Hagger, The University of Queensland, AustraliaReviewed by:
Marília Cunha-Lignon, São Paulo State University, BrazilFrida Sidik, Ministry for Marine Affairs and Fisheries of the Republic of Indonesia, Indonesia
Copyright © 2021 Nwobi and Williams. This is an open-access article distributed under the terms of the Creative Commons Attribution License (CC BY). The use, distribution or reproduction in other forums is permitted, provided the original author(s) and the copyright owner(s) are credited and that the original publication in this journal is cited, in accordance with accepted academic practice. No use, distribution or reproduction is permitted which does not comply with these terms.
*Correspondence: Chukwuebuka J. Nwobi, ZWJ1a2EubndvYmlAZWQuYWMudWs=