 Rubin Sagar
 M. Soubadra Devy
- Ashoka Trust for Research in Ecology and the Environment (ATREE), Bengaluru, India
Anthropogenic disturbances are a pressing driver of forest degradation and are known to affect the microclimate within forests. Most organisms experience the microclimate and hence, associated changes may drive species communities in rainforests. However, such knowledge remains limited in the case of forest canopies, especially in south Asia. We aimed to identify differences in the temperature and light intensity, and beetles and vascular epiphytes in the canopy between old-growth and secondary forests. Using sensors, we recorded two key microclimatic variables, the air temperature, and light intensity, in the crowns of 36 Cullenia exarillata A. Robyns trees. We sampled beetles (morphospecies) and vascular epiphytes (genera) in the crowns. We provide evidence that canopies of secondary forest stands (intensively logged 60 years ago) (1) continue to show higher canopy air temperatures and light intensity, and (2) have higher beetle abundance (individuals), richness (morphospecies), and diversity but lower vascular epiphyte abundance (individuals), richness (genera), and diversity as compared to primary forest stands. We also show that the beetle communities differ (with greater beta diversity in the primary forest), but the vascular epiphyte communities were similar between the two forest types. We hope that this information begins to bridge the gap in understanding the role of microclimate in driving species communities and the ecology of human-modified forests.
Introduction
Microclimates affect species assemblages and functions of tropical forest ecosystems (Chen et al., 1999) and microclimatic conditions experienced by several organisms may be quite different from the macroclimatic conditions (De Frenne et al., 2013; von Arx et al., 2013). With global warming predicted to exceed 1.5°C and 2°C in the 21st century (IPCC, 2021), non-climatic anthropogenic pressures, that is, activities directly resulting in adverse impacts on natural ecosystems, especially forest degradation and fragmentation may worsen microclimatic conditions by reducing the buffering effect (Ewers and Banks-Leite, 2013). Forest degradation has shown to increase the severity of understory microclimatic conditions (Blonder et al., 2018; Jucker et al., 2018). For instance, local air temperatures have been found to be as much as 13.6°C greater in logged forests as compared to primary forests (Senior et al., 2017). Further, the role of intact canopy cover, a feature of old-growth forests (primary forests, henceforth) has a buffering effect on the understory microclimate, offsetting and reducing the severity of macroclimatic variations (De Frenne et al., 2019; Zellweger et al., 2019). Such effects in the canopy microclimate are not as well explored.
Canopies host a high diversity of arthropods (Erwin, 1982; Basset et al., 2008, 2012), particularly beetles (Stork and Grimbacher, 2006). Species unique to the canopy have been observed in the range of 20–30% (Stork and Grimbacher, 2006; Ulyshen and Hanula, 2007; Schroeder et al., 2009) and display very high microhabitat specialization (Wardhaugh et al., 2013). A characteristic feature of tropical rainforests is the presence of vascular epiphytes, which represent approximately 9% of the extant vascular plant diversity (Zotz, 2013). Larger trees, an indicator of older trees, support complex epiphytic communities (Woods et al., 2015; Woods, 2017). Hence, epiphyte communities in old-growth forests are often more diverse than disturbed and secondary forests (Barthlott et al., 2001; Woods and DeWalt, 2013). Consequently, it is no surprise that the presence of epiphytes positively contributes to arthropod diversity in tropical forests (Cruz-Angón et al., 2009; Díaz et al., 2012). The reasoning for the positive association between epiphytes and arthropod abundance and diversity may lie in the fact that epiphytes may offer refuge and resources to arthropods (Nadkarni, 1994). Thus, old-growth trees with greater diversity, abundance, and even size (biomass) of epiphytes may attract a greater abundance and diversity of arthropods. Stuntz et al. (2002a) report substrates with cooler temperatures in the proximity of certain epiphyte species as compared to exposed branch surfaces of host trees, and indicate that this factor, along with the size (biomass) of canopy epiphytes could contribute to the positive association of epiphytes and arthropods (Stuntz et al., 2002b).
Increased forest degradation and fragmentation are well-known to adversely impacted insect communities (Klein, 1989; Feer and Hingrat, 2005; Nichols et al., 2007) through direct exposure to higher ambient temperatures (Piyaphongkul et al., 2012; Woods, 2013; Zhang et al., 2014) and indirectly, such as through changes in host plant qualities. For instance, the leaf surface temperature increases the body temperature of small arthropods on the leaf (Caillon et al., 2014), and higher temperatures can affect several adult phenotypic aspects both within generations and even between generations (Crill et al., 1996). Further, the light intensity has been found to potentially impact the vertical distribution of insects in forests. For instance, Grossner (2009) found light intensity as one of the potential factors affecting the diversity of Heteroptera across vertical strata in beech and oak dominated forests. The understanding of impacts of forest degradation on beetles remains mixed, as some have highlighted the negative effects of fragmentation on beetle species richness and community composition (Feer and Hingrat, 2005; Jung et al., 2018; Salomão et al., 2019), however, some do not demonstrate a clear direction of the impact of fragmentation (Davies and Margules, 1998).
In tropical forests, secondary stands support fewer epiphytes as compared to primary stands (Barthlott et al., 2001; Nadkarni et al., 2004; Padmawathe et al., 2004; Woods and DeWalt, 2013). Forest clearances also adversely affect vascular epiphytes through changes in the microclimate (Zotz and Bader, 2009), such as drier microclimates in secondary forest (Gradstein et al., 2008) or loss of shade-adapted species (Benítez et al., 2012). For instance, Psygmorchis pusilla Dodson and Dressler (Orchidaceae) showed reduced biomass and floral spikes at just 3°C above its optimum temperature (Vaz et al., 2004). Increases in light intensity have shown to reduce relative growth rates of a vascular epiphyte (Laube and Zotz, 2003) as well as photoinhibition (Stancato et al., 2002) which could eventually lead to dieback and reduced numbers in environments with higher light intensity.
The need for prioritizing research on microclimate and its impact on forest biodiversity has been indicated (De Frenne et al., 2021). The importance of the microclimate has been recognized for decades, but our understanding of biotic responses to microclimates in the context of human land-use change is still in its infancy (Santos and Benítez-Malvido, 2012; De Frenne et al., 2021). Further, such work is lacking in Indian rainforests in spite of the existence of two biodiversity hotspots (Myers et al., 2000)—the Western Ghats and the Indo-Burma region. Epiphytes form an important part of the rainforest canopy in the southern Western Ghats including several endemics (Parthasarathy, 1988; Ganesan and Livingstone, 2001). Similarly, beetles also form a major component of the insect taxa (Devy and Davidar, 2003; Mohanraj et al., 2014). The responses of these taxa to environmental change have been little quantified. To provide further insights into the impacts of disturbance on microclimatic variables, beetle and epiphyte communities, we focused on the following two questions:
1) Does the canopy microclimate (temperature and light intensity) differ between primary and secondary forest stands?
2) Do beetles and canopy vascular epiphytes differ between primary and secondary forest stands?
Throughout this paper, we use the word “canopy” or “forest canopy” referring to the overstorey defined as the “stratum of trees that have outgrown the other vegetation in a forest to have their uppermost crown foliage largely of fully in direct sunlight, usually as a relatively continuous layer (excluding gaps)” (Moffett, 2006). We use the word “crown” or “crown-tree” when referring to the top limbs and leaves of individual trees (from the lowermost limb, excluding the trunk). We chose an evergreen wet tropical forest site, with a known history of varying gradients of logging. Hence, there exist intact, old-growth stands, in close proximity to logged stands. The sites were chosen with the expectation of markedly distinct light and temperature levels in the primary and secondary forests, while the elevation and climatic conditions experienced were the largely very similar. To the best of our knowledge, this is the first study in Indian tropical moist forests to study beetle and vascular epiphyte community responses to microclimatic differences in primary and secondary forest canopies.
Materials and Methods
Study Location
In this study, we focus on a wet tropical forest in the southern Western Ghats, India. Our study sites were located in Kalakad Mundanthurai Tiger Reserve (KMTR), a protected area in Tamil Nadu, India. Our site was logged in the 1960s in varying gradients and the logged sites are referred to as “secondary forest.” The intact, old-growth forest stands, are referred to as “primary forest.” All the stands were in close proximity to each other (maximum distance between any two stands, regardless of forest type, was about 1.5 km). These sites have been used in earlier studies to assess the impact on butterflies (Devy and Davidar, 2001). Also, the sites in the primary forest are part of a long-term phenological study, ongoing since the mid-1990s by the Ashoka Trust for Research in Ecology and the Environment (ATREE).
We identified a total of six sampling plots, three in the primary forest and three in the disturbed forest. The primary forest is characterized by a near-continuous canopy of mature trees representative of the landscape—Cullenia exarillata A. Robyns, Palaquium ellipeticum (Dalz.) Baillon, Aglaia elaeagnoidea (Juss.) Benth, and Myristica dactiloides Gaertn (based on the Species Importance Value, Ganesh et al., 1996). Gaps in the primary forest are largely due to fallen mature trees and disturbances caused by cyclonic storms. Being in the Western Ghats, the topography is undulating with several exposed rocks throughout the forest. The stands have a distinct midstorey and understorey. Dominant species in the understorey consist of Nilgirianthus foliosus, Nilgirianthus perrotettianus, Diotacanthus grandis, and Agrostistachys indica (Ganesh et al., 1996).
The secondary forest was selectively logged in the 1960s, until 1988, however, we do not know the exact extraction volumes. The secondary site we chose was intensively logged with a small proportion of remnant old growth trees. Dominant tree species are Epiprinus malotiformis, Holigarna nigra, and Cullenia exarillata (Devy and Davidar, 2001). The plots are characterized by varying midstorey and understorey, fewer mature trees, and subsequently a discontinuous canopy. The gaps between them are now occupied largely by light-loving pioneer species such as Macaranga peltata (Roxb.) Mueller (Thorat et al., 2016).
Selection of Trees
We selected Cullenia exarillata, one of the dominant trees of the landscape for the sampling. C. exarillata are hosts for epiphytes (Devy, 2006) and the branching makes it a very suitable tree for accessing the crown using the Single Rope Technique (SRT) (Perry, 1978). The locations of the trees in the sites were along the trail used for the long-term phenology surveys (Ganesh et al., 2017). Trees were chosen based on suitability for accessing the crown. The following criteria were used to select a tree—the presence of at least two living branches in the same plane, the height of the branch chosen for installing the rope should not exceed half the length of the climbing rope, and the midstorey should allow a clear line-of-sight to the branch for installing the rope.
A total of 36 trees were selected for sampling (focal tree)—18 trees in the intact primary forest and 18 trees in the secondary forest. We recorded the diameter at breast height (DBH) and estimated the height of each sampled tree.
Canopy Air Temperature and Light Intensity
The canopy air temperature and light intensity was measured using ONSET UA-002-64 HOBO data loggers (Onset Computers, United States). The data loggers are capable of measuring temperature values between –20 and 70°C (accuracy ± 0.53°C for 0–50°C), and light intensity up to 320,000 Lux. A single calibrated HOBO was installed in the crown (inner canopy) of each tree by accessing the crown using the SRT. The HOBO was fixed inside a 6 × 4 × 4 inch stainless steel cage with a mesh size of one square inch, primarily to protect it from damage or tampering by curious Lion-Tailed Macaques. The cage with the HOBO was attached with stainless steel wires (2 mm diameter) to a randomly chosen branch above lower most branch in each tree, but restricted to the inner canopy, and horizontally near the main trunk.
Data loggers were deployed for 86.86 ± 12.56 h, with a logging interval of 6 min (10 readings per hour). Each logger was launched using HOBOware (Onset Computers, United States) such that the start time began at the nearest 30-min mark. We recorded the light intensity (Lux) and ambient air temperature (degrees Celsius) within each sampled tree’s crown. The sampling was spread across March and April 2021, since we used a staggered approach—the plots were sampled on different days, keeping in mind that HOBOs were installed on roughly the same number of trees in the primary and secondary sites within a given week. We chose the post-winter monsoon dry season, which is when the weather is consistently clear and warm during these months, with occasional cloudy and rainy days; we avoided data collection on the few days that rain was expected.
Vascular Epiphyte and Beetle Sampling
We accessed the tree crowns using SRT and for the entire crown, we recorded epiphyte genera (and morphospecies for different species in the same genera) and abundances per crown-tree for each epiphyte genera, and took images wherever possible. We also used binoculars to confirm epiphyte genera where necessary.
For collecting beetles, we made baited funnel traps with used 1-L plastic bottles. The top one-third of the bottles were cut, inverted, and attached to the bottom two-thirds using black electrical insulation tape. We used two types of baits—50 ml of banana “extract” and 50 ml of mango juice, both with a teaspoon of active dry yeast. The banana juice extract was prepared using approximately 200 g of ripe bananas mixed with 1 L of water and strained. The mango juice bait was prepared by mixing a commercially available brand of mango juice and was diluted with water in a 1:1 ratio by volume.
We used 2 mm steel wires to attach the traps to the branches, ensuring that the traps faced upwards. The traps were retrieved along with the HOBOs, and the contents were immediately transferred to a closed container. Beetles in the traps were preserved in 70% ethanol within 12 h of retrieval from the trees.
Data Analysis
We calculated the daily mean values for comparing the canopy temperature and light intensity between the primary and secondary forests. We used Levene’s test to check for homogeneity of variances (temperature: F = 0.2666, p = 0.609; light intensity: F = 0.4152, p = 0.5238) before testing the significance of differences in the daily means of temperature and light intensity between the forest types with an independent t-test.
We compiled the frequency of temperature and light readings in specific range classes. For temperature, the range classes were from 12 to 32.999°C, with an interval of 0.999°C (12–12.999°C, 13–13.999°C and so on), and for light, the range classes were from 0 Lux to 140,000 Lux with an interval of 999.999 lux (0–999.999 lux, 1000–1999.999 lux and so on). To test for differences in the frequency of temperature and light intensity reading in the range classes, we used Fisher’s exact test.
We used the R package “hillR” (Li, 2018) to calculate the Shannon Diversity Index values (Hill numbers). The significance of differences in the beetle and epiphyte abundance, richness and diversity (Hill numbers) values per crown-tree were tested using the Mann–Whitney U-test due to non-normality of data, checked using the Shapiro test. Cohen’s d-value was used to determine the effect size to support the tests, using the R package “rstatix” (Kassambara, 2020). Lastly, we calculated the Bray Curtis dissimilarity index, non-metric multidimensional scaling (NMDS) analysis, and an ANOSIM test with 9,999 permutations using the R package “vegan” (Oksanen et al., 2019) to evaluate differences in species communities between the primary and secondary forests. Further, we tested the effect of forest type on the beta diversity of the beetle and epiphyte communities using the “betadisper” function with 999 permutations available in the R package “vegan” (Oksanen et al., 2019). An ANOVA was performed to test whether these distances differed.
All the analyses, data management, and plotting were done using RStudio (v1.2.5033). We used the package “ggplot2” (Wickham, 2016) for creating the graphs, and “dplyr” (Wickham et al., 2019) for data management and organization.
Results
We obtained a total of 29,972 (Primary: 14,781, Secondary: 15,191) temperature readings from 36 trees and (Primary: 7,257, Secondary: 8,267) daytime light intensity readings from 35 trees (one HOBO was dislodged from its position from a tree in the disturbed forest, presumably by a Lion-Tailed Macaque). Further, the C. exarillata trees we sampled were larger in the primary forest (mean ± SD, tree DBH: 91.58 cm ± 26.93 cm in the primary forest, 73.96 cm ± 21.62 cm in the secondary forest; mean ± SD, tree height: 22.88 m ± 2.98 m in the primary forest; 18.56 m ± 2.56 m in the secondary forest).
Canopy Microclimate
The mean daily temperature of the crowns in the disturbed forest was significantly higher than the mean daily temperature of crowns in the primary forest (mean ± SD: 19.4°C ± 2.58°C vs. 20.5°C ± 3.04°C; t-test p < 0.01; df = 34). The mean hourly crown temperature was consistently higher for the disturbed forest (Figure 1A). The mean daily crown light intensity was also higher in the disturbed forest, but the difference was not significant (mean ± SD: 7,670 ± 12,424 lux in the primary forest vs. 8,862 ± 11,686 lux in the secondary forest; t-test p > 0.05, df = 33). Unlike temperature, the light intensity of the disturbed forest was not higher for all hours of the day (Figure 1B).
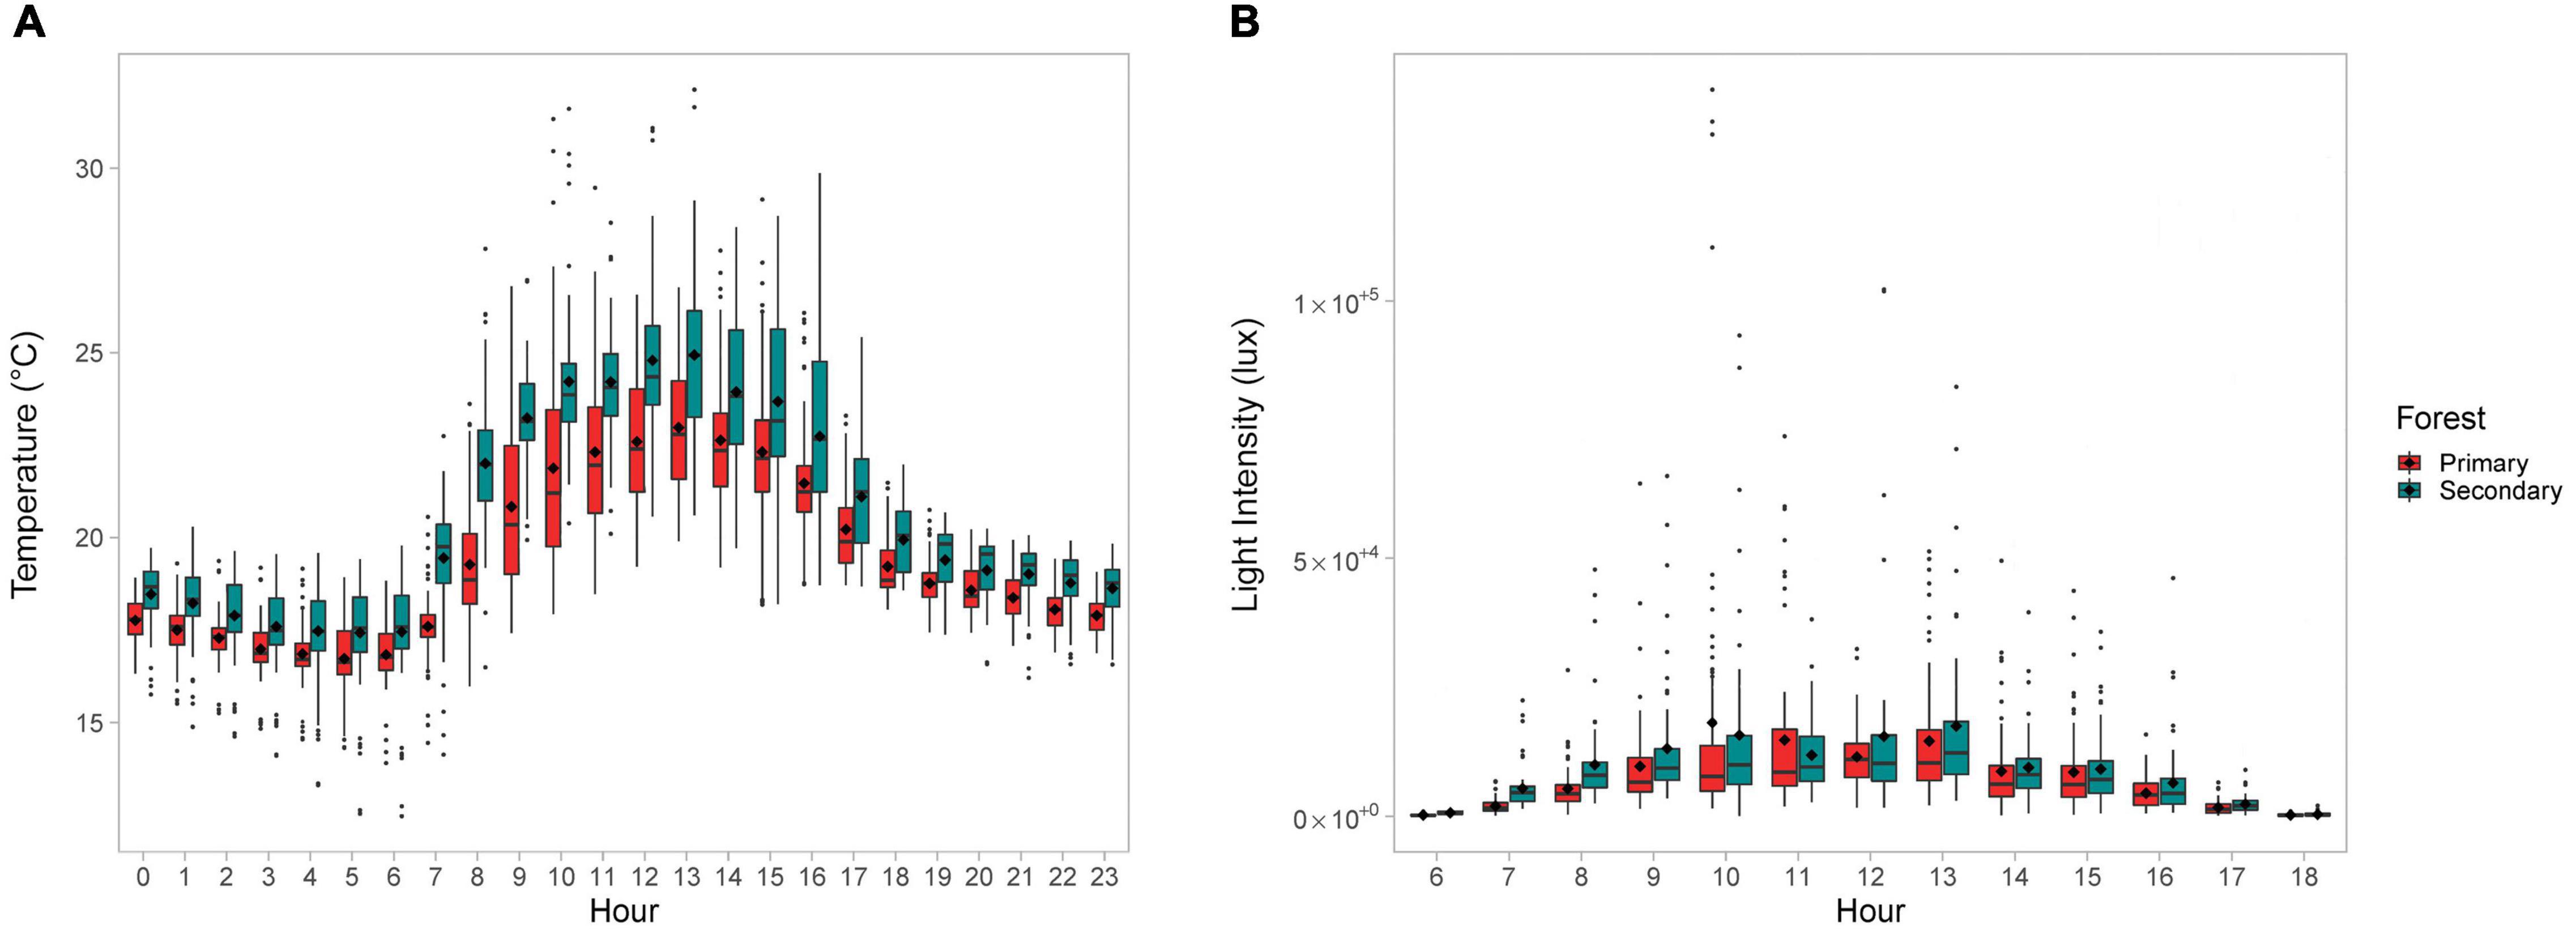
Figure 1. Boxplots showing the (A) mean hourly temperature (°C) and (B) mean hourly light intensity (lux) for the crown-trees compared by forest type. Black dots inside the boxplot indicate mean values.
The frequency of temperatures and light intensity for each sampled crown-tree were consistent with the above findings (Figure 2). Lower temperatures were more frequent in the primary forest, as compared to the secondary forest (Figure 2A). The difference in the frequency of the hourly mean temperatures was significant (Fisher’s exact test p-value = 1e–04, based on 9,999 Monte-Carlo replicates). Although the light intensity does not vary as dramatically (Figure 2B), the difference in the frequency of the hourly mean light intensities was also significant (Fisher’s exact test p = 0.0324, based on 9,999 Monte-Carlo replicates).
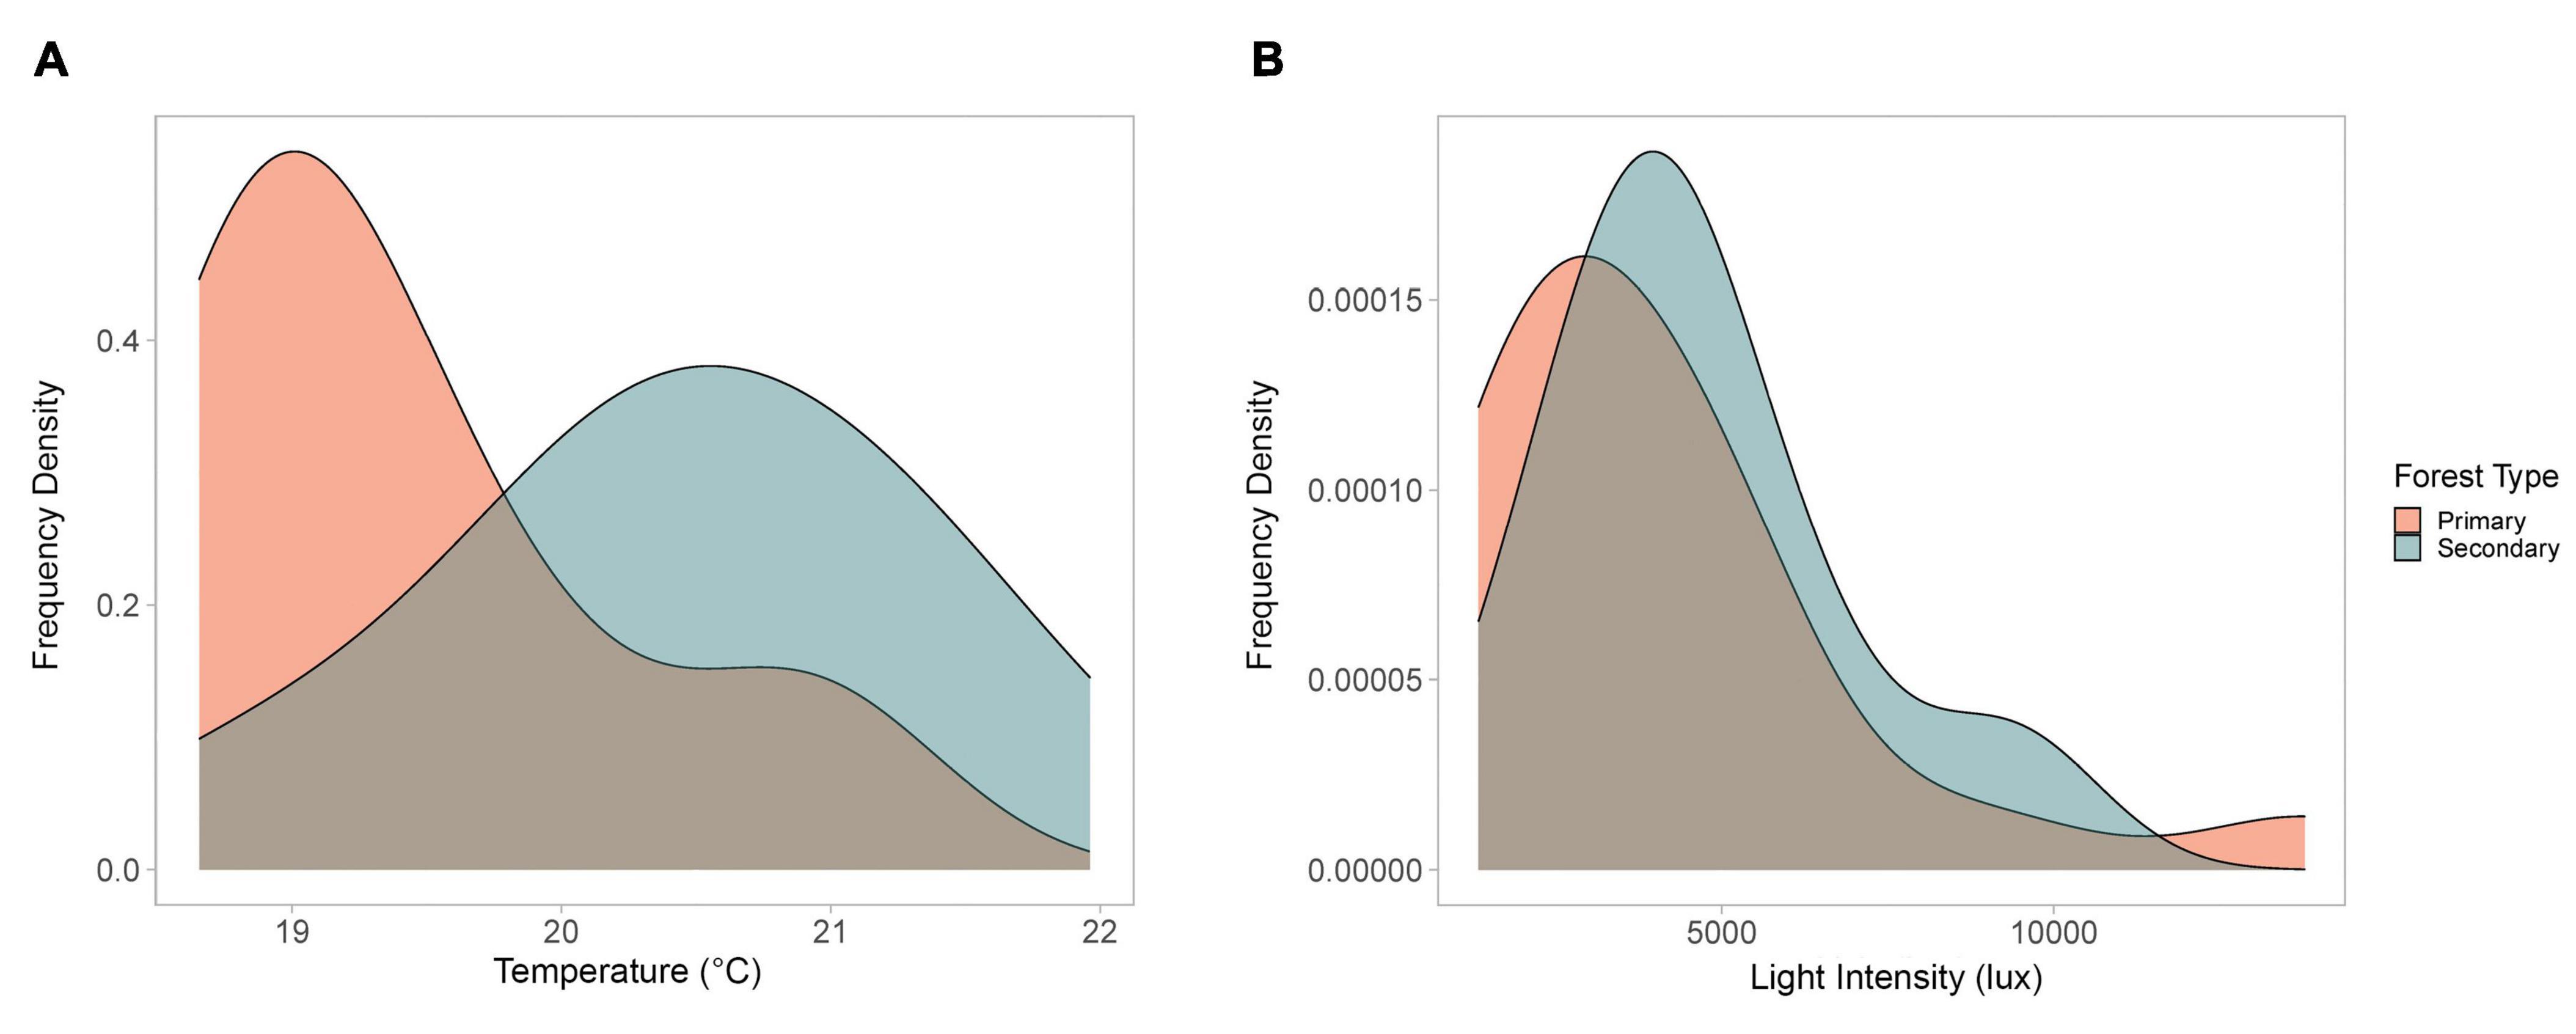
Figure 2. Frequency density charts for (A) mean daily temperature and (B) mean daily light intensity (6 a.m.–6 p.m.) for the crown-trees, compared by forest type.
Canopy Beetles and Vascular Epiphytes
We obtained 175 beetle individuals (mean ± SD: 2.6 ± 2.3 individuals per crown-tree in the primary forest; 7.1 ± 5.7 individuals per crown-tree in the secondary forest). 161 individuals were identified in 18 families, however, the family for 14 individuals could not be identified. Also, a total of 66 beetle morphospecies were identified. We collected 28 beetle morphospecies from the primary forest and 49 beetle morphospecies from the secondary forest in our samples. Of the 66 morphospecies, 47 beetle morphospecies were singletons. 11 (16.67%) beetle morphospecies were found in both forest types, whereas 17 (25.75%) were unique to the primary forest and 38 (57.57%) were unique to the secondary forest. The five most abundant families (abundance, relative abundance), with a relative abundance greater than 5% were Mordellidae (63, 36%), Nitidulidae (31, 17.7%), Staphylinidae (13, 7.4%), Elateridae (10, 5.7%), and Chrysomelidae (9, 5.14%). There was one morphospecies in the Mordellidae family, with 56 individuals found in the secondary forest, and 7 individuals in the primary forest. Similarly, we found more Elateridae and Chrysomelidae individuals in the secondary forest. Nitidulidae and Staphylinidae abundances were similar in both forest types (Supplementary Table 1).
We also found approximately 2,720 vascular epiphyte individuals (mean ± SD: 104.5 ± 241.05 individuals per crown-tree in the primary forest; 46.83 ± 104.42 individuals per crown-tree in the secondary forest). The most abundant epiphyte genera (abundance, relative abundance) were Eria sp. (Orchidaceae) (1,320, 48.45%), Bulbophyllum sp.1 (Orchidaceae) (980, 35.97%) and Bulbophyllum sp.2 (Orchidaceae) (265, 9.72%). Among these, Eria sp. and Bulbophyllum sp.2 were largely absent from the secondary forest, except for one tree (D3T1). Whereas Bulbophyllum sp.1 was more abundant in the secondary forest, but their abundance was exceptionally high in one tree (D3T1) (Supplementary Table 2).
Beetle abundances, richness, and diversities were quite variable across the trees, but consistently and significantly lower in the primary forest (Table 1 and Figures 3A–C). Contrastingly, the epiphyte abundances, richness, and diversity values were higher in the primary forest but only the diversity (Hill numbers) was significantly higher (Table 2 and Figures 3D–F).
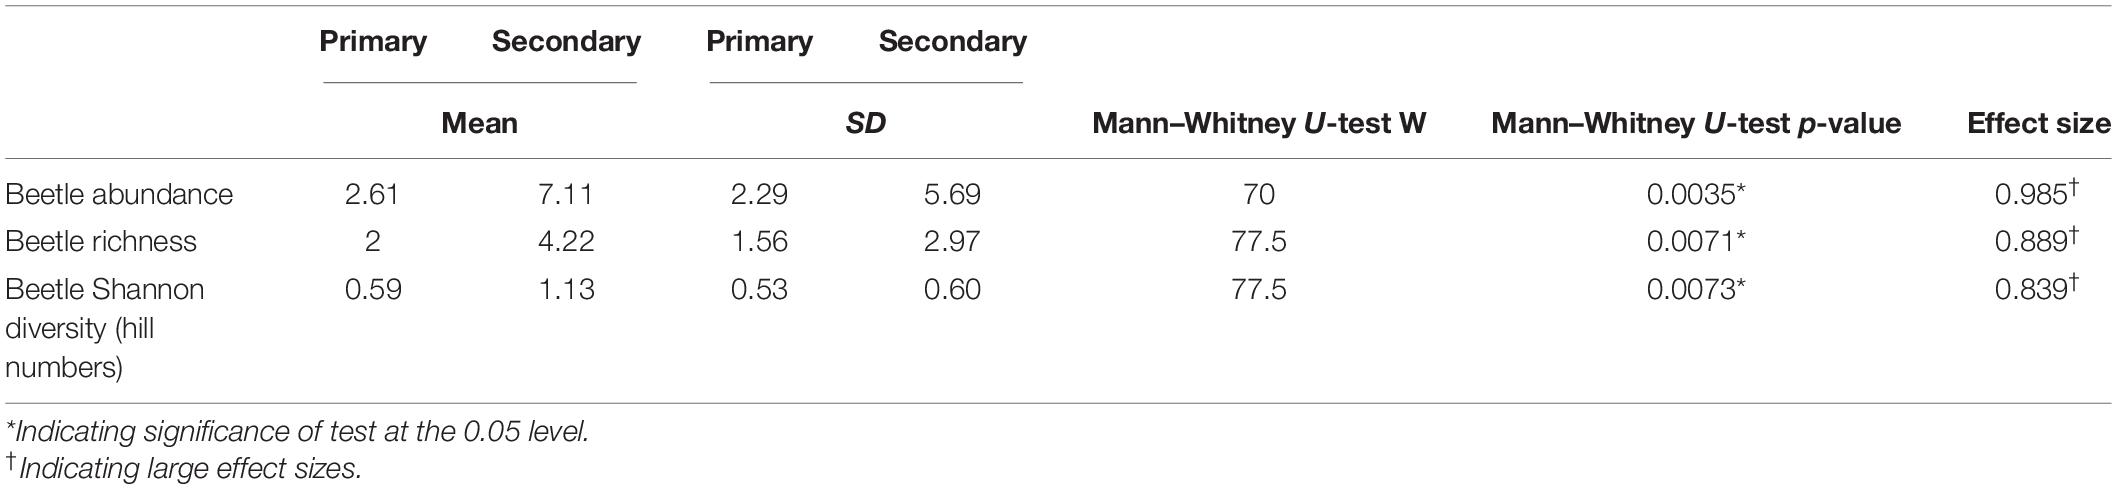
Table 1. Summary of beetle abundance (individuals per crown-tree), richness (per crown-tree), and Shannon’s diversity values (per crown-tree) between the primary and secondary forests.
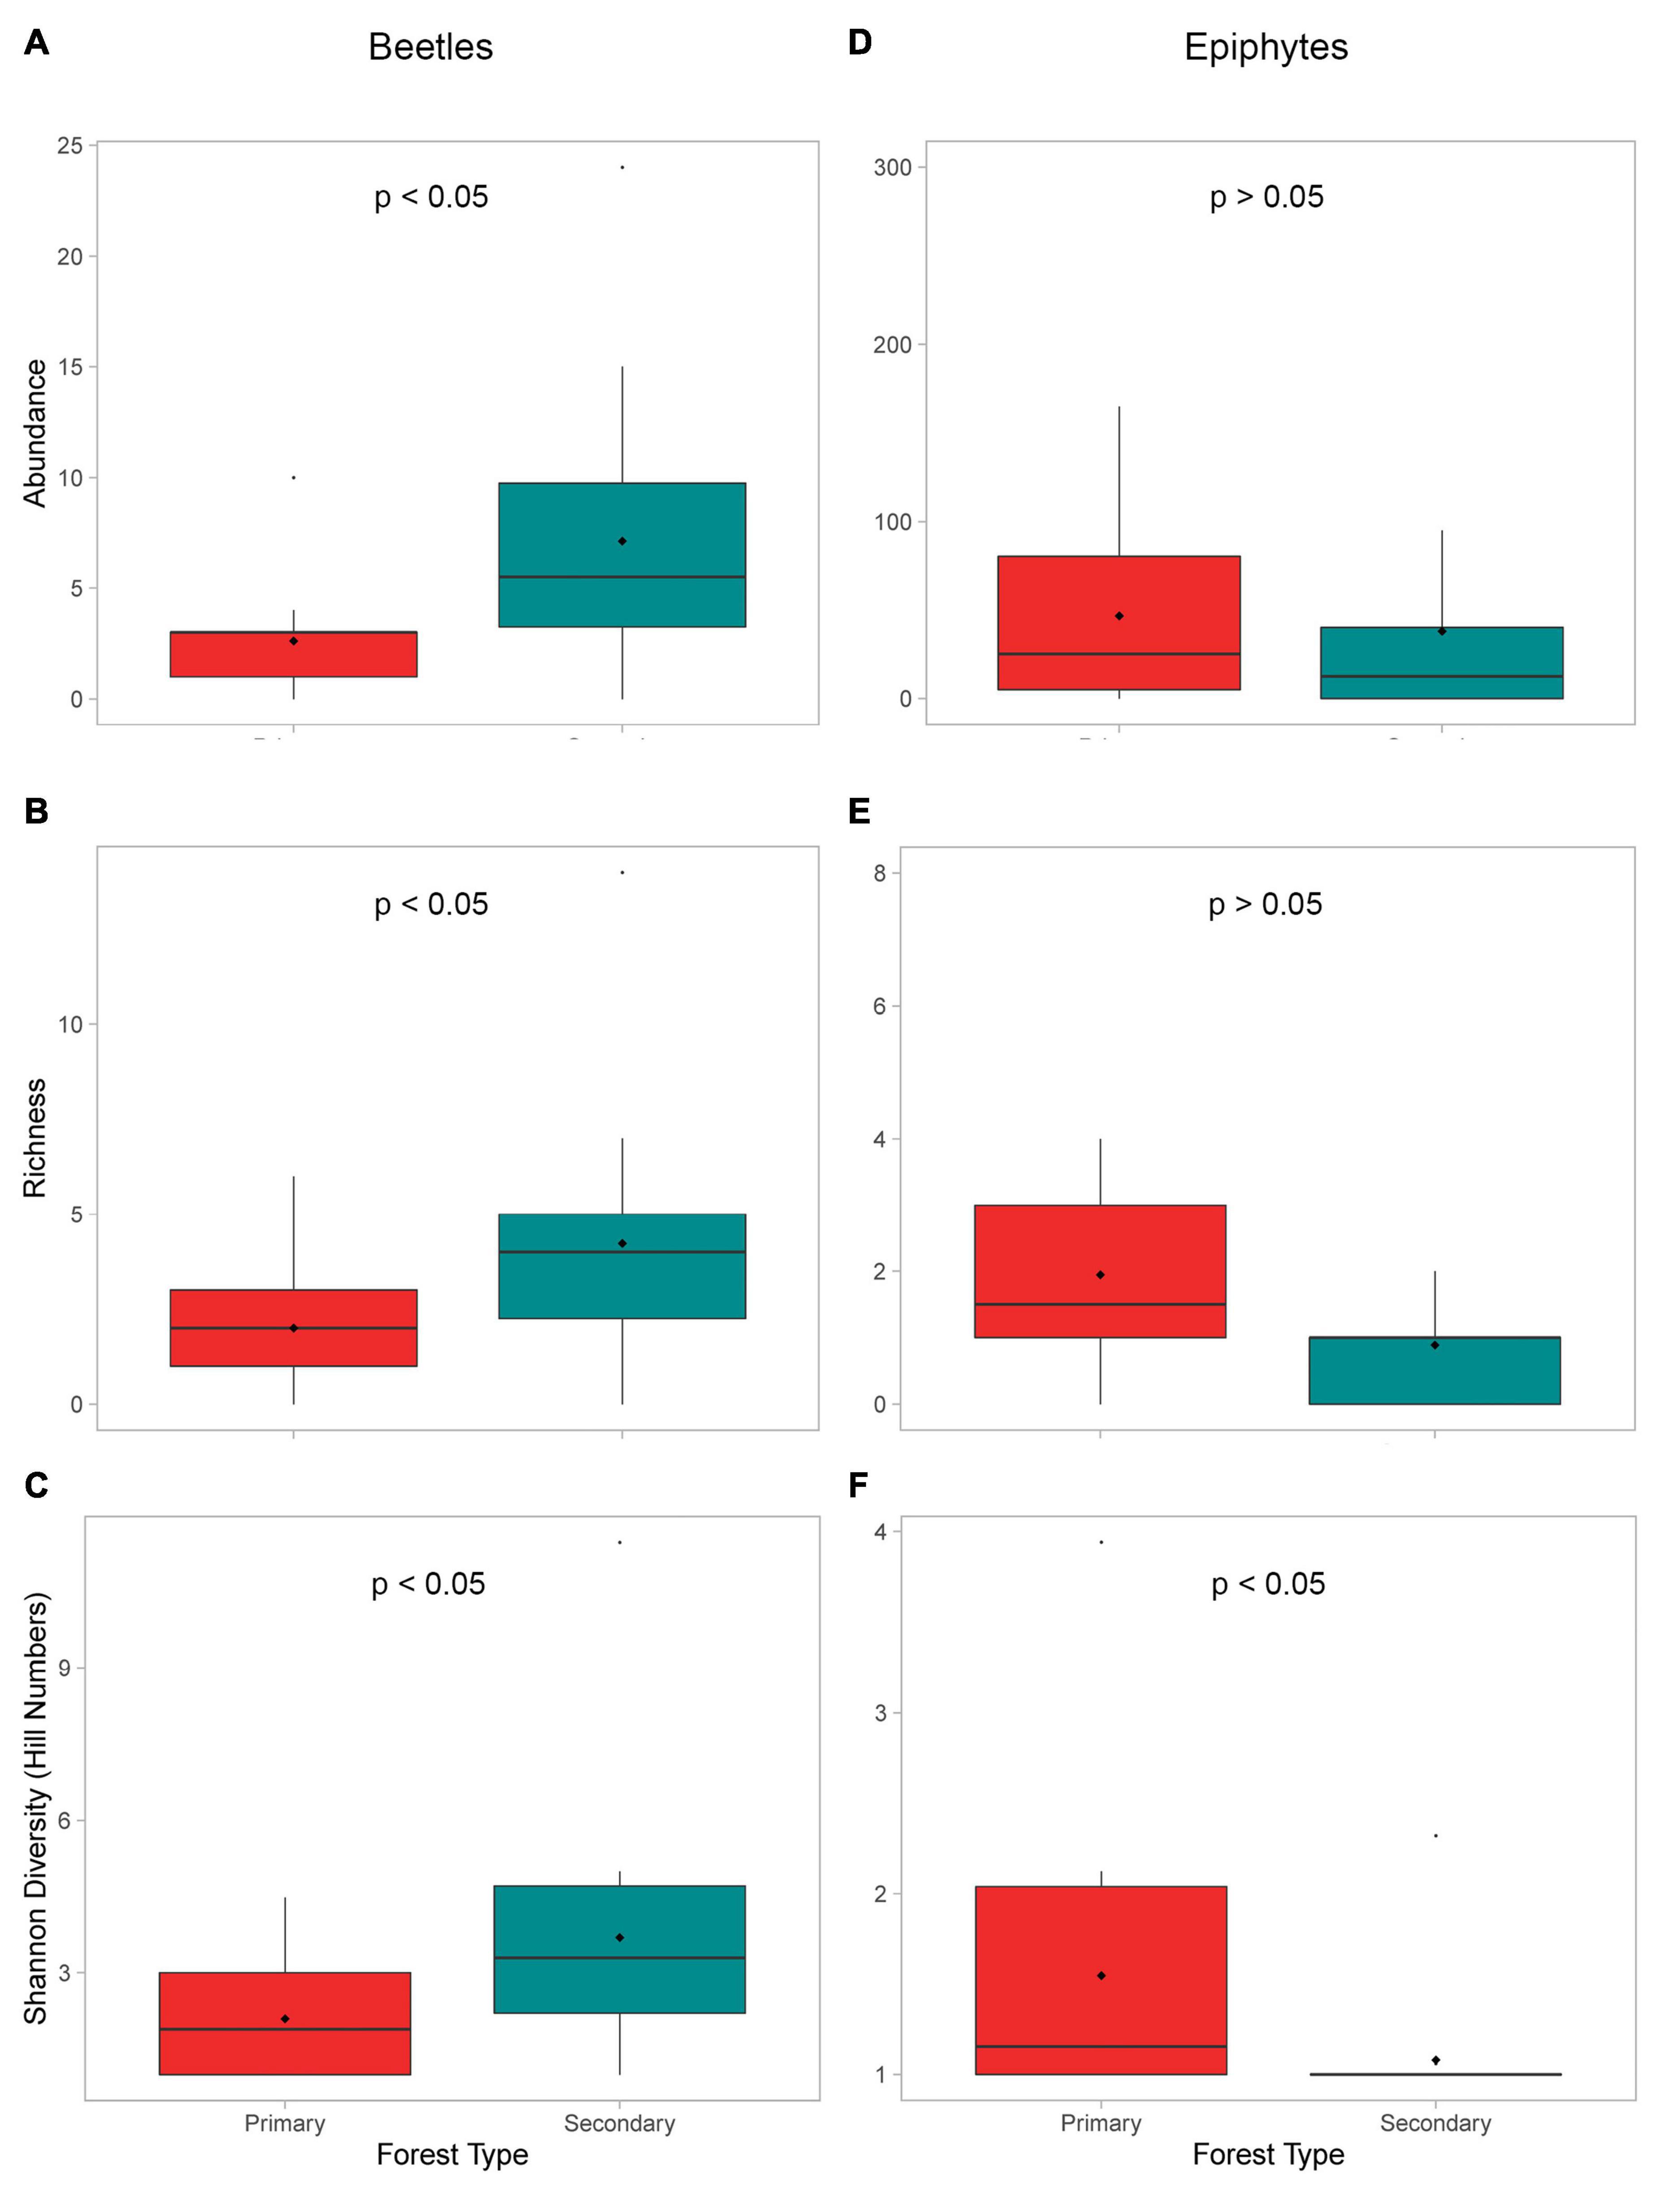
Figure 3. Boxplots of the (A) beetle abundances (number of individuals), (B) beetle morphospecies richness, (C) beetle morphospecies Shannon’s diversity (Hill numbers), (D) epiphyte abundances (number of individuals), (E) epiphyte genera richness, and (F) epiphyte genera Shannon’s diversity (Hill numbers) across all trees compared by forest type. Black dots inside the boxplots indicate mean values.
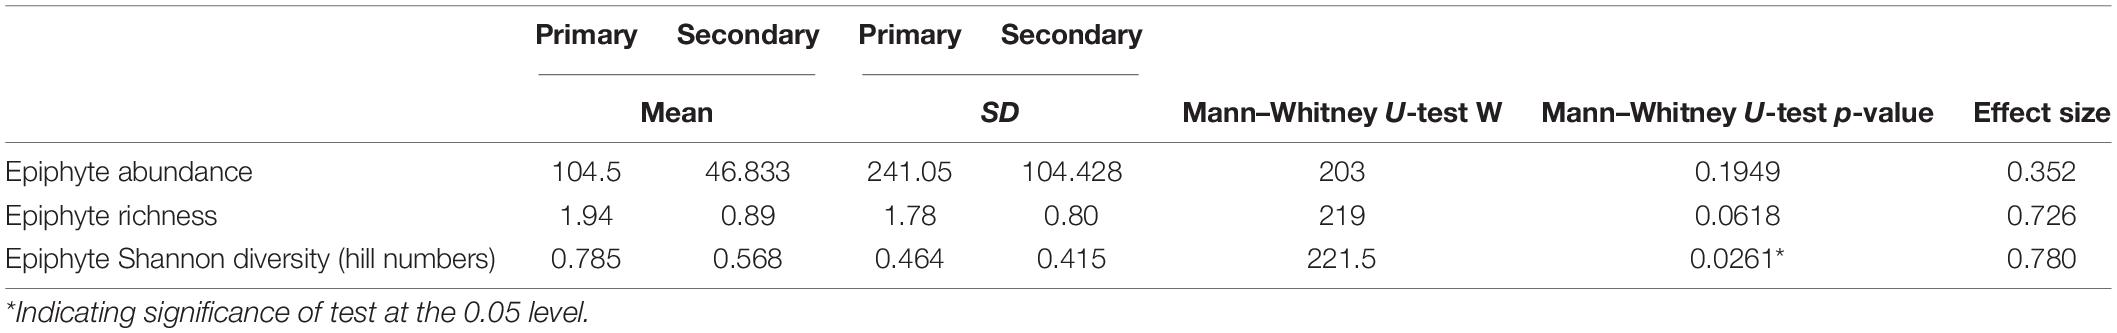
Table 2. Summary of epiphyte abundance (individuals per crown-tree), richness (per crown-tree) and Shannon’s diversity values (per crown-tree) between the primary and secondary forests.
The Bray Curtis dissimilarity index was 0.76 for beetle communities and 0.69 for the epiphyte communities between the primary and secondary forest. The NMDS analysis divided the beetle communities in the primary and secondary forests into distinct clusters (Figure 4A) with a stress value less than 0.01. Further analysis performed using an ANOSIM test resulted in a statistically significant, but with a low level of dissimilarity (ANOSIM statistic R: 0.3169, p = 2e–04). The Betadisper analysis followed by ANOVA showed significant differences in the dispersion of beetles (F = 9.239, P = 0.0049) indicating greater heterogeneity in beetle communities between the forest types. For the vascular epiphyte communities, the NMDS analysis showed a high degree of overlap with a stress value of less than 0.01 (Figure 4B). The ANOSIM test resulted in values indicating similar vascular epiphyte communities in the primary and secondary forest (ANOSIM statistic R: 0.0163, p = 0.2804). Additionally, the Betadisper analysis followed by ANOVA did not show significant differences in the dispersion of epiphytes in the two forest types (F = 1.7289, P = 0.201) also indicating similar communities.
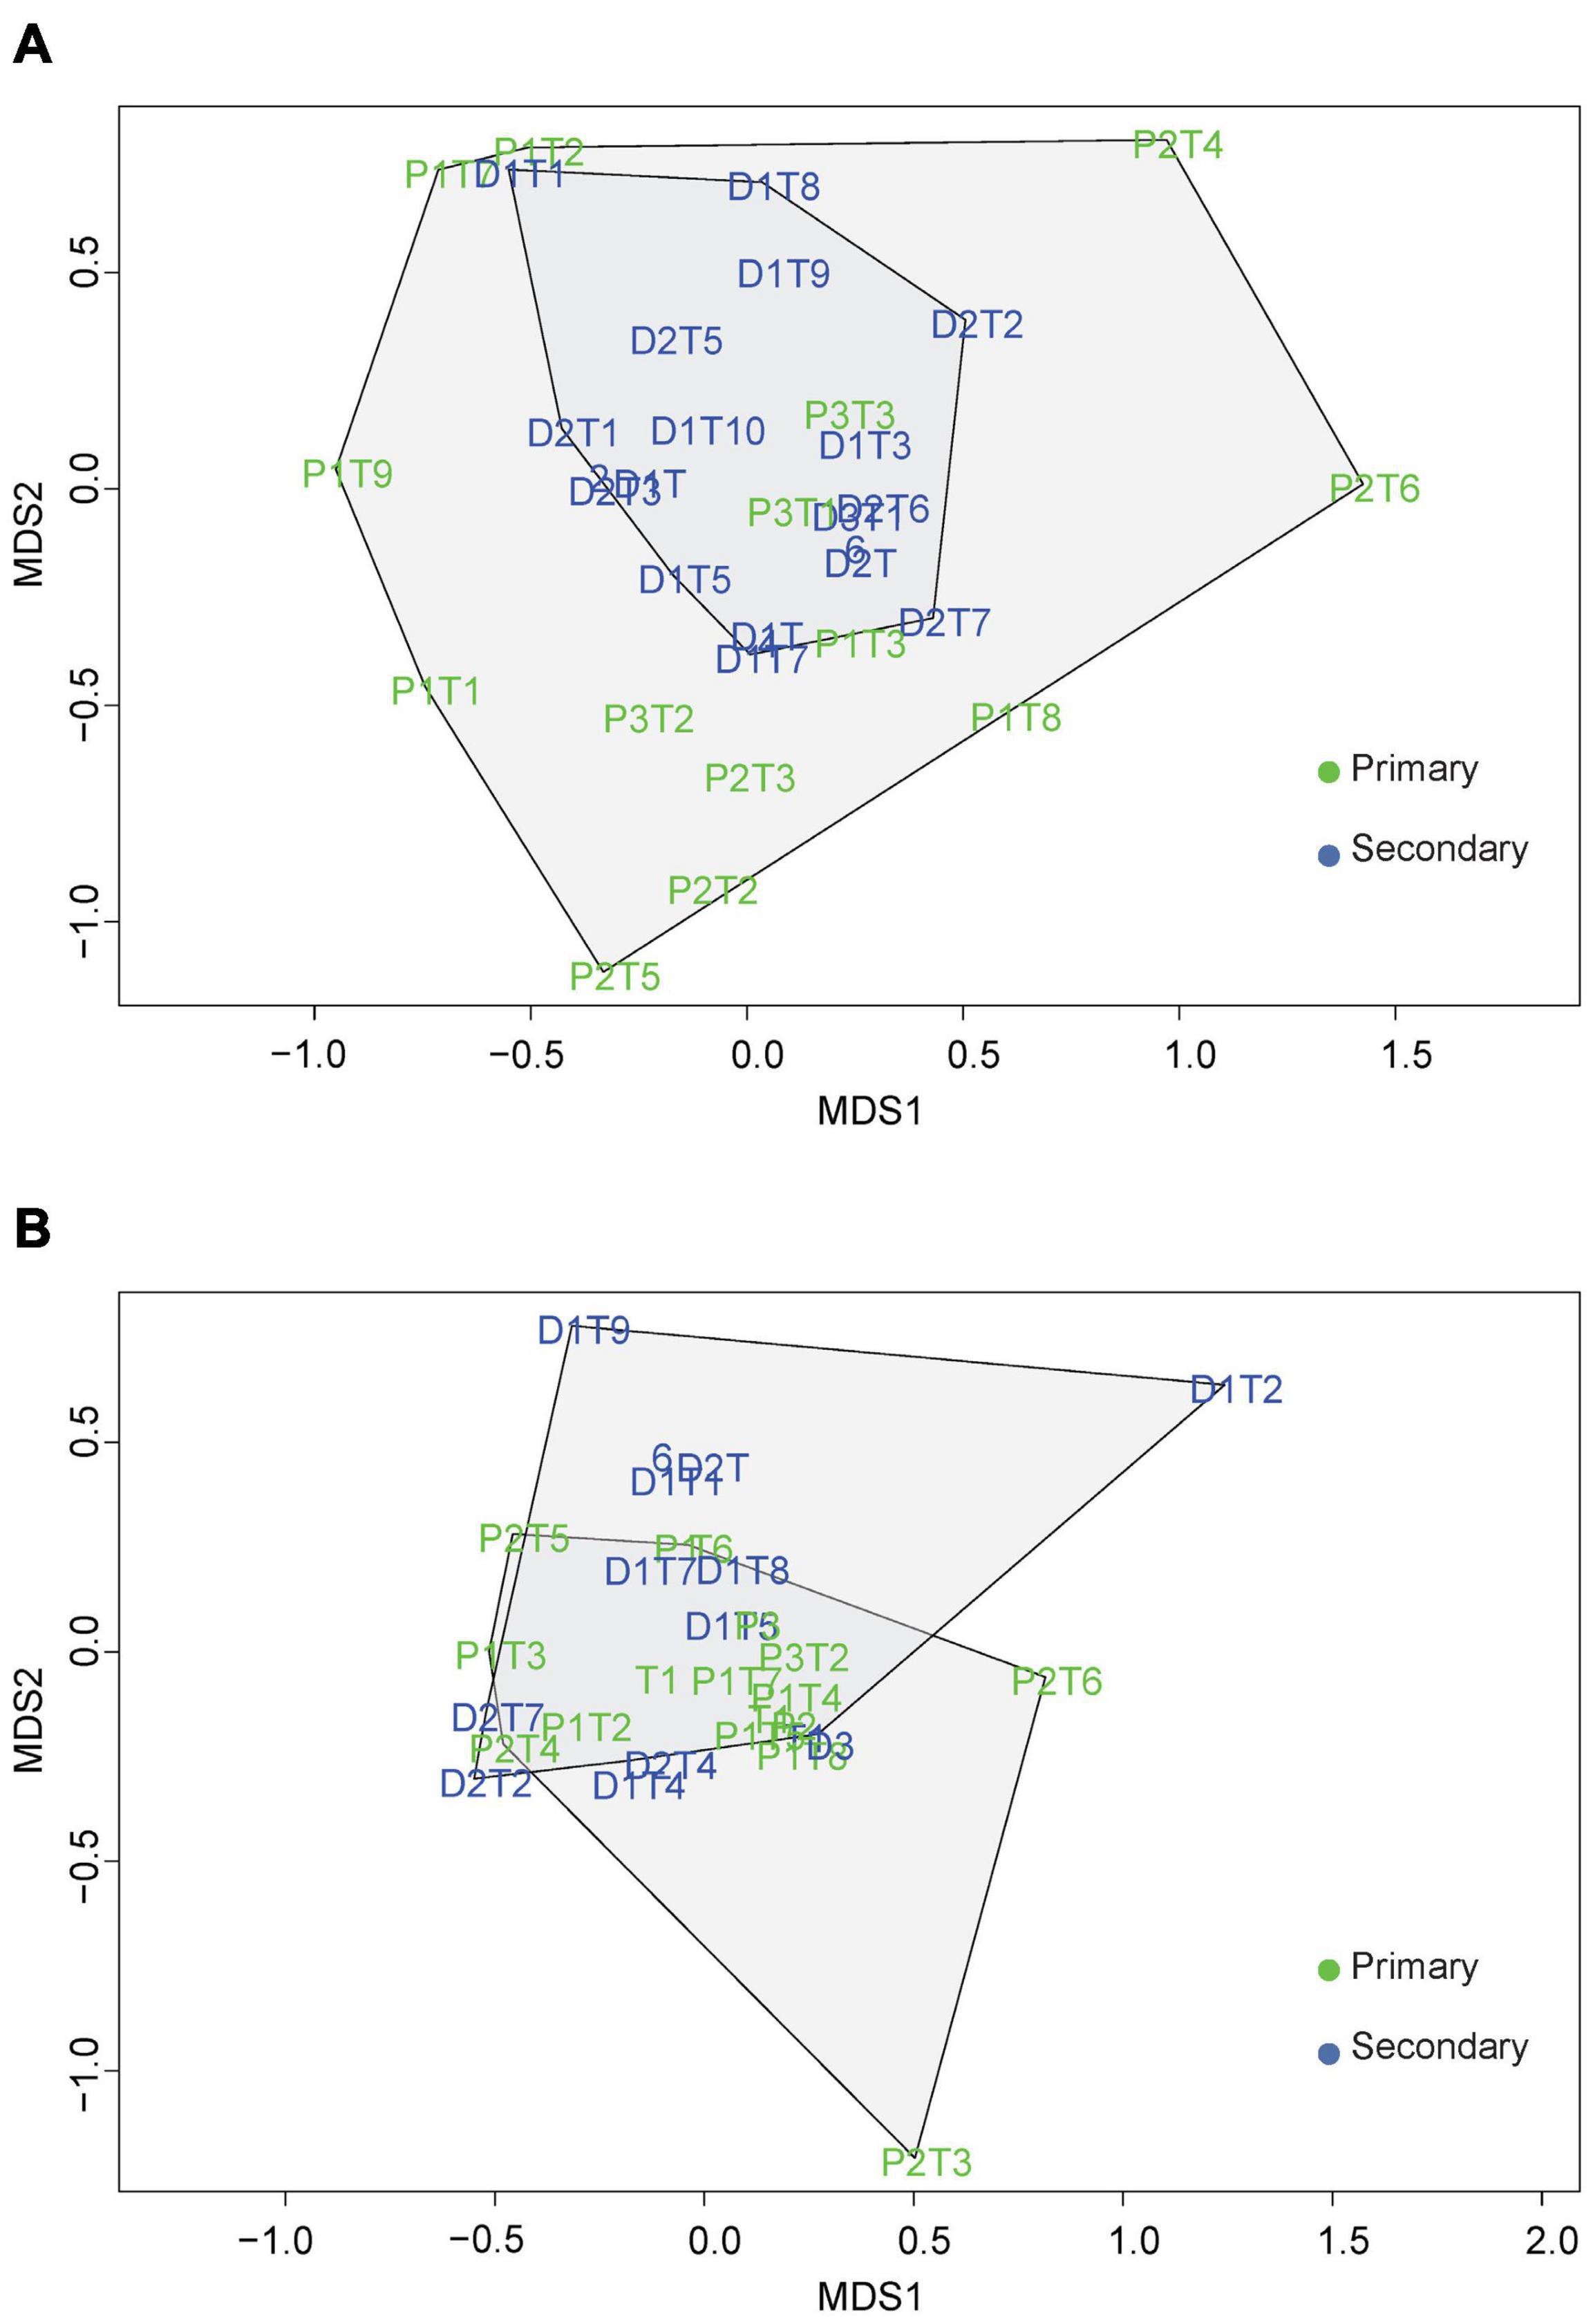
Figure 4. A two-dimensional non-metric multidimensional scaling analysis of the (A) beetle and (B) vascular epiphytes based on the Bray-Curtis dissimilarity matrix.
Discussion
Research on microclimate in ecology has been gaining considerable attention recently (Bramer et al., 2018). Higher temperatures and more intense microclimates in the understorey of logged or secondary forests as compared to primary forests have been well-quantified (Blonder et al., 2018; Jucker et al., 2018; De Frenne et al., 2019). Our work was entirely focused on the canopy and extends earlier findings by showing that the canopy microclimate in selectively logged secondary forests is generally warmer than in primary forests. Our results are consistent with Padmawathe et al. (2004), the only other study focused on Indian forests which reported higher temperature and light intensities at heights of 15–16 m. Sampled trees in the primary forest were surrounded by similar, large neighboring trees. In contrast, sampled trees in the logged sites had a greater inter-tree distance with other trees of comparable size, which is a plausible explanation for our findings.
Our beetle data and findings are consistent with those of Wagner (2000), who also reported significantly higher beetle abundances in a secondary forest from a tropical rainforest site in Uganda with some similarities as our site in terms of forest dynamics and characteristics. Thorat et al. (2016) report higher herbivory levels in the leaves of Macaranga peltata trees in secondary forests in Kalakad (our study region), suggesting higher numbers of insect herbivores such as Aphthona macarangae, a beetle in the Chrysomelidae family. We found eight Chrysomelidae beetles in the secondary forest, whereas only one individual in the primary forest. An explanation for the higher abundance of beetles in the secondary forest could be that more light penetrates the canopy, resulting in higher leaf density and more productivity, which are more palatable to phytophagous beetles (Aide and Zimmerman, 1990). Beetle abundance has also been found to be affected by canopy or crown structure and may be driven by dense and moist foliage (Dial et al., 2006), which is contradictory to our findings. Although we did not account for canopy structure or relative humidity, one would expect higher temperatures and light in secondary forests to result in lower humidity and drier foliage.
Results of the community analysis suggest dissimilar beetle assemblages between the primary and secondary forest types and similar vascular epiphyte assemblages. Wagner (2000) also observed a low degree of overlap in certain beetle families in the canopies of the same tree species between primary and secondary forests. Although we found higher beetle abundances, species richness, and diversity in the secondary forest, the multivariate analysis indicate that the beetle communities are more variable in the primary forests than in the secondary forests. Conversely, the epiphyte community analysis indicated similarity in the communities between both forest types, which was also reported by Barthlott et al. (2001). One reason for the similarity in communities could be because we focused on the same tree species, and host-specificity has been widely observed (Wagner et al., 2015). Studies have reported differences in communities when other host trees were considered, for instance, Woods and DeWalt (2013) report an approximately 40% similarity in epiphyte species composition between a 55-year-old secondary forest (similar age as the secondary forests we sampled) and an old-growth forest.
There is not much work on drivers of beetle communities in the canopy at the microscale, making it difficult to provide insights into drivers of canopy beetle communities. Most of our beetles were small, in the size range of 1–5 mm; Pincebourde et al. (2016) suggest that for small ectotherms, thermal properties of the habitat surface may be drivers of temperature variations experienced by the organism. Disturbances in forests increase the types of microhabitats available, and the more diverse beetle communities may be responding to the vegetation recovery in the under- and midstorey (Perry et al., 2018) rather than the absence of large trees. Further, certain beetles such as dung beetles (which includes Scarabaeidae) may have larger microclimatic variation tolerances than thought (Torppa et al., 2020), and this could extend to other beetle families.
The higher epiphyte abundances and richness were in primary forests were consistent with previous studies (Barthlott et al., 2001; Guzmán-Jacob et al., 2020) and can be explained by the larger and older trees in the primary forest which possess greater microhabitat heterogeneity (Woods et al., 2015). Additionally, the secondary site we chose has seen a higher intensity of logging with higher inter-tree distance (Devy and Davidar, 2001). In India, Padmawathe et al. (2004) observed a strong decline in non-orchid angiosperm epiphyte abundance and richness in secondary forests. However, Seshadri et al. (unpublished) demonstrate a lower epiphyte abundance in primary forest in Kalakad, as compared to selectively logged sites (which were different from the secondary forest plots in this study). Research in the montane tropical rainforests in the Andes has also shown an increase in Orchid abundance and richness and no overall significance in differences in epiphyte abundances and richness in tree canopies with an increase in managed and remnant trees relative to unmanaged mature forest (Larrea and Werner, 2010).
The higher abundances of Bulbophyllum sp.1 in the secondary forest trees indicates that it is a colonizing species, and the “bulbs” are a water-conserving adaptation which could contribute to their establishment in secondary forest trees (Seshadri et al., 2021). Previous explanations for lesser epiphytes in disturbed forests (Barthlott et al., 2001) or differences in communities (Larrea and Werner, 2010) have been attributed to drier and more sunlit microhabitats. Our results suggest that light and temperature may not be the primary factors influencing epiphyte communities. However, the effects of relative humidity are yet to be observed.
Our research design employed a “staggered” deployment of HOBOs, i.e., HOBOs in the primary and secondary forest trees were deployed on different days. This was the most practical way to make the best use of our time, with limited manpower as the process of rigging the tree, accessing the crown, and collecting samples is laborious. An ideal research design would have deployed an equal number of HOBOs and funnel traps in the primary and secondary forest canopies with a complete overlap in the deployment duration. Methods in microclimate ecology vary, as sensors and data loggers used for measurements differ in aspects, making comparisons between datasets difficult (Bramer et al., 2018). We used Onset HOBOs (HOBO pendant logger), a commonly used economical sensor with precisions comparable to more sophisticated sensors (Long et al., 2012). Hence, our method can be easily replicated for spatially (both horizontally and vertically) denser measurements. Future research could deploy sensors at a higher density, with multiple sensors on each tree. Research could also examine coupling between air temperature and leaf surface temperature, and their impacts on arthropods (Pincebourde and Woods, 2012).
Our short-term study provides an insight into the microclimatic differences between primary and secondary tropical wet forest canopies, a first for the southern Western Ghats. Further, we provide an important baseline for future research on beetles in the region. Long-term studies on seasonal fluctuations in beetle communities, comparisons with trends in canopy tree phenology, and the role of crown structure should reveal much more about the ecology of beetles in tropical wet forests.
Data Availability Statement
The datasets presented in this study can be found in online repositories. The names of the repository/repositories and accession number(s) can be found below: https://github.com/atreebangalore/rubinsagar.
Author Contributions
RS and MD: conceptualization, funding acquisition, project administration, and writing—review and editing. RS: formal analysis, investigation, visualization, and writing the original draft. Both authors contributed to the article and approved the submitted version.
Funding
This study was funded through a Rufford First Small Grant (29821-1) by the Rufford Foundation to RS.
Conflict of Interest
The authors declare that the research was conducted in the absence of any commercial or financial relationships that could be construed as a potential conflict of interest.
Publisher’s Note
All claims expressed in this article are solely those of the authors and do not necessarily represent those of their affiliated organizations, or those of the publisher, the editors and the reviewers. Any product that may be evaluated in this article, or claim that may be made by its manufacturer, is not guaranteed or endorsed by the publisher.
Acknowledgments
We thank the entire staff at the Agasthyamalai Community Conservation Center (ACCC), ATREE for logistical support and P. Mahesh, Thalavaipandi, Satheesh S., and particularly Tamilalagan for supporting RS with the fieldwork. We thank Chiti Arvind for helping with photographing and storing the beetle specimens, and Naman Goyal for lending camera equipment. Lastly, we are very grateful to the Rufford Foundation for funding RS (29821-1) and the Tamil Nadu Forest Department for allowing the fieldwork to be conducted and Tamil Nadu Electricity Board for providing quarters to the researchers.
Supplementary Material
The Supplementary Material for this article can be found online at: https://www.frontiersin.org/articles/10.3389/ffgc.2022.734448/full#supplementary-material
Supplementary Figure 1 | A map showing the study area. The deep orange circle in the top left image (inset) shows the study area in India. The bottom left image (inset) shows the sampled site within KMTR. The orange rhombuses represent the trees sampled in the primary forest and the red circles represent the trees sampled in the secondary forest, with the background of a satellite image of the area (Imagery © 2022 CNES/Airbus, Landsat/Copernicus, Maxar Technologies, Map data © 2022).
References
Aide, T. M., and Zimmerman, J. K. (1990). Patterns of insect herbivory, growth, and survivorship in juveniles of a neotropical liana. Ecology 71, 1412–1421. doi: 10.2307/1938278
Barthlott, W., Schmit-Neuerburg, V., Nieder, J., and Engwald, S. (2001). Diversity and abundance of vascular epiphytes: a comparison of secondary vegetation and primary montane rain forest in the venezuelan andes. Plant Ecol. 152, 145–156.
Basset, Y., Cizek, L., Cuenoud, P., Didham, R. K., Guilhaumon, F., Missa, O., et al. (2012). Arthropod diversity in a tropical forest. Science 338, 1481–1484. doi: 10.1126/science.1226727
Basset, Y., Missa, O., Alonso, A., Miller, S. E., Curletti, G., De Meyer, M., et al. (2008). Changes in arthropod assemblages along a wide gradient of disturbance in gabon. Conserv. Biol. 22, 1552–1563. doi: 10.1111/j.1523-1739.2008.01017.x
Benítez, Á, Prieto, M., González, Y., and Aragón, G. (2012). Effects of tropical montane forest disturbance on epiphytic macrolichens. Sci. Total Environ. 441, 169–175. doi: 10.1016/j.scitotenv.2012.09.072
Blonder, B., Both, S., Coomes, D. A., Elias, D., Jucker, T., Kvasnica, J., et al. (2018). Extreme and Highly Heterogeneous Microclimates in Selectively Logged Tropical Forests. Front. For. Glob. Change 1:5. doi: 10.3389/ffgc.2018.00005
Bramer, I., Anderson, B. J., Bennie, J., Bladon, A. J., De Frenne, P., Hemming, D., et al. (2018). Advances in monitoring and modelling climate at ecologically relevant scales. Adv. Ecol. Res. 28, 101–161. doi: 10.1016/bs.aecr.2017.12.005
Caillon, R., Suppo, C., Casas, J., Arthur Woods, H., and Pincebourde, S. (2014). Warming decreases thermal heterogeneity of leaf surfaces: implications for behavioural thermoregulation by arthropods. Funct. Ecol. 28, 1449–1458. doi: 10.1111/1365-2435.12288
Chen, J., Saunders, S. C., Crow, T. R., Naiman, R. J., Brosofske, K. D., Mroz, G. D., et al. (1999). Microcliminat Feorest ecosystem and landscape ecology. Conserv. Biol. 10, 854–862.
Crill, W. D., Huey, R. B., and Gilchrist, G. W. (1996). Within- and between-generation effects of temperature on the morphology and physiology of Drosophila melanogaster. Evolution 50, 1205–1218. doi: 10.2307/2410661
Cruz-Angón, A., Baena, M. L., and Greenberg, R. (2009). The contribution of epiphytes to the abundance and species richness of canopy insects in a Mexican coffee plantation. J. Trop. Ecol. 25, 453–463. doi: 10.1017/S0266467409990125
Davies, K. F., and Margules, C. R. (1998). Effects of habitat fragmentation on carabid beetles: experimental evidence. J. Anim. Ecol. 67, 460–471. doi: 10.1046/j.1365-2656.1998.00210.x
De Frenne, P., Lenoir, J., Luoto, M., Scheffers, B. R., Zellweger, F., Aalto, J., et al. (2021). Forest microclimates and climate change: importance, drivers and future research agenda. Glob. Change Biol. 27, 2279–2297. doi: 10.1111/gcb.15569
De Frenne, P., Rodriguez-Sanchez, F., Coomes, D. A., Baeten, L., Verstraeten, G., Vellend, M., et al. (2013). Microclimate moderates plant responses to macroclimate warming. Proc. Natl. Acad. Sci. U.S.A. 110, 18561–18565. doi: 10.1073/pnas.1311190110
De Frenne, P., Zellweger, F., Rodríguez-Sánchez, F., Hylander, K., Luoto, M., Vellend, M., et al. (2019). Global buffering of temperatures under forest canopies. Nat. Ecol. Evol. 3, 744–749. doi: 10.1038/s41559-019-0842-1
Devy, M. S. (2006). Effects Of Fragmentation On A Keystone Tree Species In The Rainforest Of Kalakad-Mundanthurai Tiger Reserve, India. London: Rufford.
Devy, M. S., and Davidar, P. (2001). Reponse of wet forest butterflies to selective logging in kalakad-mundanthurai tiger reserve: implications for conservation. Curr. Sci. 80, 400–405.
Devy, M. S., and Davidar, P. (2003). Pollination systems of trees in Kakachi, a mid-elevation wet evergreen forest in Western Ghats. India. Am. J. Bot. 90, 650–657. doi: 10.3732/ajb.90.4.650
Dial, R. J., Ellwood, M. D. F., Turner, E. C., and Foster, W. A. (2006). Arthropod abundance, canopy structure, and microclimate in a bornean lowland tropical rain forest1. Biotropica 38, 643–652. doi: 10.1111/j.1744-7429.2006.00181.x
Díaz, I. A., Sieving, K. E., Peña-Foxon, M., and Armesto, J. J. (2012). A field experiment links forest structure and biodiversity: epiphytes enhance canopy invertebrates in Chilean forests. Ecosphere 3:art5. doi: 10.1890/ES11-00168.1
Erwin, T. L. (1982). Tropical forests: their richness in Coleóptera and other arthropod species. Coleopt. Bull. 36, 74–75.
Ewers, R. M., and Banks-Leite, C. (2013). Fragmentation impairs the microclimate buffering effect of tropical forests. PLoS One 8:e58093. doi: 10.1371/journal.pone.0058093
Feer, F., and Hingrat, Y. (2005). Effects of forest fragmentation on a dung beetle community in french guiana. Conserv. Biol. 19, 1103–1112. doi: 10.1111/j.1523-1739.2005.00087.x
Ganesh, T., Ganesan, R., Devy, M. S., Davidar, P., and Bawa, K. S. (1996). Assessment of plant biodiversity at a mid-elevation evergreen forest of Kalakad–Mundanthurai Tiger Reserve, Western Ghats, India. Curr. Sci. 71, 379–392.
Ganesan, R., and Livingstone, C. (2001). Checklist of Orchids from a mid elevation evergreen forest at Kakachi-Kodayar. Kalakkad-Mundanthurai Tiger Reserve, Agasthyamalai, Southern Western Ghats. Zoos Print J. 16, 445–446. doi: 10.11609/jott.zpj.16.3.445-6
Ganesh, T., Devy, S., and Ganesan, R. (2017). “Rainforest dynamics in a changing world: monitoring plants, animals and climate at kalakad mundanthurai tiger reserve, Tamil Nadu,” in Transcending Boundaries: Reflecting On Twenty Years Of Action And Research At ATREE, eds A. J. Hiremath, N. D. Rai, and A. Siddhartha (Bangalore: Ashoka Trust for Research in Ecology and the Environment), 72–79.
Gradstein, S. R., Homeier, J., and Gansert, D. (eds) (2008). The Tropical Mountain Forest: Patterns And Processes In A Biodiversity Hotspot. Göttingen: Göttingen University Press. doi: 10.17875/gup2008-702
Grossner, M. M. (2009). Light intensity affects spatial distribution of Heteroptera in deciduous forests. Eur. J. Entomol. 106, 241–252. doi: 10.14411/eje.2009.032
Guzmán-Jacob, V., Zotz, G., Craven, D., Taylor, A., Krömer, T., Monge-González, M. L., et al. (2020). Effects of forest-use intensity on vascular epiphyte diversity along an elevational gradient. Divers. Distrib. 26, 4–15. doi: 10.1111/ddi.12992
IPCC (2021). “Summary for policymakers,” in Climate Change 2021: The Physical Science Basis. Contribution of Working Group I to the Sixth Assessment Report of the Intergovernmental Panel on Climate Change, eds V. Masson-Delmotte, P. Zhai, A. Pirani, S. L. Connors, C. Péan, S. Berger, et al. (Cambridge: Cambridge University Press).
Jucker, T., Hardwick, S. R., Both, S., Elias, D. M. O., Ewers, R. M., Milodowski, D. T., et al. (2018). Canopy structure and topography jointly constrain the microclimate of human-modified tropical landscapes. Glob. Change Biol. 24, 5243–5258. doi: 10.1111/gcb.14415
Jung, J.-K., Lee, S. K., Lee, S.-I., and Lee, J.-H. (2018). Trait-specific response of ground beetles (Coleoptera: Carabidae) to forest fragmentation in the temperate region in Korea. Biodivers. Conserv. 27, 53–68. doi: 10.1007/s10531-017-1421-x
Kassambara, A. (2020). Rstatix: Pipe-Friendly Framework for Basic Statistical Tests. R package version 0.5.0. Available online at: https://CRAN.R-project.org/package=rstatix (accessed May 12, 2021).
Klein, B. C. (1989). Effects of forest fragmentation on dung and carrion beetle communities in central Amazonia. Ecology 70, 1715–1725. doi: 10.2307/1938106
Larrea, M. L., and Werner, F. A. (2010). Response of vascular epiphyte diversity to different land-use intensities in a neotropical montane wet forest. For. Ecol. Manag. 260, 1950–1955. doi: 10.1016/j.foreco.2010.08.029
Laube, S., and Zotz, G. (2003). Which abiotic factors limit vegetative growth in a vascular epiphyte? Funct. Ecol. 17, 598–604. doi: 10.1046/j.1365-2435.2003.00760.x
Li, D. (2018). HillR: taxonomic, functional, and phylogenetic diversity and similarity through Hill Numbers. J. Open Source Softw. 3:1041. doi: 10.21105/joss.01041
Long, M. H., Rheuban, J. E., Berg, P., and Zieman, J. C. (2012). A comparison and correction of light intensity loggers to photosynthetically active radiation sensors: comparison of light loggers and PAR sensors. Limnol. Oceanogr. Methods 10, 416–424. doi: 10.4319/lom.2012.10.416
Moffett, M. W. (2006). What’s “Up”? A critical look at the basic terms of canopy Biology1. Biotropica 32, 569–596. doi: 10.1111/j.1744-7429.2000.tb00506.x
Mohanraj, T., Rajendran, A., Devy, M. S., and Ganesan, R. (2014). Invertebrates in canopy and ground organic matter in a tropical wet evergreen forest of southern Western Ghats, India. Acad. J. Entomol. 7, 32–37.
Myers, N., Russel, A., Cristina, G., Gustavo, A. B., and da Fonsesc Kent, J. (2000). Biodiversity hotspots for conservation priorities. Nature 403, 853–858. doi: 10.1038/35002501
Nadkarni, N. M. (1994). Diversity of species and interactions in the upper tree canopy of forest ecosystems. Am. Zool. 34, 70–78. doi: 10.1093/icb/34.1.70
Nadkarni, N. M., Schaefer, D., Matelson, T. J., and Solano, R. (2004). Biomass and nutrient pools of canopy and terrestrial components in a primary and a secondary montaine cloud forest. Costa Rica. For. Ecol. Manag. 198, 223–236. doi: 10.1016/j.foreco.2004.04.011
Nichols, E., Larsen, T., Spector, S., Davis, A. L., Escobar, F., Favila, M., et al. (2007). Global dung beetle response to tropical forest modification and fragmentation: a quantitative literature review and meta-analysis. Biol. Conserv. 137, 1–19. doi: 10.1016/j.biocon.2007.01.023
Oksanen, J., Guillaume Blanchet, F., Friendly, M., Kindt, R., Legendre, P., McGlinn, D., et al. (2019). Vegan: Community Ecology Package. R Package Version 2.5-6. Available online at: https://CRAN.R-project.org/package=vegan (accessed May 12, 2021).
Padmawathe, R., Qureshi, Q., and Rawat, G. S. (2004). Effects of selective logging on vascular epiphyte diversity in a moist lowland forest of Eastern Himalaya, India. Biol. Conserv. 119, 81–92. doi: 10.1016/j.biocon.2003.10.024
Parthasarathy, N. (1988). A phytogeographic analysis of the flora of kalakad reserve forest Western Ghats. J. Indian Bot. Sci. 67, 342–346.
Perry, D. R. (1978). A method of access into the crowns of emergent and canopy trees. Biotropica 10, 155–157. doi: 10.2307/2388019
Perry, K. I., Wallin, K. F., Wenzel, J. W., and Herms, D. A. (2018). Forest disturbance and arthropods: small-scale canopy gaps drive invertebrate community structure and composition. Ecosphere 9, 1–19.
Pincebourde, S., and Woods, H. A. (2012). Climate uncertainty on leaf surfaces: the biophysics of leaf microclimates and their consequences for leaf-dwelling organisms. Funct. Ecol. 26, 844–853. doi: 10.1111/j.1365-2435.2012.02013.x
Pincebourde, S., Murdock, C. C., Vickers, M., and Sears, M. W. (2016). Fine-Scale microclimatic variation can shape the responses of organisms to global change in both natural and urban environments. Integr. Comp. Biol. 56, 45–61. doi: 10.1093/icb/icw016
Piyaphongkul, J., Pritchard, J., and Bale, J. (2012). Heat stress impedes development and lowers fecundity of the brown planthopper nilaparvata lugens (Stål). PLoS One 7:e47413. doi: 10.1371/journal.pone.0047413
Salomão, R. P., Brito, L. C., Iannuzzi, L., Lira, A. F. A., and Albuquerque, C. M. R. (2019). Effects of environmental parameters on beetle assemblage in a fragmented tropical rainforest of South America. J. Insect. Conserv. 23, 111–121. doi: 10.1007/s10841-018-00120-y
Santos, B. A., and Benítez-Malvido, J. (2012). Insect herbivory and leaf disease in natural and human disturbed habitats: lessons from early-successional heliconia herbs: habitat disturbance and biotic damage. Biotropica 44, 53–62. doi: 10.1111/j.1744-7429.2011.00765.x
Schroeder, B., Buddle, C. M., and Saint-Germain, M. (2009). Activity of flying beetles (Coleoptera) at two heights in canopy gaps and intact forests in a hardwood forest in Quebec. Can. Entomol. 141, 515–520. doi: 10.4039/n09-022
Senior, R. A., Hill, J. K., González del Pliego, P., Goode, L. K., and Edwards, D. P. (2017). A pantropical analysis of the impacts of forest degradation and conversion on local temperature. Ecol. Evol. 7, 7897–7908. doi: 10.1002/ece3.3262
Seshadri, K. S., Ganesan, R., and Devy, S. M. (2021). Persistent effects of historical selective logging on a vascular epiphyte assemblage in the forest canopy of the Western Ghats, India. Front. For. Glob. Change 4:727422. doi: 10.3389/ffgc.2021.727422
Stancato, G. C., Mazzafera, P., and Buckeridge, M. S. (2002). Effects of light stress on the growth of the epiphytic orchid Cattleya forbesii Lindl. X Laelia tenebrosa Rolfe. Braz. J. Bot. 25, 229–235. doi: 10.1590/s0100-84042002000200011
Stork, N. E., and Grimbacher, P. S. (2006). Beetle assemblages from an Australian tropical rainforest show that the canopy and the ground strata contribute equally to biodiversity. Proc. R. Soc. B 273, 1969–1975. doi: 10.1098/rspb.2006.3521
Stuntz, S., Simon, U., and Zotz, G. (2002a). Rainforest air-conditioning: the moderating influence of epiphytes on the microclimate in tropical tree crowns. Int. J. Biometeorol. 46, 53–59. doi: 10.1007/s00484-001-0117-8
Stuntz, S., Ziegler, C., Simon, U., and Zotz, G. (2002b). Diversity and structure of the arthropod fauna within three canopy epiphyte species in central Panama. J. Trop. Ecol. 18, 161–176. doi: 10.1017/S0266467402002110
Thorat, O., Mukherjee, R., Ramanujam, R. V., Aditya, V., and Devy, M. S. (2016). Patterns of herbivory on Macaranga peltata, a pioneer species in the mid-elevation forests of the Western Ghats, India. Curr. Sci. 111, 790–792.
Torppa, K. A., Wirta, H., and Hanski, I. (2020). Unexpectedly diverse forest dung beetle communities in degraded rain forest landscapes in Madagascar. Biotropica 52, 351–365. doi: 10.1111/btp.12767
Ulyshen, M. D., and Hanula, J. L. (2007). A Comparison of the Beetle (Coleoptera) fauna captured at two heights above the ground in a north american temperate deciduous forest. Am. Midland Nat. 158, 260–278. doi: 10.1674/0003-0031(2007)158[260:acotbc]2.0.co;2
Vaz, A. P. A., Figueiredo-Ribeiro, R., de, C. L., and Kerbauy, G. B. (2004). Photoperiod and temperature effects on in vitro growth and flowering of P. pusilla, an epiphytic orchid. Plant Physiol. Biochem. 42, 411–415. doi: 10.1016/j.plaphy.2004.03.008
von Arx, G., Graf Pannatier, E., Thimonier, A., and Rebetez, M. (2013). Microclimate in forests with varying leaf area index and soil moisture: potential implications for seedling establishment in a changing climate. J. Ecol. 101, 1201–1213. doi: 10.1111/1365-2745.12121
Wagner, K., Mendieta-Leiva, G., and Zotz, G. (2015). Host specificity in vascular epiphytes: a review of methodology, empirical evidence and potential mechanisms. AoB Plants 7:plu092. doi: 10.1093/aobpla/plu092
Wagner, T. (2000). Influence of forest type and tree species on canopy-dwelling beetles in budongo forest, Uganda. Biotropica 32, 502–514. doi: 10.1007/s00442-002-1010-9
Wardhaugh, C. W., Stork, N. E., and Edwards, W. (2013). Specialization of rainforest canopy beetles to host trees and microhabitats: not all specialists are leaf-feeding herbivores: host and microhabitat specificity of beetles. Biol. J. Linn. Soc. Lond. 109, 215–228. doi: 10.1111/bij.12029
Wickham, H., François, R., Henry, L., and Müller, K. (2019). Dplyr: A Grammar of Data Manipulation. R package version 0.8.3. Available online at: https://CRAN.R-project.org/package=dplyr (accessed May 10, 2021).
Woods, H. A. (2013). Ontogenetic changes in the body temperature of an insect herbivore. Funct. Ecol. 27, 1322–1331. doi: 10.1111/1365-2435.12124
Woods, C. L. (2017). Primary ecological succession in vascular epiphytes: the species accumulation model. Biotropica 49, 452–460. doi: 10.1111/btp.12443
Woods, C. L., and DeWalt, S. J. (2013). The conservation value of secondary forests for vascular epiphytes in central panama. Biotropica 45, 119–127. doi: 10.1111/j.1744-7429.2012.00883.x
Woods, C. L., Cardelús, C. L., and DeWalt, S. J. (2015). Microhabitat associations of vascular epiphytes in a wet tropical forest canopy. J. Ecol. 103, 421–430. doi: 10.1111/1365-2745.12357
Zellweger, F., Coomes, D., Lenoir, J., Depauw, L., Maes, S. L., Wulf, M. S., et al. (2019). Seasonal drivers of understorey temperature buffering in temperate deciduous forests across Europe. Glob. Ecol. Biogeogr. 28, 1774–1786. doi: 10.1111/geb.12991
Zhang, S., Cao, Z., Wang, Q., Zhang, F., and Liu, T.-X. (2014). Exposing eggs to high temperatures affects the development, survival and reproduction of Harmonia axyridis. J. Therm. Biol. 39, 40–44. doi: 10.1016/j.jtherbio.2013.11.007
Zotz, G. (2013). The systematic distribution of vascular epiphytes - a critical update: vascular epiphytes. Bot. J. Linn. Soc. 171, 453–481. doi: 10.1111/boj.12010
Keywords: canopy, beetles, vascular epiphyte, microclimate, tropical wet forest
Citation: Sagar R and Devy MS (2022) The Impact of Anthropogenic Disturbance to the Canopy Microclimate of Tropical Forests in the Southern Western Ghats, India. Front. For. Glob. Change 5:734448. doi: 10.3389/ffgc.2022.734448
Received: 01 July 2021; Accepted: 03 March 2022;
Published: 13 April 2022.
Edited by:
Akihiro Nakamura, Xishuangbanna Tropical Botanical Garden (CAS), ChinaReviewed by:
Adrià Barbeta, University of Barcelona, SpainSven Peter Batke, Edge Hill University, United Kingdom
Copyright © 2022 Sagar and Devy. This is an open-access article distributed under the terms of the Creative Commons Attribution License (CC BY). The use, distribution or reproduction in other forums is permitted, provided the original author(s) and the copyright owner(s) are credited and that the original publication in this journal is cited, in accordance with accepted academic practice. No use, distribution or reproduction is permitted which does not comply with these terms.
*Correspondence: Rubin Sagar, cnViaW4uc2FnYXJAZ21haWwuY29t