 Banzragch Bat-Enerel
 Robert Weigel
 Christoph Leuschner
- Plant Ecology, University of Göttingen, Göttingen, Germany
Recent severe droughts and climate change projections have caused rising worries about the impacts of a warmer and drier climate on forests and the future of timber production. While recent trends in thermal and hydrometeorological climate factors have been studied in many regions on earth, less is known about long-term change in climate variables most relevant for tree health and productivity, i.e., temperature (T), precipitation (P), climatic water balance (CWB), and SPEI aridity index in early and mid-summer, when leaf unfolding and peak stem growth take place. Here, we analyze T, P, CWB, and SPEI trends separately for all growing season months (April-September) during the 1948–1982 (before the recent warming) and 1983–2017 periods (after the onset of warming) in their spatial variation across the North German Lowlands based on a dense climate station network. While trends in thermal and hydrometeorological variables were weak from 1948 to 1982, we find a significant decrease in April precipitation and increase in July precipitation from 1983 to 2017 throughout much of the study region, while June precipitation has decreased locally by 10 mm or more (or up to 20%). The cumulated growing-season CWB has deteriorated by up to 30 mm from 1948–1982 to 1983–2017 in most of the region except at the North Sea coast, where it became more favorable. Recent climate aridification is more pronounced in the drier South-east of the study region with a more continental climate, as indicated by stronger negative P, CWB, and SPEI trends for April, May, and June. We conclude that water availability especially in the physiologically important months April and June has deteriorated in the larger part of the North German Lowlands since the 1980s, increasingly impairing hydrometeorological forest growth conditions. The identified trends may serve as early-warning signals of anticipated future loss in tree vitality.
Introduction
Drought is one of the most societally relevant weather and climate phenomena with far-reaching implications for water management, agriculture, food security, and human health (Orlowsky and Seneviratne, 2013). In many regions on earth, droughts impair agricultural production and threaten forest vitality and timber yield with consequences for food and wood supply and regional and global carbon cycles (Ciais et al., 2005; Allen et al., 2015; Anderegg et al., 2015). Evidence from many regions on earth suggests that recent decreases in dry-season water availability are at least partly caused by anthropogenic climate change (Padron et al., 2020).
The increasing impact of dry spells on human health, the economy, and natural systems in a warming world has triggered efforts to model the future frequency and severity of droughts and heat under different emission scenarios (Fischer and Schär, 2010; Jacob et al., 2014, 2018; Roudier et al., 2016; Spinoni et al., 2018; Kroll et al., 2022). These efforts build on, and are complemented by, studies analyzing past trends in climate variables determining drought intensity, notably summer precipitation, potential evapotranspiration, and climatic aridity, to assess the frequency and severity of current drought events in a historical context (Hanel et al., 2018; Büntgen et al., 2021). The latter information is valuable especially for forestry, as it may allow conclusions on a possible long-term deterioration of the trees’ growing conditions in different regions of Europe and elsewhere.
Central Europe is generally not considered a drought-prone region in comparison with more continental Eastern Europe or the Mediterranean. However, during the past decades, Central Europe has experienced a series of severe droughts that caused crown defoliation and tree and forest dieback at unseen extent (Senf et al., 2020; Braun et al., 2021; Gazol and Camarero, 2021). This has triggered research in the climatic drivers of forest destabilization and dieback (Schuldt et al., 2020; Braun et al., 2021). Yet, most studies of recent climate trends explore changes in thermal and hydrometeorological variables bulked over several summer months or the entire growing season (Kaspar et al., 2013; IPCC, 2021), which may not be focused enough to explain patterns of forest health decline. The growth of temperate deciduous trees is most responsive to the thermal conditions and water availability of only a few summer months, in Central Europe typically June and July during peak growth, and April and May during leaf unfolding (Zimmermann et al., 2015; van der Maaten et al., 2018). At least for Central European broadleaf tree species, these specific thermal and hydrometeorological conditions in the first half of the growing season are far more influential than autumn, winter, and spring temperatures and precipitation (Fuchs et al., 2021), as well as soil chemistry and fertility (Leuschner and Ellenberg, 2017). This is also valid for European beech (Fagus sylvatica L.), the most important tree species of the natural forest vegetation of Central Europe (Scharnweber et al., 2011; Zimmermann et al., 2015; Knutzen et al., 2017). A few published month-wise climate trend analyses have demonstrated that the different summer months often have followed quite different long-term trends during the late twentieth and early twenty-first century, and these trends may vary considerably across regions in Central Europe (Schönwiese and Rapp, 1997; Trömel and Schönwiese, 2007; Schönwiese and Janoschitz, 2008). Thus, the analysis of regionalized trends of drought-related climate variables for the physiologically most important months may elucidate long-term changes in trees’ growing conditions better than climate trend analyses for entire seasons or the full year that may miss biologically important changes in water availability and heat exposure during phenological phases with highest tree sensitivity.
Here, we analyze multi-decadal trends in important thermal and hydrometeorological variables with assumed relevance for tree growth and vitality for the North German Lowlands and explore their regional variation across an area of c. 140,000 km2 size. We use high-resolution gridded climate data provided by the German Weather Service (Deutscher Wetterdienst, DWD) for the 70 years from 1948 to 2017. The observation interval was split into two 35-year periods (1948–1982, 1983–2017) to contrast climate trends in the period of rapid warming since the early 1980s with the preceding more stable epoch. We focus on the six physiologically most important months April to September and analyze trends in mean monthly temperatures, monthly precipitation totals, monthly sums of the climatic water balance, and mean monthly climate aridity in their geographical variation at 30 study sites in beech forests spread across a pronounced 400 km-long precipitation and climate continentality gradient in the North German Lowlands. Special attention was paid to summer months with key importance for beech leaf-out and radial growth, notably April, June, and July. The following questions guided our research: (i) How did the forest growth climate change since the early 1980s in comparison to climate variation between 1948 and 1982? (ii) Are the recent warming and drying trends more pronounced in regions with more continental, drier climates than closer to the coast? (iii) Are regions with growing summer aridity but stable or increasing summer precipitation discernable from regions, where a summer precipitation decrease is reinforcing the increase in climatic aridity?
Materials and Methods
Climate Data
Our study region includes the entire lowlands of northern Germany on Pleistocene substrates between the Dutch border in the west and the Polish border in the east, stretching from 7 to 13°E and from 51 to 54°N and covering the federal states of Lower Saxony, Schleswig-Holstein, Hamburg, Saxony-Anhalt, Mecklenburg-Vorpommern, Berlin, and Brandenburg. The region’s landscape is shaped by deposits of the last (Weichselian) and penultimate (Saalian) glacials and mostly is situated at elevations < 100 m a.s.l., with maximum elevations reaching 150 m a.s.l. Climatic conditions change from a cool-temperate oceanic climate near the North Sea coast to a temperate sub-continental climate near the Polish border. The climate gradient is associated with a decrease in mean annual precipitation (MAP) from > 840 in the NW to < 550 mm in the SE (Figure 1), and a steep increase in the deficit of growing-season climatic water balance in this direction (mean of 1991–2018 period; Supplementary Figure 1). Mean annual temperature (MAT) varies less across the gradient (9.0–10.0°C; Table 1).
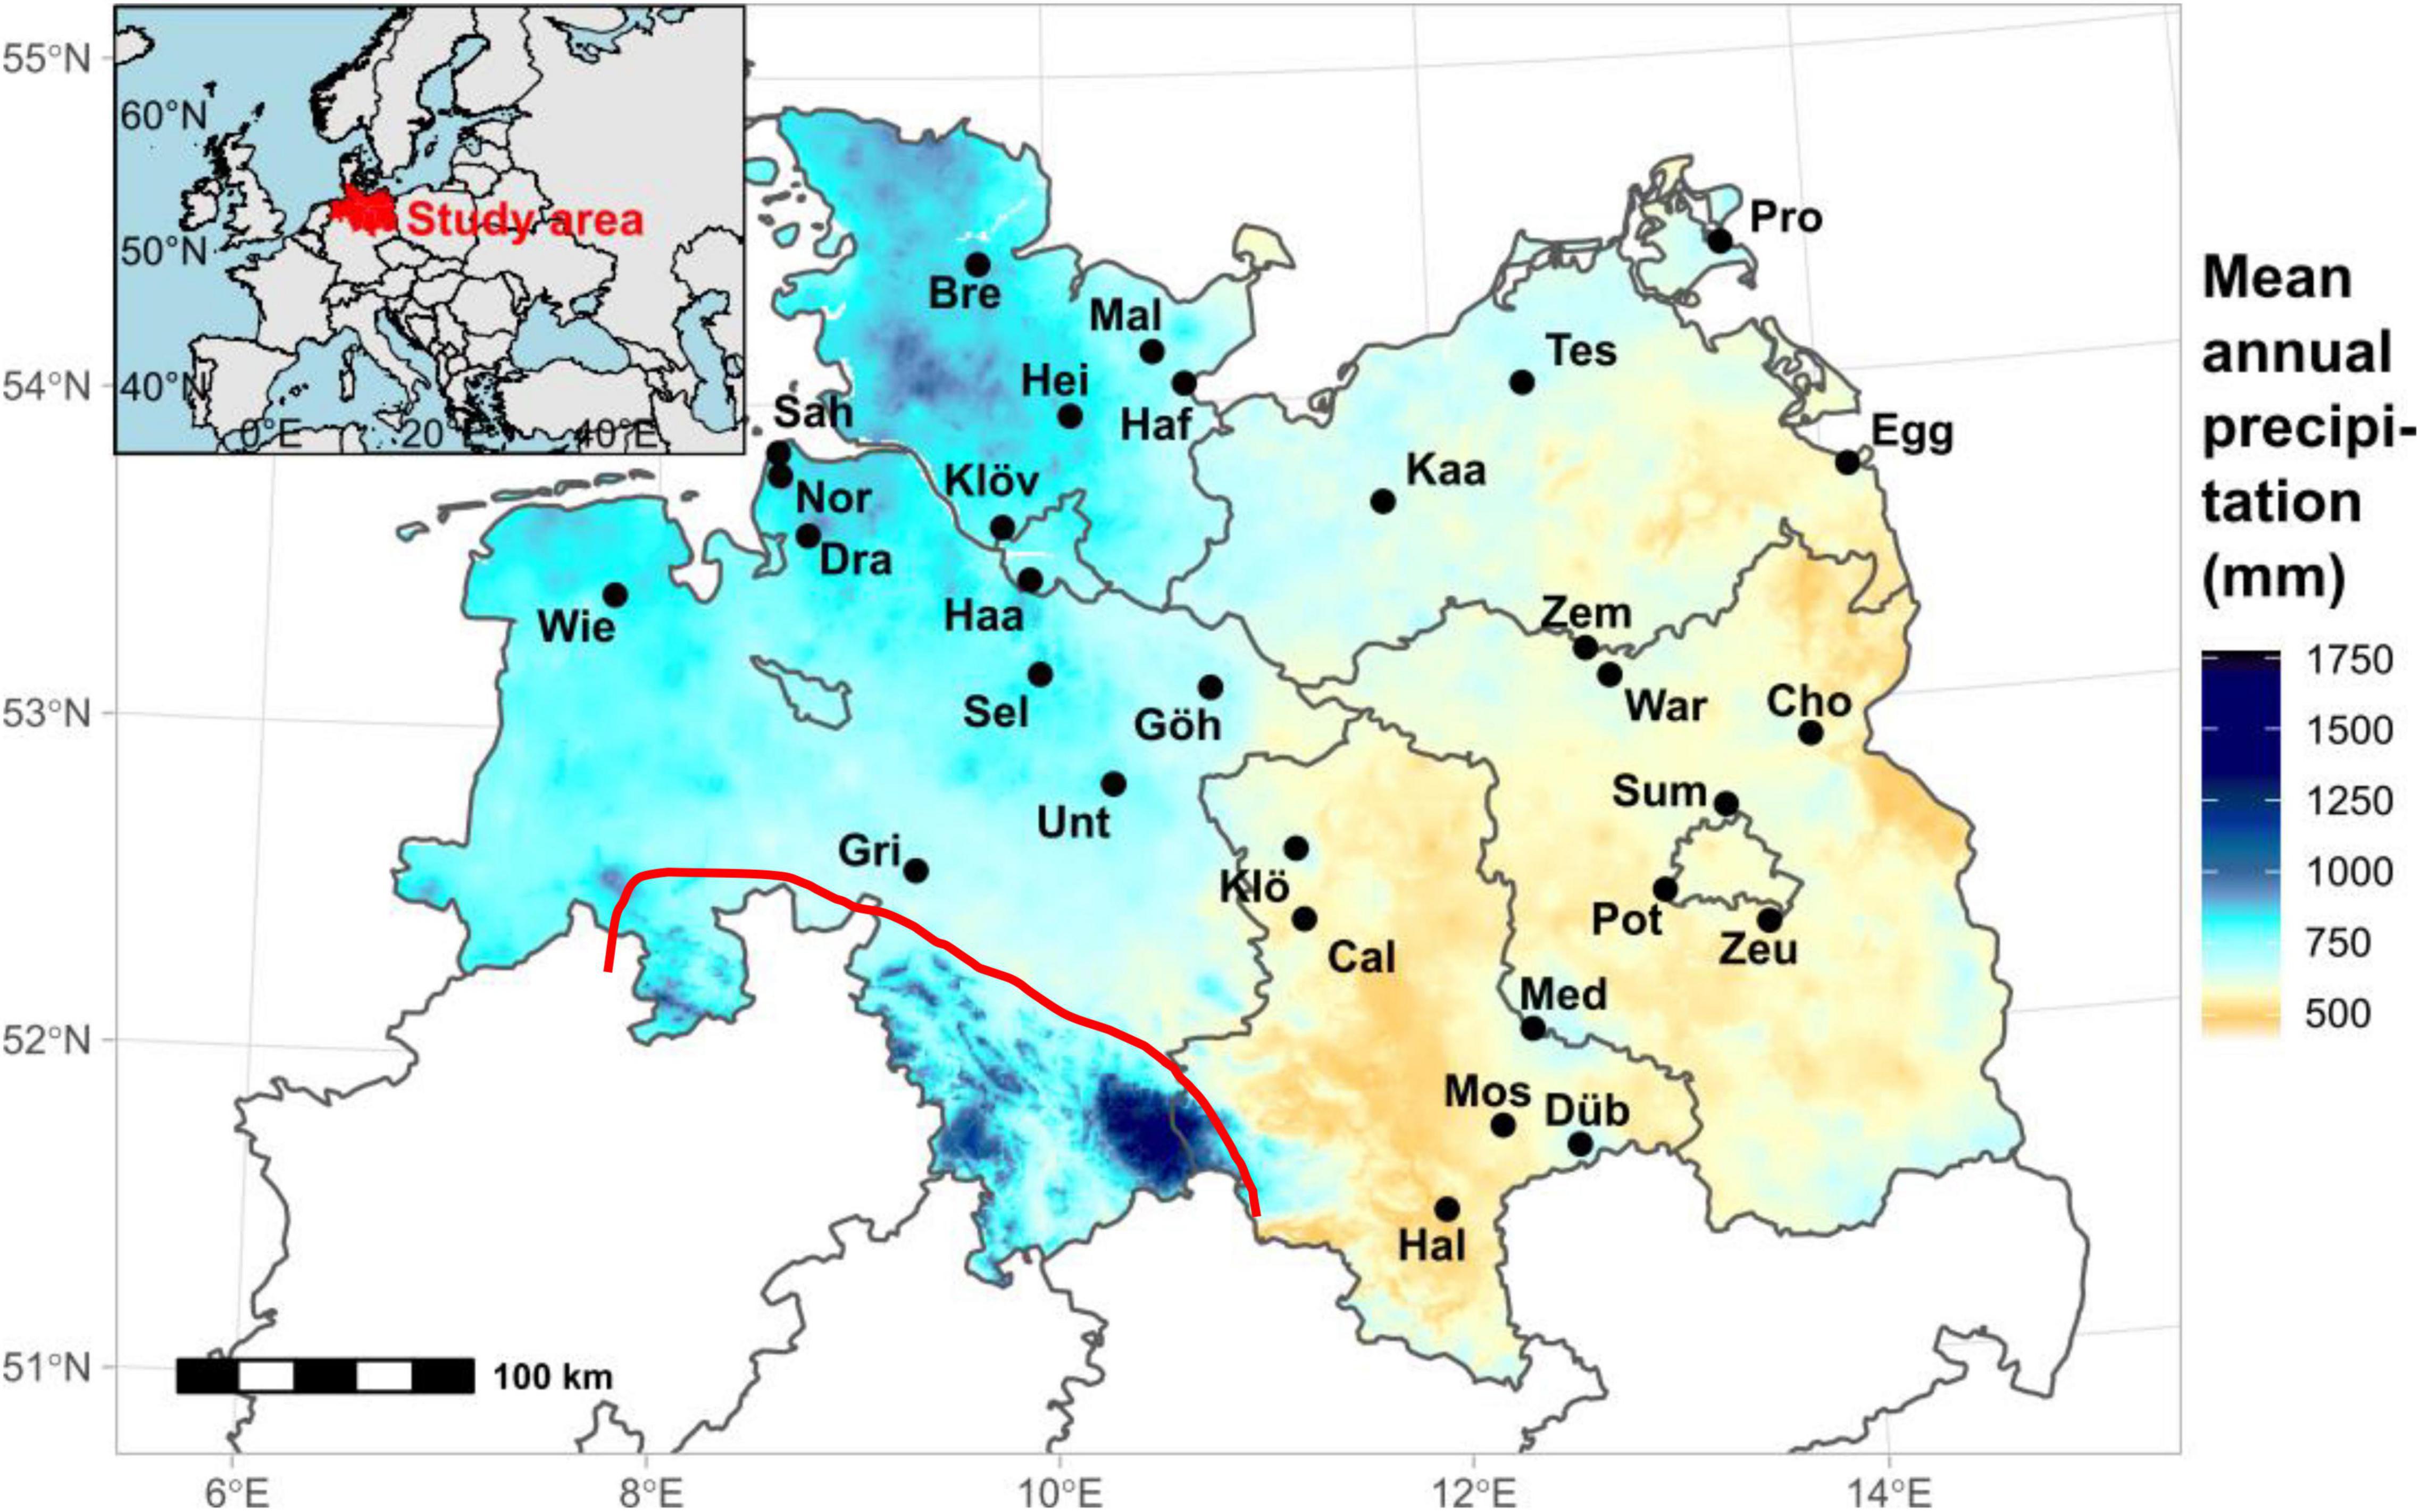
Figure 1. Mean annual precipitation (MAP in mm, 1991–2018, source: DWD) in the study area and location of the 30 studied forest sites in the North German Lowlands on Pleistocene substrates across a climate continentality gradient from W-NW to E-SE. At the 30 beech forest sites, the climate sensitivity of tree growth was analyzed in a companion study (Weigel et al., submitted)1. The red line marks the northern range limit of the central German low mountain range. Shown are the federal state boundaries of Lower Saxony, Schleswig-Holstein, Saxony-Anhalt, Brandenburg, Mecklenburg-Vorpommern and Hamburg, Bremen and Berlin.
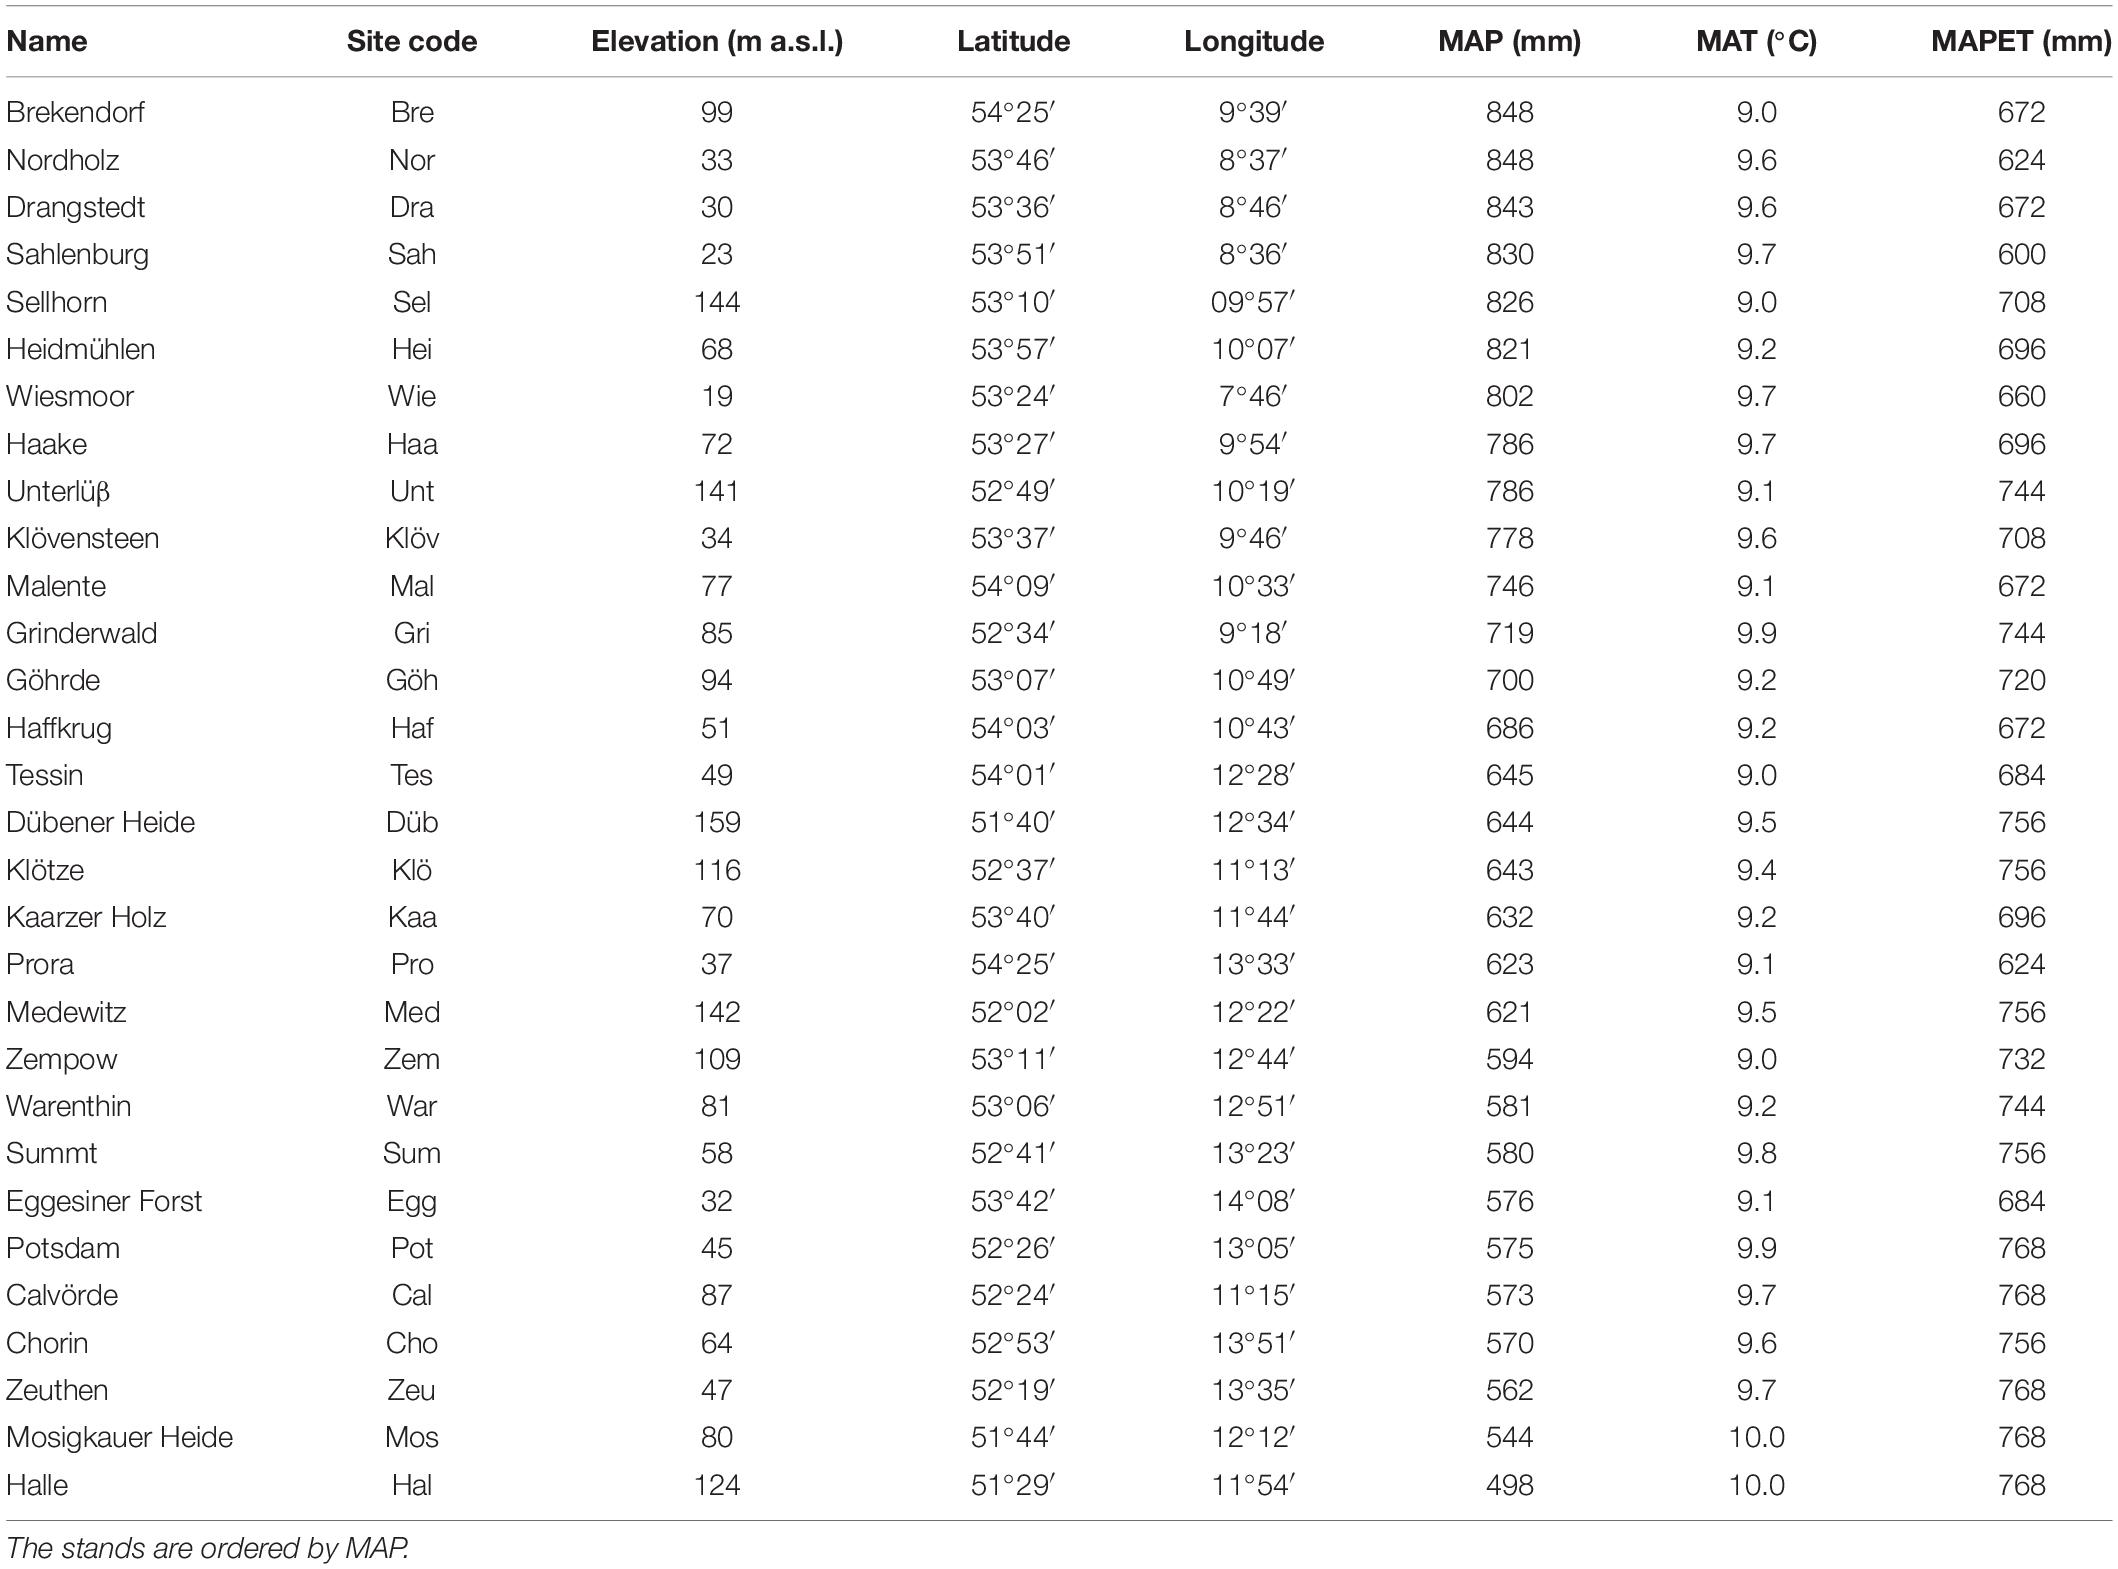
Table 1. The 30 studied beech forests in northern Germany with their location, elevation, mean annual precipitation (MAP), mean annual temperature (MAT), and mean annual potential evapotranspiration (MAPET) (period 1948–2017, after DWD).
Monthly precipitation and temperature data were downloaded for the 30 beech forest sites for the period 1948–2017 from the Climate Data Center (CDC) of the German Weather Service (Offenbach, Germany) as gridded datasets with 1 km mesh width. The data basis is formed by the main weather stations and the partner stations of the weather service, which constitute a dense network across Germany (Kaspar et al., 2013). In our study region, at least 600 stations reported precipitation data and at least 160 stations temperature data continuously to the weather service model grids in the period 1948–2017 (Deutscher Wetterdienst [DWD], 2021). This is more data than publicly available from the CDC server because the DWD partner stations often do not directly share their data (personal communication F. Kaspar, head of National Climate Monitoring at DWD; December 2021). Interpolation was done by the DWD with inverse square-distance weighting of stations, and adaptation to local elevation by regional regression over elevation was applied for temperature (Müller-Westermeier, 1995; Kaspar et al., 2013). The accuracy of this gridding method was verified against other GIS-based interpolation techniques (Maier and Müller-Westermeier, 2010). Even though the number of stations was somewhat reduced in recent years, the high weather station density of the DWD network with a mean distance between stations of 15 km (precipitation) or 30 km (temperature) in our study region provides a solid basis for applying such an interpolation method. Due to the high station density, missing data of individual stations in certain years have only a negligible influence on the produced maps.
Monthly potential evapotranspiration (PET) (in mm month–1) was calculated from local temperature and radiation data with the formula after Hargreaves and Samani (1982) as:
with Tmax and Tmin being the monthly maximum and minimum temperatures (°C), Tmean monthly mean temperature (°C), and Ra the extra-terrestrial radiation of the latitude expressed in water flux (mm d–1), computed by dividing daily net radiation (MJ m–2 d–1) by the latent heat of vaporization (λ) and assuming constant water density. A, B, and C are empirical parameters (A = 0.0023, B = 17.8, C = 0.5). The 1985 Hargreaves equation provides robust estimates of PET for a wide range of climatic conditions based only on temperature measurements (Hargreaves and Allen, 2003), which are available at a high station density in the study region.
A month’s climatic water balance (CWB) was computed by subtracting monthly PET from monthly precipitation (Thornthwaite and Mather, 1955). Subsequently, the non-dimensional, multi-scalar aridity index SPEI (Standardized Precipitation Evapotranspiration Index) was calculated according to Vicente-Serrano et al. (2010) from monthly CWB, using a 3-month aggregation period and adjusting the period’s SPEI mean to 0 and the corresponding standard deviation to 1. The SPEI index has been used widely in both arid and humid regions for drought monitoring and mapping efforts of drought intensity from regional to continental scales (Tirivarombo et al., 2018; Zarei and Moghimi, 2019; Ma et al., 2020; Zarei et al., 2021). In comparison to other aridity indices, SPEI has been found to characterize drought severity better, especially in humid and semi-arid climates, largely due to the inclusion of both precipitation and evapotranspiration as variables (Zarei et al., 2021). Here, SPEI is used for analyzing temporal trends in aridity and visualizing regional variation in long-term trends in climatic aridity in the study region. All three hydrometeorological variables were calculated with R 3.6.3 (R Core Team, 2020) using the R package “SPEI” v. 1.7 (Begueria and Vicente-Serrano, 2017).
Trend Analyses
Trends in climatic parameters over the two 35-year study periods (1948–1982 and 1983–2017) were inspected by correlating climate time series with the calendar year (Pearson’s r), and subsequently applying the Mann-Kendall trend test (Kendall, 1976) to detect significant trends (p < 0.05). The correlation strength (r) quantifies the magnitude of change over time; positive r-values demonstrate increasing, negative r-values decreasing values of climate variables. The analysis of long-term trends in climate factors relevant for forest health (temperatures, precipitation, climatic water balance, and aridity index SPEI in the growing season) was conducted separately for the two periods 1948–1982 and 1983–2017, as the recent warming trend manifested in Central Europe from about 1980 onward. As the study aim was to analyze climate trends relevant for beech forest growth in the study region and beech forests are patchily distributed across the lowlands, we selected 30 beech forests from all over the study region (see Figure 1) and retrieved the climate data sets for these sites from the gridded climate data. In a first step, all 30 chosen locations were pooled in the trend analysis to obtain a general picture of climate warming in northern Germany. Regional differences in the climate trends of the study region were then analyzed by grouping the sites into four classes of mean growing season precipitation (MGSP, April-September) with each 7–8 sites pooled, namely the driest (“very dry”; MGSP: 306–328 mm), the fairly dry (329–358 mm), the fairly wet (364–418 mm), and the wettest sites (“very wet”; 419–448 mm), and climate trends were analyzed separately for these classes. The grouping was guided by dendrochronological data that show reduced growth of beech especially in the driest MGSP class (Weigel et al., submitted). In parallel, we also mapped the climatic changes for the whole study area based on the original gridded climate data. In the next step, we explored the trends of the climate factors at the 30 localities independently, which allowed correlating the magnitude and significance of trends with mean annual precipitation (MAP) or mean growing season precipitation (MGSP) at the considered sites.
Results
Trends in Thermal Conditions
While mean growing season temperature (mean of April-September) was stable or slightly decreased in the 1948–1982 period, the mean of all sites and the means of the four growing-season precipitation classes (very dry, fairly dry, fairly wet, very wet) significantly increased from 1983 to 2017 (Figure 2A). The temperature increase is more pronounced in April, June, and September (significant trends) than in May, July, and August (non-significant tendencies) (Figure 2B). Comparing the means of the 1948–1982 and 1983–2017 periods shows no clear spatial variation in the extent of summer temperature increase across the study region (Supplementary Figure 2), except for the increase in June temperature, which is more pronounced toward drier sites (Figure 3).
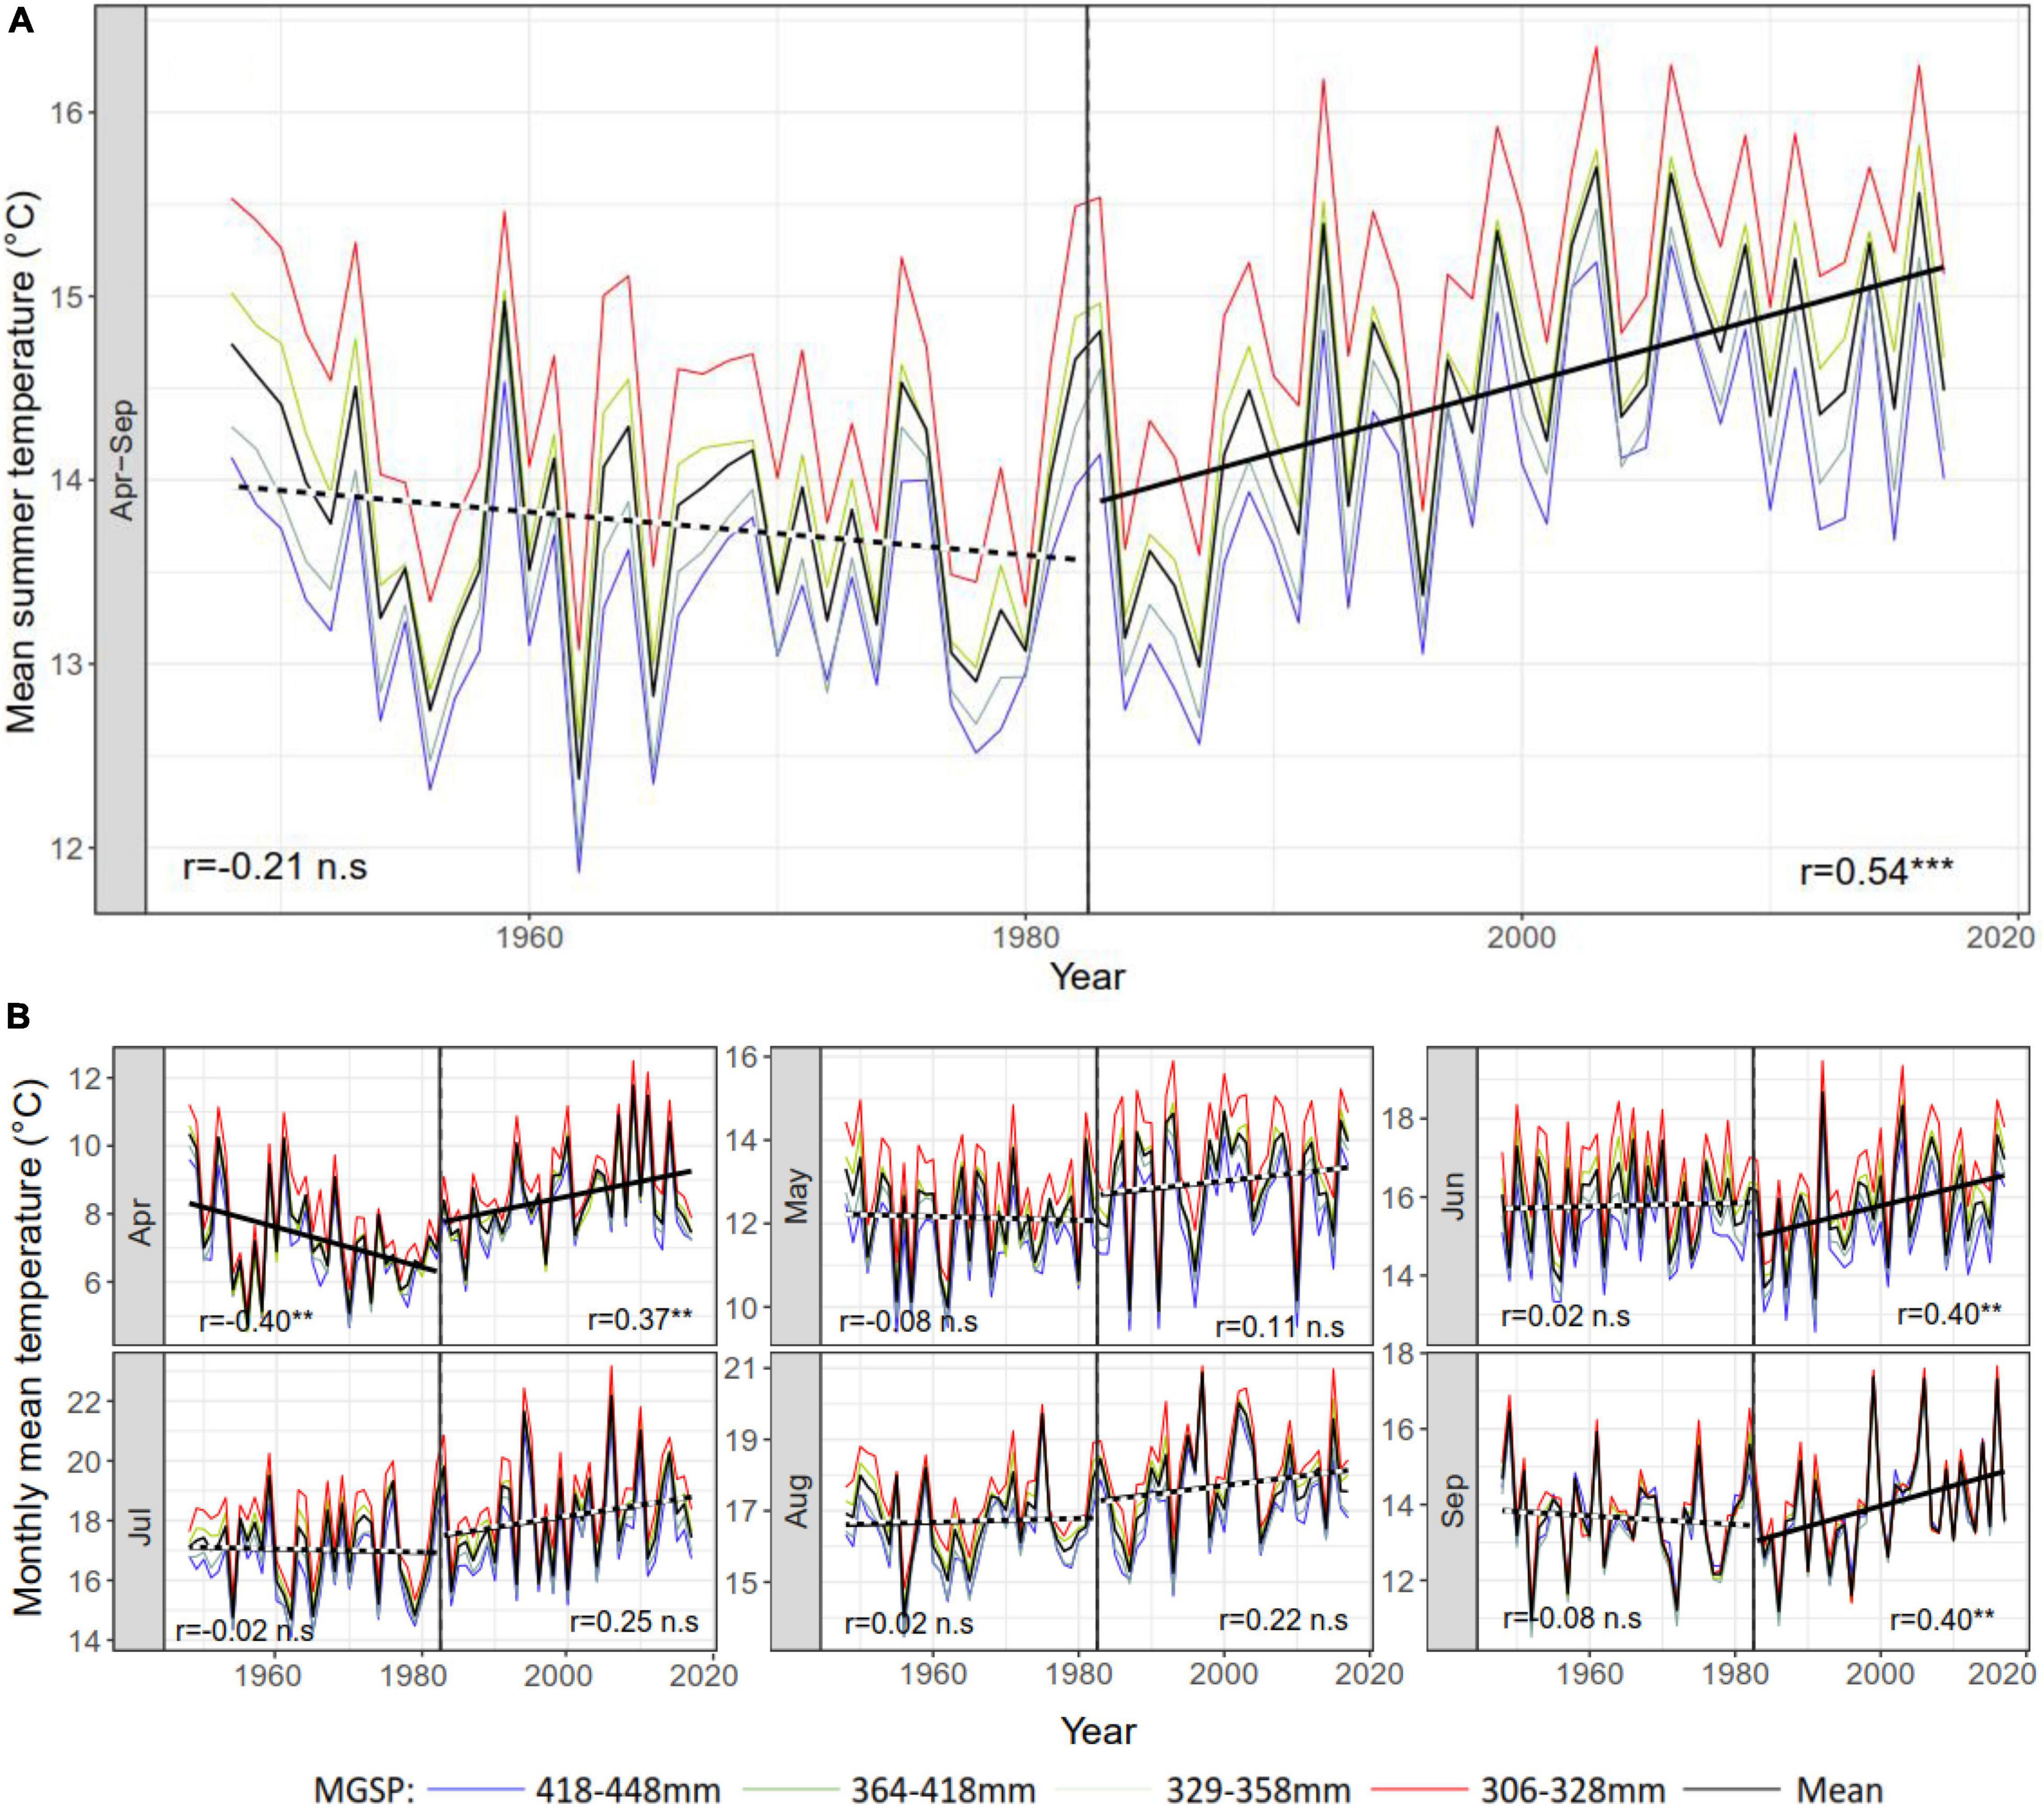
Figure 2. Long-term trends (A) of mean summer temperature (mean of the months April–September) and (B) of the mean temperature of individual summer months in the periods 1948–1982 and 1983–2017 extracted from the gridded climate data of the DWD for the 30 study sites in the North German Lowlands, separately displayed for four classes of mean growing season precipitation (April–September; red: Driest sites, blue: Wettest sites). Significant trends are marked by solid trend lines (p < 0.05), non-significant ones by dotted trend lines. *p < 0.05 (not applicable in this graph), **p < 0.01, ***p < 0.001 according to a Mann-Kendall trend test.
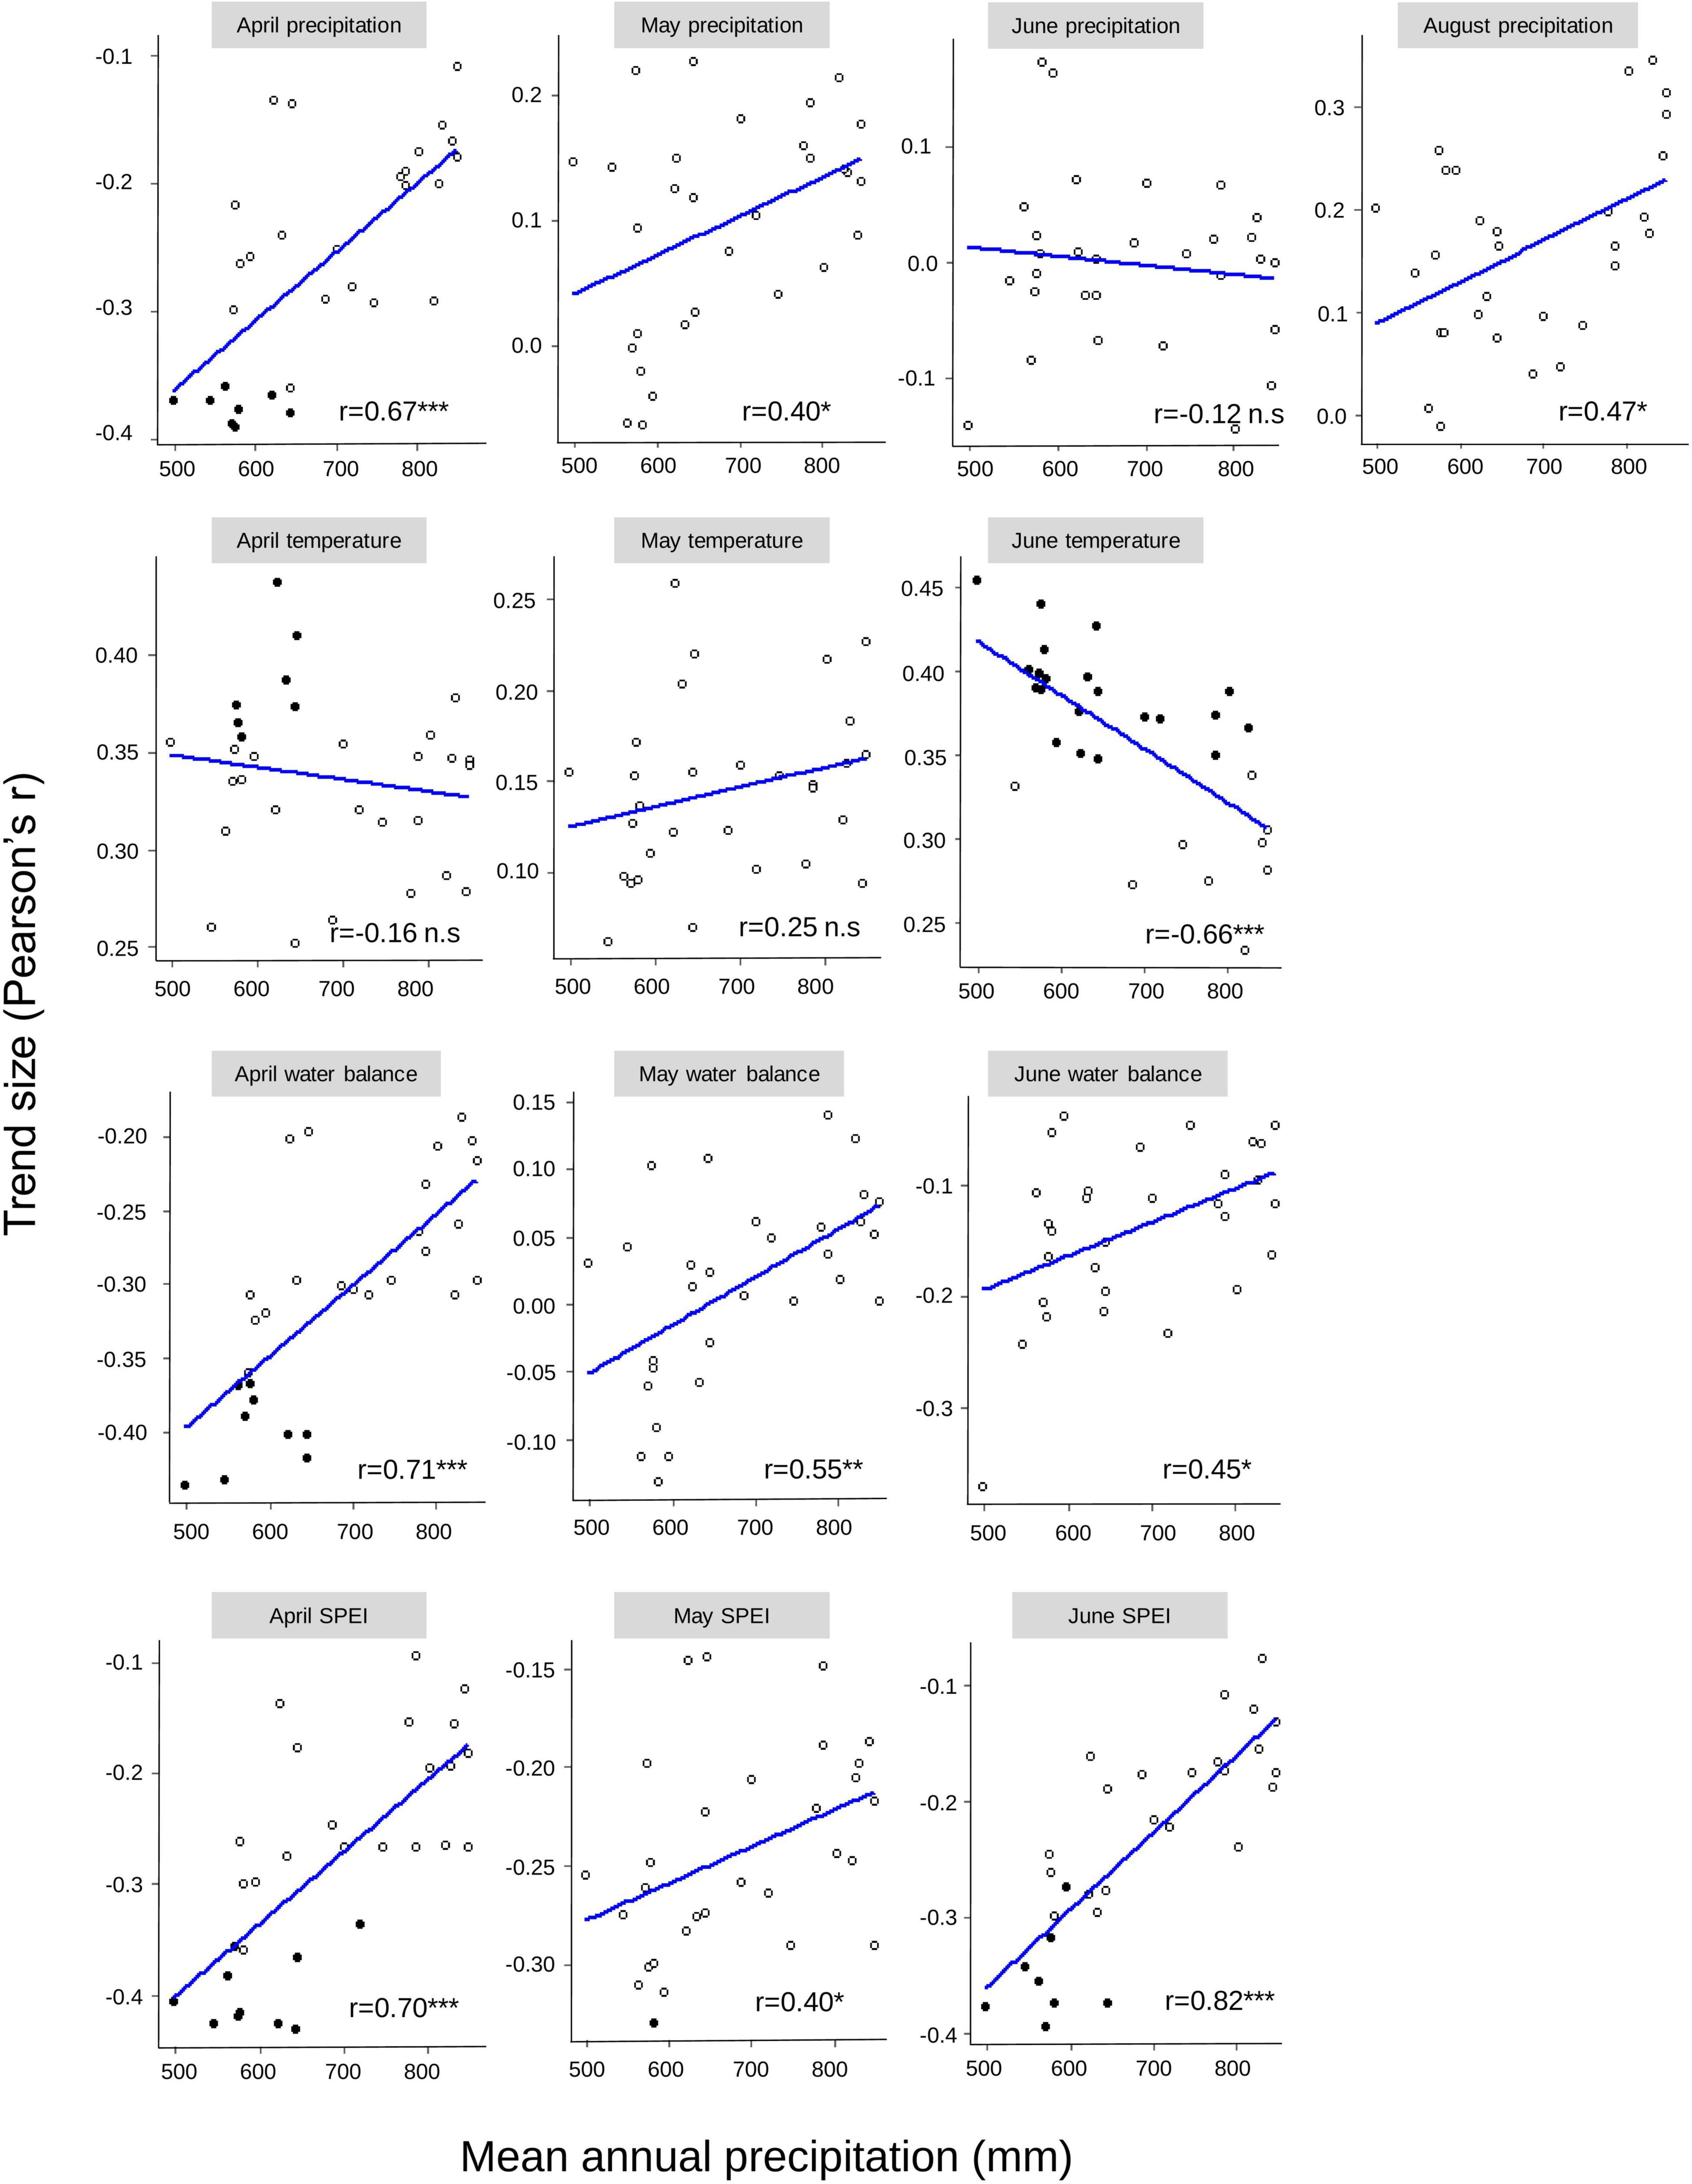
Figure 3. Relationship between the trend size (expressed by Pearson’s r of the correlation of climate variable with calendar year) of long-term change in monthly precipitation, mean temperature, mean climatic water balance and mean SPEI of the months April, May, June, and August in the period 1983–2017 at the 30 sites, and mean annual precipitation at the site. Significance levels of the spatiotemporal relationships: *p < 0.05, **p < 0.01, ***p < 0.001. For the trend sizes at any of the N = 30 sites (dots), negative r-values along the y-axis represent a decreasing trend, positive r-values an increasing trend. Filled dots: sites with significant trend in the period 1983–2017, circles: sites without significant trend. Results for July, (August), and September are not shown for clarity.
Trends in Hydrometeorological Conditions
While growing season precipitation (April-September total) averaged over all sites reveals no significant trend neither in the 1948–1982 nor the 1983–2017 period (Supplementary Figure 3A), large regional differences do exist. Decreases by up to 30 mm from the first to the second observation period occurred in parts of Lower Saxony, western Mecklenburg-Vorpommern, and southern Brandenburg, while increases were recorded close to the coast and in parts of Brandenburg and Saxony-Anhalt (Figure 4A). Analyzing the six summer months separately reveals for the complete station sample a significant decrease of April precipitation during the 1983–2017 period with a mean reduction by about 5–10 mm in most regions (Figure 5A), and a significant increase of August precipitation (Supplementary Figure 3B). The April precipitation trend is more pronounced (and often significant only) at the drier sites, while the August precipitation trend is stronger at the wetter sites (Figure 3). June precipitation with its high importance for beech growth shows no trend in the complete sample from 1948/1982 to 1983/2017 (Supplementary Figure 3B), but regional tendencies to a decrease by 10 mm or more in southern Lower Saxony, Saxony-Anhalt, and the south of Brandenburg are visible, while tendencies for increases prevailed in the coastal regions (Figure 5B).
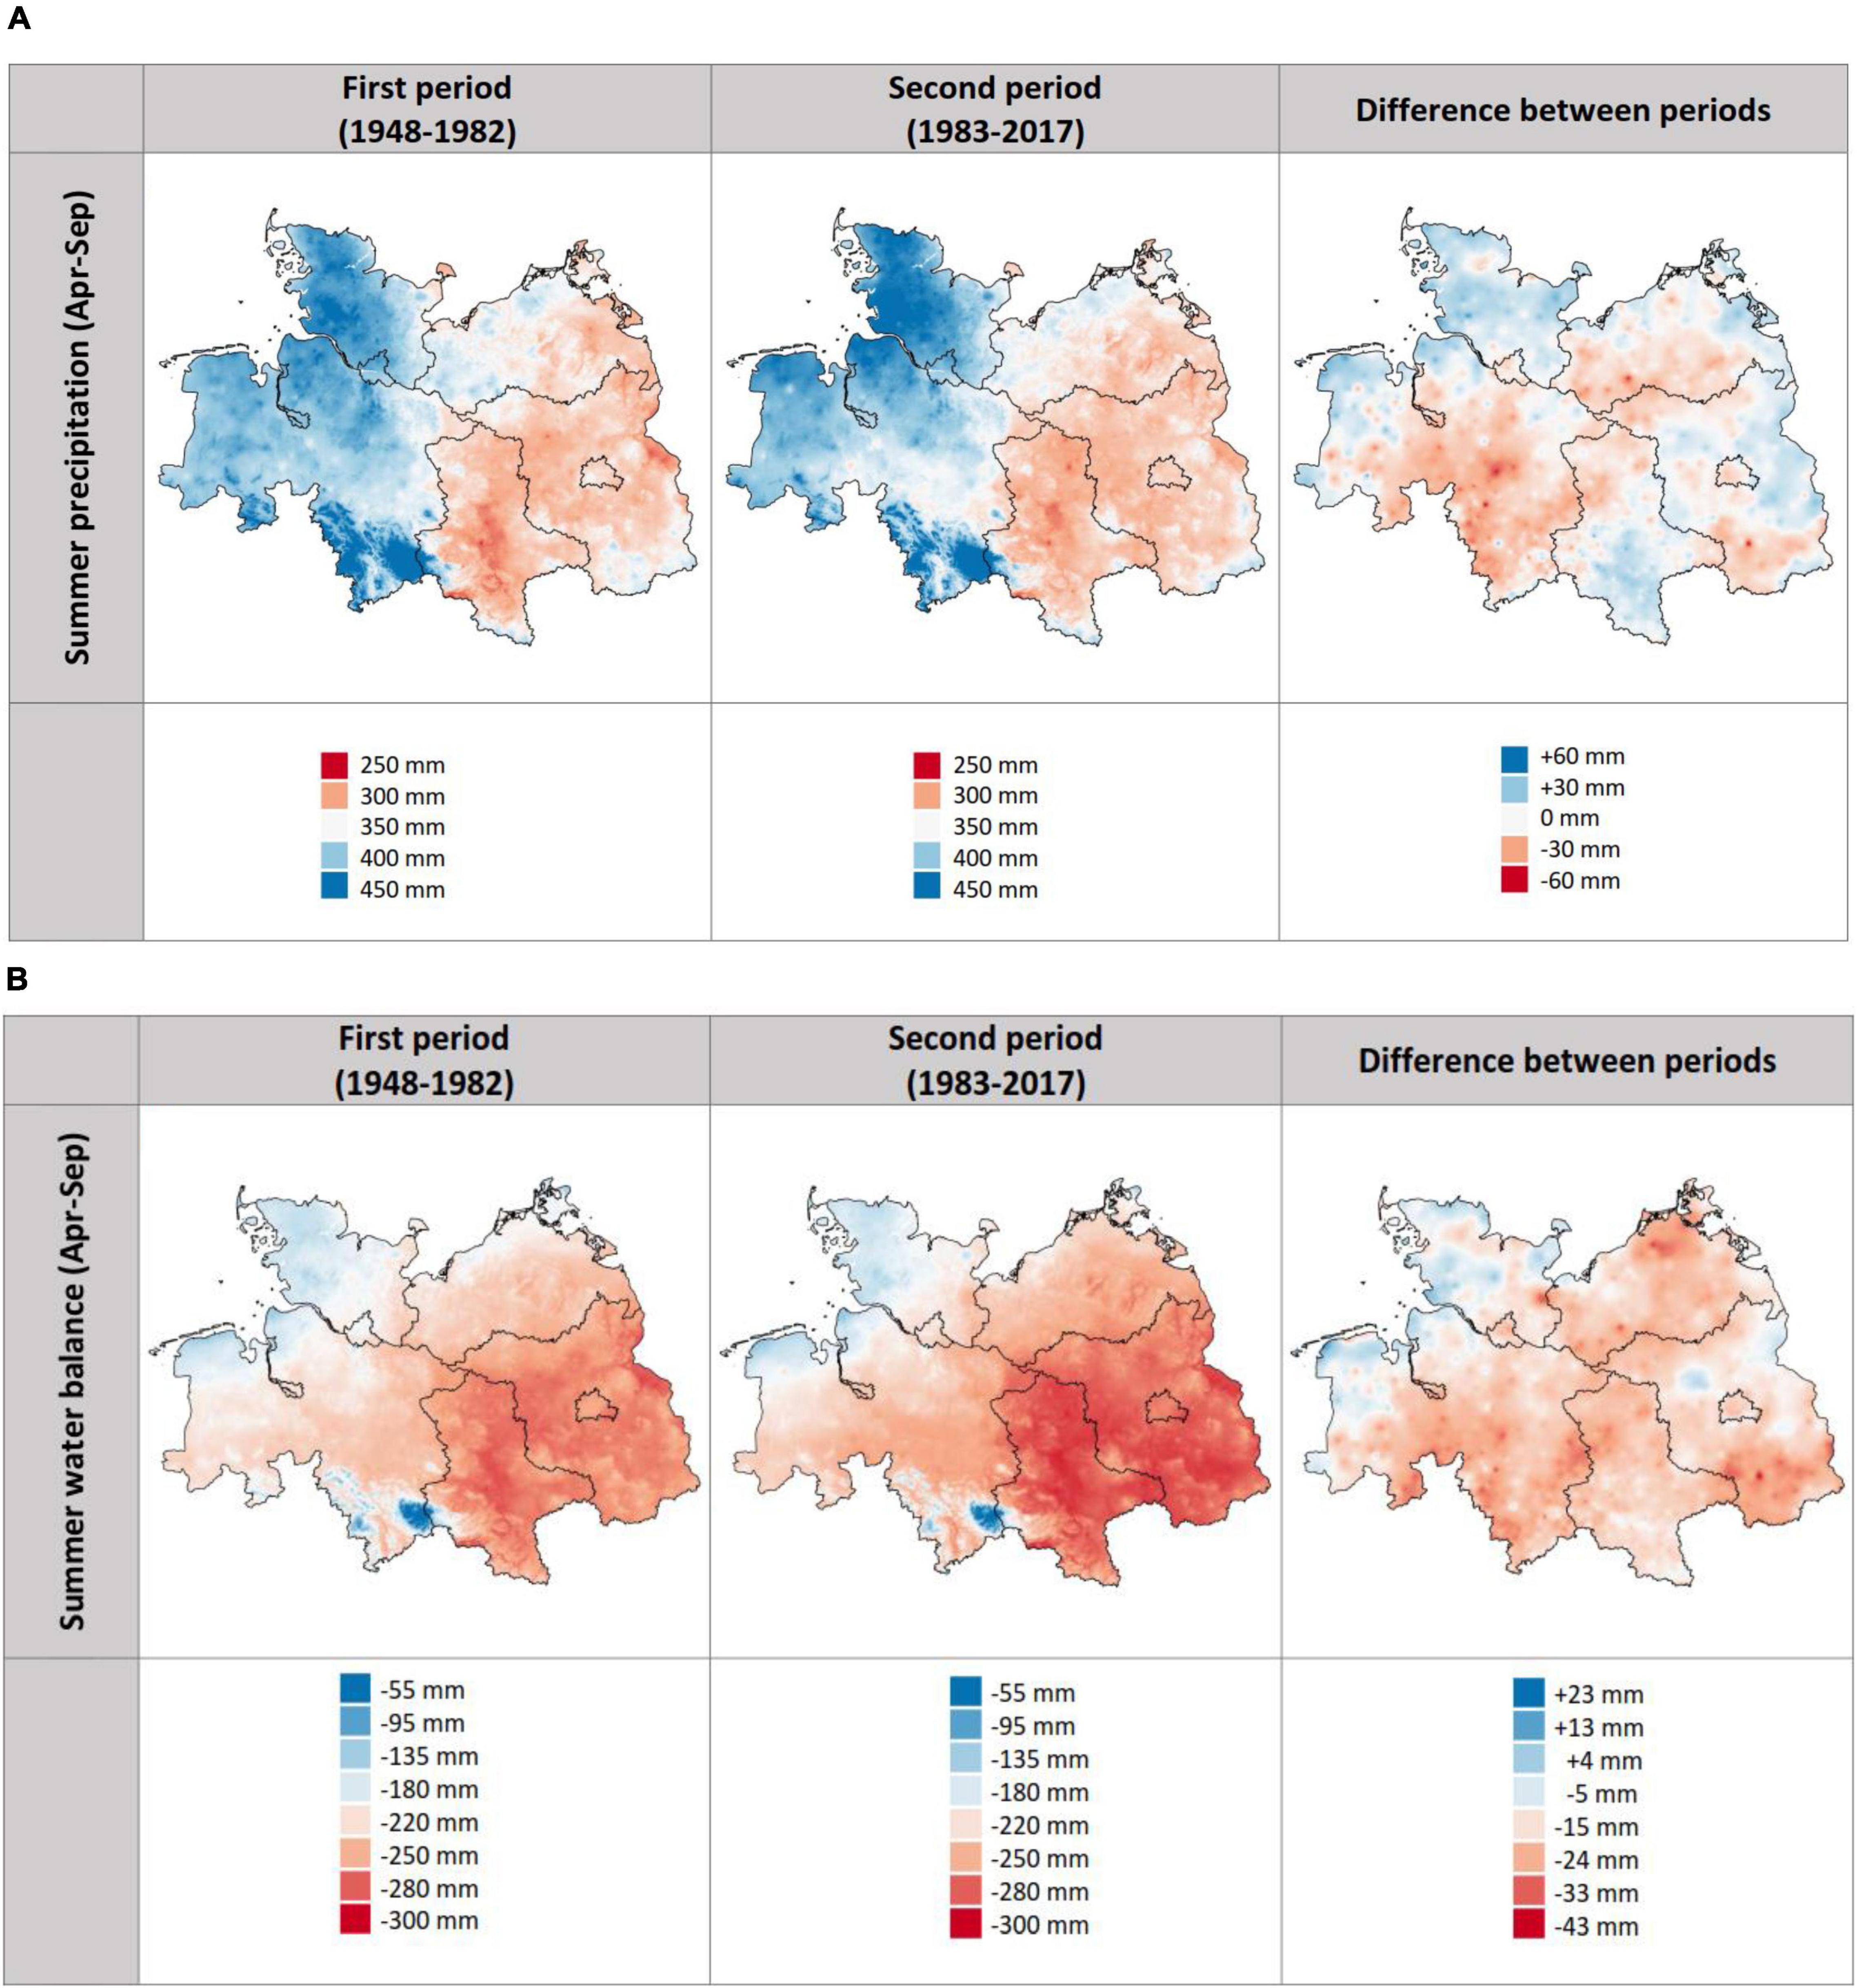
Figure 4. Interpolation (DWD 1 km2-gridded climate data) of growing season precipitation (sum of April-September) (A) and growing season climatic water balance (CWB) (cumulated over April-September) (B) in the North German Lowlands: means of the periods 1948–1982 (left) and 1983–2017 (center), and differences between the two period means (right). Positive precipitation differences: increase, negative differences: decrease; positive CWB differences: reduced deficit, negative CWB differences: increased deficit.
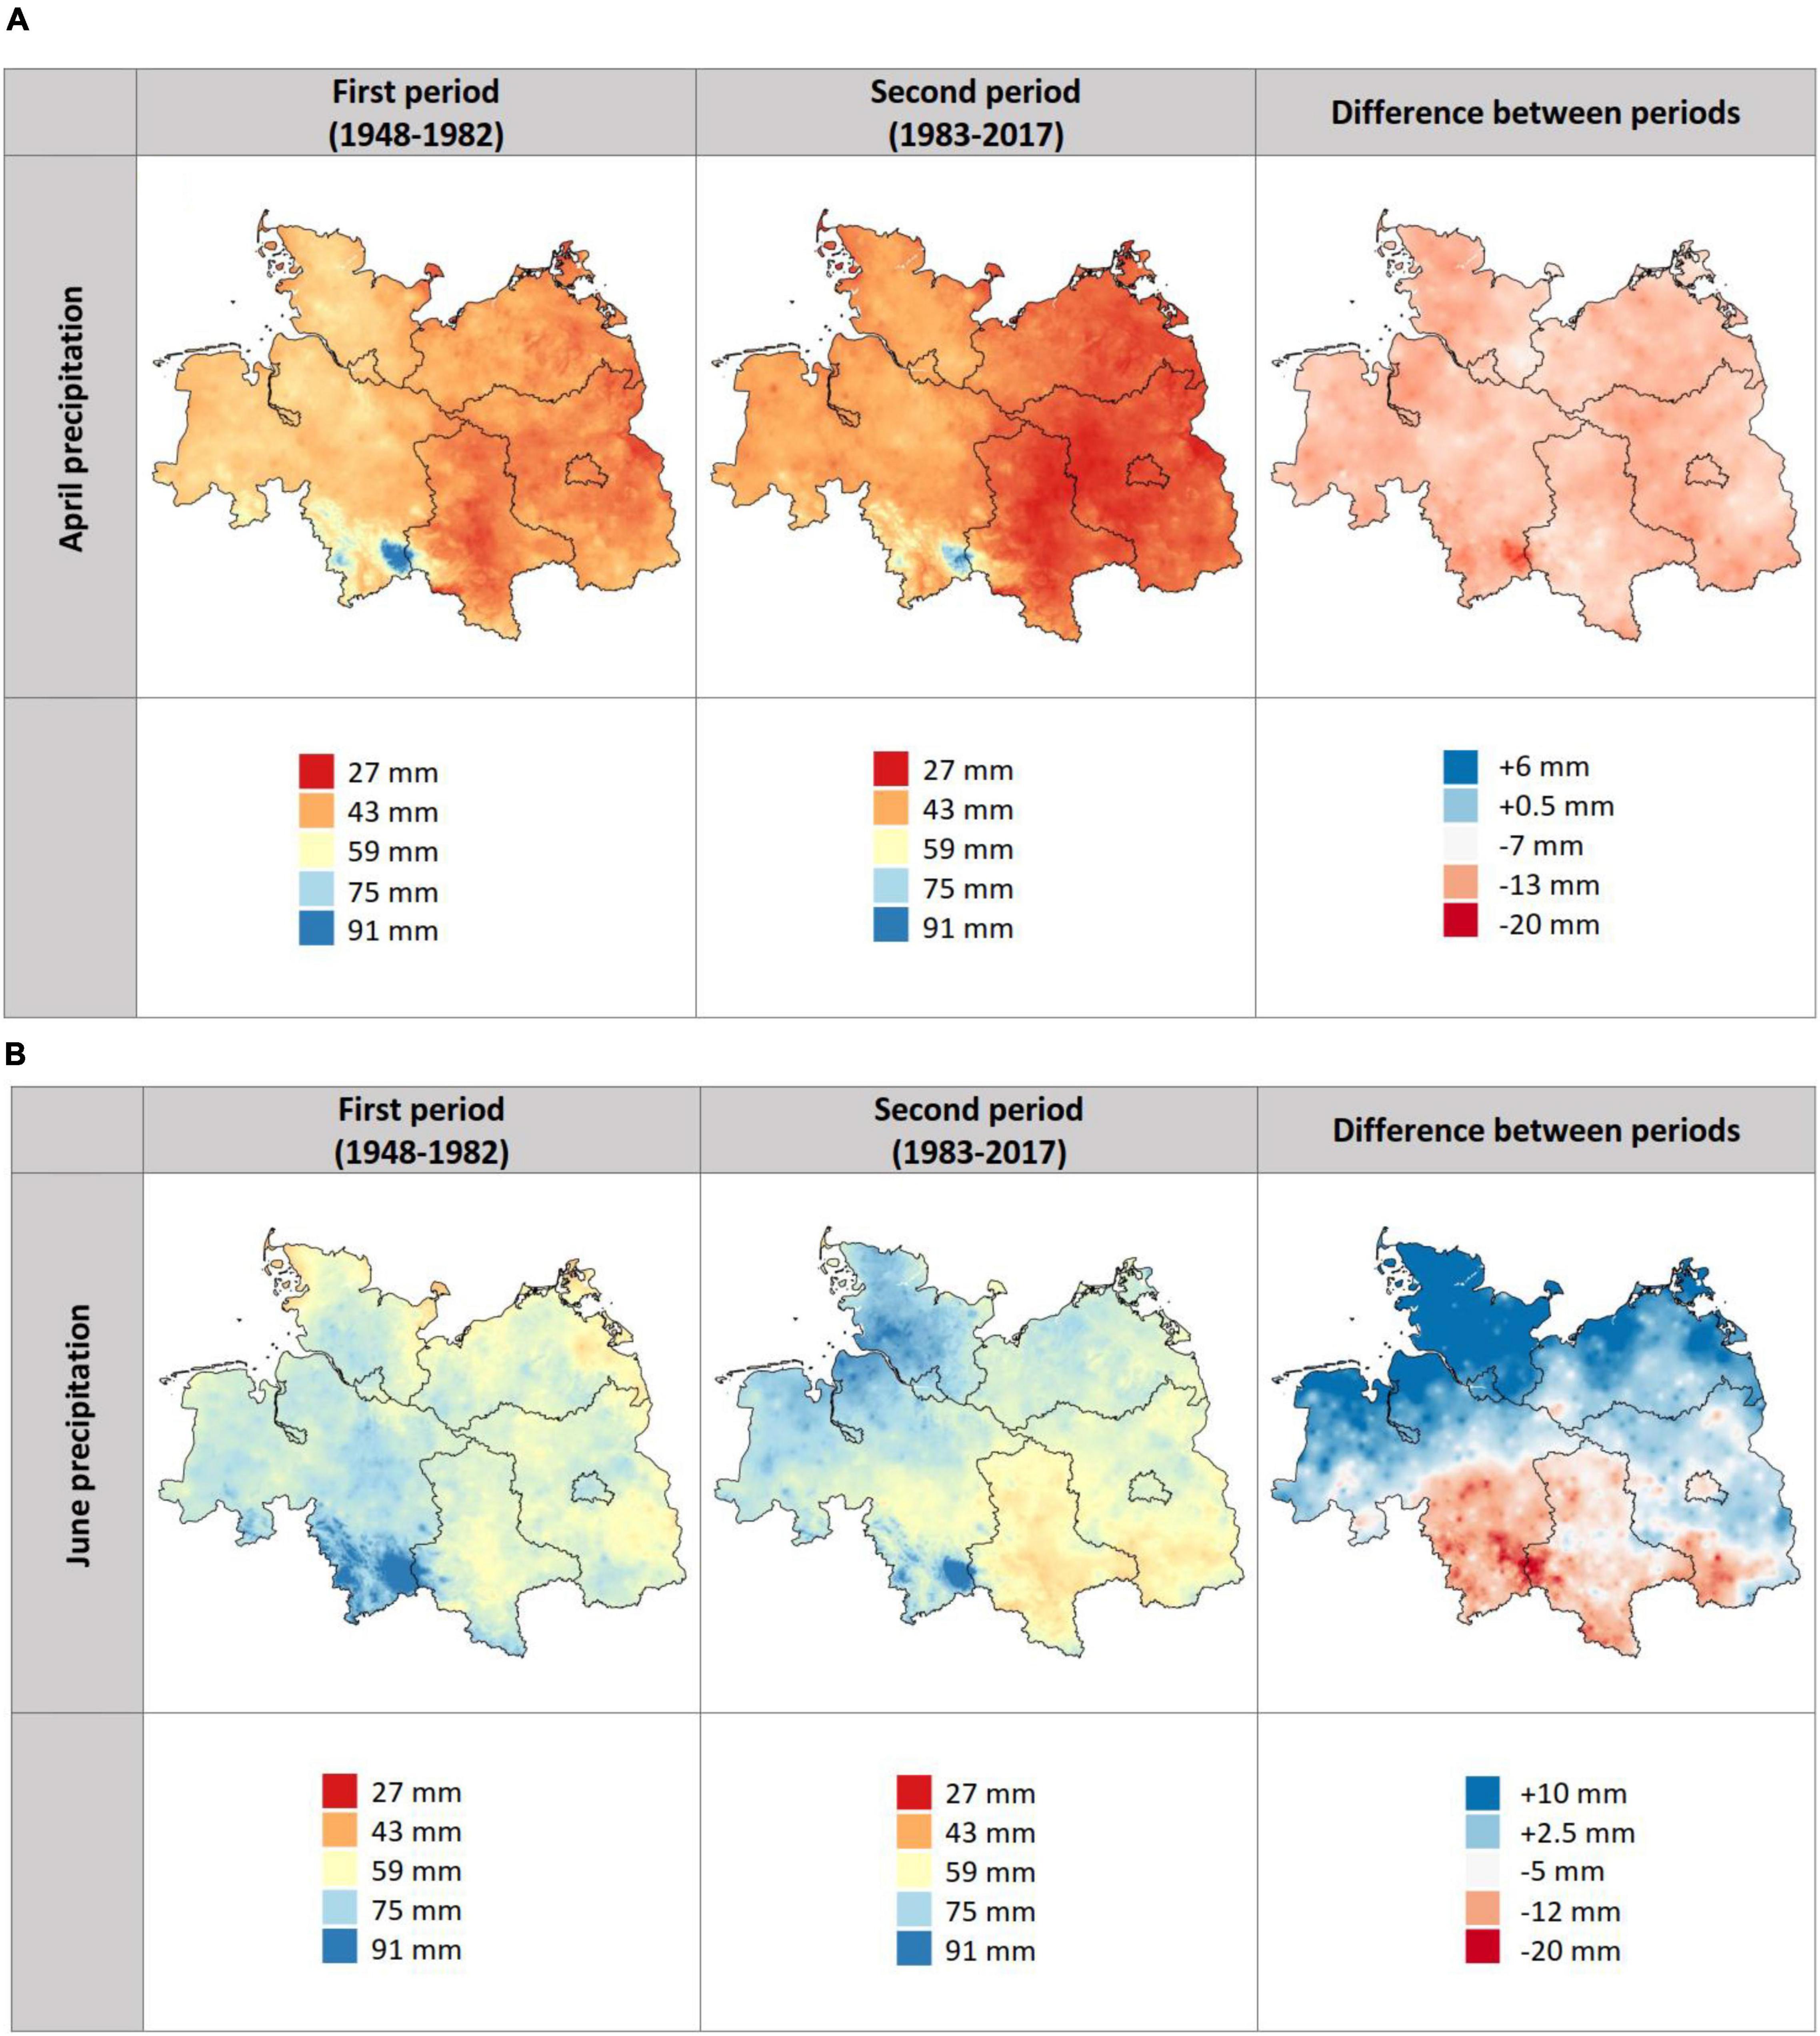
Figure 5. Interpolation (DWD 1 km2-gridded climate data) of April (A) and June precipitation (B) in the North German Lowlands: means of the periods 1948–1982 (left) and 1983–2017 (center), and differences between the two period means (right). Positive differences: increase, negative differences: decrease.
Growing-season climatic water balance (CWB) shows no significant trend in the 1948–1982 and 1983–2017 periods, neither for the whole growing season (Supplementary Figure 4A) nor for the individual summer months (Supplementary Figure 4B). The only exception was April CWB that is significantly decreasing during the more recent 1983–2017 interval (Supplementary Figure 4B). However, contrasting the 1948–1982 and the 1983–2017 periods reveals decreases by 20–30 mm in growing season CWB for large areas of Saxony-Anhalt, Brandenburg, Mecklenburg-Vorpommern, and the south of Lower Saxony, while no change or increases have occurred close to the North Sea coast (Figure 4B). In fact, stations with lower MAP experienced greater decreases in the CWB of April, May, and June than moister stations (Figure 3). While growing season SPEI decreases in the complete sample only non-significantly in the 1983–2017 period (Figure 6A), we find significant SPEI decreases in this interval for April and June (and a non-significant tendency also in July; Figure 6B). Contrasting the 1948–1982 and 1983–2017 periods reveals a SPEI decrease by up to 0.3 units in April-August (but not in September) in most parts of the study region (Figure 7). The SPEI decrease in April, May, and June is more pronounced (and often significant only) at drier than at moister sites (Figure 3).
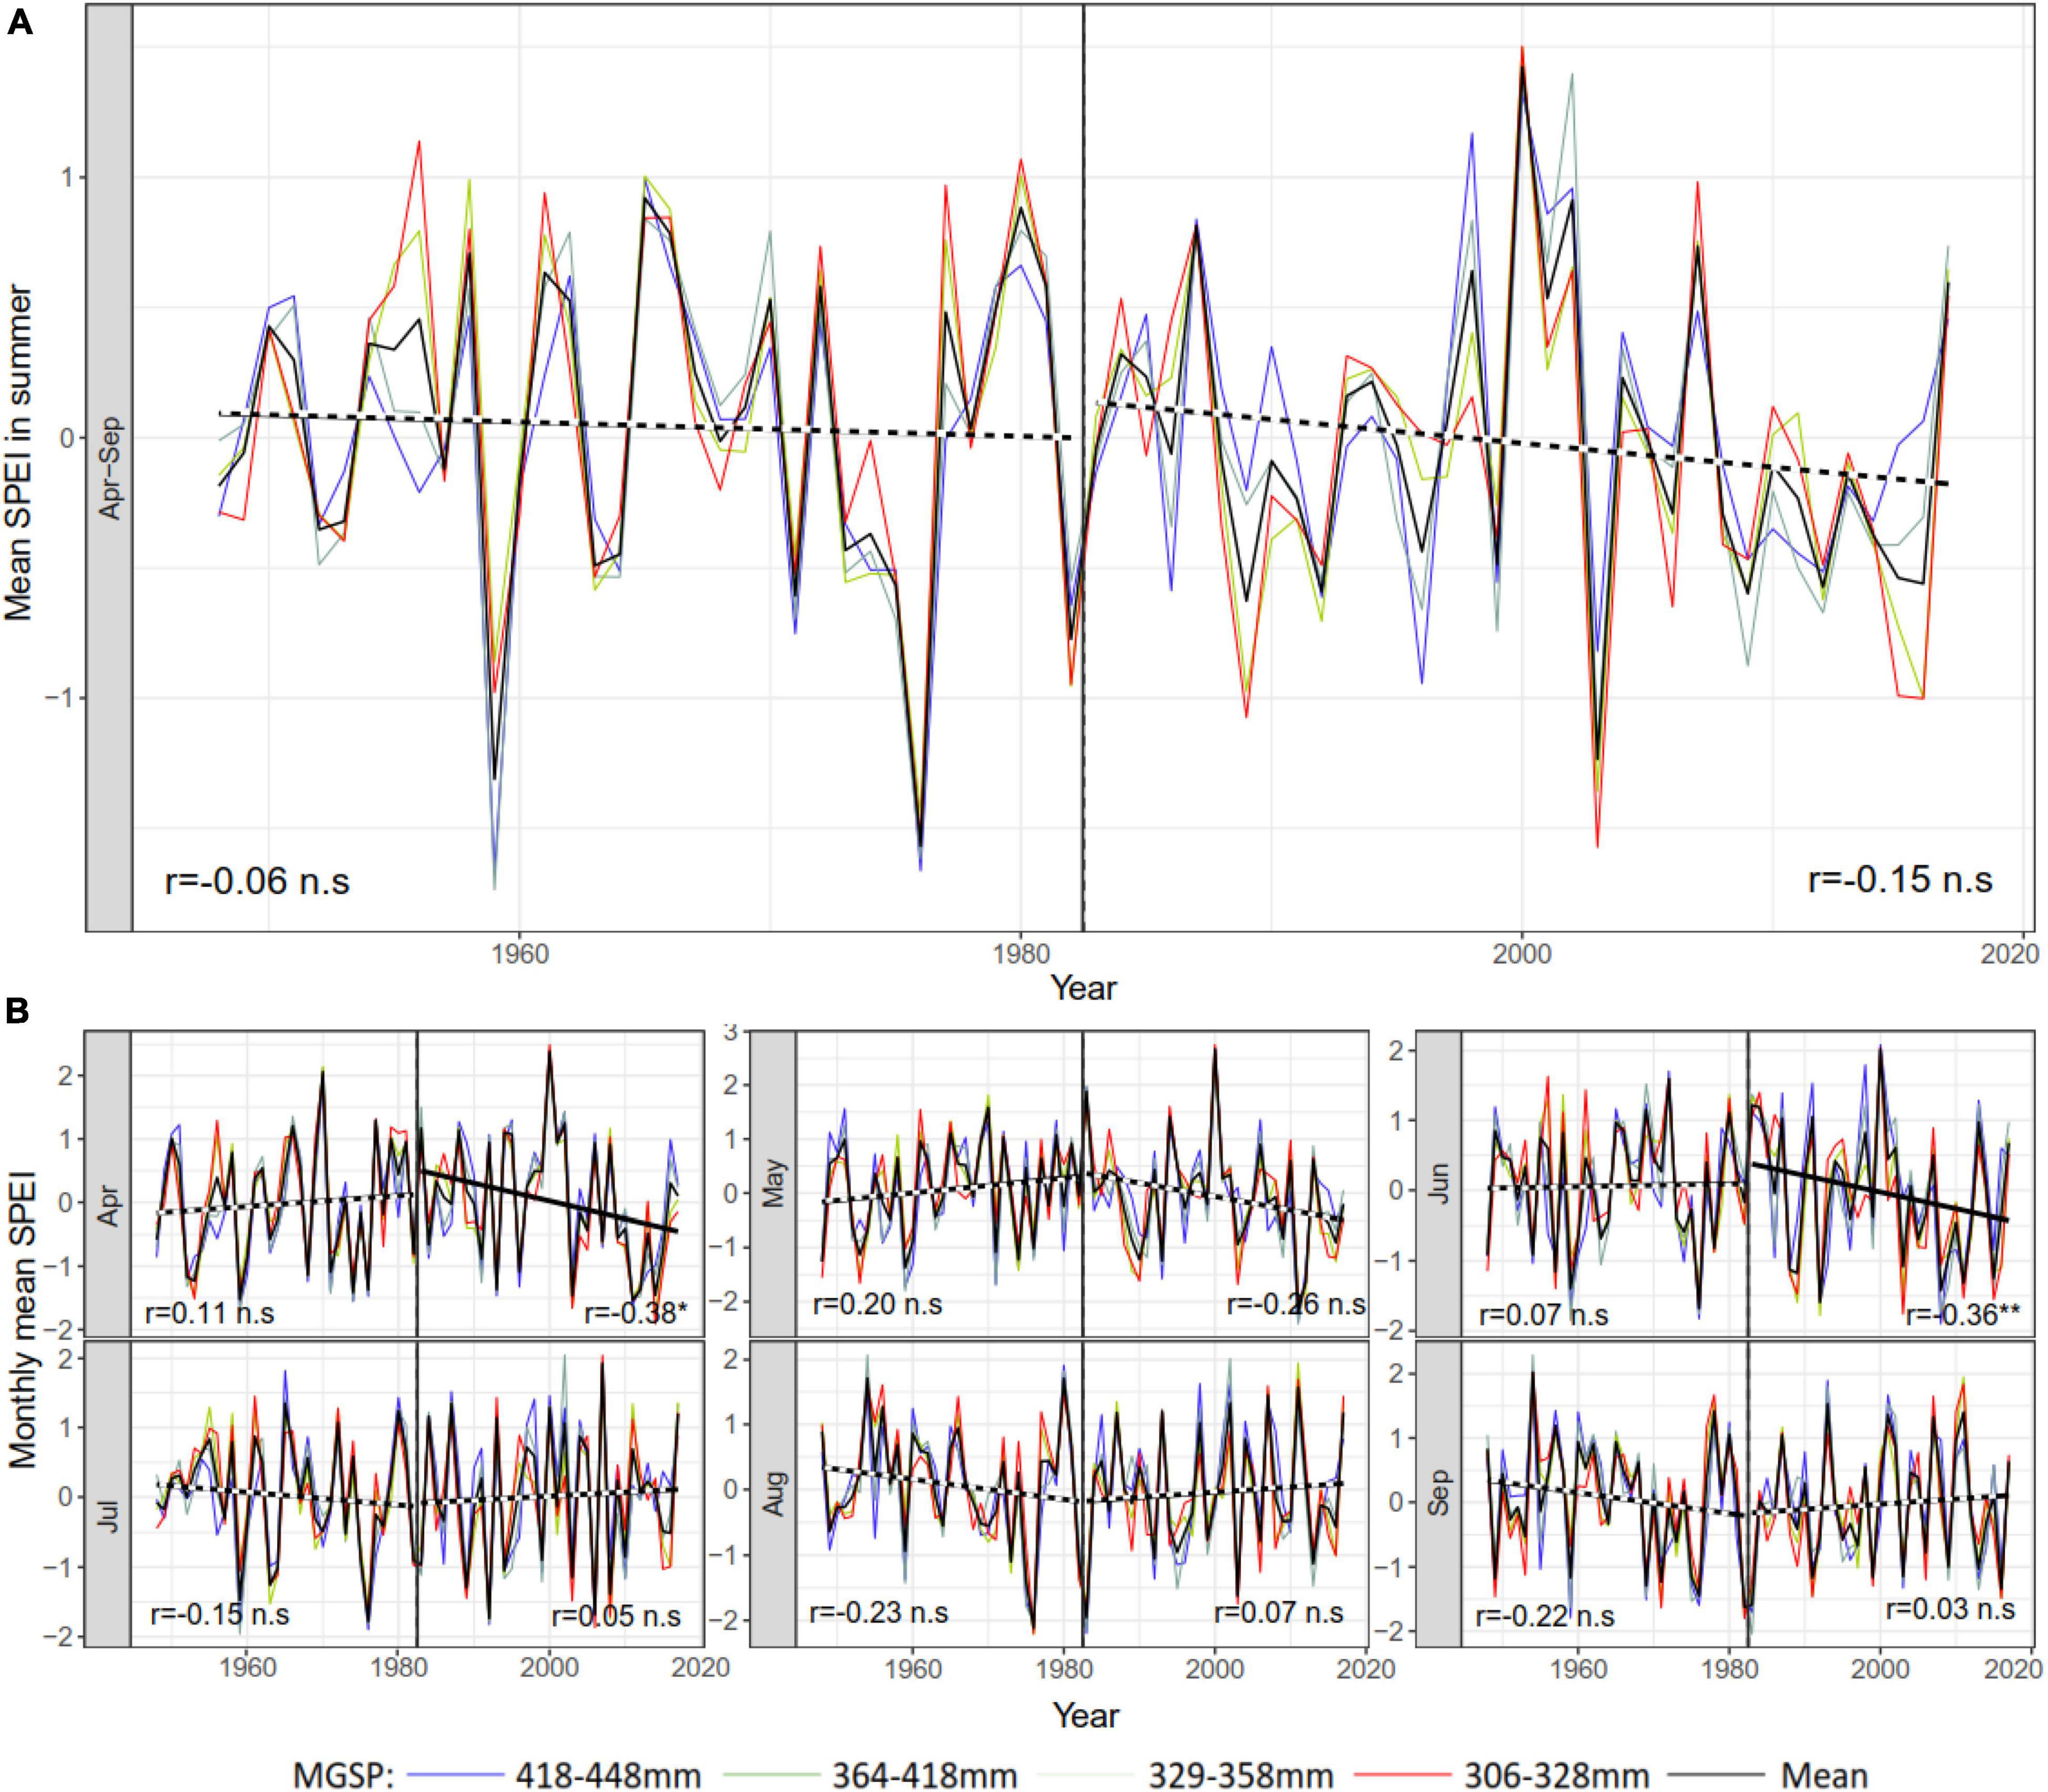
Figure 6. Long-term trends (A) of mean SPEI in summer (Standardized Precipitation Evapotranspiration Index; mean of the months April–September) and (B) of mean SPEI of the individual summer months in the periods 1948–1982 and 1983–2017 extracted from the gridded climate data of the DWD for the 30 study sites in the North German Lowlands, separately displayed for four classes of mean growing season precipitation (April–September; red: driest sites, blue: wettest sites). Significant trends are marked by solid trend lines (p < 0.05), non-significant ones by dotted trend lines. *p < 0.05, **p < 0.01 according to a Mann-Kendall trend test.
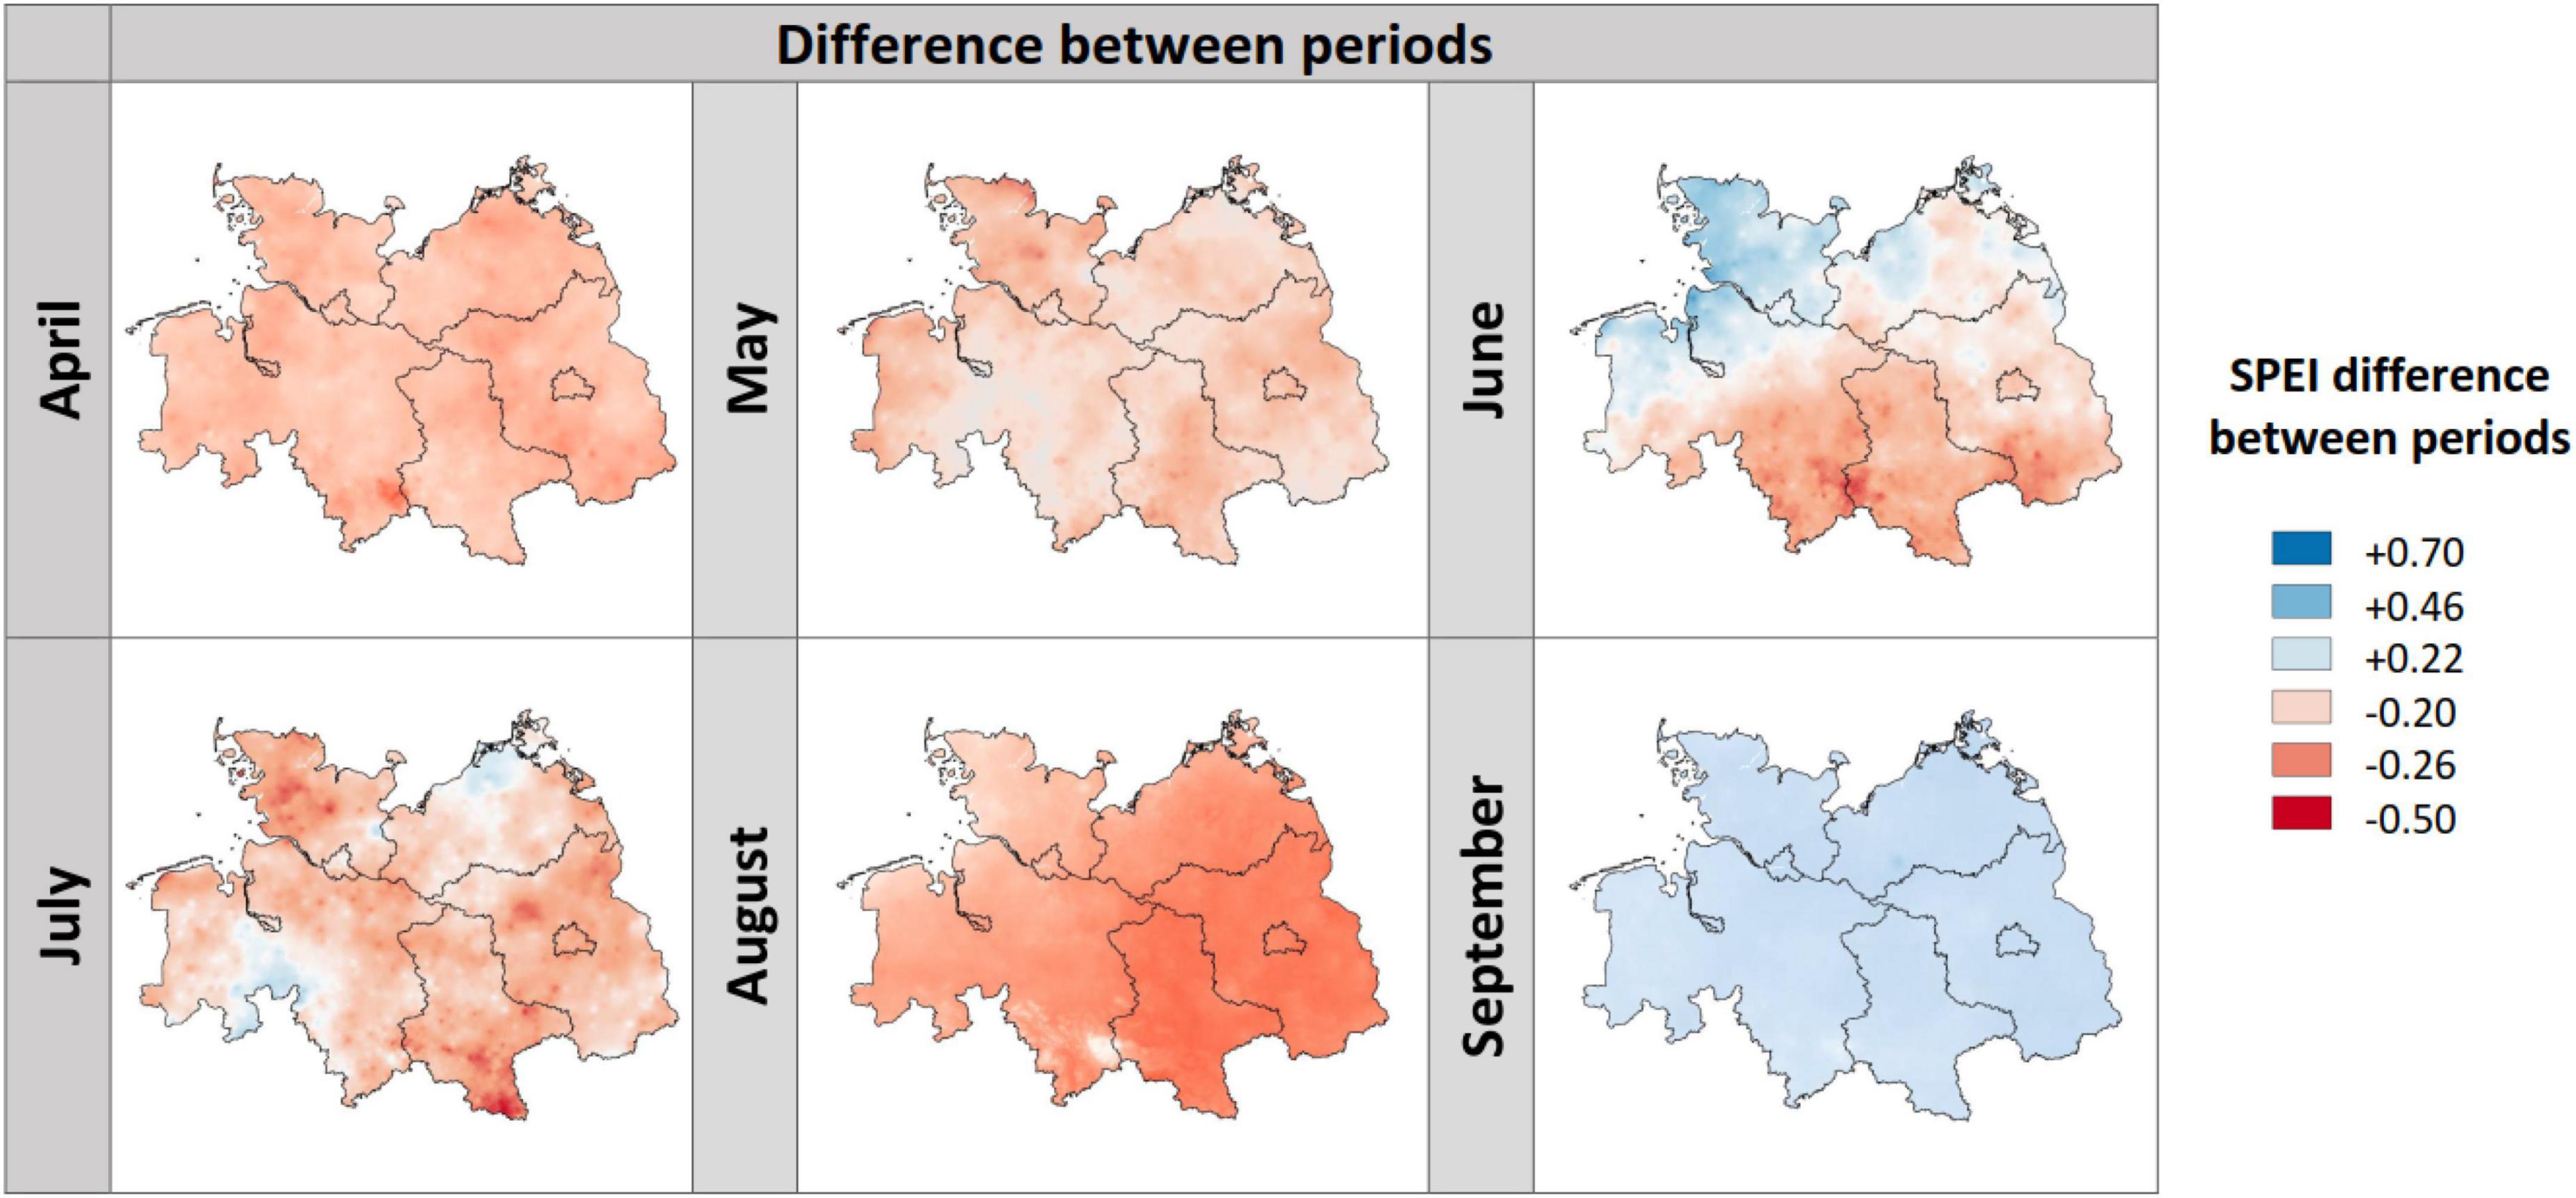
Figure 7. Difference in mean monthly SPEI between the period average of 1948–1982 and of 1983–2017 for the six growing season months (April to September) in the study region. A SPEI decrease stands for climate aridification, an increase for a reduction in aridity.
Discussion
Patterns of Change in Growing-Season Water Availability
The warming trend recorded during the 1983–2017 observation period in the station network in the North German Lowlands was significant in the growing-season months April, June, and September and in the growing season as a whole (April–September), but appeared only as a non-significant tendency in May, July, and August. The pronounced April warming agrees with earlier temperature trend analyses for the 1971–2000 and 1981–2000 periods in the region, which showed for April the largest and for July the smallest temperature increases in the growing season (Schönwiese and Janoschitz, 2008). The growing-season precipitation trends are weaker than the thermal trends, with no significant change visible in 1983–2017 in most months and the whole growing season. An exception is the significant precipitation decrease in April and the significant increase in July. Our results deviate from the trends recorded by Schönwiese and Janoschitz (2008) for the 1971–2000 period for northern Germany, in that decreasing precipitation was recorded in May and June in that interval, while April showed no change. In the nearby Czech Republic, early summer (April-June) showed a tendency toward decreasing precipitation in the 1961–2012 period in most parts of the country, while July precipitation tended to increase, resembling the pattern found in our region in the 1983–2017 period (Trnka et al., 2015a).
Inspecting longer observation periods back to the early twentieth century shows that precipitation decreases have repeatedly occurred in certain growing-season months in the past, but turned later into increases (Schönwiese and Janoschitz, 2008). In fact, the recent July precipitation increase was preceded by corresponding decreases in the first half of the twentieth century. It may be too early to decide whether the recent April precipitation decrease is rather decadal than a long-term trend in the study region. Nevertheless, a multi-proxy reconstruction of Central European June-August precipitation suggests that the 1850–2000 period was drier than the period from 1570 to 1800 (Dobrovolny et al., 2015), pointing at summer precipitation variation at the scale of several centuries.
Climatic water balance (monthly precipitation minus PET) and SPEI (CWB with a 3-month aggregation period and adjusted to a mean of 0) as aridity measures that account for both high temperatures and low precipitation are particularly suitable for capturing seasonal drought patterns during the growing season (Spinoni et al., 2018; Tirivarombo et al., 2018; Zarei et al., 2021). Averaged over the whole study region, both CWB and SPEI indicate a general decrease in water availability in the 1983–2017 period especially in early summer (April–June). A corresponding CWB decrease in particular during April-June was found in the Czech Republic during the 1961–2012 period (Trnka et al., 2015a). Obviously, in northern Germany, a (non-significant) increase in growing-season precipitation by about 40 mm as the regional average from 1983 to 2017 with a putative positive effect on tree growth is more than neutralized by the synchronous PET increase, especially in April and June. Consequently, CWB and SPEI are both significantly decreasing in April, and SPEI is doing so also in June. This should lead to a long-term reduction in soil water availability, as has been shown for April-June during the 1961–2012 period for the Czech Republic through a modeling study of root-zone soil moisture (Trnka et al., 2015b).
A progressive early-summer soil moisture decline is of high physiological relevance, as leaf unfolding mostly happens in April and peak growth typically takes place in June in beech and other broadleaf tree species in the study region (van der Maaten et al., 2018; Fuchs et al., 2021). It is plausible, therefore, that the radial growth of beech, Norway maple, small-leaved lime, and other temperate tree species is most sensitive to water deficits in current year’s (or previous year’s) June (e.g., Scharnweber et al., 2011; Babst et al., 2012; Zimmermann et al., 2015; Fuchs et al., 2021).
The decadal April SPEI decrease is largely driven by a recent precipitation decline in this month, which happens synchronously with a PET increase, while the June SPEI decline is solely a consequence of the increased atmospheric evaporative demand due to the warming. Much of Europe has experienced a significant and continuing increase in PET since the late 1980s (Stagge et al., 2017; Markonis et al., 2021). Our data suggest that the recent water balance deterioration in April affects trees primarily through a decrease in soil water availability, while the PET effect is of secondary importance, as the growing water deficit in April resembles more a cool- or cold-season drought (Markonis et al., 2021). An increasingly dry April will have a negative effect on leaf enfolding and early radial growth especially, when the preceding winter was too dry, as happened, e.g., in 2019 (Schumann et al., 2022). In contrast, increasing water deficits in June often come along with warm-season hot droughts, and the change in June hydrometeorological conditions exposes trees to both impaired atmospheric and soil water status, and frequently also to summer heat. Beech has been found to be particularly sensitive to the combined action of drought and heat (Leuschner, 2020).
Our analysis reveals that the forests of the North German Lowlands are not only exposed to an increasing frequency and severity of hot summer droughts in recent times (Zolina et al., 2013; Hanel et al., 2018; Vautard et al., 2020; Büntgen et al., 2021), but also face due to rising temperatures and evaporative demand a general trend to increasing climatic aridity especially in the early growing season. While severe droughts have the potential to cause crown dieback and subsequent tree death in beech and other more sensitive Central European tree species (Schuldt et al., 2020; Senf et al., 2020; Braun et al., 2021), the trend to higher climatic aridity in the early growing season likely increases the ‘base stress level’ trees are exposed to. In correspondence, several dendrochronological studies in Central European beech forests show recent increases in growth sensitivity to low summer precipitation and possibly also high summer temperatures (e.g., Knutzen et al., 2017; Kular et al., 2017). This may trigger acclimation responses such as osmotic and hydraulic adjustments, leaf area reduction, and modifications in root system structure and functioning (Leuschner, 2020; Nardini, 2021; Pritzkow et al., 2021), which might help maintain tree vitality and productivity in a warming and drying climate. However, when a species’ acclimation potential is exhausted, this chronic stress in early summer may lead to reduced carbon gain, a general vitality reduction, and increased susceptibility to drought damage and pathogen attack. This is suggested by the fact that beech radial growth is in the study region more sensitive to June SPEI than to other putative growth-influencing climatic factors (Scharnweber et al., 2011; Weigel et al., 2018; see text footnote 1).
Our analyses address changes in the frequency and severity of droughts only through changes in 3-month SPEI in the summer months, but do not quantify thermal and hydrological parameters with closer linkage to tree physiology, notably the extent of soil water depletion, atmospheric vapor pressure deficit, and heat. However, there is a consensus that the observed warming trend will lead to an increase of extreme thermal and hydrometeorological events in Europe in the twenty-first century (Fischer and Schär, 2010; Hari et al., 2020; Forzieri et al., 2021) and likely to an over-proportional increase of negative impacts on forests and other natural and anthropogenic systems. This suggests that SPEI changes are reflecting edaphic and atmospheric drought quite well (Tirivarombo et al., 2018).
Regional Variation in Growing-Season Drying Trends
The North German Lowlands are characterized by a fairly steep gradient of climatic aridity from WNW to ESE, as is displayed by two climate variables with high relevance for beech growth and vitality, i.e., growing-season CWB and June precipitation (see Supplementary Figure 2). Both variables clearly distinguish the states of Saxony-Anhalt, Brandenburg, and the east of Mecklenburg-Vorpommern from the western coastal regions. The eastern part of Lower Saxony and the western part of Mecklenburg-Vorpommern form a climatic transition zone between the two regions. The cumulative water deficit in the growing season increases from 50 to 100 mm in the North Sea coastal regions to > 300 mm in Saxony-Anhalt and Brandenburg. The deficit has increased from 1948–1982 to the 1983–2017 period in large parts of the study region, except for Schleswig-Holstein and northwest Lower Saxony, where it decreased. Particularly large is the deficit increase in parts of southern Lower Saxony and in the north of Saxony-Anhalt and Mecklenburg-Vorpommern with increments of up to 30 mm in the 35-year observation period.
The strength of the negative trends in precipitation amount, CWB, and SPEI of April, May, and June significantly increased with decreasing mean annual precipitation of the location. Thus, at the drier sites with a more continental climate, the decline in early-growing-season water availability was in tendency more pronounced than in the coastal more humid regions, and June warming was also more pronounced. Particularly tight was the MAP dependency for the decrease in April precipitation, CWB, and SPEI, and for June SPEI, while the second half of the growing season (July–September) revealed weaker or no relations of climate trends to MAP. Thus, the differences in hydrometeorological conditions between the oceanic north-western and sub-continental south-eastern regions are actually increasing with proceeding climate warming. This points at growing climatic stress exposure of those beech forests that already grow under more challenging thermal and hydrometeorological conditions. Physiological investigations have to show whether these beech populations are also better adapted to the stress or not.
Conclusion
Our analysis of recent change in thermal and hydrometeorological conditions in northern Germany demonstrates decreases in the climatic water balance since the 1980s especially in the physiologically important months of April and June, which deteriorates the forest growth climate in the larger part of the study region. Decadal decreases in June precipitation, as have happened in the core of the study region, are enhancing the increasing stress level. In general, the decrease in early-growing-season water availability is more pronounced in eastern Germany with a drier sub-continental climate than at the North Sea coast, where the growing-season water balance actually has become more favorable. Both the trend toward more extreme summer droughts and the general aridification of the early growing season suggest that beech forests may meet their drought and heat limits in part of the study region, notably in Saxony-Anhalt (and adjacent regions of western Brandenburg and eastern Lower Saxony) with lowest actual June precipitation and strongest decreases in June precipitation and June SPEI. Forestry planning in this region has to consider these threats by selecting tree species with proven drought tolerance such as oak, linden, hornbeam and maple species with adaptation to the continental climates of eastern and south-eastern Europe (Walentowski et al., 2017; Fuchs et al., 2021). Recently stagnating or even declining radial growth trends of beech in the regions with decreasing June precipitation match the findings of our climatological analysis (see text footnote 1). Our study further suggests that analyzing climate-variable trends with greatest biological relevance can provide forestry with a promising early-warning tool in the face of climate warming.
Data Availability Statement
The raw data supporting the conclusions of this article are freely available from https://opendata.dwd.de/climate_environment/CDC/.
Author Contributions
CL: funding acquisition, conceptualization, and writing. BB-E: data curation and analysis, data visualization, and editing. RW: supervision of data analysis and visualization and editing. All authors contributed to the article writing and approved the submitted version.
Funding
This study was part of the research project BEECHLIMITS which was funded by the German Federal Ministry of Nutrition and Agriculture (BMEL) and the Ministry for the Environment (BMUB) through the Waldklimafonds (contract no. 22WC415001). The financial support was gratefully acknowledged. We acknowledge support from the Open Access Publication Funds of the Göttingen University.
Conflict of Interest
The authors declare that the research was conducted in the absence of any commercial or financial relationships that could be construed as a potential conflict of interest.
Publisher’s Note
All claims expressed in this article are solely those of the authors and do not necessarily represent those of their affiliated organizations, or those of the publisher, the editors and the reviewers. Any product that may be evaluated in this article, or claim that may be made by its manufacturer, is not guaranteed or endorsed by the publisher.
Acknowledgments
We thank Frank Kaspar, Head of the National Climate Monitoring (DWD), for valuable information about the coverage of climate station data.
Supplementary Material
The Supplementary Material for this article can be found online at: https://www.frontiersin.org/articles/10.3389/ffgc.2022.830977/full#supplementary-material
Abbreviations
CWB, climatic water balance (P—PET); DWD, Deutscher Wetterdienst (German Weather Service); MAP, mean annual precipitation; MAT, mean annual temperature; P, precipitation; PET, potential evapotranspiration; SPEI, Standardized Precipitation Evapotranspiration Index; T, air temperature.
Footnotes
- ^ Weigel, R., Bat-Enerel, B., Dulamsuren, C., Muffler, L., Weithmann, G., and Leuschner, C. (submitted). The interplay of global warming, drought, and soil properties control the climate vulnerability of European beech along a climatic range-equivalent precipitation gradient in northern Germany.
References
Allen, C. D., Breshears, D. D., and McDowell, N. G. (2015). On underestimation of global vulnerability to tree mortality and forest die-off from hotter drought in the Anthropocene. Ecosphere 6:129.
Anderegg, W. R. L., Hicke, J. A., Fisher, R. A., Allen, C. D., Aukema, J., Bentz, B., et al. (2015). Tree mortality from drought, insects, and their interactions in a changing climate. New Phytol. 208, 674–683. doi: 10.1111/nph.13477
Babst, F., Poulter, B., Trouet, V., Tan, K., Neuwirth, B., Wilson, R., et al. (2012). Site- and species-specfic response of forest growth to climate across the European continent. Glob. Ecol. Biogeogr. 22, 706–717. doi: 10.1111/geb.12023
Begueria, S., and Vicente-Serrano, S. M. (2017). Calculation of the Standardized Precipitation-Evapotranspiration Index. Available online at: https://cran.r-project.org/web/packages/SPEI/SPEI.pdf (accessed March, 2021).
Braun, S., Hopf, S.-E., Tresch, S., Remund, J., and Schindler, C. (2021). 37 years of forest monitoring in Switzerland: drought effects on Fagus sylvatica. Front. For. Glob. Change 4:765782. doi: 10.3389/ffgc.2021.765782
Büntgen, U., Urban, O., Krusic, P. J., Rybnicek, M., Kolar, T., Kyncl, T., et al. (2021). Recent European drought extremes beyond Common Era background variability. Nat. Geosci. 14, 190–196. doi: 10.1038/s41561-021-00698-0
Ciais, P., Reichstein, M., Viovy, N., Granier, A., Ogée, J., Allard, V., et al. (2005). Europe-wide reduction in primary productivity caused by the heat and drought in 2003. Nature 437, 529–533. doi: 10.1038/nature03972
Deutscher Wetterdienst [DWD] (2021). Metadata Information. Available online at: https://opendata.dwd.de/climate_environment/CDC/observations_germany/climate/monthly/more_precip/recent/RR_Monatswerte_Beschreibung_Stationen.txt (accessed December 1, 2021).
Dobrovolny, P., Brazdil, R., Trnka, M., Kotyza, O., and Valasek, H. (2015). Precipitation reconstruction for the Czech lands, AD 1501-2010. Int. J. Climatol. 35, 1–14. doi: 10.1002/joc.3957
Fischer, E. M., and Schär, C. (2010). Consistent geographical patterns of changes in high-impact European heatwaves. Nat. Geosci. 3, 398–403. doi: 10.1038/ngeo866
Forzieri, G., Girardello, M., Ceccherini, G., Spinoni, J., Feyen, L., Hartmann, H., et al. (2021). Emergent vulnerability to climate-driven disturbances in European forests. Nat. Commun. 12:1081. doi: 10.1038/s41467-021-21399-7
Fuchs, S., Schuldt, B., and Leuschner, C. (2021). Identification of drought-tolerant tree species through climate sensitivity analysis of radial growth in Central European mixed broadleaf forests. For. Ecol. Manage. 330, 126–136.
Gazol, A., and Camarero, J. J. (2021). Compound climate events increase tree drought mortality across European forests. Sci. Total Environ. 816:151604. doi: 10.1016/j.scitotenv.2021.151604
Hanel, M., Rakovec, O., Markonis, Y., Máca, P., Samaniego, L., Kysely, J., et al. (2018). Revisiting the recent European droughts from a long-term perspective. Sci. Rep. 8:9499. doi: 10.1038/s41598-018-27464-4
Hargreaves, G. H., and Allen, R. G. (2003). History and evaluation of Hargreaves evapotranspiration equation. J. Irrig. Drain. Eng. 129, 53–63. doi: 10.1061/(asce)0733-9437(2003)129:1(53)
Hargreaves, G. H., and Samani, Z. A. (1982). Estimating potential evapotranspiration. J. Irrig. Drain. Div. 108, 225–230.
Hari, V., Rakovec, O., Markonis, Y., Hanel, M., and Kumar, R. (2020). Increased future occurrences of the exceptional 2018-2019 Central European drought under global warming. Sci. Rep. 10:12207. doi: 10.1038/s41598-020-68872-9
Jacob, D., Kotova, L., Teichmann, C., Sobolowski, S. P., Vautard, R., Donnelly, C., et al. (2018). Climate impacts in Europe under +1.5°C global warming. Earths Future 6, 264–285.
Jacob, D., Petersen, J., Eggert, B., Alias, A., Christensen, O. B., Bouwer, L. M., et al. (2014). EURO-CORDEX: new high-resolution climate change projections for European impact research. Reg. Environ. Change 14, 563–578.
Kaspar, F., Müller-Westermeier, G., Penda, E., Mächel, H., Zimmermann, K., Kaiser-Weiss, A., et al. (2013). Monitoring of climate change in Germany – data, products and services of Germany’s National Climate Data Centre. Adv. Sci. Res. 10, 99–106. doi: 10.5194/asr-10-99-2013
Knutzen, F., Dulamsuren, C., Meier, I. C., and Leuschner, C. (2017). Recent climate warming-related growth decline Impairs European Beech in the center of Its distribution range. Ecosystems 20, 1494–1511. doi: 10.1007/s10021-017-0128-x
Kroll, J., Denissen, J., Migliavacca, M., Li, W., Hildebrandt, A., and Orth, R. (2022). Spatially varying relevance of hydrometeorological hazards for vegetation productivity extremes. Biogeosciences 19, 477–489. doi: 10.5194/bg-19-477-2022
Kular, T., Cermak, P., Trnka, M., Zid, T., and Rybnicek, M. (2017). Temporal changes in the climate sensitivity of Norway spruce and European beech along an elevation gradient in Central Europe. Agric. For. Meteorol. 239, 24–33. doi: 10.1016/j.agrformet.2017.02.028
Leuschner, C. (2020). Drought response of European beech (Fagus sylvatica L.) – A review. Perspect. Plant Ecol. Evol. Syst. 47:125576. doi: 10.1016/j.ppees.2020.125576
Ma, B., Zhang, B., Jia, L., and Huang, H. (2020). Conditional distribution selection for SPEI-daily and its revealed meteorological drought characteristics in China from 1961 to 2017. Atmos. Res. 246:105108. doi: 10.1016/j.atmosres.2020.105108
Maier, U., and Müller-Westermeier, G. (2010). Verifikation klimatologischer Rasterfelder. Ber. Deut. Wetterdienst no. 235. Offenbach: German Weather Service.
Markonis, Y., Kumar, R., Hanel, M., Rakovec, O., Maca, P., and AghaKouchak, A. (2021). The rise of compound warm-season droughts in Europe. Sci. Adv. 7:eabb9668. doi: 10.1126/sciadv.abb9668
Müller-Westermeier, G. (1995). Numerisches Verfahren zur Erstellung klimatologischer Karten. Ber. Deut. Wetterdienst no. 193. Offenbach: German Weather Service.
Nardini, A. (2021). Can trees harden up to survive global change-type droughts? Tree Physiol. 41, 2004–2007. doi: 10.1093/treephys/tpab128
Orlowsky, B., and Seneviratne, S. I. (2013). Elusive drought: uncertainty in observed trends and short- and long-term CMIP5 projections. Hydrol. Earth Syst. Sci. 17, 1765–1781. doi: 10.5194/hess-17-1765-2013
Padron, R. S., Gudmundsson, L., Decharme, B., Ducharne, A., Lawrence, D. M., Mao, J., et al. (2020). Observed changes in dry-season water availability attributed to human-induced climate change. Nat. Geosci. 13, 477–481. doi: 10.1038/s41561-020-0594-1
Pritzkow, C., Szota, C., Williamson, V., and Arndt, S. K. (2021). Previous drought exposure leads to greater drought resistance in eucalypts through changes in morphology rather than physiology. Tree Physiol. 41, 1186–1198. doi: 10.1093/treephys/tpaa176
R Core Team (2020). R: A Language and Environment for Statistical Computing. Vienna: R Foundation for Statistical Computing.
Roudier, P., Andersson, J. C. M., Donnelly, C., Feyen, L., Greuell, W., and Ludwig, F. (2016). Projections of future floods and hydrological droughts in Europe under a +2°C global warming. Clim. Change 135, 341–355. doi: 10.1007/s10584-015-1570-4
Scharnweber, T., Manthey, M., Criegee, C., Bauwe, A., Schröder, C., and Wilmking, M. (2011). Drought matters – Declining precipitation influences growth of Fagus sylvatica L. and Quercus robur L. in north-eastern Germany. For. Ecol. Manage. 262, 947–961. doi: 10.1016/j.foreco.2011.05.026
Schönwiese, C.-D., and Janoschitz, R. (2008). Klima-Trendatlas Deutschland 1901-2000. 2nd Edn. Frankfurt: University of Frankfurt
Schönwiese, C.-D., and Rapp, J. (1997). Climate Trend Atlas of Europe Based on Observations 1891-1990. Dordrecht: Kluwer Academic Publ.
Schuldt, B., Buras, A., Arend, M., Vitasse, Y., Beierkuhnlein, C., Damm, A., et al. (2020). A first assessment of the impact of the extreme 2018 summer drought on Central European forests. Basic Appl. Ecol. 45, 86–103. doi: 10.1016/j.baae.2020.04.003
Schumann, K., Schuldt, B., Fischer, M., Ammer, C., and Leuschner, C. (2022). Xylem safety in relation to the stringency of plant water status regulation of European beech, Norway spruce and Douglas-fir trees during severe drought. Plant Biol.
Senf, C., Buras, A., Zang, C. S., Rammig, A., and Seidl, R. (2020). Excess forest mortality is consistently linked to drought across Europe. Nat. Commun. 11:6200. doi: 10.1038/s41467-020-19924-1
Spinoni, J., Vogt, J. V., Naumann, G., Barbosa, P., and Dosio, A. (2018). Will drought events become more frequent and severe in Europe? Int. J. Climatol. 38, 1718–1736. doi: 10.1002/joc.5291
Stagge, J. H., Kingston, D. G., Tallaksen, L. M., and Hannah, D. M. (2017). Observed drought indices show increasing divergence across Europe. Sci. Rep. 7:14045. doi: 10.1038/s41598-017-14283-2
Thornthwaite, C. W., and Mather, J. R. (1955). The water balance, Laboratory in Climatology. Baltimore, MD: Johns Hopkins University.
Tirivarombo, S., Osupile, D., and Eliasson, O. (2018). Drought monitoring and analysis: standardised precipitation evapotranspiration index (SPEI) and standardized precipitation index (SPI). Phys. Chem. Earth A/B/C 106, 1–10. doi: 10.1016/j.pce.2018.07.001
Trnka, M., Brazdil, R., Balck, J., Semeradova, D., Hlavinka, P., Mozny, M., et al. (2015a). Drivers of soil drying in the Czech Republic between 1961 and 2012. Int. J. Climatol. 35, 2664–2675. doi: 10.1002/joc.4167
Trnka, M., Brazdil, R., Mozny, M., Stepanek, P., Dobrovolny, P., Zahradnicek, P., et al. (2015b). Soil moisture trends in the Czech Republic between 1961 and 2012. Int. J. Climatol. 35, 3733–3747. doi: 10.1002/joc.4242
Trömel, S., and Schönwiese, C.-D. (2007). Probability change of extreme precipitation observed from 1901 to 2000 in Germany. Theor. Appl. Climatol. 87, 29–39. doi: 10.1007/s00704-005-0230-4
van der Maaten, E., Pape, J., van der Maaten-Theunissen, M., Scharnweber, T., Smiljanic, M., Cruz-García, R., et al. (2018). Distinct growth phenology but similar daily stem dynamics in three co-occurring broadleaved tree species. Tree Physiol. 38, 1820–1828. doi: 10.1093/treephys/tpy042
Vautard, R., van Aalst, M., Boucher, O., Drouin, A., Haustein, K., Kreienkamp, F., et al. (2020). Human contribution to the record-breaking June and July 2019 heatwaves in Western Europe. Environ. Res. Lett. 15:094077. doi: 10.1088/1748-9326/aba3d4
Vicente-Serrano, S. M., Beguería, S., and López-Moreno, J. I. (2010). A Multiscalar Drought Index Sensitive to Global Warming: the Standardized Precipitation Evapotranspiration Index. J. Clim. 23, 1696–1718. doi: 10.1175/2009jcli2909.1
Walentowski, H., Falk, W., Mette, T., Kunz, J., Bräuning, A., Meinardus, C., et al. (2017). Assessing future suitability of tree species under climate change by multiple methods: a case study in southern Germany. Ann. For. Res. 60, 101–126.
Weigel, R., Klisz, M., Kreyling, J., van der Maaten-Theunissen, M., Muffler, L., Wilmking, M., et al. (2018). Winter matters: sensitivity to winter climate and cold events increases towards the cold distribution margin of European beech (Fagus sylvatica L.). J. Biogeogr. 45, 2779–2790. doi: 10.1111/jbi.13444
Zarei, A. R., and Moghimi, M. M. (2019). Modified version for SPEI to evaluate and modeling the agricultural drought severity. Int. J. Biometeorol. 63, 911–925. doi: 10.1007/s00484-019-01704-2
Zarei, A. R., Shabani, A., and Moghimi, M. M. (2021). Accuracy assessment of the SPEI, RDI and SPI drought indices in regions of Iran with different climate conditions. Pure Appl. Geophys. 178, 1387–1403. doi: 10.1007/s00024-021-02704-3
Zimmermann, J., Hauck, M., Dulamsuren, C., and Leuschner, C. (2015). Climate warming-related growth decline affects Fagus sylvatica, but not other broad-leaved tree species in Central European mixed forests. Ecosystems 18, 560–572. doi: 10.1007/s10021-015-9849-x
Keywords: climate aridification, climatic water balance, June precipitation, SPEI trend, temperature increase, tree growth
Citation: Bat-Enerel B, Weigel R and Leuschner C (2022) Changes in the Thermal and Hydrometeorological Forest Growth Climate During 1948–2017 in Northern Germany. Front. For. Glob. Change 5:830977. doi: 10.3389/ffgc.2022.830977
Received: 07 December 2021; Accepted: 08 April 2022;
Published: 16 May 2022.
Edited by:
Tom Grant Pypker, Thompson Rivers University, CanadaReviewed by:
Xi Zhu, Cold and Arid Regions Environmental and Engineering Research Institute (CAS), ChinaDaeryong Park, Konkuk University, South Korea
Abdol Rassoul Zarei, Fasa University, Ireland
Copyright © 2022 Bat-Enerel, Weigel and Leuschner. This is an open-access article distributed under the terms of the Creative Commons Attribution License (CC BY). The use, distribution or reproduction in other forums is permitted, provided the original author(s) and the copyright owner(s) are credited and that the original publication in this journal is cited, in accordance with accepted academic practice. No use, distribution or reproduction is permitted which does not comply with these terms.
*Correspondence: Christoph Leuschner, Y2xldXNjaEBnd2RnLmRl