Abstract
Litter decomposition is a central process in forest ecosystems because of its role in carbon and nutrient cycling and maintaining soil fertility. Decomposition is affected by plant traits, soil and microenvironmental conditions, topography, and vegetation structure, which varies with successional age. However, it is unclear how all these factors affect leaf decomposition of dominant tree species in tropical dry forests (TDFs). The objective of this study was to compare the decomposition rates of six dominant tree species: three legumes (Caesalpinia gaumeri, Lysiloma latisiliquum, Piscidia piscipula) and three non-legumes (Bursera simaruba, Gymnopodium floribundum, Neomillspaughia emarginata) in five successional age categories (8–10, 15–22, 23–30, 65–84, > 85 years-old) and two topographic conditions (flat and sloping sites) in a TDF, and to analyze the association with leaf traits (toughness, N, C and total phenols content) soil properties (bulk density, organic carbon, pH, clay), microenvironmental (litter and soil moisture, leaf area index), and vegetation variables (basal area, aboveground biomass, tree diameter, tree height). Litterbags were placed in 30–400 m2 circular plots distributed in forests of the Yucatan, Mexico, and collected on six occasions spread over 230 days (540 samples per species). L. latisiliquum and C. gaumeri had the highest decomposition rates (as well as leaf nitrogen concentration and the lowest leaf toughness). Conversely, G. floribundum had the lowest decay rate. Decomposition rate reached high values at intermediate successional ages, suggesting that soil fertility recovers rapidly after disturbance, although only L. latisiliquum showed significant differences among stand age categories. Decomposition rate was consistently higher at flat sites than on slopes but the difference was significant only for L. latisiliquum. The soil, vegetation structure and microenvironmental variables that contributed most to explaining variation in decay rates varied among species. Decomposition tended to increase with soil moisture and clay content, and to decrease with soil organic carbon and pH suggesting susceptibility to climate change and soil erosion, particularly in sloping areas. Our results highlight the importance of analyzing species-specific responses, especially for dominant species, which likely contribute most to leaf litter decomposition, and to consider key ecological factors that influence this key process.
Introduction
Approximately 90% of the net primary production of terrestrial ecosystems is recycled through the decomposition of litter —plant residues that fall to the soil, including leaves, branches, and reproductive structures of plants (Graça et al., 2007). The continued return of organic matter and nutrients to the soil through litter decomposition is a central process in the biogeochemical cycles of forest ecosystems and the maintenance of soil fertility and soil invertebrates and microorganisms (Prause et al., 2002; Lu and Liu, 2012; Aryal et al., 2015). Decomposition is influenced by regional factors such as precipitation and temperature (Epstein et al., 2002; Zhang et al., 2008; Schilling et al., 2015) and local factors like soil moisture (Lennon et al., 2012; Evans and Wallenstein, 2014), the chemical composition of leaves (Talbot and Treseder, 2012; Jackson et al., 2013; Zanne et al., 2015), forest successional age (Xuluc et al., 2003; Ostertag et al., 2008; Schilling et al., 2015), topography (Sariyildiz et al., 2008; von Arx et al., 2012), and composition and activity of decomposers (Schilling et al., 2015; Strickland et al., 2015; Da Silva et al., 2018). However, we still lack an understanding of the effects of microenvironment, vegetation structure, successional age, topography, and soil conditions on litter decomposition rates of dominant tree species in tropical dry forests (TDFs) (Xuluc et al., 2003; von Arx et al., 2012).
Leaf decomposition varies among species and is related to chemical composition, particularly to C, N, P, and lignin content and their stoichiometry (Xuluc et al., 2003; Ostertag et al., 2008; Talbot and Treseder, 2012). The decomposition rate increases in species with high leaf “quality,” characterized by high N and P content, a low C/N ratio, soft leaves and no or little recalcitrant compounds such as lignin and total phenols (Xuluc et al., 2003; Erickson et al., 2014; Sánchez-Silva et al., 2018). Many species of the Fabaceae or legume family have symbiotic relationships with N-fixing bacteria and therefore could have high-quality leaves (Villalobos, 2006; Barron et al., 2011; Gei et al., 2018). On the other hand, leaf toughness (LT) is a good indicator of C investment in structural tissue for protection and negatively affects decomposition rates since harder or stronger leaves (higher lignin, cellulose, and hemicellulose content) take longer to decompose (Freschet et al., 2011; Talbot and Treseder, 2012).
At global to regional scales, leaf decomposition rates are known to increase with temperature (Meentemeyer, 1984; Townsend et al., 1997; Kirschbaum, 2000). However, in tropical forests in isothermal lowlands, decomposition may be less sensitive to temperature and more influenced by water availability (Epstein et al., 2002; Schilling et al., 2015). In TDFs, litter decomposition is closely and positively associated with the amount and seasonal variation of precipitation (Anaya et al., 2007; Powers et al., 2009; Wieder et al., 2009). Decomposition is usually inhibited during the dry season, producing a temporary increase in the accumulation of leaf material and woody debris on the forest floor, and it resumes soon after the first rains (Anaya et al., 2012; Schilling et al., 2015). At the local level, water availability depends not only on precipitation but on microenvironment and soil variables such as relative humidity and litter and soil moisture—the latter closely related to soil bulk density, organic matter and clay content (Lacasta et al., 2005).
Microenvironmental conditions as well as plant species composition (and their associated leaf characteristics) vary during tropical forest succession (Chazdon, 2014; Sánchez-Silva et al., 2018; Schwartz et al., 2022), affecting leaf decomposition rate. However, the evidence for how these drivers of decomposition vary through succession is mixed. Studies carried out in different terrestrial ecosystems (Pérez-Harguindeguy et al., 2000; Kazakou et al., 2006, 2009; Erickson et al., 2014), including TDF (Toky and Ramakrishnan, 1983; Xuluc et al., 2003), indicate that pioneer species tend to have high-quality leaves (with high N concentrations and low C/N ratios), while shade-tolerant species that are characteristic of mature forests tend to have lower-quality leaves, indicating that litter decomposition rates decrease through succession. However, some studies suggest that in TDF, species with lower-quality leaves at the beginning of succession are later replaced by species with higher quality leaves, as resource acquisition strategies shift from slow to fast (Lohbeck et al., 2013; Poorter et al., 2019), leading to the opposite pattern. Other studies in TDF, however, report the opposite successional patterns (Lebrija-Trejos et al., 2010; Pineda-García et al., 2013; Sanaphre-Villanueva et al., 2017). In addition, Gei et al. (2018) documented that N-fixing legume plants (with high-quality leaves) are more prevalent in TDFs than in humid tropical forests, particularly in the early successional stages. Moreover, vegetation development during succession shifts the microenvironmental conditions in the forest floor from dry and sunny to moister and shadier, fostering the activity of decomposers (Lebrija-Trejos et al., 2011; Becknell and Powers, 2014; Lasky et al., 2014). Therefore, changes in leaf quality and microenvironmental conditions throughout succession may have synergistic or opposite effects on the leaf decomposition rates (Xuluc et al., 2003; Schilling et al., 2015).
Few studies have documented the decomposition rate under different topographic conditions (Xuluc et al., 2003). Topography affects decomposition through its effects on water availability, soil properties, and vegetation structure and composition (Vitousek et al., 1994). Part of the soil in sloping terrain is carried by gravity to lower areas; consequently, slopes have thinner soils, which are generally less fertile and with lower water retention capacity (Espinosa, 2012). This limits the establishment and activity of decomposers (Schimel et al., 1999; Strickland et al., 2009) compared to sites in flat areas.
To better understand the factors affecting the litter decomposition rate of dominant tree species in a TDF, we compared rates among six dominant species (three legume and three non-legume tree species) that differ in their leaf characteristics. We selected stands of five successional age categories (8–10, 15–22, 23–30, 65–84, and > 85 years) and two topographic conditions (flat and slope) and explored the relationships between decomposition rate and edaphic, vegetation structure and microenvironmental variables. We addressed the following questions: (1) How does leaf decomposition rate (k) vary among species, and what is the association with leaf characteristics? (2) How does k vary among different successional age categories, and between flat and sloping sites? (3) For each species, which vegetation structure, soil, and microenvironmental variables are more strongly associated with k and how? We hypothesized that leaf litter decomposition rate varies among species reflecting differences in leaf quality, and between successional age categories and topographic conditions, reflecting changes in vegetation structure and composition, as well as in soil and microenvironmental conditions. In particular, we predicted that k would be: (1) higher for species with higher leaf quality, that is, high leaf N concentration and low C/N ratio, LT and total phenols content; (2) higher in advanced successional ages, due to more favorable microenvironmental conditions for decomposition (higher soil and litter moisture), compared to early ages; (3) higher in flat sites with deeper soils and higher water retention capacity than in sloping sites. Additionally, we predicted that (4) the environmental variables most strongly associated with k may differ among species, but in general, litter or soil moisture content and leaf area index (LAI), aboveground biomass or basal area, would be strongly and positively associated with k, while soil bulk density and pH would be negatively associated, reflecting conditions that enhance or inhibit decomposer activity, respectively.
Materials and methods
Study area
The study was conducted at the Yucatan Intensive Carbon Monitoring Site, located in the Kaxil Kiuic Biocultural Reserve and adjacent areas (20° 5′–20° 7′ N, 89° 32′–89° 34′ W) in the center of the Yucatan Peninsula, Mexico (Figure 1). The reserve comprises 1,800 ha of semideciduous TDF.
FIGURE 1
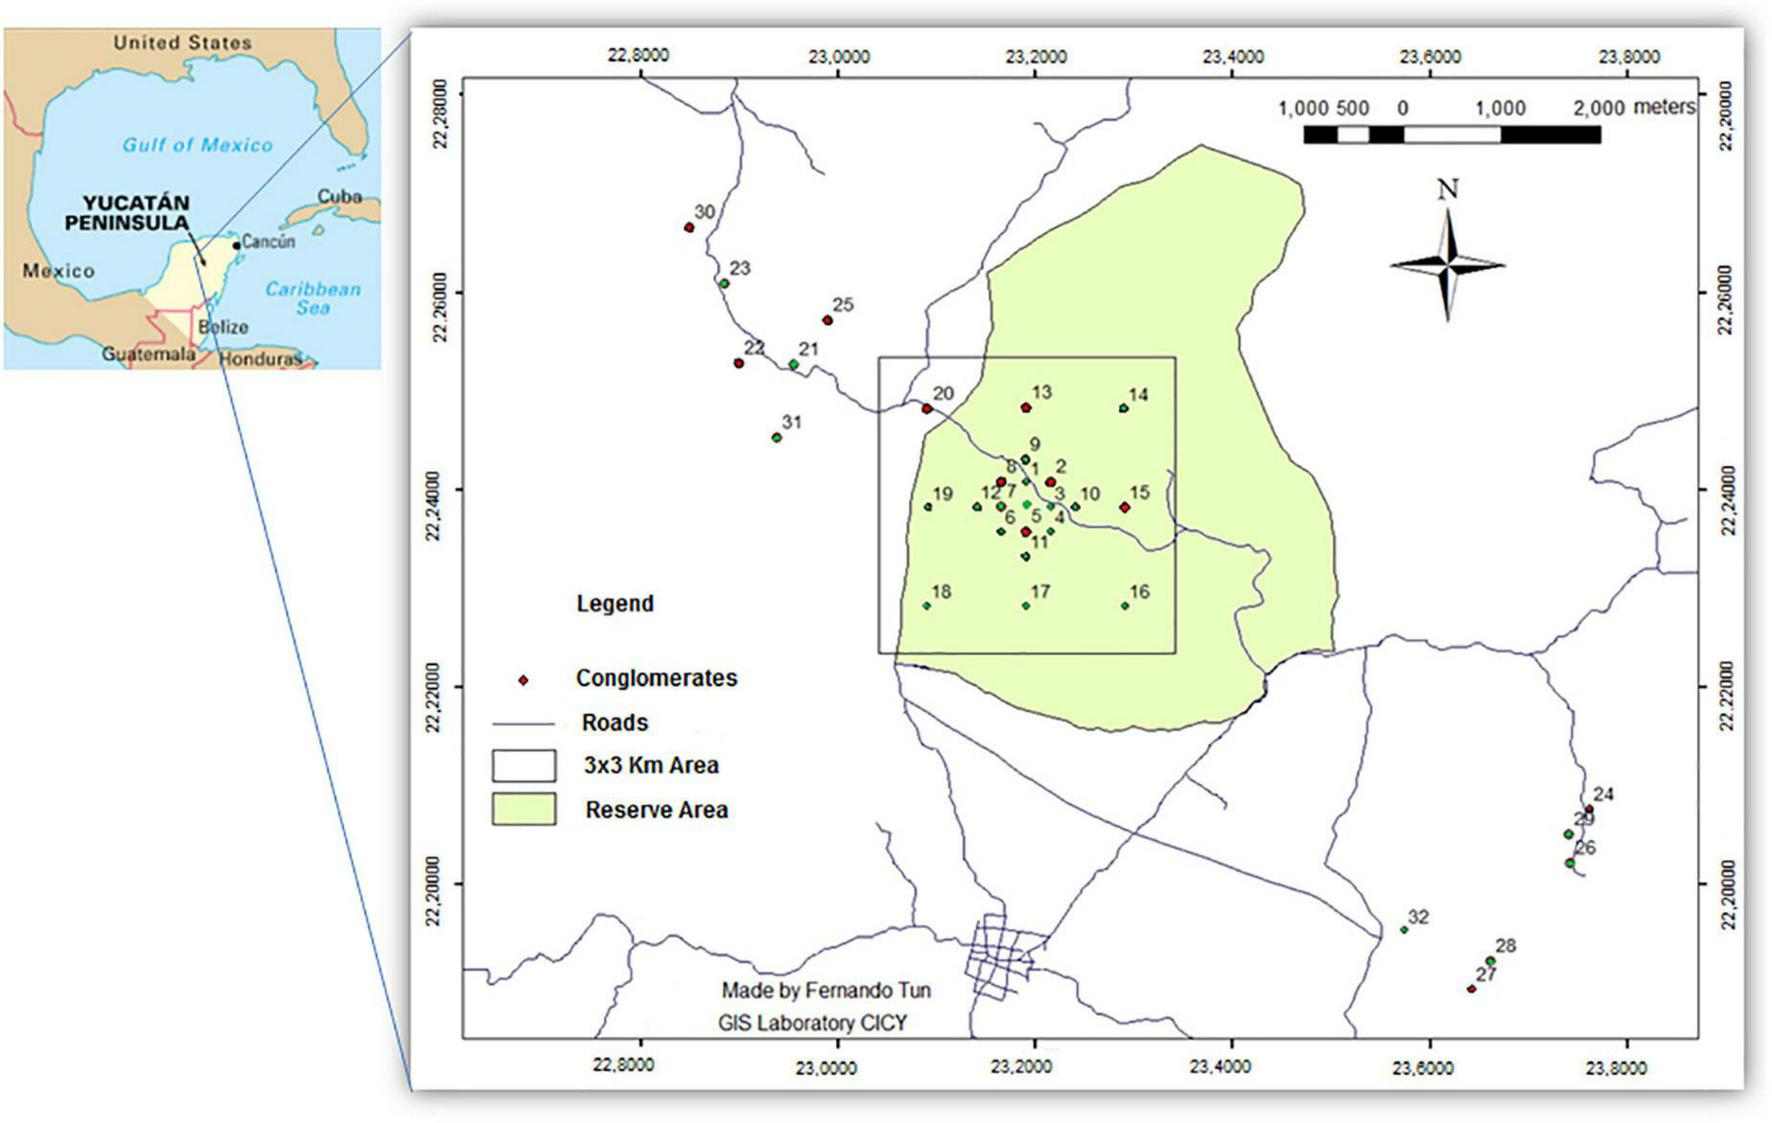
Distribution of forest stands at the Intensive Carbon Monitoring Site, Yucatan, Mexico. Red dots mark the stands sampled in the present study while green dots indicate stands not sampled in this study. The quadrant corresponds to a 3 km × 3 km area where the oldest stands are distributed in a systematically stratified sampling scheme; the younger stands were established in a chronosequence outside the reserve. All forest stands were used only for traditional slash-and-burn agriculture.
The local climate is warm subhumid (Aw), with a mean annual temperature of 26°C and mean annual precipitation between 900 and 1,100 mm (Orellana et al., 2003). Most precipitation occurs between May/June and October, followed by a dry season from November to May that can be split into two stages. The first stage, from November to February, is characterized by lower temperatures and light, sporadic rains associated with cold fronts coming from the north. The second stage, from March to May, is characterized by high temperatures and scarce rains that lead to severe water deficits (Orellana et al., 2003; Arellano-Martín et al., 2022). Due to the recurrent use of itinerant slash-and-burn agriculture, secondary vegetation of different ages of abandonment predominates outside the reserve (Dupuy et al., 2012; Hernández-Stefanoni et al., 2012). The predominant vegetation type is semideciduous tropical forest, in which 50–75% of trees shed their leaves during the dry season. Canopy height of mature forests varies between 12 and 15 m.
Geomorphologically, the area comprises limestone rocks with flat areas alternating with gently sloping hills (10–25% slopes). There are different types of soils depending on topography; Cambisols and Luvisols (deeper soils) are found in flat zones, while Leptosols (shallower and richer in organic matter) predominate on hills and slopes, generally associated with rocky outcrops (Bautista et al., 2003).
Selection of sampling sites
As part of a general project on forest carbon dynamics, 32 1-hectare conglomerates were established, each consisting of four 400 m2 circular plots (11.29 m radius) arranged as an inverted Y, following the design of the Mexican National Forest and Soil Inventory (Comisión Nacional Forestal [CONAFOR], 2013). For this study, we selected 30 plots amongst 11 conglomerates comprising five successional age categories (6 plots per category): I: 8–10 years (canopy height: 3–5 m); II: 15–22 years (canopy height: 6–8 m); III: 23–30 years (canopy height: 10–12 m); IV: 65–84 years (canopy height: 12–14 m); V: > 85 years (canopy height: 13–15 m). Half of the plots in the last two categories were established in flat sites (0–9% slope) and the other half in sloping sites (10–20%); the other successional age categories did not have sufficient sampling sites located on sloping terrain (Supplementary Table 1). All plots shared the same previous land-use type: traditional slash-and-burn agriculture. The following criteria were used to select the study sites: (1) plots used in a multi-year study of leaf litter production (Morffi-Mestre et al., 2020), (2) absence of edge effects and anthropogenic impacts other than previous land use, and (3) easy accessibility.
Selection of species
To select the species, we analyzed the floristic composition of the 11 conglomerates from which the study plots were selected (Morffi-Mestre et al., 2020), ensuring that the selected species were present in as many plots as possible. The ranking of the species by successional age category and topographic location was determined using the Importance Value Index (IVI) (Matteucci and Colma, 1982). The IVI was calculated as the sum of the relative density, relative basal area, and relative frequency of each species. Six dominant species were selected: Piscidia piscipula, Caesalpinia gaumeri, Lysiloma latisiliquum (Fabaceae); Neomillspaughia emarginata, Gymnopodium floribundum (Polygonaceae); and Bursera simaruba (Burseraceae). These species ranked among the 15 top IVI values in each successional age category, attaining the ten highest values in most cases –except for N. emarginata in > 65 year-old stands on sloping terrain (Supplementary Table 2).
Leaf collection
Leaves were collected between February and March 2018 directly from trees found within the study area (mostly in mature forests), by shaking branches of randomly selected individuals until the most senescent leaves fell and then selecting undamaged leaves (Montagnini et al., 1991). The leaves of each species were autoclaved (FE-399) to eliminate any contamination by microorganisms present in leaves and avoid this potential source of variation in the decomposition rate. They were subsequently refrigerated for 2–3 months until incubation in the field.
Collected leaf samples were placed in 15 cm × 15 cm nylon mesh bags (3 mm mesh), as recommended by Colemen et al. (1999) and Karberg et al. (2008). The mesh size prevents sample loss to the soil but allows access by micro- and some macro-decomposers. Each litter bag was filled with 2.5 g of sampled leaves and sealed with corrosion-resistant staples. Samples were placed in each of the 30 study plots from late May 2018 to January 2019, covering the entire rainy season and the first stage of the dry season, when decomposition should be greatest.
Filled litter bags were placed in the field at the end of May (before the start of the rainy season and 2–3 months after litter collection): 3 bags × 30 plots × 6 collection events (540 bags per species). Bags were deployed in groups of three after removing the litter accumulated on the soil surface, approximately at the center of the plots under the forest canopy. Samples were collected 32, 67, 98, 127, 159, 230 days after initial incubation (in July, August, September, October, and November 2018, and January 2019). The collected samples were cleaned to remove soil residues or materials other than litter. The contents of each bag were placed in paper envelopes and oven-dried at 70°C until constant weight (usually after three days); then, the dry weight was measured using an analytical balance (±0.001 g).
Estimating the decomposition rate
The decomposition rate constant (k) was determined with the negative exponential model (Harmon et al., 1999; Karberg et al., 2008):
where:
Xt/X0: ratio of original mass remaining over time,
k: decomposition constant,
t: time elapsed in days.
From k values, we estimated the time required to reach 50 and 99% of leaf decomposition using the following equations (Olson, 1963; Arunachalam and Singh, 2002):
where:
0.693 and 4.605 are correction factors for achieving 50 and 99% decomposition (Olson, 1963),
t 0.5: decomposition time of 50% leaf material (years),
t 0.99: decomposition time of 99% leaf material (years),
k: annual decomposition rate (year–1).
Leaf toughness and chemical composition
As part of a regional study analyzing the functional traits of seasonally-dry tropical forest tree species that govern linkages among carbon (C) and nutrient cycles (Vargas et al., 2021) the leaf quality of each species was assessed through chemical analyses of the initial C, N, P concentrations, of fresh undamaged leaves collected in October 2018 (end of the rainy season) within the same study area. Five individuals per species were used to determine the C, N and P content; six leaves per individual were mixed and ground in a coffee grinder, then 7 mg subsamples were weighed and analyzed in a CN COSTECH elemental analyzer. Samples were analyzed at the University of Minnesota yielding a single leaf C, N and P value per species (see Vargas et al., 2021 for further details).
To determine LT and total phenols content of each study species, undamaged fresh leaves of individual trees from the same study area were collected in August 2018 (rainy season). Leaf toughness was determined with penetration resistance tests (expressed in Newtons: N) using an AG-100KN universal test equipment (Shimadzu Corporation, Tokyo, Japan). Ten leaves from different individuals of each species were punctured with a 0.5 mm needle using a 100 N load cell, avoiding leaf nerves. From the resistance curves obtained, we determined the mean LT for each species. Total phenols content is considered a recalcitrant component that limits the decomposition rate and was measured in 3 samples per species. Samples were ground to obtain 1 g of powder per sample; 10 ml of 95% ethanol were added to the extract. Eighty microliters of 1N Folin-Ciocalteu (Merck KGaA, Germany) was added to 500 μL of crude extract diluted in 1 ml of sterile distilled water, left to stand for 5 min, then 800 μl of 7% Na2CO3 was added. The mixture was stirred and diluted with sterile distilled water to a final volume of 2 ml, then left to stand for 90 min at 25°C. The absorbance was then read at 750 nm in a spectrophotometer (Genesys 10, Thermo Scientific, Madison, WI, USA). The leaf total phenols content for each species was determined by extrapolation on a calibration curve using gallic acid (Merck KGaA, Germany) as the standard, expressed as mg gallic acid equivalent (mg GAE.ml–1).
Vegetation variables
In each 400 m2 circular plot, all woody plants (trees, lianas, and shrubs) ≥ 7.5 cm in diameter at breast height (DBH, measured at 1.3 m above ground level) were sampled once in October 2018. Additionally, all plants ≥ 2.5 cm DBH were sampled in 80 m2 nested circular subplots at the center of each plot. Plants were identified to species, and stem diameter and height were measured to calculate aboveground biomass and basal area.
Aboveground biomass was estimated using allometric equations developed or used in previous studies in tropical forests of the Yucatan Peninsula; the equation of Ramírez et al. (2019) was used for plants < 10 cm DBH and the equation of Chave et al. (2005) for trees ≥ 10 cm DBH. Both equations consider wood density values for the different species, which were obtained from Hernández-Stefanoni et al. (2020).
Measurement and estimation of microenvironmental and soil variables
We analyzed two microenvironmental variables (litter moisture and LAI), and four soil variables (soil moisture, texture, pH and organic carbon content). To estimate litter and soil moisture a total of 540 leaf and soil samples (3 replicates × 30 plots × 6 collection events) were randomly collected during each litter decomposition census (in July, August, September, October, and November 2018, and January 2019). The leaf samples were collected from the leaf litter covering the samples incubated in the soil and placed in airtight plastic bags. The samples of fresh leaves were first weighed and then dried at 70°C for 72 h; the dry weight was measured with an analytical balance (± 0.001 g). The moisture of each sample was estimated as the difference between fresh and dry weight, divided by dry weight; then, the mean litter moisture of each plot was calculated. Soil samples were collected during each litter decomposition census at points very close to the incubated samples (one soil sample for each incubated sample) at a depth of 5 cm with a shovel; a 10 g subsample was collected from each sample. Soil moisture was calculated by averaging the three replicates, following the same procedure used to measure litter moisture.
The LAI was measured during each litter collection with an LAI-2200C leaf area analyzer (LI-COR Biosciences, Lincoln, NE, USA). Five points were selected in each plot, on the north, east, west, and south edges, plus another in the center. The data were collected using an LAI-2250 optical sensor and the control unit (LAI-2270 console). The LAI was calculated using the program File Viewer (FV2200) version 2.1.1.
To measure soil texture, pH, and soil organic carbon content (SOC), a sampling point was set on each plot at 5.64 m from the center, in a southeast direction. A 30 cm × 30 cm square was established in each plot and litter was first carefully removed from the surface. Soil samples were collected at 10 cm depth. The extracted material was sieved through a 12 mm mesh and homogenized; then, a smaller representative subsample was taken for laboratory analyses: pH (1:2) H2O and percent clay and organic carbon, the latter by the dry-combustion method with a total organic carbon analyzer.
To estimate bulk density, we used the soil pit method. The dry weight of the soil extracted from the soil pit was measured with a digital scale after oven-drying a subsample at 70°C to constant weight. To estimate the pit volume, once the soil pit was emptied, it was covered with a flexible plastic cloth and filled with perlite; the volume of perlite required to fill the hole was measured with a graduated container (in milliliters). This method was used because, in most cases, the presence of rocks or the sloping ground precluded the formation of a regularly- shaped cube. Finally, soil bulk density was estimated by dividing the dry weight of soil by its volume.
Data analysis
The mean k values were compared among species (n = 30 values per species), among successional age categories and between topographic conditions using generalized linear models (GLM) with the “lm” function in the base package of R (version 4.1.3; R Core Team, 2022). Since half of the plots in stand age categories IV and V were on sloping terrain, we excluded these six plots from the analysis comparing among stand age categories (n = 174: 6 species × 5 stand age categories × 3 or 6 plots). Conversely, for the comparison between flat and sloping sites, we used only the plots of stand age categories IV and V, the only ones with plots on both topographic conditions (n = 72: 6 species × 2 age categories × 3 plots × 2 topographic conditions).
Differences in total phenols (n = 3 per species) and LT (n = 10 per species) among species were determined through GLM with the “lm” function in the base package of R (version 4.1.3; R Core Team, 2022) followed by a Tukey post-hoc comparison test implemented in the emmeans package (version 1.8.3; Lenth, 2022). The statistical significance of the differences in leaf N and C content and the C/N ratio could not be tested because only a single value of each variable was obtained for each species.
To assess the relative contribution of leaf characteristics to explaining the variation in k, the k value of each species was related to LT and total phenols content (the only variables for which we had replicates), through a general linear model using the “lm” function in the base package of R (version 4.1.3; R Core Team, 2022).
Since vegetation structure and soil variables were recorded in a single sampling event, the microenvironmental data from the six censuses were averaged per plot for the study period (N = 30). Separate GLMs were run on each ecological variable to determine how their values differed among successional age categories. We used the “lm” function in the base package of R (version 4.1.3; R Core Team, 2022) followed by a post-hoc Tukey HSD test implemented in the emmeans package (version 1.8.3; Lenth, 2022).
We explored the relationships between litter decomposition rate and 11 microclimatic, soil and vegetation structure explanatory variables (LAI, soil moisture, litter moisture, soil bulk density, pH, % clay and organic carbon content, aboveground biomass, basal area, tree DBH and tree height) using linear regression. To avoid multicollinearity, we calculated the pairwise correlation coefficients among the explanatory variables. We found that the variables describing tree size (aboveground biomass, basal area, tree DBH and tree height) were all correlated (r > | 0.6|; Supplementary Table 3). We decided to exclude tree DBH and tree height from our models since they are used to calculate aboveground biomass (both) and basal area (DBH). Subsequently, we ran one set of models with aboveground biomass and another with basal area. We also found that % clay, pH, soil bulk density and soil organic carbon were correlated (r > | 0.6|; Supplementary Table 3). Consequently, we ran separate models including only one of these variables. Overall, we ran eight models for each species separately: all contained LAI, soil moisture, and litter moisture and either aboveground biomass or basal area plus either % clay, pH, soil bulk density or soil organic carbon. We calculated the Akaike’s information criterion (AIC) and the root mean square error (RMSE) for each of the eight models per species and we made final inferences on the model with the lowest AIC value. To calculate RMSE, we split the data into training (90%) and test (10%) sets five times and we present the average RMSE across the five splits. We standardized all explanatory variables prior to running the models and we present the standardized parameter estimates and tests of their significance (p < 0.05). Finally, we calculated the relative contribution of each explanatory variable by permuting their values and calculating the difference in R2 and RMSE between the permuted and the non-permuted model. We permuted the variables 199 times and we present the mean and standard deviation of the change in R2 values.
We did not include conglomerate as a random effect, since for some conglomerates there was only one or two plots, meaning the random effect variance cannot be calculated. Still, clustering of plots within or even between conglomerates could make samples non-independent, inflating Type I error (Lennon, 2000) and biasing parameter estimates (Dormann et al., 2007). Spatial non-independence is evident when there is a spatial pattern in the residuals of a linear model (Gaspard et al., 2019). Therefore, subsequent to running our models, we tested for spatial autocorrelation in model residuals (Supplementary Appendix 1). All 60 models (except two) showed no significant spatial autocorrelation (Supplementary Appendix 1).
Results
Annual decomposition rates and effects of leaf chemical composition and toughness
The mean annual leaf decomposition rate varied among species (F = 30.112; p < 0.0001; df = 4). The highest rates (k, mean ± 95% CI) were recorded in two legume species: C. gaumeri (k = 2.508 ± 0.387 year–1) and L. latisiliquum (k = 2.493 ± 0.621 year–1), followed by N. emarginata (k = 1.160 ± 0.265 year–1), P. piscipula (k = 1.119 ± 0.273 year–1) and B. simaruba (k = 0.973 ± 0.165 year–1). The lowest value corresponded to the non-legume G. floribundum (k = 0.694 ± 0.147 year–1).
The estimated time interval for the decomposition of 99% leaf biomass varied between 1.6 and 6.3 years. Again, L. latisiliquum and C. gaumeri had the shortest time to loss of leaf biomass, while G. floribundum had the longest estimated time (Supplementary Table 4).
The species differed significantly in initial total leaf phenols content (F = 8.107; p = 0.002; df = 8) and LT (F = 7.611; p = 0.047; df = 9); the species with the softest leaves also had the highest decomposition rates (L. latisiliquum and C. gaumeri), while the species with the toughest leaves (P. piscipula) had an intermediate decomposition rate and the species with the lowest decomposition rate (G. floribundum) had intermediate values of LT. Among-species differences in total leaf phenols showed no obvious relationship with decomposition rate. The differences in leaf N, C, P concentration and the C/N ratio could not be tested for statistical significance since no replicates per species were available (Table 1).
TABLE 1
| Species code | C (%) | N (%) | P (%) | C/N | Total phenols (mg EAG.ml–1) | Leaf toughness (N) |
| Lysiloma latisiliquum | 46.49 | 2.95 | 0.07 | 15.78 | 0.72 ± 0.13b | 0.29 ± 0.08e |
| Caesalpinia gaumeri | 51.04 | 2.79 | 0.10 | 18.25 | 1.11 ± 0.12a | 0.41 ± 0.06d |
| Piscidia piscipula | 51.65 | 2.52 | 0.09 | 20.49 | 0.85 ± 0.12ab | 1.03 ± 0.13a |
| Bursera simaruba | 47.58 | 1.87 | 0.10 | 25.41 | 0.62 ± 0.27b | 0.62 ± 0.05c |
| Neomillspaughia emarginata | 46.13 | 2.77 | 0.08 | 16.67 | 0.68 ± 0.10b | 0.75 ± 0.09b |
| Gymnopodium floribundum | 43.72 | 2.53 | 0.09 | 17.25 | 0.75 ± 0.19b | 0.59 ± 0.08c |
Leaf toughness and chemical composition of the study species.
Different superscript letters indicate significant differences among species. The values of total phenols (n = 3) and leaf toughness (n = 10) are means ± standard deviations.
Considering all species together, total phenols (P) and LT explained 74.0% of the variation in the leaf decomposition rate (Y = 0.991+2.63* P−2.36* LT, R2 = 0.74), although individually neither had a significant effect (Supplementary Table 5). Leaf litter decomposition rate was positively related to P, and negatively related to LT.
Effect of successional age and topography on leaf decomposition rates
Across successional age categories, L. latisiliquum and C. gaumeri showed significantly higher decomposition rates than the rest of the studied species. Significant differences among successional age categories were found only for L. latisiliquum, which showed higher decomposition rates in 23–30 year-old and > 85 year-old forest stands than in 8–10 year-old and 15–22 year-old stands (Figure 2).
FIGURE 2
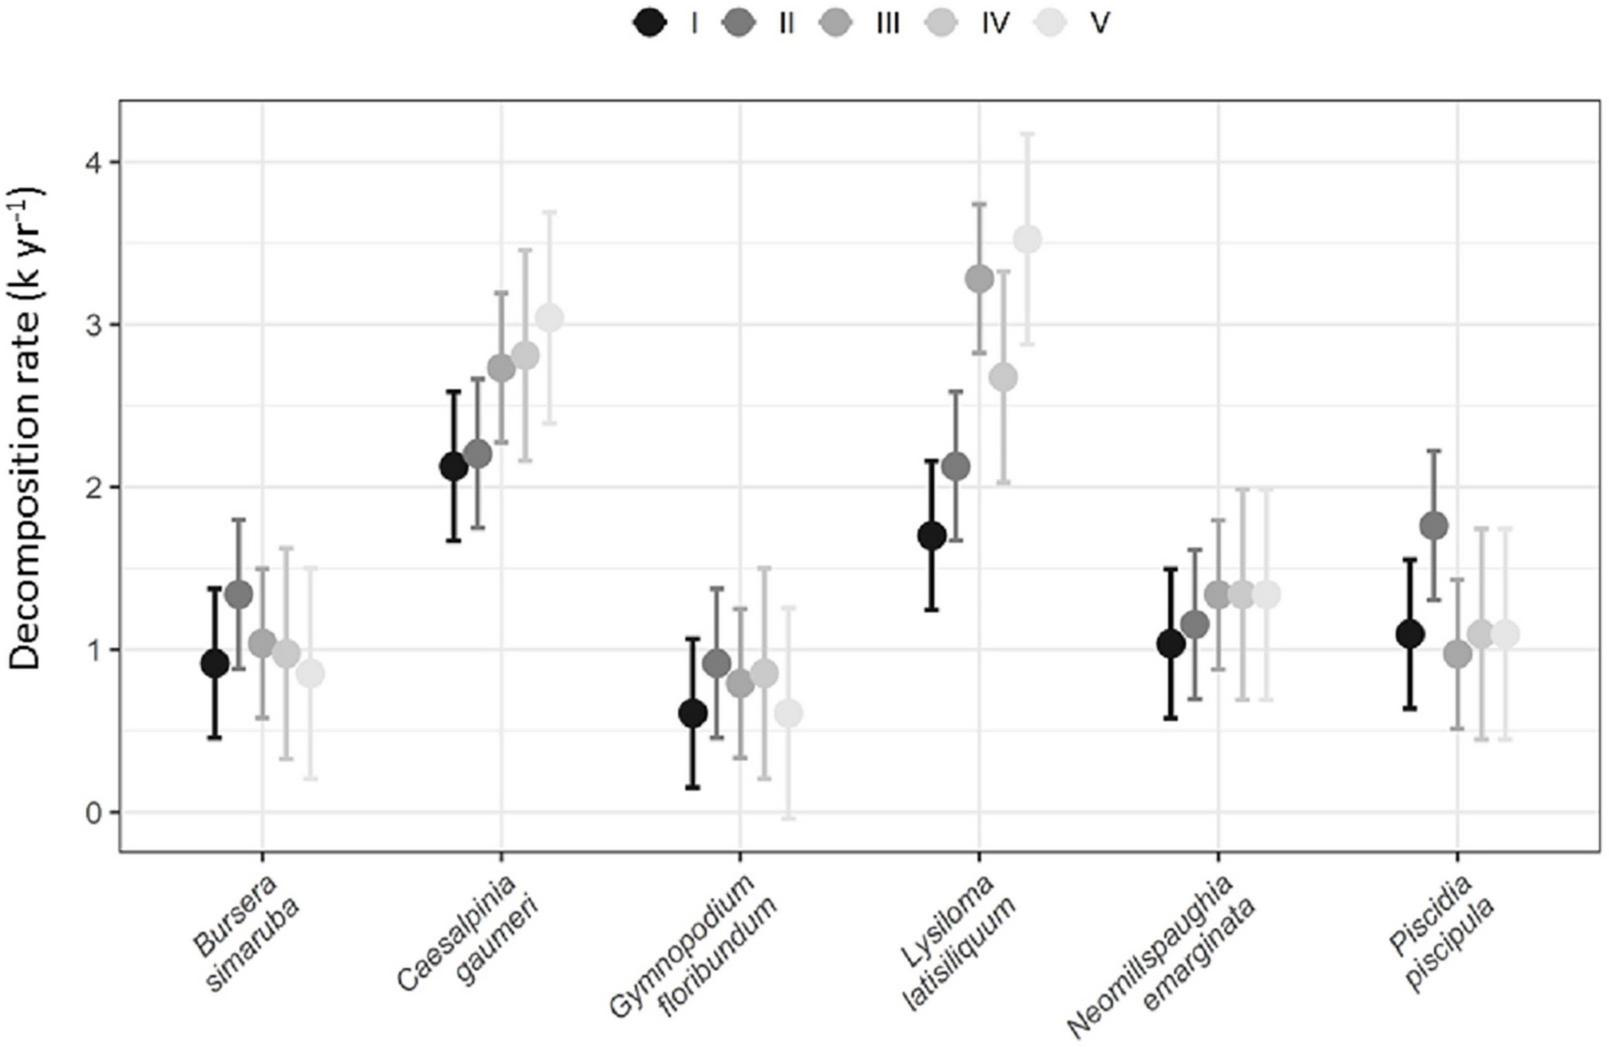
Annual leaf decomposition rate for each species by successional age category (n = 6 plots for age categories I–III: 8–30 years old; 3 plots for age categories IV, V: > 64 years old). Vertical lines represent ± 95% CI.
Although mean annual leaf decomposition was consistently higher in flat sites (mean k = 1.46 ± 0.119 year–1) than on slopes (mean k = 1.03 ± 0.185 year–1) for all species, differences were statistically significant only for L. latisiliquum in stand age category V (Figure 3).
FIGURE 3
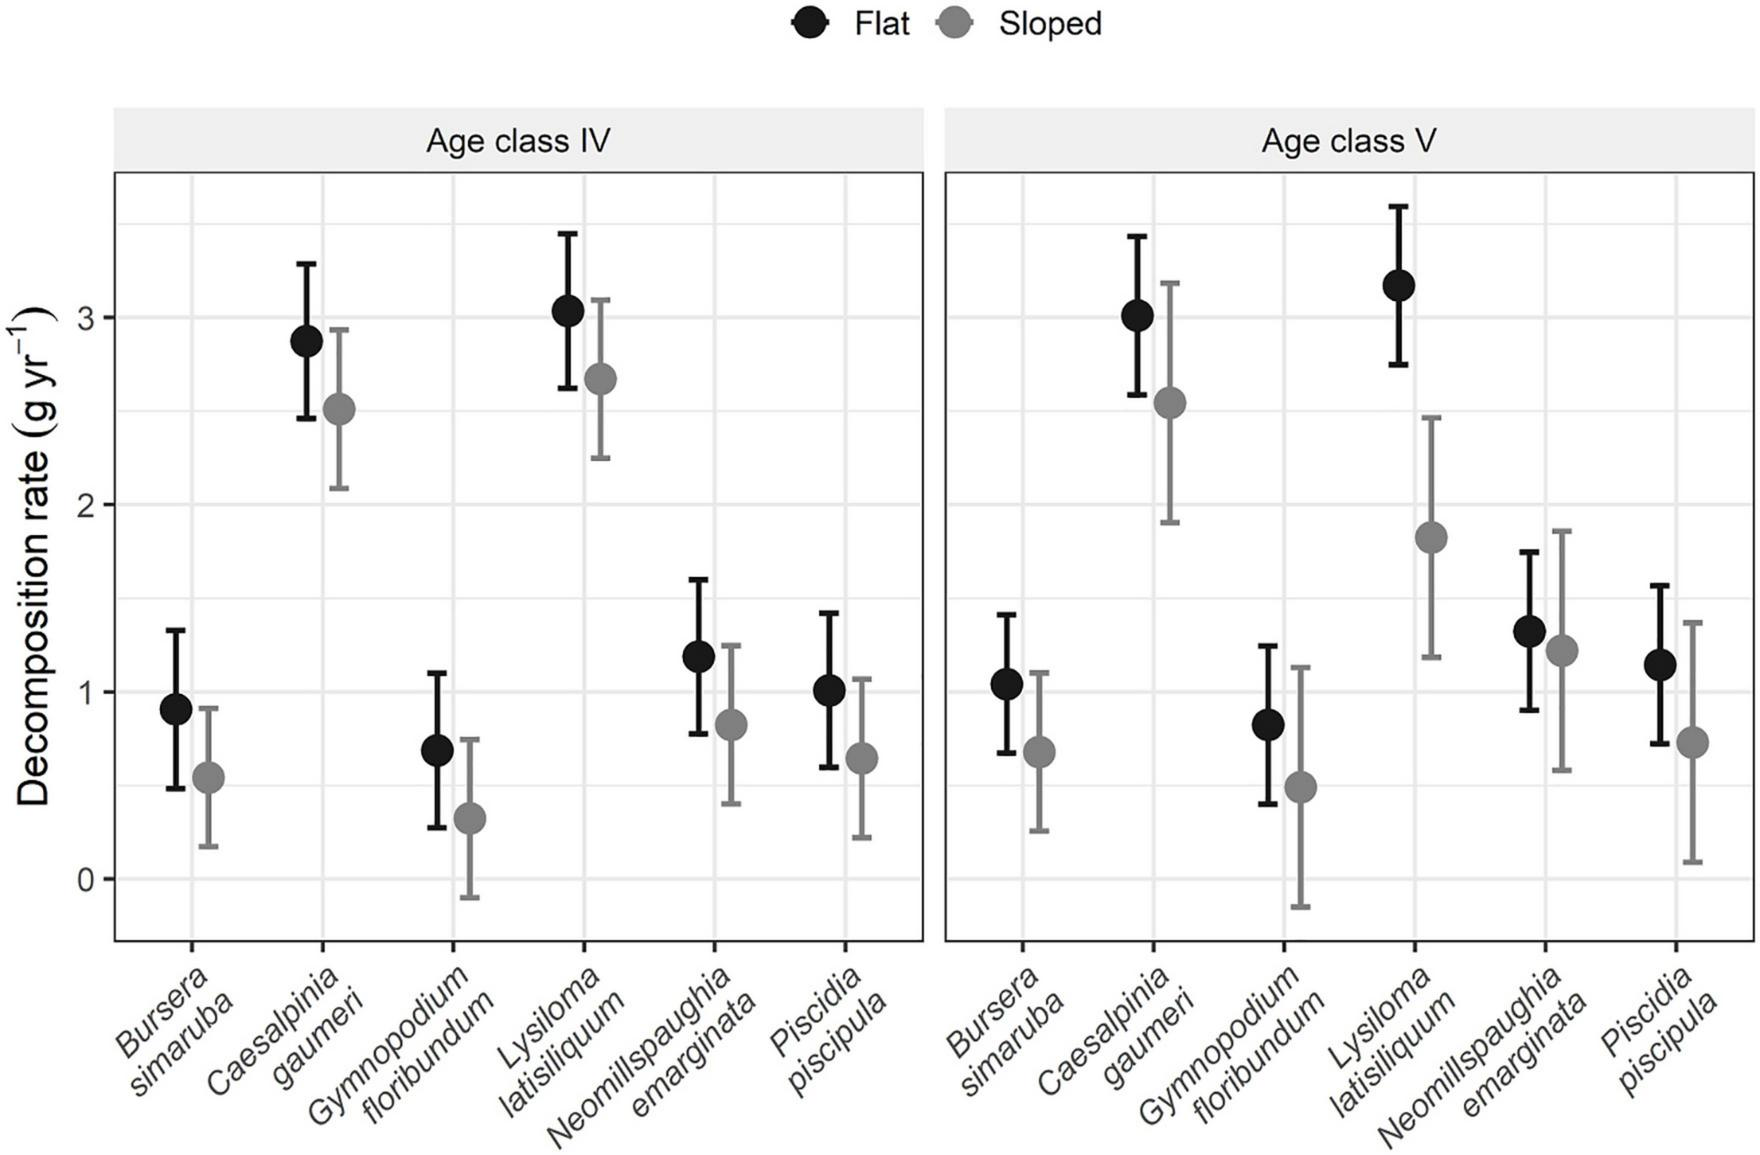
Annual leaf decomposition rate of each species in flat and sloping sites of stand age categories IV (65–84 years old) and V (> 84 years old) (n = 3 plots). Vertical lines represent ± 95% CI.
Relationships of decomposition rates with microenvironmental, soil and vegetation structure variables
The relationship of k with soil, microenvironmental and vegetation structure variables varied markedly among species (Table 2, Supplementary Tables 6, 7, and Figure 4). The best models explained 10.5–42.2% of the variation in k and were statistically significant for L. latisiliquum, B. simaruba, and G. floribundum, but not for the other three species. The variables that contributed significantly to explaining variation in k varied among species: soil moisture for N. emarginata (positive relationship), soil clay content for B. simaruba (positive), soil organic carbon (SOC) for G. floribundum (negative) and soil pH for C. gaumeri (negative) (Table 2, Supplementary Table 7, and Figure 4).
TABLE 2
| Model | R2aj | RMSE | AIC | F | p |
|
Lysiloma latisiliquum
k = 3.19+0.06(BA)−0.71(LAI)+0.15(Sm)+0.05(Lm)−0.68(pH) |
0.240 | 1.12 | 89.8 | 2.83 | 0.038 |
|
Caesalpinia gaumeri
k = 7.48–0.009(BA)−0.22(LAI)+0.20(Sm)+0.01(Lm)−1.20(pH) |
0.152 | 0.688 | 64.7 | 2.04 | 0.109 |
|
Piscidia piscipula
k = 1.21–0.001(AGB)+0.03(LAI)−0.06(Sm)+0.03(Lm)+0.01(Clay) |
0.168 | 0.426 | 43.8 | 2.17 | 0.091 |
|
Neomillspaughia emarginata
k = −2.26 to 0.02(BA)+0.02(LAI)+0.17(Sm)+0.02(Lm)−0.04(SOC) |
0.105 | 0.458 | 43.7 | 1.68 | 0.178 |
|
Bursera simaruba
k = −0.02 to 0.003(AGB)+0.10(LAI)−0.0001(Sm)+0.01(Lm)+0.01(Clay) |
0.422 | 0.256 | 2.55 | 5.23 | 0.002 |
|
Gymnopodium floribundum
k = 0.64–0.005(BA)+0.15(LAI)+0.02(Sm)−0.01(Lm)−0.04(SOC) |
0.341 | 0.201 | −1.02 | 4.01 | 0.008 |
Best models of the multiple regression between the decomposition rate of each species and the microenvironmental and vegetation structure variables.
Significant model and variables are indicated in bold. k, annual leaf decomposition rate; BA, basal area; AGB, aboveground biomass; LAI, leaf area index; Lm, litter moisture; Sm, soil moisture; pH, soil pH; SOC, soil organic carbon; R2aj, adjusted coefficient of determination; RMSE, root mean square error; AIC, Akaike information criterion.
FIGURE 4
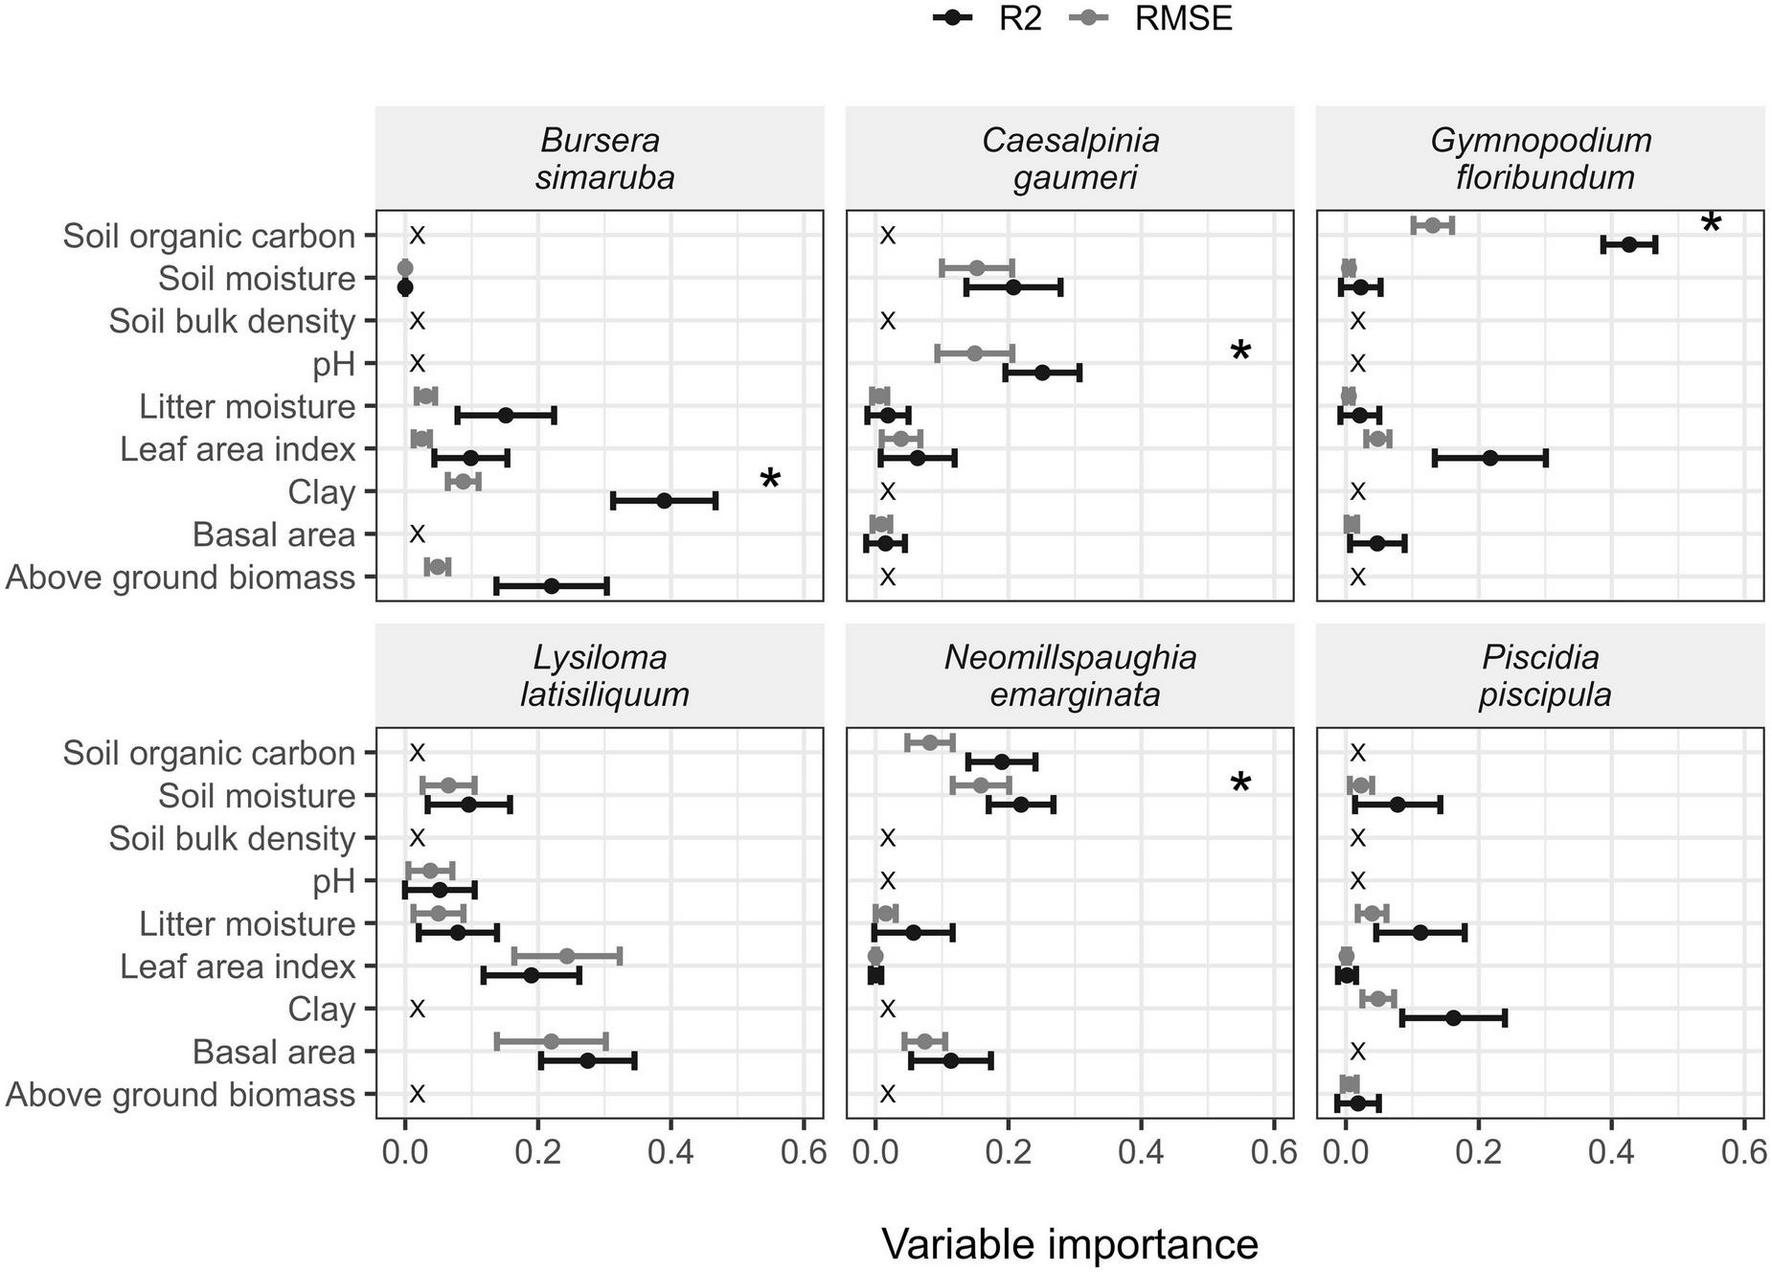
Relative contribution of the explanatory variables to explain variation in leaf decomposition rates of each species (best model). The points indicate the R2 (black) or RMSE (gray) values and the whiskers indicate 95% confidence intervals. *Indicate significant variables.
Nine of the microenvironmental, soil and vegetation variables analyzed differed significantly among successional age categories at p < 0.05 with the other two (soil bulk density and soil organic carbon) significant at p < 0.10; they were generally lower in age category I, and higher and similar among categories III, IV, and V, except for the soil variables (Supplementary Table 8).
Discussion
This is one of the first studies to compare the annual leaf litter decomposition rates (k) of several dominant tree species in a TDF among successional age categories, between flat and sloping terrain conditions and to evaluate their association with leaf, microenvironmental, soil and vegetation structure variables. We expected k to be higher in species with a higher initial leaf quality (high leaf N and P concentration and low C/N ratio, total phenol content, and LT), as well as in older forest stands and flat sites, both associated with more favorable microenvironmental conditions (higher litter and soil moisture). Decomposition rate varied among species and was highest in the legume species with the highest leaf N content and lowest LT. The decomposition rate varied significantly among successional age categories and topographic conditions only for one of the studied species (L. latisiliquum), and it was highest in 23–30 years-old and > 85 years old stands, and in flat sites than in sloping terrain in the latter age category. Finally, the variables most strongly related to k varied among species. The results and their potential implications for the maintenance of soil fertility and biogeochemical cycles in the TDF studied in the face of global change are discussed in detail below.
Annual leaf decomposition rates of the species studied and influence of leaf quality
The mean annual leaf decomposition rates of the six dominant tree species analyzed varied between 0.694 and 2.508 year–1, with an average across species of 1.491 year–1. Although we did not measure leaf litter decomposition during a whole year, we believe that the sampling time (the first 8 months) is sufficient to obtain a good estimate of the annual decomposition rates. Our results are within the range of values reported in previous studies in tropical forests (0.5–2.7 year–1) (Alvarez et al., 1992; Xuluc et al., 2003; Ostertag et al., 2008; Schilling et al., 2015).
As expected, leaf decomposition rates differed among the studied species. However, we found only partial support for our first hypothesis, that the species with the highest initial leaf quality (high leaf N and P concentration and low C/N ratio, total phenol content, and toughness) would have the highest k values. The three legume species had high k values and the two species with the highest values (C. gaumeri and L. latisiliquum) also had the highest leaf N concentrations. However, the species with the lowest k value (G. floribundum) had an intermediate leaf N concentration very similar to the other legume species (P. piscipula). As expected, the lowest LT values corresponded to the highest k values (the legumes L. latisiliquum and C. gaumeri). However, the highest LT value did not correspond to the species with the lowest k value (G. floribundum) but a species with an intermediate k value (the legume P. piscipula). Having thicker, harder, and more energy-costly leaves than the other species, we speculate that P. piscipula may have a more efficient nutrient reabsorption mechanism prior to leaf abscission. Species-specific differences in nutrient reabsorption could confound the values of leaf nutrient concentration and help explain the narrow range of leaf P (0.07–0.10%), since the leaf samples collected for nutrient concentration analyses were part of a different study (Vargas et al., 2021) and were not senescent.
The lowest k value (that of G. floribundum) may seem intriguing, given that this species showed intermediate values for all the leaf variables analyzed except for C (it showed the lowest C value) (Table 1). All six studied species were classified as generalists across TDF succession in a previous study in the same study area (Sanaphre-Villanueva et al., 2017), but they showed a wide range of functional trait variation, from resource-acquisitive species (B. simaruba) with high values of specific leaf area (SLA) and petiole length and low values of wood specific gravity and leaf dry matter content (LDMC), to resource-conservative species (G. floribundum) with the opposite pattern. Thus, the high values of LDMC and low values of SLA of G. floribundum are consistent with and help explain its low rate of leaf decomposition. Additionally, G. floribundum may host ectomycorrhizal fungi (Bandala et al., 2014), which may shift nutrient cycles to being dominated by organic cycling processes resulting in slow decomposition process (Phillips et al., 2013). Unexpectedly, total leaf phenols content was not significantly related to k across species. To better understand the relationship between leaf quality and decomposition rate, more replicates and other leaf parameters such as leaf P content and C/P and lignin/P ratios should be considered (Vitousek et al., 1994; Xuluc et al., 2003).
Influence of successional age and topography on leaf decomposition rates
Our second hypothesis was only partially supported by the results. Leaf decomposition rate varied significantly among stand age categories only for one of the studied species (L. latisiliquum), and it was lowest in the youngest age category (8–10 years old) and highest in the oldest category (> 85 years old). Xuluc et al. (2003) reported an increase in the decomposition rate during the first 13 years of post-disturbance forest development in a semievergreen forest in Campeche, Mexico, while Schilling et al. (2015) documented an increase in litter decomposition rate with successional ages between 14–67 years in a TDF in Costa Rica. However, we found few significant differences in soil properties among successional age categories, and a previous study in the same area found no significant differences in soil organic matter, N, P and K concentration among successional age categories in flat areas (Dupuy et al., 2012), which could help explain why for most of the studied species leaf decomposition rate did not differ significantly among stand age categories –assuming intraspecific variation in investment in leaf tissues follows soil nutrient availability.
In partial agreement with our third hypothesis, although k was consistently higher on flat than sloped sites, the difference was significant only for one species (L. latisiliquum) and only in > 85 years-old stands. Flat sites have more favorable microenvironmental conditions (wetter, shadier, and cooler) as well greater LAI values (Morffi-Mestre, 2021). Meanwhile, steeper slopes have more surface runoff and soil erosion, implying greater loss of water, organic matter, and nutrients, generating less favorable conditions for the establishment and activity of decomposers (Gallardo-Cruz et al., 2009; Markesteijn et al., 2010). Previous studies conducted in the same area have documented significantly lower basal area, aboveground biomass, and tree height, as well as a different woody plant composition with a lower percentage of deciduous species in hills than in flat areas (Dupuy et al., 2012; Hernández-Stefanoni et al., 2012; Ramírez-Guardado, 2015; Sanaphre-Villanueva, 2016). The results of these studies suggest microenvironmental conditions on the soil surface that are more favorable for leaf decomposition in flat sites, as well as potential differences in decomposer community composition associated with differences in plant composition between flat and sloped sites. On the other hand, a previous study in the same area found significantly higher concentrations of soil nutrients (N, P, K) on hills than in flat areas, likely associated with different soil types (Dupuy et al., 2012). Higher availability of soil nutrients may lead to higher investment of leaf tissues (hence higher leaf quality) in sloped sites, partly offsetting the less favorable microenvironmental conditions, which may help explain why the leaf decomposition rates of most species did not differ significantly between flat and sloped sites. Moreover, even for L. latisiliquum, the significantly higher leaf decomposition rates found on flat than sloped sites do not allow us to conclude that the recycling of nutrients follows the same pattern, since we did not consider solute nutrient fluxes. In a tropical rain forest in Costa Rica Hofhansl et al. (2011) found that solid (via litterfall) and solute (i.e., dry deposition and canopy exchange) nutrient fluxes showed an inverse pattern between sites located in different topographic positions.
Relationships of decomposition rates with microenvironmental, soil and vegetation structure variables
Our results provided only minor and mixed support for our fourth hypothesis. We expected the ecological variables that most influence k to vary among species, but not as markedly as we found. The best models combining soil, vegetation structure and microenvironmental variables were significant for only half of the studied species (L. latisiliquum, B. simaruba, and G. floribundum) (Table 2). Moreover, the relative importance of the explanatory variables differed among species (Figure 4 and Supplementary Table 7). We expected a positive influence of basal area (BA) or aboveground biomass (AGB) and LAI on k, because the values of these variables increase along TDF secondary succession creating shadier and more humid conditions on the forest floor that promote decomposer presence and activity (Becknell and Powers, 2014; Lasky et al., 2014). However, for none of the studied species did any of these vegetation structure variables significantly influence k. The influence of these variables may be indirect and mediated by soil properties or other factors not considered in this study, such as the composition and activity of decomposers.
We expected k to be positively related to litter or soil moisture, since decomposer activity is strongly dependent on substrate and water availability, especially in seasonally dry tropical forests (Lacasta et al., 2005; Anaya et al., 2012; Schilling et al., 2015). Soil moisture was positively associated with k for N. emarginata, although the explanatory model was overall not significant. Moreover, clay content, which is indicative of soil’s water retention capacity was also positively related to k for B. simaruba.
We also expected soil bulk density and pH to be negatively associated with k, since the former limits the soil water retention capacity, while the latter limits decomposer activity (Lavelle et al., 1993; Ramos and Zúñiga, 2008). Soil pH was significantly negatively associated with k for C. gaumeri, while soil bulk density was unrelated to k for all studied species. Finally, soil organic carbon (SOC) content was negatively associated with k for G. floribundum. Interestingly, G. floribundum appears to host ectomycorrhizal fungi (Bandala et al., 2014), which may influence soil C stocks by shifting nutrient cycles to being dominated by organic versus inorganic cycling processes (Phillips et al., 2013).
The fact that our R2 values relating microenvironment, vegetation and soil factors to decomposition rates were low indicate that decomposition is the outcome of a complex set of factors, including factors not considered in this study. For example, a recent study in Amazonian rainforests found that fine roots release significant amounts of acid phosphatase into the litter layer and mobilize P, which could affect leaf litter decomposition (Martins et al., 2021), especially in TDFs where enzymatic activity in the rhizosphere is strongly seasonal (Campo et al., 1998) and may co-vary with successional, topo-edaphic and micro-environmental conditions. Research addressing the influence of seasonal pulses in water and nutrient availability, as well as in decomposer composition and activity would greatly advance our understanding of the drivers of leaf litter decomposition in seasonally dry tropical forests.
Conclusion
The annual leaf decomposition rate was generally higher in species of the legume family than in those of the other two families, possibly because of the positive association between decomposition and leaf N and negative association with LT. The high leaf decomposition rates of L. latisiliquum and C. gaumeri suggest that these species may accelerate nutrient cycling, thus helping to boost the recovery and improve the functioning of these forest ecosystems, in soil nutrient-depleted sites. However, solute nutrient fluxes (dry deposition and canopy exchange) should be considered in addition to leaf litter decomposition to account for total nutrient fluxes, since these two components may show inverse patterns. Moreover, leaf litter decomposition of L. latisiliquum was sensitive to successional age, topographic and microenvironmental conditions, indicating that local conditions should be carefully considered in studies involving this species.
In general, our results indicate that successional age and topography affect leaf litter decomposition rate, but their effects were significant only for one of the studied species (L. latisiliquum). The annual decomposition rate was higher at flat sites than on slopes, lowest in the youngest successional age category and highest in and the oldest (> 85 years old) and intermediate (15–30 years old) categories. These results are consistent with a rapid recovery of the carbon cycle and soil abiotic and biotic conditions during TDF succession, particularly on flat sites, but require further research addressing, among other factors, solute nutrient fluxes as well as fine-root and microbial enzymatic activity.
Finally, we found idiosyncratic relationships of leaf decomposition with microenvironmental, soil and vegetation variables indicating that decomposition is the outcome of a complex set of factors showing species-specific effects. The combined effect of fine-scale variability in soil types and properties of the studied TDFs (closely associated with topography) and strong seasonality of water and nutrient availability as well as decomposer activity likely allow for the great variation observed in this study. Our results highlight the importance of analyzing species-specific responses, especially for dominant species, which likely contribute most to leaf litter decomposition, and to consider key ecological factors that influence this important process.
Statements
Data availability statement
The raw data supporting the conclusions of this article will be made available by the authors, without undue reservation.
Author contributions
HM-M and JD-R: study design and writing the drafts. HM-M, JD-R, FM-P, and FC-M: data management. HM-M and RF: data analyses. GÁ-P, JP, JA, RF, FM-P, and FC-M: revising the drafts. All authors contributed to the article and approved the submitted version.
Funding
This study was financially supported by the Reinforcing REDD+ and the South-South Cooperation Project, funded by the Mexican National Forest Commission (CONAFOR), United States Forest Service (USFS), and USAID. This study was part of HM-M’s Ph.D. dissertation which was supported by a grant from the Mexican Council of Science and Technology (CONACYT).
Acknowledgments
We thank CONACYT for the grant awarded to HM-M, James Callaghan, and the staff of the Kaxil Kiuic Biocultural Reserve for the logistical support provided; Santos Armin Uc, Mario Evelio Uc, Cesar Uc, and Julian Uc for their assistance in fieldwork; Roberth Us Santamaría for his support in the operation of measuring equipment; Drs. Marcela Gamboa Angulo and Katia Ojito for support in phenols testing; and Javier Ivan Cauich Cupú for his support in leaf toughness measurement. María Elena Sánchez-Salazar translated the manuscript into English. This study was conducted with data from the Mexican Network of Intensive Carbon Monitoring Sites.
Conflict of interest
The authors declare that the research was conducted in the absence of any commercial or financial relationships that could be construed as a potential conflict of interest.
Publisher’s note
All claims expressed in this article are solely those of the authors and do not necessarily represent those of their affiliated organizations, or those of the publisher, the editors and the reviewers. Any product that may be evaluated in this article, or claim that may be made by its manufacturer, is not guaranteed or endorsed by the publisher.
Supplementary material
The Supplementary Material for this article can be found online at: https://www.frontiersin.org/articles/10.3389/ffgc.2023.1082233/full#supplementary-material
References
1
Alvarez S. F. J. Sánchez G. R. Sánchez-Gallén I. González-Iturbe J. A. (1992). Métodos para el estudio de la productividad primaria y la descomposición en comunidades terrestres.Mexico City: Universidad Nacional Autónoma de México.
2
Anaya C. A. García O. F. Jaramillo V. J. (2007). Rainfall and labile carbon availability control litter nitrogen dynamics in a tropical dry forest.Oecología150602–610. 10.1007/s00442-006-0564-3
3
Anaya C. A. Jaramillo V. J. Martínez-Yrízar A. García O. F. (2012). Large rainfall pulses control litter decomposition in a tropical dry forest: Evidence from an 8-year study.Ecosystems15652–663. 10.1007/s10021-012-9537-z
4
Arellano-Martín F. Dupuy J. M. Us-Santamaría R. Andrade J. L. (2022). Soil CO2 efflux fluctuates in three different annual seasons in a semideciduous tropical forest in Yucatan, Mexico.Terra Latinoamericana40:e968. 10.28940/terra.v40i0.968
5
Arunachalam A. Singh N. D. (2002). Leaf litter decomposition of evergreen and deciduous Dillenia species in humid tropics of north-east India.J. Trop. For. Sci.14105–115.
6
Aryal D. R. De Jong B. H. J. Ochoa-Gaona S. Mendoza-V J. Esparza-Olguin L. (2015). Successional and seasonal variation in litterfall and associated nutrient transfer in semi-evergreen tropical forests of SE Mexico.Nut. Cycling Agroecosy10345–60. 10.1007/s10705-015-9719-0
7
Bandala M. V. Montoya L. Villegas R. Cabrera T. G. Gutiérrez M. D. J. Acero T. (2014). “Nangañaña”(Tremelloscypha gelatinosa, Sebacinaceae), hongo silvestre comestible del bosque tropical deciduo en la depresión central de Chiapas, México.Acta Bot. Mex.106149–159. 10.21829/abm106.2014.216
8
Barron A. R. Purves D. W. Hedin L. O. (2011). Facultative nitrogen fixation by canopy legumes in a lowland tropical forest.Oecologia165511–520. 10.1007/s00442-010-1838-3
9
Bautista Z. F. Jiménez-Osorio F. Navarro-Albert J. Manu A. Lozano R. (2003). Microrelieve y color del suelo como propiedades de diagnóstico en leptosoles cársticos.México City: Universidad Autónoma de México.
10
Becknell J. M. Powers J. S. (2014). Stand age and soils as drivers of plant functional traits and aboveground biomass in secondary tropical dry forest.Can. J. For. Res.44604–613. 10.1139/cjfr-2013-0331
11
Bivand R. S. Wong D. V. (2018). Comparing implementations of global and local indicators of spatial association.Test27716–748. 10.1007/s11749-018-0599-x
12
Campo J. Jaramillo V. J. Maass J. M. (1998). Pulses of soil phosphorus availability in a Mexican tropical dry forest: Effects of seasonality and level of wetting.Oecologia115167–172. 10.1007/s004420050504
13
Chave J. Andalo C. Brown S. Cairns M. A. Chambers J. Q. Eamus D. et al (2005). Tree allometry and improved estimation of carbon stock and balance in tropical forests.Oecología14587–99. 10.1007/s00442-005-0100-x
14
Chazdon R. L. (2014). Second growth: The promise of tropical forest regeneration in an age of deforestation.Chicago: The University of Chicago Press, 472.
15
Colemen D. C. Blair J. M. Eliott E. T. Freckman D. W. (1999). “Soil invertebrates,” in Standard soil methods for long-term ecological research, edsRobertsonG. P.BledsoeC. S.ColemenD. C.SollinsP. (New York, NY: Oxford University Press).
16
Comisión Nacional Forestal [CONAFOR] (2013). Inventario Nacional y de Suelos. Manual y procedimiento para el muestreo de campo.Zapopan: Comisión Nacional Forestal.
17
Da Silva L. S. Pinheiro T. G. Chagas A. Jr. Marques M. I. Battirola L. D. (2018). Temporal and spatial variation of Myriapoda (Diplopoda and Chilopoda) assemblages in a Neotropical floodplain.For. Ecol. Manag.429189–197. 10.1590/1676-0611-bn-2018-0514
18
Dormann C. F. McPherson M. J. Araújo B. M. Bivand R. Bolliger J. Carl G. et al (2007). Methods to account for spatial auto correlation in the analysis of species distributional data: a review. Ecography30, 609–628. 10.1111/j.2007.0906-7590.05171.x
19
Dupuy J. M. Hernández-Stefanoni J. L. Hernández-Juárez R. A. Tetetla-Rangel E. López-Martínez J. O. Leyequién-Abarca E. et al (2012). Patterns and correlates of tropical dry forest structure and composition in a highly replicated chronosequence in Yucatan, Mexico.Biotropica44151–162. 10.1111/j.1744-7429.2011.00783.x
20
Epstein H. E. Burke I. C. Lauenroth W. K. (2002). Regional patterns of decomposition and primary production rates in the U.S. great plains.Ecology83320–327. 10.1890/0012-96582002083[0320:rpodap]2.0.co,2
21
Erickson H. E. Helmer E. H. Brandeis T. J. Lugo A. E. (2014). Controls on fallen leaf chemistry and forest floor element masses in native and novel forests across a tropical island.Ecosphere5:48. 10.1890/es13-00263.1
22
Espinosa C. I. (2012). Estructura y funcionamiento de ecosistemas secos del Sur de Ecuador.Ph.D. thesis. Madrid: Universidad Politécnica de Madrid, 10.20868/upm.thesis.11116
23
Evans S. E. Wallenstein M. D. (2014). Climate change alters ecological strategies of soil bacteria.Ecol. Lett.17155–164. 10.1111/ele.12206
24
Freschet G. T. Aerts R. Cornelissen J. H. C. (2011). A plant economics spectrum of litter decomposability.Funct. Ecol.2656–65. 10.1111/j.1365-2435.2011.01913.x
25
Gallardo-Cruz J. A. Pérez-García E. A. Meave J. A. (2009). β-Diversity and vegetation structure as influenced by slope aspect and altitude in a seasonally dry tropical landscape.Landsc. Ecol.24473–482. 10.1007/s10980-009-9332-1
26
Gaspard G. Kim D. Chun Y. (2019). Residual spatial autocorrelation in macroecological and biogeographical modeling: a review. J Ecology Environ. 43:19. 10.1186/s41610-019-0118-3
27
Gei M. G. Rozendaal D. M. A. Poorter L. Bongers F. Sprent J. Mira G. D. et al (2018). Legume abundance along successional and rainfall gradients in Neotropical forests.Nat. Ecol. Evol.21104–1111. 10.1038/s41559-018-0559-6
28
Graça M. A. Bärlocher F. Gessner M. O. (2007). Methods to Study litter decomposition. A practical guide, 2nd Edn. Cham: Springer, 10.1007/978-3-030-30515-4
29
Harmon M. E. Nadelhoffer K. J. Blair J. M. (1999). Measuring decomposition, nutrient turnover, and stores in plant litter.New York, NY: Oxford University Press, 202–240. 10.1017/s0014479701241052
30
Hernández-Stefanoni J. L. Castillo-Santiago M. A. Mas J. F. Wheeler C. E. Andres-Mauricio J. Tun-Dzul F. et al (2020). Improving aboveground biomass maps of tropical dry forests by integrating LiDAR, ALOS PALSAR, climate and feld data.Carbon Balance Manage.15:15. 10.1186/s13021-020-00151-6
31
Hernández-Stefanoni J. L. Dupuy J. M. Tun Dzul F. May F. (2012). “Influencia de la estructura del paisaje y la edad de sucesión sobre la diversidad de especies y la biomasa aérea a diferentes escalas,” in Planeación de uso del suelo a nivel de paisaje en el Sur de Yucatán, edsHernández-StefanoniJ. L.DupuyJ. M. (Yucatán: Centro de Investigación Científica de Yucatán A.C. Mérida), 51–64.
32
Hofhansl F. Wanek W. Drage S. Huber W. Weissenhofer A. Richter A. (2011). Topography strongly affects atmospheric deposition and canopy exchange processes in different types of wet lowland rainforest, Southwest Costa Rica.Biogeochemistry106371–396. 10.1007/s10533-010-9517-3
33
Jackson B. G. Peltzer D. A. Wardle D. A. (2013). Are functional traits and litter decomposability coordinated across leaves, twigs and wood? A test using temperate rainforest tree species.Oikos1221131–1142. 10.1111/j.1600-0706.2012.00056.x
34
Karberg N. J. Scott N. A. Giardina C. P. (2008). “Methods for estimating litter decomposition,” in Field measurements for forest carbon monitoring, ed.HooverC. M. (Dordrecht: Springer), 103–111. 10.1007/978-1-4020-8506-2_8
35
Kazakou E. Vile D. Shipley B. Gallet C. Garnier E. (2006). Co-variations in litter decomposition, leaf traits and plant growth I species from a Mediterranean old-field succession.Funct. Ecol.2021–30. 10.1111/j.1365-2435.2006.01080.x
36
Kazakou E. Violle C. Roumet C. Pintor C. Gimenez O. Garnier E. (2009). Litter quality and decomposability of species from a Mediterranean succession depend on leaf traits but not on nitrogen supply.Ann. Bot.1041151–1161. 10.1093/aob/mcp202
37
Kirschbaum M. U. (2000). Will changes in soil organic carbon act as a positive or negative feedback on global warming?Biogeochem4821–51. 10.1023/A:1006238902976
38
Lacasta C. Meco R. Maire N. (2005). “Evolución de las producciones y de los parámetros químicos y bioquámicos del suelo, en un agrosistema de cereales sometido a diferentes manejos de suelo durante 21 años,” in Proceedings Congreso Internacional sobre Agricultura de Conservación-El reto de la Agricultura y Medio Ambiente, la Energía y la Nueva Política Agraria Común, Córdoba, 429–436.
39
Lasky J. R. Uriarte M. Boukili V. K. Chazdon R. L. (2014). Trait-mediated assembly processes predict successional changes in community diversity of tropical forests.Proc. Natl. Acad. Sci. U.S.A.1115616–5621. 10.1073/pnas.1319342111
40
Lavelle P. Blanchart E. Martin A. Martin S. Spain A. Toutain F. et al (1993). Hierarchical model for decomposition in terrestrial ecosystems: Application to soils of the humid tropics.Biotropica25130–150. 10.2307/2389178
41
Lebrija-Trejos E. Meave J. A. Poorter L. Pérez E. A. Bongers F. (2010). Pathways, mechanisms and predictability of vegetation change during tropical dry forest succession.Perspect. Plant Ecol. Evolut. Syst.12267–275. 10.1016/j.ppees.2010.09.002
42
Lebrija-Trejos E. Pérez-García E. A. Meave J. A. Poorter L. Bongers F. (2011). Environmental changes during secondary succession in a tropical dry forest in Mexico.J. Trop. Ecol.27477–489. 10.1017/s0266467411000253
43
Lennon J. J. (2000). Red-shifts and red herrings in geographical ecology. Ecography23, 101–113. 10.1111/j.1600-0587.2000.tb00265.x
44
Lennon J. T. Aanderud Z. T. Lehmkuhl B. K. Schoolmaster D. R. (2012). Mapping the niche space of soil microorganisms using taxonomy and traits.Ecology931867–1879. 10.1890/11-1745.1
45
Lenth R. V. (2022). emmeans: Estimated Marginal Means, aka Least-Squares Means. R package version 1.8.3. Available online at: https://CRAN.R-project.org/package=emmeans(accessed January 3, 2023).
46
Lohbeck M. Poorter L. Lebrija-Trejos E. Martínez-Ramos M. Meave J. A. Paz H. et al (2013). Successional changes in functional composition contrast for dry and wet tropical forest.Ecology941211–1216. 10.1890/12-1850.1
47
Lu S. W. Liu C. P. (2012). Patterns of litterfall and nutrient return at different altitudes in evergreen hardwood forests of Central Taiwan.Ann. For. Sci.69877–886. 10.1007/s13595-012-0213-4
48
Markesteijn L. Poorter L. Paz H. Sack L. Bongers F. (2010). Ecological differentiation in xylem cavitation resistance is associated with stem and leaf structural traits.Plant Cell Environ.34137–148. 10.1111/j.1365-3040.2010.02231.x
49
Martins N. P. Fuchslueger L. Fleischer K. Andersen K. M. Assis R. L. Baccaro F. B. et al (2021). Fine roots stimulate nutrient release during early stages of leaf litter decomposition in a Central Amazon rainforest.Plant Soil469287–303. 10.1007/s11104-021-05148-9
50
Matteucci S. D. Colma A. (1982). Metodología para el estudio de la vegetación. Secretaría General de la Organización de Estados Americanos.Washington: Programa Regional de Desarrollo Científico y Tecnológico.
51
Meentemeyer V. (1984). The geography of organic decomposition rates.Ann. Assoc. Am. Geogr.74551–560. 10.1111/j.1467-8306.1984.tb01473.x
52
Montagnini F. Sancho F. Ramstad K. Stijfhoorn E. (1991). “Multipurpose trees for soil restoration in the humid lowlands of Costa Rica,” in Research on multipurpose trees in Asia, edsTaylorD. A.DickenK. G. (Bangkok: Winrock International Institute for Agriculture Development).
53
Morffi-Mestre H. (2021). Estimación de la producción de hojarasca y la descomposición foliar en un bosque tropical seco en La Reserva Biocultural Kaxil Kiuic, Yucatán, México.Ph.D. thesis. Mérida: Centro de Investigaciones Científicas de Yucatán.
54
Morffi-Mestre H. Ángeles-Pérez G. Powers J. S. Andrade J. L. Huechacona Ruiz A. H. May-Pat F. et al (2020). Multiple factors influence seasonal and interannual litterfall production in a tropical dry forest in Mexico.Forests11:1241. 10.3390/f11121241
55
Olson J. S. (1963). Energy storage and balance of producers and decomposer in ecological systems.Ecology44322–331. 10.2307/1932179
56
Orellana R. Islebe G. Espadas C. (2003). “Presente, pasado y futuro de los climas de la Península de Yucatán,” in Naturaleza y sociedad en el área maya. Pasado, presente y futuro, edsColungaM. P.LarquéA. (Mérida: Centro de Investigación Científica de Yucatán).
57
Ostertag R. Marin-Spiotta E. Silver W. L. Schulten J. (2008). Litterfall and decomposition in relation to soil carbon pools along a secondary forest chronosequence in Puerto Rico.Ecosystems11701–714. 10.1007/s10021-008-9152-1
58
Pérez-Harguindeguy N. Diaz S. Cornelisen J. H. C. Vendramini F. Cabido M. Castellanos A. (2000). Chemistry and toughness predict leaf litter decomposition rates over a wide spectrum of functional types and taxa in central Argentina.Plant Soil21821–30. 10.1023/a:1014981715532
59
Phillips R. P. Brzostek E. Meghan G. M. (2013). The mycorrhizal-associated nutrient economy: A new framework for predicting carbon–nutrient couplings in temperate forests.New Phytol.19941–51. 10.1111/nph.12221
60
Pineda-García F. Paz H. Meinzer F. C. (2013). Drought resistance in early and late secondarysuccessional species from a tropical dry forest: The interplay between xylem resistance to embolism, sapwood water storage and leaf shedding.Plant Cell Environ.36405–418. 10.1111/j.1365-3040.2012.02582.x
61
Poorter H. Niinemets U. Ntagkas N. Siebenkäs A. Mäenpää M. Matsubara S. et al (2019). A meta-analysis of plant responses to light intensity for 70 traits ranging from molecules to whole plant performance.New Phyotol.231073–1105. 10.1111/nph.15754
62
Powers J. S. Montgomery R. A. Adair E. C. Brearley F. Q. DeWalt S. J. Castanho C. T. et al (2009). Decomposition in tropical forests: A pan-tropical study of the effects of litter type, litter placement and mesofaunal exclusion across a precipitation gradient.J. Ecol.97801–811. 10.1111/j.1365-2745.2009.01515.x
63
Prause J. Lifschitz A. P. Dalurzo H. C. Agudo D. E. (2002). Leaf Litterfall and decomposition in a forest of the Chaco Argentino.Commun. Soil Sci. Plant Anal.3319–20. 10.1081/css-120015913
64
R Core Team (2022). R: A language and environment for statistical computing.Vienna: R Foundation for Statistical Computing.
65
Ramírez G. Dupuy J. M. Solorio F. J. Ramírez L. (2019). Ecuaciones alométricas de biomasa epigea en una selva mediana subcaducifolia de la península de Yucatán.Ph.D. thesis. Mérida: Centro de Investigación Científica de Yucatán.
66
Ramírez-Guardado M. A. (2015). Estimación del carbono retenido en la biomasa aérea en una selva tropical de Yucatán, México.Ph.D. thesis. Mérida: Centro de Investigación Científica de Yucatán.
67
Ramos V. E. Zúñiga D. D. (2008). Efecto de la humedad, temperatura y pH del suelo en la actividad microbiana a nivel de laboratorio.Ecol. Aplic.7123–130. 10.21704/rea.v7i1-2.367
68
Sanaphre-Villanueva L. (2016). Variación sucesional y espacial de caracteres y grupos funcionales de plantas leñosas en un bosque tropical seco.Ph.D. thesis. Mérida: Centro de Investigaciones Científicas de Yucatán.
69
Sanaphre-Villanueva L. Dupuy J. M. Andrade J. L. Reyes C. Jackson P. C. Paz H. (2017). Patterns of plant functional variation and specialization along secondary succession and topography in a tropical dry forest.Environ. Res. Lett.12:055004. 10.1088/1748-9326/aa6baa
70
Sánchez-Silva S. De Jong H. J. B. Aryal D. R. Esperanza H. L. Mendoza-Vega J. (2018). Trends in leaf traits, litter dynamics and associated nutrient cycling along a secondary successional chronosequence of semi-evergreen tropical forest in South-Eastern Mexico.J. Trop. Ecol.34364–377. 10.1017/s0266467418000366
71
Sariyildiz T. Anderson J. M. Kückü M. (2008). Litter mass loss rates in deciduous and coniferous trees in Artvin, Northeast Turkey: Relationships with litter quality, microclimate and soil characteristics.Turk. J. Agric. For.32:10.
72
Schilling J. S. Ayres A. Kaffenberger J. T. Powers J. S. (2015). Initial white rot type dominance of wood decomposition and its functional consequences in a regenerating tropical dry forest.Soil Biol. Biochem.8858–68. 10.1016/j.soilbio.2015.05.002
73
Schimel J. P. Gulledge J. M. Clein-Curley J. S. Lindstrom J. E. Braddock J. F. (1999). Moisture effects on microbial activity and community structure in decomposing birch litter in the Alaskan taiga.Soil Biol. Biochem.31831–838. 10.1016/s0038-0717(98)00182-5
74
Schwartz N. B. Medvigy D. Tijerin J. Pérez-Aviles D. Rivera-Polanco D. Pereira D. et al (2022). “Intra-annual variation in microclimatic conditions in relation to vegetation type and structure in two tropical dry forests undergoing secondary succession.For. Ecol. Manag.511:120132. 10.1016/j.foreco.2022.120132
75
Strickland M. S. Keiser A. D. Bradford M. A. (2015). Climate history shapes contemporary leaf litter decomposition.Biogeochem122165–174. 10.1007/s10533-014-0065-0
76
Strickland M. S. Lauber C. Fierer N. Bradford M. A. (2009). Testing the functional significance of microbial community composition.Ecology90441–451. 10.1890/08-0296.1
77
Talbot J. M. Treseder K. K. (2012). Interactions among lignin, cellulose, and nitrogen drive litter chemistry–decay relationships.Ecology93345–354. 10.1890/11-0843.1
78
Toky O. P. Ramakrishnan P. S. (1983). Secondary succession following slash and burn agriculture in North-Eastern India. II. Nutrient cycling.J. Trop. Ecol.71747–757. 10.2307/2259590
79
Townsend A. R. Vitousek P. M. Desmarais D. J. Tharpe A. (1997). Soil carbon pool structure and temperature sensitivity inferred using CO2 and 13CO2 incubation fluxes from five Hawaiian soils.Biogeochem381–17. 10.1023/a:1017942918708
80
Vargas G. G. Brodribb T. J. Dupuy J. M. González-M R. Hulshof C. M. Medvigy D. et al (2021). Beyond leaf habit: Generalities in plant function across 97 tropical dry forest tree species.New Phytol.232148–161. 10.1111/nph.17584
81
Villalobos R. E. (2006). Fijación simbiótica del Nitrógeno, 1st Edn. San José, CA: Universidad de Costa Rica.
82
Vitousek P. Turner D. Parton W. Sanford R. (1994). Litter decomposition on the Mauna Loa environmental matrix, Hawai’i: Patterns, mechanisms, and models.Ecology75418–429. 10.2307/1939545
83
von Arx G. Dobbertin M. Rebetez M. (2012). Spatio-temporal effects of forest canopy on understory microclimate in a long-term experiment in Switzerland.Agric. For. Meteorol.167144–155. 10.1016/j.agrformet.2012.07.018
84
Wieder W. R. Cleveland C. C. Townsend A. R. (2009). Controls over leaf litter decomposition in wet tropical forests.Ecology903333–3341. 10.1890/08-2294.1
85
Xuluc T. Vester F. J. Ramírez-M H. F. M. Castellanos N. Lawrence A. J. D. (2003). Leaf litter decomposition of tree species in three successional phases of tropical dry secondary forest in Campeche, Mexico.For. Ecol. Manag.174401–412. 10.1016/s0378-1127(02)00059-2
86
Zanne A. E. Oberle B. Dunham K. M. Milo A. M. Walton M. L. Young D. F. (2015). A deteriorating state of affairs: How endogenous and exogenous factors determine plant decay rates.J. Ecol.1031421–1431. 10.1111/1365-2745.12474
87
Zhang D. Hui D. Luo Y. Zhou G. (2008). Rates of litter decomposition in terrestrial ecosystems: Global patterns and controlling factors.J. Plant. Ecol.185–93. 10.1093/jpe/rtn002
Summary
Keywords
annual decomposition rate, leaf composition and toughness, tree legume species, litter moisture, secondary succession, slope, soil properties, vegetation structure
Citation
Morffi-Mestre H, Ángeles-Pérez G, Powers JS, Andrade JL, Feldman RE, May-Pat F, Chi-May F and Dupuy-Rada JM (2023) Leaf litter decomposition rates: influence of successional age, topography and microenvironment on six dominant tree species in a tropical dry forest. Front. For. Glob. Change 6:1082233. doi: 10.3389/ffgc.2023.1082233
Received
28 October 2022
Accepted
24 April 2023
Published
12 May 2023
Volume
6 - 2023
Edited by
Fernanda De Vasconcellos Barros, University of Exeter, United Kingdom
Reviewed by
Florian Hofhansl, International Institute for Applied Systems Analysis, Austria; Rebecca Ostertag, University of Hawai’i at Hilo, United States
Updates
Copyright
© 2023 Morffi-Mestre, Ángeles-Pérez, Powers, Andrade, Feldman, May-Pat, Chi-May and Dupuy-Rada.
This is an open-access article distributed under the terms of the Creative Commons Attribution License (CC BY). The use, distribution or reproduction in other forums is permitted, provided the original author(s) and the copyright owner(s) are credited and that the original publication in this journal is cited, in accordance with accepted academic practice. No use, distribution or reproduction is permitted which does not comply with these terms.
*Correspondence: Juan Manuel Dupuy-Rada, jmdupuy@cicy.mx
Disclaimer
All claims expressed in this article are solely those of the authors and do not necessarily represent those of their affiliated organizations, or those of the publisher, the editors and the reviewers. Any product that may be evaluated in this article or claim that may be made by its manufacturer is not guaranteed or endorsed by the publisher.