Abstract
Elevation gradients provide natural laboratories for investigating tropical tree ecophysiology in the context of climate warming. Previously observed trends with increasing elevation include decreasing stem diameter growth rates (GR), increasing leaf mass per area (LMA), higher root-to-shoot ratios (R:S), increasing leaf δ13C, and decreasing leaf δ15N. These patterns could be driven by decreases in temperature, lower soil nutrient availability, changes in species composition, or a combination thereof. We investigated whether these patterns hold within the genus Flindersia (Rutaceae) along an elevation gradient (0–1,600 m) in the Australian Wet Tropics. Flindersia species are relatively abundant and are important contributors to biomass in these forests. Next, we conducted a glasshouse experiment to better understand the effects of temperature, soil nutrient availability, and species on growth, biomass allocation, and leaf isotopic composition. In the field, GR and δ15N decreased, whereas LMA and δ13C increased with elevation, consistent with observations on other continents. Soil C:N ratio also increased and soil δ15N decreased with increasing elevation, consistent with decreasing nutrient availability. In the glasshouse, relative growth rates (RGR) of the two lowland Flindersia species responded more strongly to temperature than did those of the two upland species. Interestingly, leaf δ13C displayed an opposite relationship with temperature in the glasshouse compared with that observed in the field, indicating the importance of covarying drivers in the field. Leaf δ15N increased in nutrient-rich compared to nutrient-poor soil in the glasshouse, like the trend in the field. There was a significant interaction for δ15N between temperature and species; upland species showed a steeper increase in leaf δ15N with temperature than lowland species. This could indicate more flexibility in nitrogen acquisition in lowland compared to upland species with warming. The distinguishing feature of a mountaintop restricted Flindersia species in the glasshouse was a very high R:S ratio in nutrient-poor soil at low temperatures, conditions approximating the mountaintop environment. Our results suggest that species traits interact with temperature and nutrient availability to drive observed elevation patterns. Capturing this complexity in models will be challenging but is important for making realistic predictions of tropical tree responses to global warming.
1. Introduction
Elevation gradients, and their associated changes in temperature, provide natural laboratories for studying how tropical trees might respond to global warming (Malhi et al., 2010; Tito et al., 2020). Increasing elevation, and by extension lower temperatures, have been associated with both species-specific and community-based trends; these include decreasing growth rates (Rapp et al., 2012), increasing root-to-shoot ratios (R:S) (Fahey et al., 2016), increasing leaf mass per area (LMA) (Rapp et al., 2012; Van De Weg et al., 2012; Fahey et al., 2016), increasing foliar δ13C, and decreasing foliar δ15N (Sparks and Ehleringer, 1997; Li et al., 2009). Foliar δ13C and δ15N have been used as indicators of intrinsic water-use efficiency (Cernusak et al., 2013), and ecosystem nitrogen cycling (Martinelli et al., 1999), respectively. However, although some of these trends with increasing elevation appear to be general in the literature (Vitousek et al., 1990; Bauters et al., 2017; Mumbanza et al., 2021), the mechanisms driving the observations are not fully resolved. Disentangling the direct and indirect role that temperature plays in determining these trends in plant functional traits is vital to understanding elevation gradients as proxies for predicting the response of forests to future climate scenarios.
In addition to decreasing temperatures, increasing elevation is associated with variation in other climatic factors, such as precipitation, vapor pressure deficit, and solar radiation (Malhi et al., 2010). Similarly, the availability of soil nutrients, such as N and P, can also change as a function of elevation, both because of changes in temperature-driven mineralization rates, and inherent litter decomposability (Salinas et al., 2011). Together, these environmental factors are all recognized as major drivers of tropical tree growth and selective filters for plant functional traits (Rapp et al., 2012; Cheesman et al., 2018; Bauman et al., 2022a). Trends in functional traits observed across elevation may therefore result from, to varying degrees, changes in temperature, vapor pressure deficit, soil nutrients, species turnover, and the interaction of these factors (Read et al., 2014; Fahey et al., 2016).
Declining temperatures and nutrient availability with increasing elevation can influence resource allocation in tropical trees (Unger et al., 2012). For example, N allocation toward photosynthetic tissues may be reduced (Xiao et al., 2018; Ziegler et al., 2020), and climatic and soil conditions may favor biomass allocation toward roots (Kobe et al., 2010; Poorter et al., 2012). This may lead to the selection of species at high elevations with functional adaptations for slower growth, such as an intrinsically high R:S, and with leaf traits oriented toward the slow end of the leaf economic spectrum, including a larger leaf mass per unit leaf area (LMA), lower mass based N concentration, and a more robust leaf structure associated with longer leaf lifespans (Wright et al., 2005; Valladares and Niinemets, 2008; Poorter et al., 2012). Low temperatures and nutrient availability may also lead to the production of leaves, leaf-litter, and thereby soil organic material with limited N availability and a highly recalcitrant carbon content. This self-reinforcing trend may lead to observed traits being directly impacted by nutrient availability and decoupled (in the short term) from the direct impacts of changing temperature.
The relationship between water availability and foliar δ13C is generally well-established (Diefendorf et al., 2010), with foliar δ13C becoming more negative as precipitation and soil water availability increase. Yet, somewhat surprisingly, leaf δ13C often becomes higher with elevation in spite of general increases in water availability (Sparks and Ehleringer, 1997); this appears to be related to increasing LMA and decreasing atmospheric pressure (Körner, 2007; Chen et al., 2017). Higher LMA can increase the leaf internal resistance to CO2 diffusion, thereby reducing chloroplastic CO2 concentrations during photosynthesis (Cernusak et al., 2013), resulting in an increase in the foliar δ13C (Vitousek et al., 1990; Li et al., 2009). Increased LMA can also lead to increased leaf N and P concentrations per unit leaf area, which can confer increased leaf photosynthetic capacity, further decreasing discrimination against 13C (Bauman et al., 2022a). Nevertheless, decreases in foliar δ13C with increasing elevation have been reported in some cases (Sah and Brumme, 2003), and could be related to lower leaf-to-air vapour pressure deficits (VPD) with increasing elevation, resulting in an increased ratio of intercellular to ambient CO2 concentrations (ci/ca) through opening of stomata (Cernusak et al., 2013; Chen et al., 2017).
Foliar δ15N has been observed to decrease with increasing elevation in tropical rainforest trees (Bauters et al., 2017). This is thought to be the result of more open N cycling at warm, low elevations, and with tighter N cycling at higher elevations as a result of slower N mineralization rates caused by low temperatures and less decomposable litter (Martinelli et al., 1999; Baumgartner et al., 2021). More open N cycling feeds N loss pathways from the ecosystem that tend to leave the residual N pool relatively enriched in 15N (Martinelli et al., 1999; Craine et al., 2015). Some studies have also reported a positive trend or no change in foliar δ15N with elevation, attributing this to increased water stress in some mountainous regions, or due to the nature of site-specific biogeochemical processes; such as ammonium immobilization for example (Vitousek et al., 1989; Yi and Yang, 2006). Likewise, differences in plant functional types are known to contribute toward variation in foliar δ15N due to differences in nitrogen acquisition strategies and microbial associations, such as symbiotic associations with N fixing bacteria and mycorrhizal fungi (Cernusak et al., 2009; Liu et al., 2010). However, within species from a single genus found in moist tropical rainforests, we would not expect to find these latter complications. Thus, δ15N signatures can still be generally useful as indicators of nitrogen cycling at the ecosystem scale and across environmental gradients, if care is taken to minimize variation associated with different plant functional types and ecological strategies (Amundson et al., 2003).
Understanding how temperature directly and indirectly shapes observed patterns in species distribution and plant functional traits across elevation will allow a mechanistic understanding of how changing temperatures are likely to impact natural systems. In this study, we first examined patterns of tree stem diameter growth and leaf functional traits (LMA, δ13C and δ15N) in a dominant tropical rainforest tree genus, Flindersia, distributed along an elevation gradient in the Australian Wet Tropics World Heritage Area (Bradford et al., 2014a). We then conducted a glasshouse experiment to examine the relative impacts of temperature, soil nutrient availability, and species in driving these observations. We hypothesized that trends across elevation would reflect a combination of both direct temperature effects, indirect temperature effects mediated by nutrient availability, and species’ traits associated with habitat preference (lowland versus upland). To gain insight, we used the glasshouse experiment to test for effects of temperature and nutrient availability, and their interactions with species and habitat preference, on growth rates, biomass allocation, LMA, δ13C and δ15N.
2. Materials and methods
2.1. Species selection and study area
Flindersia R.Br., of the family Rutaceae, comprises ca 17 species of trees and shrubs distributed across Malesia, Australia, and New Caledonia, with 15 species known to occur in the tropics and sub-tropics of Australia (Scott et al., 2000; Bayly et al., 2013). Nine species in the Australian Wet Tropics are commonly observed among the dominant taxa and contribute to biomass in rainforest plots in these forests (Bradford et al., 2014a), ranging from near sea level to the summits of the highest peaks (Zich et al., 2020). Flindersia, in general, are known to reliably produce seeds, which are enclosed in fruits that are easy to spot in the canopy, and are therefore more accessible compared to seeds of some other co-occurring taxa (Zich et al., 2020). We explored herbarium records and species distribution observations from the Atlas of Living Australia (ALA) (Belbin, 2011) and used these observations to identify four focal Flindersia species for this study: F. ifflana F. Muell., F. bourjotiana F. Muell., F. brayleyana F. Muell., and F. oppositifolia (F. Muell.) T.G. Hartley & L.W. Jessup. Flindersia oppositifolia is a tropical mountaintop species with a very restricted distribution and a narrow climate niche, whereas the other species are more widely distributed along the elevation gradient and have a broad climate niche. Among these, F. brayleyana displays a predominantly upland distribution, whereas F. bourjotiana and F. ifflana have predominantly lowland distributions (Supplementary Table 1).
We filtered the ALA observations for each species using the spatial thinning package ‘spThin’ (Aiello-Lammens et al., 2015) in R, set at a scale of 0.5 km for the mountaintop restricted species and 5km resolution for the widespread taxa at 10 repetitions for each species, which returned a total of 95 spatially-thinned occurrences within the Australian Wet Tropics. We then extracted a suite of gridded environmental variables from WorldClim for the occurrence locations, including mean annual temperature (BIO1) (Figure 1A) and mean annual precipitation (BIO12) (Figure 1B; Fick and Hijmans, 2017).
FIGURE 1
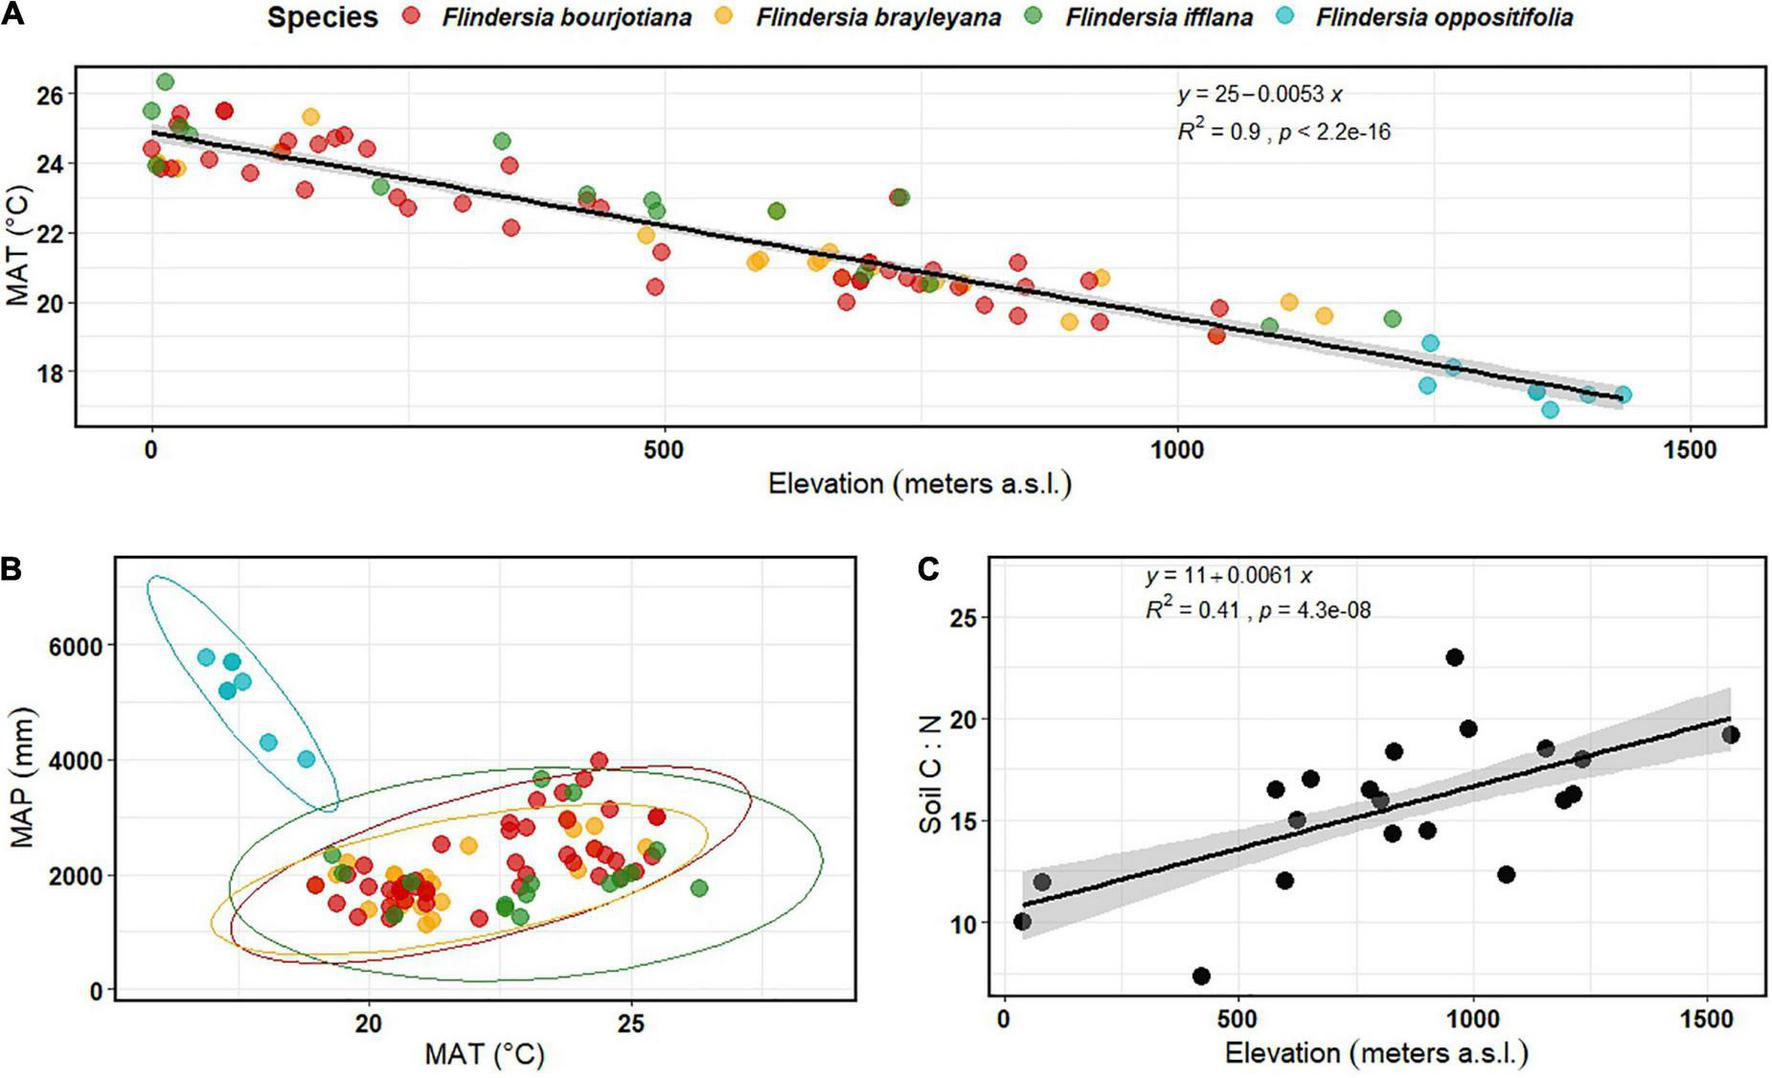
(A) Variation in mean annual temperature (MAT) across elevation in the Australian Wet Tropics, based on the Flindersia species occurrence records obtained after spatial thinning at 0.5 km resolution and interpolated using WorldClim v.2 bioclimatic variables (MAT, BIO1) (n = 95); (B) Scatter plot of mean annual precipitation (MAP, BIO12) as a function of mean annual temperature (MAT, BIO1), with ellipses representing species’ climate niche across the occurrence range of the four focal Flindersia species within the Australian Wet Tropics (n = 95); (C) Variation in soil C:N ratio across an elevation gradient in the Australian Wet Tropics measured during this study (n = 20).
2.2. Stem diameter growth and plant functional trait measurements across elevation
Individual stem diameter growth rates (GR) were calculated for mature rainforest Flindersia species distributed across elevation in the Australian Wet Tropics and captured in long-term forest census plots (n = 13 sites). For each individual within a site, we calculated the linear increase in diameter for stems greater than 10 cm diameter at breast height (n = 2 to 20 individuals per site) between 1971 and 2013 (Bradford et al., 2014b). For F. oppositifolia, restricted to mountaintops, we calculated GR (n = 33 individuals) for the period from 2010 to 2019 using a rainforest plot established by Torello Raventos (2014), which we re-censused in 2019. Field campaigns to collect plant functional traits (LMA, foliar δ13C and δ15N) of exposed canopy branches of focal Flindersia species (a minimum of 2 individuals per site) were conducted in four locations (Supplementary Table 1) across a range in elevation, using standard trait measurement protocols (Cornelissen et al., 2003). Data from a previous trait campaign (Bauman et al., 2022a) were also added to this analysis (n = 16 individuals across five sites for the focal species).
2.3. Soil nutrient and isotope analyses across elevation
Surface soil samples were collected from 20 rainforest plots spanning an elevation range from 40 to 1,550 m in the Australian Wet Tropics. Of these, 16 plots had dimensions 20 m × 20 m, whereas the mountaintop plot had dimension 50 m × 20 m, and the two lowland sites were each 100 m × 100 m. The sites were selected to include those for which soils were derived from granitic parent material, except for the two lowest elevation plots, for which soils were derived from granitic and metamorphic colluvium. Five cores per site (at the 4 corners of the plot and one at the center) were sampled using an auger (∼10 cm deep) after removing leaf litter. Samples were bulked and homogenized at the plot level. Samples were then oven-dried at ∼105°C for 72 h and ground to a fine powder using a Benchtop Ring Mill (Rocklabs, Mineral Stats INC., Colorado) at the Advanced Analytical Centre (AAC), James Cook University (JCU), Cairns. Soil pH in H2O and in 0.01M CaCl2 was measured on oven-dried samples using an ISFET pH pen (Model 24006 DeltaTrak). Subsamples were used to determine C and N concentrations and isotopic ratios (δ13C and δ15N) as described below for leaf tissue. Total soil P was analyzed using a microwave assisted acid digestion of oven dried samples followed by ionization detection using the Inductively Coupled Plasma-Atomic Emission Spectrometer (ICP-AES) at the AAC, JCU, Townsville.
2.4. Glasshouse experimental growth conditions
We collected seeds from the four focal species, with each species collected at a single site (Supplementary Table 1). The four collection sites were distributed across most of the elevation range found in the Australian Wet Tropics (Lowland species, F. ifflana ∼ 300 m and F. bourjotiana ∼ 600 m, and Upland species F. brayleyana ∼ 990 m and F. oppositifolia ∼ 1,550 m). The seeds were allowed to germinate under ambient shade-house conditions at the Environmental Research Complex (ERC), (∼30 m a.s.l.) JCU, Cairns, Australia. Healthy saplings were transplanted (approximately 3 months after sowing seeds) into either 13.5 L pots (Garden City Pots, Model: P300ST00) containing nutrient-rich soil (NR), comprising a 1:1 mixture by volume of premium garden potting mix and compost (Northside Landscape Supplies Pty. Ltd., Trinity Beach); or 8.5 L pots (Garden City Pots, Model: P250STTL) containing nutrient-poor soil (NP). The nutrient-poor soil comprised a locally collected dermasol, low in organic matter and supplemented with perlite and washed river sand to improve drainage (Supplementary Table 2). The two soil mixtures, nutrient-rich and nutrient-poor, had similar δ15N at the start of the experiment, based on measurements of subsamples; these values were 5.4 and 5.3‰, respectively.
The experimental pots were transferred into a climate-controlled glasshouse facility. The facility is divided into three temperature-controlled chambers, each with a shade screen (SOLARO, Ludvig Svensson Inc. Kinna, Sweden) that reduces incident irradiance to approximately 50% of the incoming irradiance. Further details of the experimental facility can be found in Forbes et al. (2020). Three growth temperature treatments were implemented by setting chambers to track the external temperature profile with a chamber-specific offset, specifically a) 0°C offset, b) –7°C offset, and c) + 5°C offset. These chamber temperature conditions mimic the lowland provenance, mountaintop provenance, and a lowland warming scenario, respectively. The climatic conditions were controlled via the Building Management System (BMS) with temperature and relative humidity (RH) in each chamber measured (QFM2160 Temperature and Humidity Probe, Siemens) and recorded at 5 min intervals in the BMS. We further characterized the temperature regimes with a Temperature Soil Moisture Sensor [TMS-4, TOMST s.r.o, Prague, (Wild et al., 2019)] in each experimental chamber to record the temperature in the immediate environment of the saplings. A summary of chamber conditions over the course of the experiment is given in Table 1. We calculated the VPD of each chamber from the temperature and relative humidity measurements (Campbell and Norman, 1998).
TABLE 1
| Cold | Ambient | Elevated | ||||||||||
| Time | Temperature (°C) | RH (%) | VPD (kPa) | Temperature (°C) | RH (%) | VPD (kPa) | Temperature (°C) | RH (%) | VPD (kPa) | |||
| BMS | TOMST | BMS | TOMST | BMS | TOMST | |||||||
| Day | 19 ± 3.2 | 17 ± 3.5 | 76 ± 5.8 | 0.53 ± 0.24 | 26 ± 3.6 | 25 ± 3.5 | 83 ± 8.5 | 0.61 ± 0.37 | 31 ± 4.1 | 30 ± 4.6 | 71 ± 11 | 1.39 ± 0.69 |
| Night | 14 ± 1.9 | 12 ± 1.9 | 84 ± 3.5 | 0.26 ± 0.08 | 20 ± 3.1 | 19 ± 3.1 | 91 ± 6.3 | 0.22 ± 0.18 | 25 ± 3.1 | 24 ± 3.1 | 79 ± 9 | 0.68 ± 0.36 |
| Average | 16.5 ± 2.5 | 14.5 ± 2.7 | 80 ± 4.6 | 0.40 ± 0.16 | 23 ± 3.35 | 22 ± 3.3 | 87 ± 7.4 | 0.41 ± 0.27 | 28 ± 3.6 | 27 ± 3.8 | 75 ± 10 | 1.03 ± 0.52 |
Environmental conditions in the glasshouse during the experiment for the three glasshouse chambers.
Air temperature was recorded using the building management system (BMS) software and additionally with a temperature moisture sensor (TMS-4, TOMST, Czech Republic), recorded at intervals of 5 min. Relative humidity (RH) and vapor pressure deficit (VPD) were recorded with the BMS. All values given in means ± 1SD. Daytime and night-time have been separated, with daytime being hours between 0700 and 1700 local time.
A minimum of three healthy saplings per soil treatment per species were monitored for growth in each chamber to give a total of 24 saplings (3 Saplings × 2 Soil treatments × 4 Species) per chamber. All pots were hand-watered to field capacity daily throughout the experiment. To avoid any chamber bias across the experimental treatments, the treatments were rotated among the chambers monthly.
2.5. Glasshouse experimental biomass measurements
Before the start of the glasshouse experimental treatments, initial plant biomass was estimated for individuals using a species-specific allometric relationship derived from root-collar diameter, stem height, and the total dry biomass of three destructively harvested saplings. Final biomass was measured from destructive harvests of three plants per species by treatment combination, except for F. bourjotiana in the nutrient-rich, elevated temperature treatment, where only two plants survived. Thus, a total of 71 plants were harvested for final biomass.
The dry mass of leaves, stems and roots were measured separately and used to calculate Above Ground Biomass (AGB, sum of leaf and stem dry mass) and Below Ground Biomass (BGB, total root dry mass). The AGB and BGB were used to calculate the root-to-shoot ratio (R:S). From each plant, three to four leaves were collected for determination of LMA, δ13C and δ15N, as described below. Relative growth rates (RGR, mg g–1 day–1) were calculated using equation 1 (Hoffmann and Poorter, 2002):
where, Mf is the final biomass, Mi is the estimated initial biomass, and Δt is the length of the experiment in days.
2.6. Leaf-level functional traits
For both field-collected, and glasshouse grown leaves, leaf area was calculated from scanned fresh leaves (3 to 5 leaves per individual) using Image-J software, which in conjunction with oven-dried leaf mass was used to calculate LMA (g m–2). Further, oven-dried leaves were ground to a fine powder using a Bench Top Ring Mill. Foliar δ13C and δ15N isotope ratios were determined using a Costech Elemental Analyzer, fitted with a zero-blank auto-sampler and coupled via a ConFloIV interface to a Thermo Finnigan Delta-V PLUS isotope ratio mass spectrometer (Bremen, Germany). Stable isotope results are reported as per mil (‰) deviations from the VPDB and AIR reference standard scales for δ13C and δ15N, respectively. Precisions (± 1 standard deviation) on internal standards were better than ± 0.1‰ and ± 0.2‰ for C and N, respectively.
2.7. Statistical analysis
2.7.1. Field observations
All statistical analyses were conducted within the ‘R studio’ environment, using R version 4.1.2 (R Core Team, 2021). We computed ordinary least-squares linear regressions for each of the response variables to understand how field observed traits (i.e., GR, LMA, δ13C and δ15N) varied with elevation (Supplementary Table 3). We conducted these analyses at the genus level; that is, individual species identities were not accounted for in the models. For the field measurements, each species was sampled at one or few locations, and so accounting for individual species did not improve the models. All dependent variables were checked for normality assumptions using the Shapiro–Wilk’s test for normality and we used square root transformation on GR to meet normality assumptions. Predictor variables were standardized prior to analyses. The 95% Confidence Intervals and P-values were computed using the Wald approximation.
2.7.2. Glasshouse experiment
We computed ordinary least-squares linear regressions for each of the response variables: RGR, R:S, LMA and foliar δ13C and δ15N against Temperature, Soil nutrient status (i.e., nutrient-rich versus nutrient-poor), Species and the interactions between Species and Temperature and Soil nutrient status. Model selection was carried out using the ‘performance’ package in R (Lüdecke et al., 2021), and the model that yielded the lowest AIC was then chosen for each of the response variables. Temperature was taken as a continuous variable from the long-term air temperature averages for each growth chamber (Table 1). Type III ANOVA was performed on the chosen models, followed by post hoc comparisons of means using the ‘emmeans’ package in R (Lenth et al., 2018). We built a custom linear contrast for comparison of species according to their habitat preference (lowland versus upland), for response variables where Species interacted with Temperature. We did this to better understand whether species responses were structured by their elevation preference. For this comparison F. ifflana and F. bourjotiana were considered as lowland, and F. brayleyana and F. oppositifolia as upland. We checked for normality using visual histograms on all dependent variables, and then a Shapiro-Wilk’s test for normality was performed followed by testing the homogeneity of variances (P > 0.05). We log-transformed the response variables RGR and used square root transformation for LMA to meet normality assumptions.
3. Results
3.1. Field observations: Temperature and soil nutrient availability with elevation
Recorded observations of the four focal Flindersia species in the Australian Wet Tropics, in conjunction with gridded climate data for each observation location, indicated a linear decline in Mean Annual Temperature (MAT) with elevation in the distribution ranges, with a slope of –5.3°C km–1 (Figure 1A). The three widespread species shared similar climate niche space (based on its MAT and Mean Annual Precipitation (MAP)), while the mountaintop-restricted species displayed the lowest MAT and highest MAP (Figure 1B; Supplementary Table 1). Further, for the three widespread species, elevational distributions were largely consistent with the elevations of seed collection for the glasshouse experiment, except for F. brayleyana, which was collected at ∼990 m, in the upper part of its range (Supplementary Table 1). Thus, the locations of seed collection also contributed to our consideration of habitat preferences for F. ifflana and F. bourjotiana to be lowland, and for F. brayleyana and F. oppositifolia to be upland.
Soil C:N ratio increased with elevation (R2 = 0.41, P < 0.01) (Figure 1C) and soil δ15N decreased with elevation (R2 = 0.57, P < 0.001) (Supplementary Figure 3), suggesting that nitrogen availability declines with increasing elevation. The difference in soil δ15N from the lowest site (40 m) to the highest site (1,550 m) was ∼5.7‰ with a slope of –3.5‰ km–1 of elevation gain (Supplementary Figure 3). Soil δ13C did not change significantly with elevation (Supplementary Figure 3).
3.2. Field observations: Stem diameter growth rates, LMA, foliar δ13C and δ15N
Across an elevation gradient of 1,600 m in the Australian Wet Tropics, Flindersia species demonstrated a significant decline in stem diameter growth rates (R2 = 0.18, P < 0.01). These declined by ca 0.3 cm year–1 km–1 of elevation gain (Figure 2A).
FIGURE 2
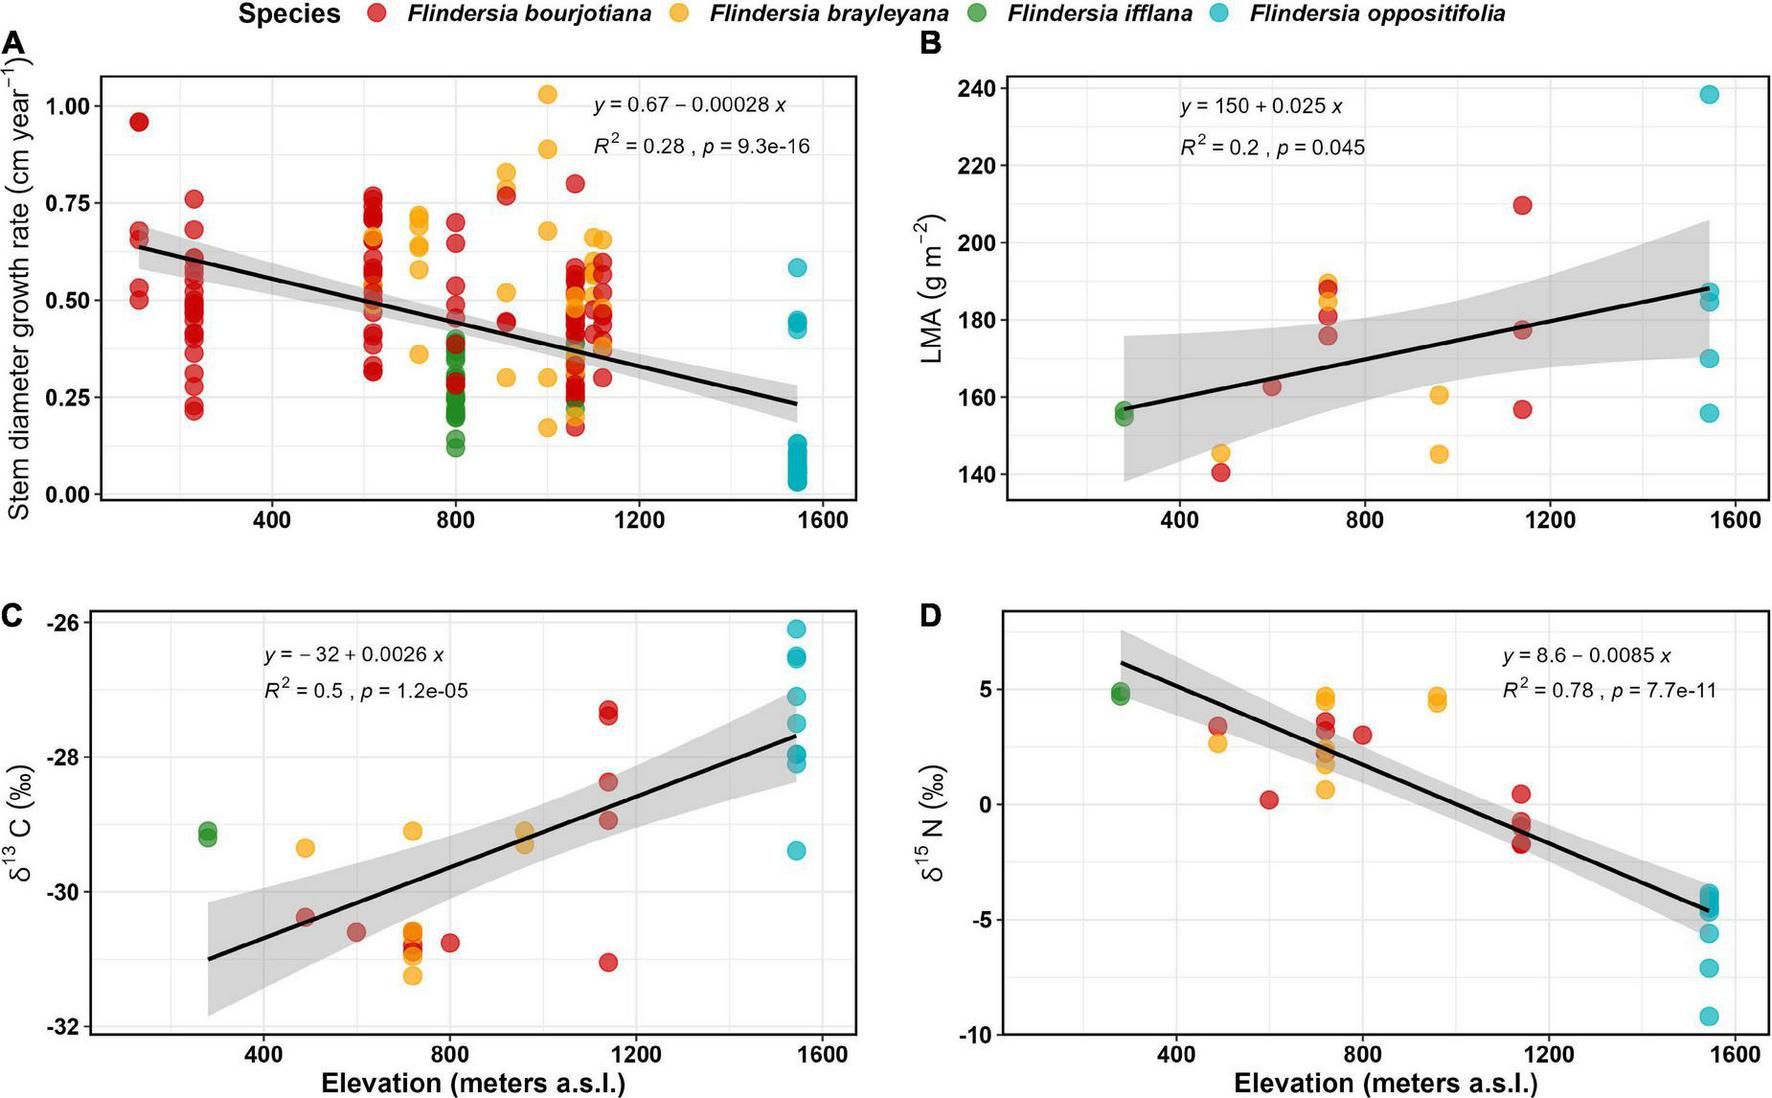
Field observed trends for (A) Stem diameter growth rates (cm year–1) (data and model predictions are square root transformed) (n = 195); (B) Leaf mass per unit Area (g m–2) (n = 20); (C) Leaf δ13 C (‰) (n = 30); and (D) Leaf δ15N (‰) (n = 30) of the four focal Flindersia species studied across an elevation gradient in the Australian Wet Tropics.
The decline in GR among Flindersia species with elevation was accompanied by increasing LMA with increasing elevation (R2 = 0.22, P < 0.05) (Figure 2B). The LMA increased by ca 25 g m–2 km–1 of elevation gain. When averaged for each species within a site, the highest LMA was recorded for F. oppositifolia (187 ± 27 g m–2) at Mount Bellenden Ker (1,550 m elevation) and the lowest for F. ifflana (156 ± 1 g m–2) at Kuranda National Park (∼300 m elevation). When averaged for each site, the highest LMA was recorded at Mount Bellenden Ker, and the lowest LMA (∼142 ± 3 g m–2) was recorded at Kaaru Creek (∼500 m elevation).
Foliar δ13C also increased significantly with elevation by ca 2.6‰ km–1 (R2 = 0.50, P < 0.01) (Figure 2C). The average foliar δ13C across the entire dataset was –29.0 ± 1.5‰ (n = 30). The least negative δ13C was observed for the mountaintop species, F. oppositifolia (–27.5‰ at 1,550 m) and most negative for F. brayleyana (–31.25‰ at 720 m).
Foliar δ15N significantly declined with increasing elevation (R2 = 0.78, P < 0.001) by ca 8.5‰ km–1 of elevation gain (Figure 2D). Average foliar δ15N across the entire dataset was –0.05 ± 3.9‰ (n = 30). There was a large reduction of nearly 10‰ observed from the lowland site (4.8‰ at ∼300 m elevation) to the mountaintop site (–5.2 ‰ at 1,550 m elevation).
3.3. Glasshouse experiment: Relative growth rate, root-to-shoot ratio, and LMA
Soil nutrient status had a significant effect on RGR, such that RGR was higher for plants in nutrient-rich compared to nutrient-poor soil (Figure 3 and Table 2). The two species that responded most strongly to an increase in nutrient availability in terms of RGR were F. ifflana, the most lowland of the species, and F. oppositifolia, the mountaintop restricted species (Figure 3). There was also an interaction effect between Species and the extent of increase in RGR with increasing temperature. The lowland species showed steeper increases in RGR with increasing temperature than the upland species (Figure 3). This was confirmed by the post hoc, linear contrast where the slope of temperature response was larger in the lowland than in the upland species [t(59) = 3.8, p < 0.001]. In general, the lowland species displayed an increasing RGR across the full temperature range, whereas the upland species did not.
FIGURE 3
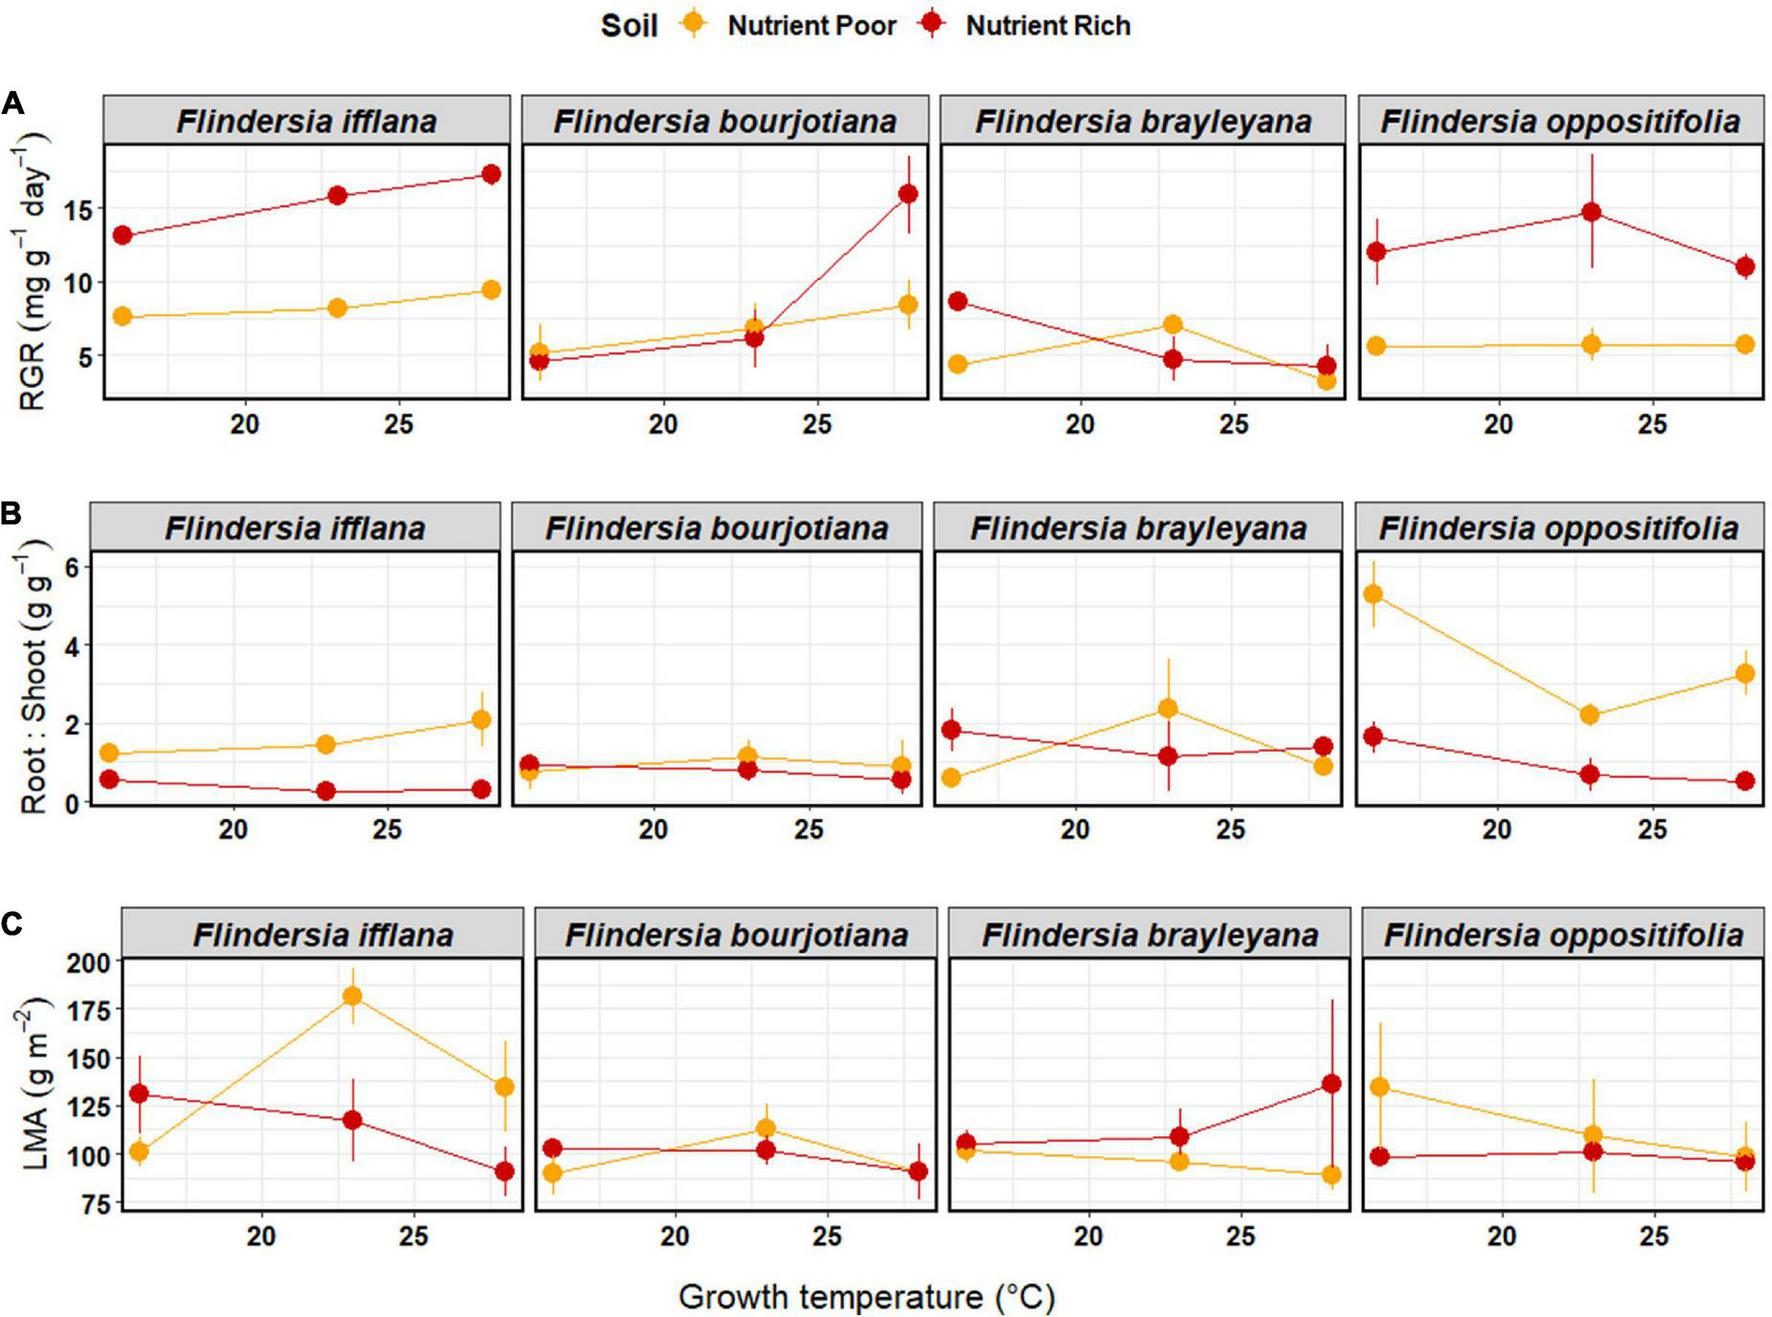
Means (±1SE) of (A) relative growth rate (mg g–1 day–1), (B) root-to-shoot ratio (g g–1), and (C) leaf mass per unit area (g m–2) among temperature and soil nutrient treatments (nutrient-rich soil = red, nutrient-poor soil = orange) in the glasshouse experiment. Each dot represents a mean of three individual saplings. Species are arranged left to right according to their observed elevation ranges, with leftmost being lowland and rightmost being mountaintop.
TABLE 2
| log (RGR) | R:S | 1/sqrt (LMA) | δ 13C | δ 15N | ||||||||||||||||
| Predictors | Sum of squares | F statistic | DF | p | Sum of squares | F statistic | DF | p | Sum of squares | F statistic | DF | p | Sum of squares | F statistic | DF | p | Sum of squares | F statistic | DF | p |
| (Intercept) | 2.23 | 17.69 | 1 | <0.001 | 0.87 | 1.02 | 1 | 0.319 | 0.153 | 1,045.0 | 1 | <0.001 | 2,782.8 | 1,950.4 | 1 | <0.001 | 4.48 | 5.30 | 1 | 0.025 |
| Temperature | 0.17 | 1.38 | 1 | 0.244 | 0.02 | 0.28 | 1 | 0.595 | – | – | – | – | 15.23 | 10.67 | 1 | 0.002 | 1.04 | 1.23 | 1 | 0.271 |
| Species | 1.88 | 4.96 | 3 | 0.004 | 18.45 | 7.088 | 3 | <0.001 | 0.001 | 2.10 | 3 | 0.108 | 25.30 | 5.92 | 3 | 0.001 | 5.49 | 2.16 | 3 | 0.10 |
| Soil | 1.61 | 12.74 | 1 | 0.001 | 6.72 | 7.75 | 1 | 0.007 | – | – | – | – | 14.16 | 9.93 | 1 | 0.002 | 73.55 | 87.02 | 1 | <0.001 |
| Temperature × Species | 2.64 | 6.95 | 3 | <0.001 | 7.19 | 2.67 | 3 | 0.050 | – | – | — | – | – | – | – | – | 10.50 | 4.14 | 3 | 0.010 |
| Soil × Species | 1.38 | 3.65 | 3 | 0.017 | 21.22 | 8.15 | 3 | <0.001 | – | – | – | – | – | – | – | – | – | – | – | – |
| Residuals | 7.42 | NA | 59 | NA | 51.19 | NA | 59 | NA | 51.19 | NA | 67 | NA | 92.73 | NA | 65 | NA | 52.40 | NA | 62 | NA |
Summary table of the type III ANOVA results from linear regressions for each of the response variables against growth temperature, soil nutrient status, species and interactions with species from the glasshouse experiment.
The p-values in bold indicate significant effects. Where interaction effects or a predictor itself were not significant and their removal resulted in a lower AIC, a simpler model has been shown. The removal of an interaction or a predictor has been indicated with ‘–’.
Root-to-shoot ratios (R:S) showed significant effects among Species and with Soil nutrient status (Table 2). The R:S was higher in nutrient-poor than in nutrient-rich soil, and there was a significant Species by Soil interaction (Table 2). This species-soil interaction was driven by the differential species response in the nutrient-poor Soil treatment. A pairwise, post hoc comparison among Species in the nutrient-poor Soil treatment, confirmed that the mountaintop-restricted species, F. oppositifolia, had a significantly higher R:S ratio compared to all other species [F. ifflana, t(59) = –3.6, p < 0.001; F. bourjotiana, t(59) = –4.85, p < 0.001; and F. brayleyana, t(59) = –4.18, p < 0.001]. A pairwise, post hoc comparison among Species in the nutrient-rich Soil treatment indicated no significant differences among species. The highest R:S ratio for any Species by treatment combination occurred for F. oppositifolia in nutrient-poor Soil in the cold Temperature treatment (Figure 3).
There were no significant effects of Temperature, Soil nutrient status or Species on LMA in the glasshouse (Table 2 and Figure 3).
3.4. Glasshouse experiment: Foliar stable isotope composition
For foliar δ13C in the glasshouse, there were significant main effects of Temperature, Soil nutrient status, and Species (Figure 4 and Table 2). Foliar δ13C generally increased (became less negative) in plants grown in nutrient-rich Soil and increased with increasing Temperature. Average foliar δ13C across the glasshouse dataset was –29.7 ± 1.4‰. There was an increase in δ13C of 1.3‰ associated with nutrient-rich compared to nutrient-poor Soil, and the rate of increase in δ13C was 0.1‰ per°C (Supplementary Table 4). A pairwise, post hoc comparison among Species showed that F. brayleyana had a more negative δ13C than all other species [F. ifflana, t(65) = 3.68, p < 0.01; F. bourjotiana, t(65) = 3.02, p < 0.05; and F. oppositifolia, t(65) = –3.46, p < 0.01]. Consistent with this, F. brayleyana in the field had also shown the most negative δ13C among the four species (Figure 2).
FIGURE 4
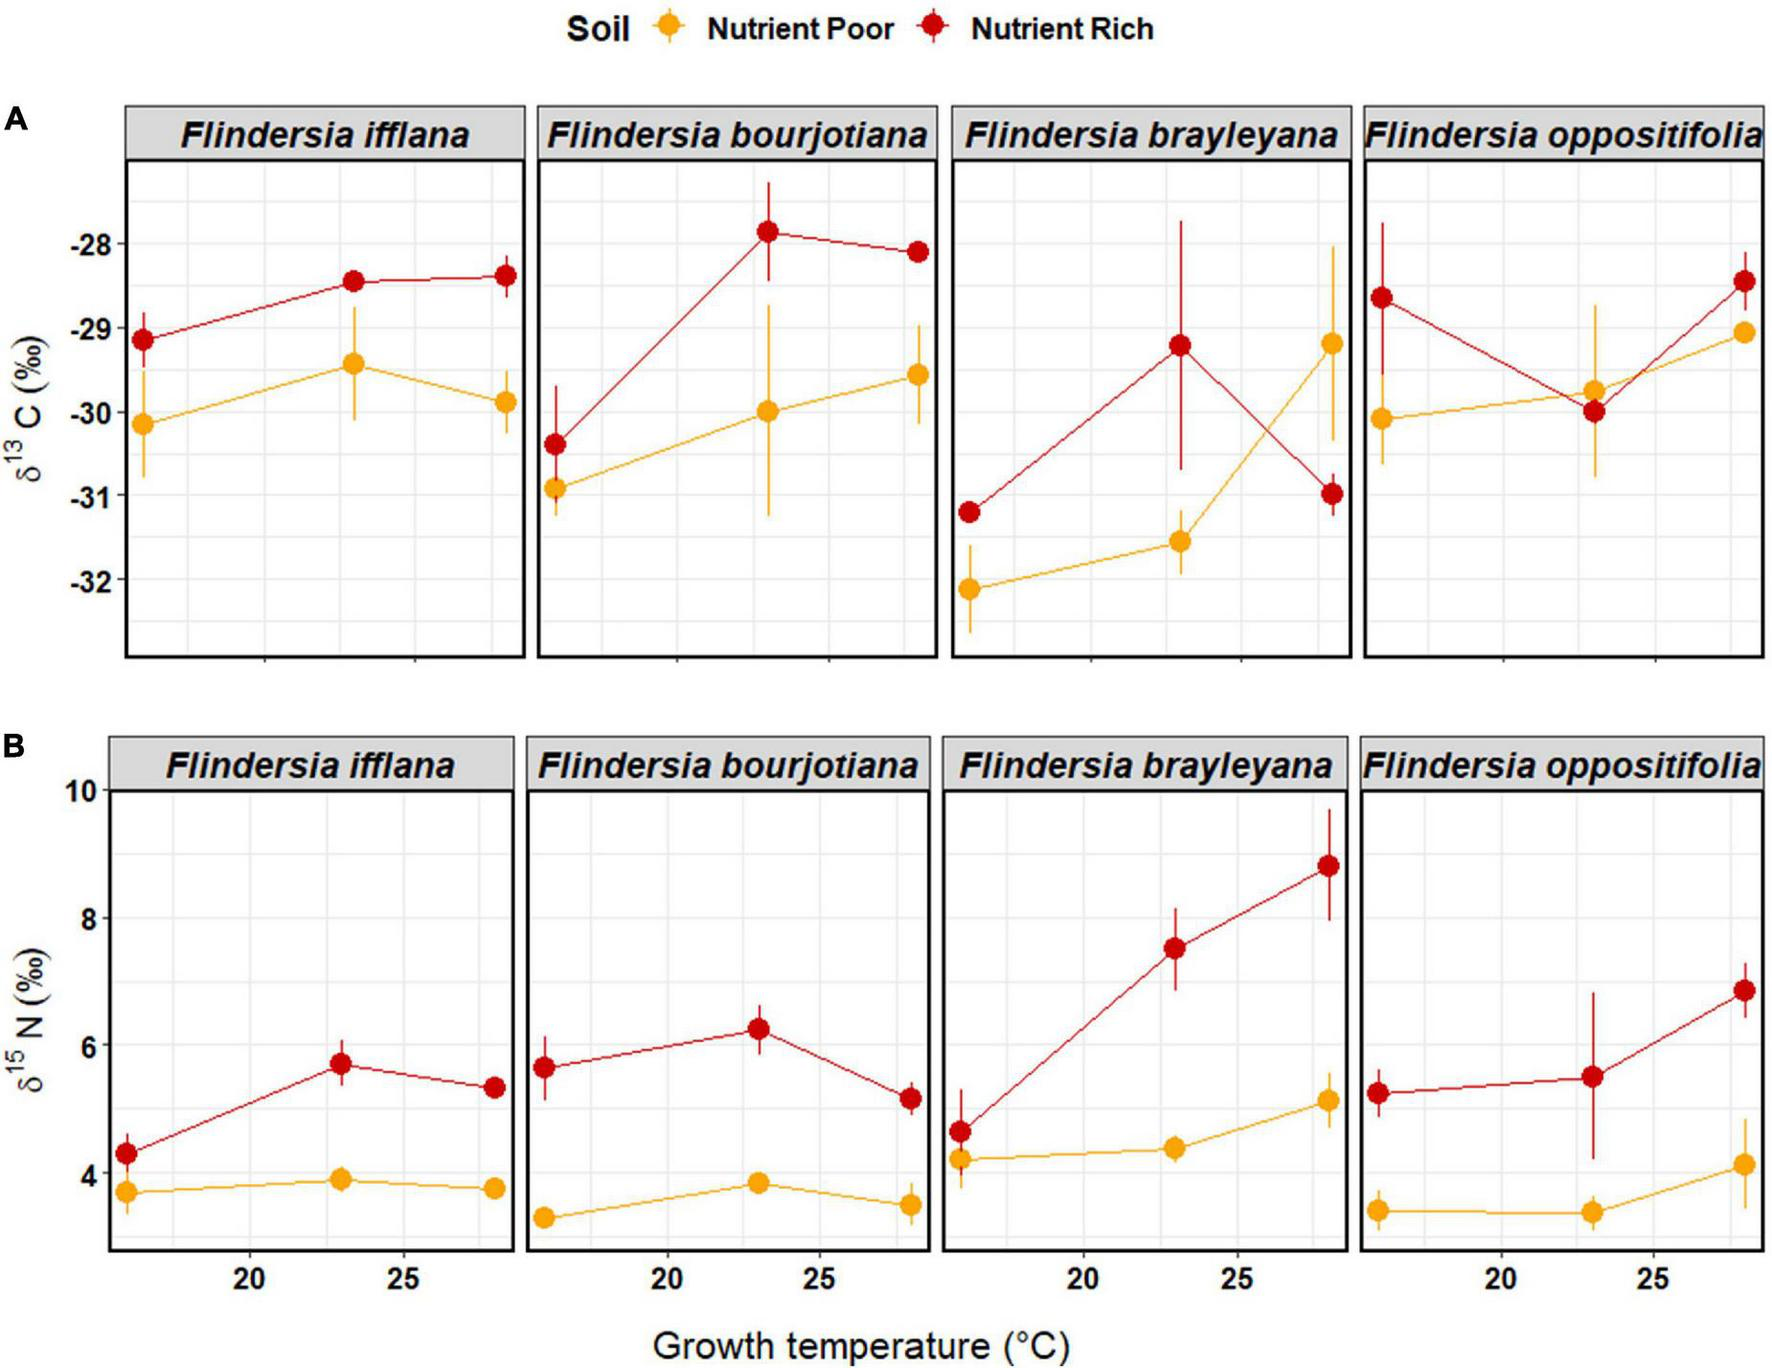
Means (±1SE) of (A) leaf δ13C (‰) and (B) leaf δ15N (‰) among temperature and soil nutrient treatments (nutrient-rich soil = red, nutrient-poor soil = orange) in the glasshouse experiment. Each dot represents a mean of three individual saplings. Species are arranged left to right according to their observed elevation ranges, with leftmost being lowland and rightmost being mountaintop.
Foliar δ15N displayed a consistent variation with Soil nutrient status, which was the most important predictor in the model (Table 2). Plants in nutrient-rich Soil in the glasshouse displayed a higher δ15N than those in nutrient-poor Soil; the increase in foliar δ15N associated with nutrient-rich compared to nutrient-poor Soil according to the model was 2.0‰ (Supplementary Table 4). There was also a significant interaction between Species and Temperature (Table 2 and Figure 4). The post hoc, linear contrast between upland and lowland species showed that foliar δ15N increased with temperature at a steeper rate in the upland species, F. brayleyana and F. oppositifolia, compared to the lowland species, F. ifflana and F. bourjotiana [t(62) = –2.87, p < 0.01]. The difference in slope between upland and lowland species was 0.13‰ per°C.
4. Discussion
We investigated trends in tree growth and leaf functional traits along an elevation gradient in the Australian Wet Tropics using a single, regionally important genus to gain insight into the responses of closely related species with differing elevational distributions. Observations in tropical rainforests on other continents have shown that tree growth rates and foliar δ15N typically decline with elevation (Bauters et al., 2017; Malhi et al., 2017), whereas LMA and foliar δ13C typically increase with elevation (Vitousek et al., 1990; Mumbanza et al., 2021). We confirmed from our field-based observations that similar trends also occur in Flindersia species in Australian tropical rainforests. These trends with elevation could be a result from at least three important drivers: decreasing temperatures, decreasing soil nutrient availability, and changes in species composition (Malhi et al., 2010; Rapp, 2010). Using a factorial glasshouse experiment, we attempted to disentangle these potential drivers to better understand their relative roles in controlling plant form and function. We detected direct effects of temperature and nutrient availability on some of the examined traits, and our results also suggested that some variation could be attributed to species adaptations to their preferred elevational ranges. Our experiment provided new insights in instances where the observed field trends could not be reproduced in the glasshouse by varying temperature and soil nutrient availability in isolation.
4.1. Growth rates, biomass allocation strategies and LMA
The observed decline in stem diameter growth rates among Flindersia species with increasing elevation was accompanied by a decline in MAT, i.e., ∼–5.3°C km–1 (Figure 1A), along with increasing C:N ratio in soils, indicative of declining nitrogen availability (Figure 1C). Previous studies have reported similar declines in growth rates with MAT among closely related Weinmannia species, in the Peruvian Andes (Rapp, 2010) and the southwest Andes (Tito et al., 2018). The effect of declining temperature with elevation drives slower metabolic rates, while slower nitrogen mineralization rates likely further contribute toward growth reductions (He et al., 2016; Gong et al., 2020). Our glasshouse experimental results also supported the idea that slower growth rates with increasing elevation could be partly explained by changes in species composition. Although species’ mean RGR across the experimental treatments did not reflect the species’ site of origin on the elevation gradient (i.e., RGR increasing with decreasing elevation of origin), we did find that the RGR of the upland species did not respond as strongly to temperature as in the lowland species. Interestingly, the mountaintop species, F. oppositifolia, displayed similar growth rates compared to the lowland collected species under lowland temperatures and in nutrient-rich soil (Figure 3). This bodes well for this mountaintop-restricted species, at least from an ex situ conservation perspective, in terms of its potential for growth in plantings at lower elevations (Primack et al., 2021). It may also indicate that warming temperatures per se, which are predicted to eliminate its current climate niche (Costion et al., 2015), may not negatively impact growth in situ, with optimal growth of this species occurring at temperatures higher than currently experienced. However, other factors associated with warming, such as increasing atmospheric water stress (Bauman et al., 2022b), and effects on seed bank dynamics (Liyanage et al., 2022), along with biotic interactions, may negatively impact survival of such mountaintop endemic plants (Cheesman and Winter, 2013).
In our glasshouse experiment, we observed that Soil nutrient status and Species had significant impacts on R:S ratios, but that the chamber temperature did not. This was exemplified by the observation that the mountaintop species in our experiment had a very high R:S under nutrient-poor, cold conditions, as has been reported with other montane taxa in their native growth provenance across the tropics (Wu et al., 2013; Fahey et al., 2016). Biomass allocation strategies under resource poor conditions have been explained by the optimal partitioning theory, which predicts that plants generally increase allocation of biomass toward the organs that acquire the most limiting resources (Kobe et al., 2010; Poorter et al., 2012), the roots in this case. Plants generally prefer a more conservative approach by investing more in roots under cold temperatures and lower nutrient availability and more in above ground parts with warmer temperatures and higher nutrient availability (Girardin et al., 2014). In general, Australian rainforest plants have adapted to nutrient-poor soils (Congdon and Herbohn, 2009; Gleason et al., 2010). However, the relatively higher allocation of biomass to roots in mountaintop plants may also indicate an adaptive functional strategy toward shallow soils and toward physical support from strong winds, in addition to nutrient foraging (Körner, 2007; Girardin et al., 2010; Wu et al., 2013). These observations suggest that an important trait that allows F. oppositifolia to compete successfully in the mountaintop environment is a greater capacity to allocate biomass to roots in cold, nutrient-poor conditions, which was not observed in the lowland species in the glasshouse under similar growth conditions.
Our observation of an increase in LMA with elevation compares well with field-based studies in the tropics (Neyret et al., 2016; Martin et al., 2020). The importance of LMA as an indicator of plant growth strategies is well established in the literature (Westoby et al., 2002; Poorter et al., 2009). LMA is the product of leaf thickness and density (Roderick et al., 1999), and studies have reported that plants generally display thicker and/or denser leaves in more stressful environments (Poorter et al., 2009). Higher LMA generally corresponds to the slow end in the fast-slow continuum of the leaf economic spectrum, indicative of a more conservative rather than acquisitive strategy (Wright et al., 2004). It has been suggested that higher LMA at lower temperatures might come about because of reduced leaf expansion rates (Westoby et al., 2002; Poorter et al., 2009; Van De Weg et al., 2012). Other factors potentially contributing to observed variation in LMA across elevation could be differences in incident light across sites given differences in cloud cover (Martin et al., 2020). Although, we did not quantify variation in irradiance where leaves were collected along the elevation gradient, all leaves in the study were ‘fully exposed’ sunlit leaves, but we must acknowledge this could have been an additional factor contributing to the observed variability in LMA.
We expected LMA, being a key growth trait reflecting acclimation to stress and/or resource poor conditions (Poorter et al., 2009), should have responded in our experimental treatments to temperature and/or soil nutrient availability. Surprisingly, we did not observe changes in LMA in our glasshouse experiment as we would have expected based on the observed field trend. This could possibly be explained by ontogenetic differences, insofar as mature trees were sampled in the field compared to saplings in the glasshouse experiment. Ontogeny has been previously highlighted as important in comparing trait measurements between experimental and field studies, especially for tropical plants (Poorter et al., 2012; Scalon et al., 2022).
4.2. Foliar δ13C and elevation
The influence of climate and soil properties in the field was reflected in the foliar isotopic composition with increasing elevation. Foliar isotope ratios are useful proxies to understand plant photosynthetic water use and nutrient dynamics in tropical ecosystems (Cernusak et al., 2007a; Craine et al., 2015). We observed an overall trend of increasing foliar δ13C (Figure 2C) with increasing elevation (ca ∼2.6‰ km–1) among the Flindersia trees that we sampled in the Australian Wet Tropics. This can be compared to global studies on C3 plants in humid forests, where on average ∼1.3‰ km–1 increase in foliar δ13C has been reported with elevation (Li et al., 2009). Likewise, a study reported a change from –29.5‰ in lower elevation sites to as high as –24.8‰ in montane sites of Hawaii for a single species, Metrosideros polymorpha Gaudich (Cordell et al., 1998). Such large intraspecific variation has been attributed to increase in species’ water-use efficiency with increasing elevation and its inherent adaptive plasticity to variable environmental conditions (Cordell et al., 1998; Peri et al., 2012). Studies have also reported variation in foliar δ13C with other environmental attributes such as precipitation, soil nutrients, solar radiation, and VPD (Vitousek et al., 1990; Chen et al., 2017; Zou et al., 2019; Bauman et al., 2022a). Variation in foliar δ13C with elevation can also result from the influence of leaf morphology (leaf thickness or LMA, for example), which leads to longer diffusion pathways for CO2 into the leaf and decreases the internal-to-ambient CO2 concentration ratio (ci/ca) and hence causes enrichment of foliar δ13C in montane flora (Körner et al., 1986; Prentice et al., 2014). Another contributing factor could be increased viscosity of water with lower temperature, which causes larger frictional resistance to water transport and hence a partial closure of stomata thereby decreasing ci/ca and increasing foliar δ13C (Prentice et al., 2014).
Two aspects of our observations of foliar δ13C in the glasshouse went in opposite directions to the trends in the field. We did observe changes in foliar δ13C in response to temperature, but the direction of this response was opposite to that in the field. Foliar δ13C became less negative with increasing experimental temperature, whereas in the field it was more negative at lower (warmer) than at higher (cooler) elevations. Such a trend, as observed in the glasshouse, of increasing δ13C with increasing temperature has been previously reported from arid or semi-arid sites (Chen et al., 2017), and could be explained by increased VPD at warmer temperatures, which causes stomatal closure (Grossiord et al., 2020). Such conditions lead to a lower ci/ca resulting in a higher δ13C with increasing VPD (Cernusak et al., 2013). In our glasshouse study, VPD increased with increasing temperature, and so when plotted against VPD, foliar δ13C increased with increasing VPD (Supplementary Figure 6), as would be expected, all else being equal. Interestingly, for the field collections in the Australian Wet Tropics, the annual mean VPD also decreases with decreasing temperature as elevation increases (Bauman et al., 2022b; Supplementary Figure 2). This suggests that the role of VPD in driving field trends in foliar δ13C is insufficient to overcome drivers pushing in the other direction as elevation increases to enrich foliar δ13C.
The second aspect of our glasshouse results for foliar δ13C that did not agree with the field trends was the response to nutrient availability. Plants grown in nutrient-rich soil had higher δ13C than those grown in nutrient-poor soil (Figure 4). This was expected, based on previous studies (Cernusak et al., 2007b; Palma et al., 2020), and the known physiological response of lower ci/ca in leaves with a higher photosynthetic capacity resulting from higher nitrogen concentrations (Cernusak et al., 2013). However, in the field, we demonstrated that nutrient availability likely decreases with increasing elevation, as indicated by the increase in soil C:N ratio (Figure 1C). Thus, if we consider this in isolation, it indicates an opposite response to that observed in the glasshouse: foliar δ13C in the field became higher with increasing elevation as soil nitrogen availability likely decreased, rather than increased.
We suggest that there are two driving factors in the field that can explain foliar δ13C responses to elevation, and which are apparently sufficient to overcome effects of temperature on VPD and nutrient availability that push in the opposite direction. The first is changes in leaf structure that occurred in the field with increasing elevation, but which were absent in the glasshouse. The increase in LMA with increasing elevation in the field would likely be indicative of a greater tortuosity for diffusion of CO2 inside the leaf, increasing the intercellular air space diffusion resistance, and thicker cell walls, increasing the mesophyll diffusion resistance, both ultimately lowering chloroplastic CO2 concentrations and therefore discrimination against 13C. The effect of more robust leaf structure was identified by Vitousek et al. (1990) as the most potent driver of foliar δ13C trends with elevation in Metrosideros polymorpha Gaudich. in Hawaii. The second driving factor in the field that did not occur in the glasshouse is the decrease in atmospheric pressure that accompanies an increase in elevation. Effects of this on 13C discrimination are less mechanistically understood, but it is known that a decrease in oxygen partial pressure in the chloroplast can increase the efficiency of carboxylation (Farquhar and Wong, 1984), which may further decrease discrimination against 13C. Thus, our glasshouse results suggest that the drawdown of chloroplastic CO2 in the field is likely to be related to the low atmospheric pressure at higher elevations and changes in leaf structure that increase the diffusion resistance through the internal airspace and mesophyll (Vitousek et al., 1990; Wang et al., 2017), neither of which occurred in the glasshouse with a change in temperature. Our glasshouse results also show that a change in water viscosity that occurs with temperature was not a strong enough driver of variation in foliar δ13C to overcome the effect of the increases in VPD that coincided with increasing temperature (Supplementary Figure 6).
Given the known relationship between mean annual precipitation (MAP) and foliar δ13C (Cernusak et al., 2013; Cornwell et al., 2018), it is reasonable to ask whether a difference in soil water availability between the field and the glasshouse might have impacted our results. In the glasshouse, the experimental pots were watered to field capacity by hand each day, and we therefore feel confident that they did not experience substantive soil water deficits. With respect to the field collections, the Australian Wet Tropics in general is characterized by MAP approaching and exceeding 2,000 mm (Turton et al., 1999), a range in which foliar δ13C in tropical rainforests is largely insensitive to MAP (Leffler and Enquist, 2002; Diefendorf et al., 2010). In a recent analysis, it was shown that mean climatological water deficit was not a significant predictor of tree growth rates across forests in the Australian Wet Tropics similar to those that we sampled (Bauman et al., 2022a). Furthermore, sap flow measurements at lowland, mid-elevation, and high elevation sites in the Australian Wet Tropics indicated that transpiration at the tree level is largely unresponsive to seasonal variations in soil moisture (McJannet et al., 2007; Binks et al., 2022). At the Daintree Rainforest Observatory, a lowland site, a multi-year throughfall exclusion experiment resulted in no response of foliar δ13C in the treated plot compared to the control plot (Pivovaroff et al., 2021). Finally, mean foliar δ13C values in our study for the three species with broader elevation ranges were very similar in the glasshouse compared to the field (F. ifflana, –29.3‰ vs. –29.2‰; F. bourjotiana, –29.6‰ vs. –29.6‰; F. brayleyana, –30.7‰ vs. –30.5‰), as can also be seen in Figures 2, 4. The mountaintop species, F. oppositifolia, had a mean value in the glasshouse of –29.3‰ compared to –27.5‰ in the field. This enrichment of approximately 2‰ for F. oppositifolia grown in the field at 1,550 m elevation compared to the plants grown near sea level in the glasshouse cannot have resulted from a limitation of soil water availability on the mountaintop; observed MAP on the top of Mount Bellenden Ker near where the trees were sampled exceeds 7,000 mm (McJannet et al., 2007). The WorldClim gridded climate product provided an estimate of 5,650 mm (Supplementary Table 1), but this reflects a known bias in coarser scale products for this site due to the complex topography (Turton et al., 1999). These considerations combined argue strongly against soil water deficit as an important driver of the foliar δ13C data that we present in this paper.
4.3. Foliar δ15N and elevation
For foliar δ15N we found a marked decrease with increasing elevation (∼ –8.5‰ km–1 elevation), which is a much larger change compared to most studies in the tropics (Liu et al., 2007; Liu and Wang, 2010; Bauters et al., 2017; Wang et al., 2019). For instance, a study from Mt Gongga, in the southwest region of China, reported on average ∼ –1.3‰ difference from 1,100 to 4,900 m elevation (Li et al., 2009); and –1.4‰ to 14.2‰ across an elevation gradient from 900 to ∼4,000 m in the Ethiopian Rift valley (Liu et al., 2007). The closest to our observation comes from one study involving Pinus spp. in Nepal that reported nearly –8‰ difference over 800 m elevation (Sah and Brumme, 2003). These trends are known to be related in part to a decline in δ15N of soil nitrogen with elevation (Wang et al., 2019). We did find some evidence of such a relationship between foliar δ15N and that of the soil nitrogen in our study (Supplementary Figure 5). The enrichment of δ15N at warmer, lowland sites is thought to result from a more open nitrogen cycle, where nitrogen loss pathways discriminate against the heavier isotope, 15N, leaving the residual nitrogen pool 15N enriched (Martinelli et al., 1999; Ma et al., 2012; Peri et al., 2012; Wang et al., 2019). The marked decline in foliar δ15N that we observed in the Australian Wet Tropics suggests that a slowing and tightening of the nitrogen cycle with increasing elevation is likely a key driver of decreasing tree growth rates.
Furthermore, under glasshouse conditions we did observe differences in foliar δ15N consistent with field-based trends, although the observed variation was generally not as large as seen in field. The differences in foliar δ15N in the field versus the glasshouse might be related to soil development processes. For example, the trends in the glasshouse reflect a snapshot of the species’ growth within the experimental period reflecting foliar signatures based on available soil N. On the other hand, those observed in the field partly reflect the ecosystem nitrogen pool that would have developed from nutrient cycling processes integrated over millennia (Craine et al., 2015). In our glasshouse study, variation in foliar δ15N induced by soil nutrient status was still pronounced, with higher foliar δ15N in nutrient-rich (∼5.9‰) compared to nutrient-poor (∼3.8‰) soils, averaged for all species. We suggest that this increase in foliar δ15N in the nutrient-rich pots can be explained by greater opportunity for N loss from the pots by δ15N fractionating pathways than in the case where nutrient availability is low and available N is effectively captured by the soil-plant system. In support of this, we also observed that foliar δ15N varied as a function of root mass (Supplementary Figure 7), indicating the influence of larger root systems in capturing available nitrogen, thereby limiting loss pathways from the soil-plant system that would otherwise leave the residual δ15N in the system 15N enriched (Baumgartner et al., 2021).
We observed a significant interaction between Species and Temperature for foliar δ15N in the glasshouse study (Table 2). This indicated that as growth temperature increased, foliar δ15N tended to increase in the upland species, but not in the lowland species (Figure 4). We suggest that the species difference in foliar δ15N indicates a better ability of the lowland species to absorb increasingly available nitrogen as increasing temperatures drove faster nitrogen mineralization rates in the experimental pots. The lowland species, in turn, were able to take advantage of this by increasing their relative growth rates under these conditions (as see in Figure 3). The upland species, on the other hand, have likely evolved to function in conditions of relatively low nitrogen availability, and lacked the capacity to ramp up their nitrogen uptake to the same extent in response to the warmer growth temperatures. This would have allowed greater nitrogen losses from the soil-plant systems, which then caused increases in foliar δ15N. Thus, our results indicate that there are likely important belowground traits related to nutrient absorption capacity that distinguish Flindersia species with differing habitat preferences along the elevation gradient. It is also important to note the role of soil microbes in controlling the δ15N of the soil-plant system, and in modulating soil nitrogen transformations that can lead to nitrogen isotope fractionations (Houlton et al., 2006; Pajares and Bohannan, 2016; Hestrin et al., 2019); although we recognize the importance of these processes, we did not quantify them in the present study.
4.4. Concluding remarks
Climate change is driving warmer temperatures in the tropics, and it has been suggested that these could potentially have negative effects on tropical tree growth, with implications for biomass productivity and ecosystem functioning (Hatfield and Prueger, 2015; Malhi et al., 2015). It is important to recognize that responses of tropical trees to global warming involve a myriad of interacting factors. Our study demonstrated that altering temperature in isolation of other factors that covary in nature can lead to counterintuitive results, for example in the case of foliar δ13C. In natural ecosystems, temperature itself may only indirectly drive impacts of warming. For example, mortality in mature rainforest trees of the Australian Wet Tropics has been increasing in recent decades, but the trend in increase in tree mortality can be better attributed to increasing air VPD, which has accompanied the increase in air temperature (Bauman et al., 2022b). We also observed in this study that elevation patterns in tree function are linked to changes in nutrient availability, and even to the change in atmospheric pressure that coincides with a change in elevation.
Adaptations of Flindersia species to their different preferred habitats along the elevation gradient were evident in their responses to temperature in the glasshouse. We found that upland species did not show increasing growth rates with increasing temperatures, whereas lowland species did, indicating their ability to acclimate to warmer conditions. In addition, we observed that a distinguishing feature of a mountaintop-restricted species was a proportionally larger allocation toward roots under nutrient-poor, cold conditions. This feature is known to help plants with physical support from higher wind speeds on tropical mountaintops, and likely contributes to nutrient foraging when soil nutrients are scarce (Körner, 2003). As the climate warms, impacts on nutrient cycling at the ecosystem scale may lag direct effects of temperature on tree metabolism; understanding how such changes will interact with species traits is a formidable, but an important, challenge.
Statements
Data availability statement
The raw data supporting the conclusions of this article will be made available by the authors, without undue reservation.
Author contributions
ASR and LAC conceived the manuscript with inputs from AWC and HF-M. ASR conducted field data collection and designed the experiment under the supervision of LAC and AWC. DMC helped develop species selection. NDP facilitated seed collection. ASR conducted the data analysis with inputs from HF-M and LAC. ASR wrote the first draft with LAC. All authors edited and approved the final draft for publication.
Funding
The Ian Potter Foundation (Funding number 20190013), the Skyrail Rainforest Foundation, and the Wet Tropics Management Authority.
Acknowledgments
We acknowledge the traditional owners of the land where this research was conducted, the Kuku-yalanji, Durbalngan, and Djabuganjdji people, and thank the Department of Environment and Science, Queensland National Parks for granting a permit to collect seeds from various rainforest provenances in the Australian Wet Tropics. We thank Jen Whan for assisting with the isotope analyses, Stuart Worboys, Penny van Oosterzee, and Ana Palma for assisting with field seed collections, and Damian Settle for assisting with experimental plant harvests. We thank the reviewers for their comments that helped improve this manuscript. We also acknowledge the Ian Potter Foundation, the Skyrail Rainforest Research Foundation, and the Wet Tropics Management Authority for funding this research. ASR thanks James Cook University for providing an International Postgraduate Research Scholarship.
Conflict of interest
The authors declare that the research was conducted in the absence of any commercial or financial relationships that could be construed as a potential conflict of interest.
Publisher’s note
All claims expressed in this article are solely those of the authors and do not necessarily represent those of their affiliated organizations, or those of the publisher, the editors and the reviewers. Any product that may be evaluated in this article, or claim that may be made by its manufacturer, is not guaranteed or endorsed by the publisher.
Supplementary material
The Supplementary Material for this article can be found online at: https://www.frontiersin.org/articles/10.3389/ffgc.2023.1089167/full#supplementary-material
References
1
Aiello-LammensM. E.BoriaR. A.RadosavljevicA.VilelaB.AndersonR. P. (2015). spThin: An R package for spatial thinning of species occurrence records for use in ecological niche models.Ecography38541–545. 10.1111/ecog.01132
2
AmundsonR.AustinA. T.SchuurE. A.YooK.MatzekV.KendallC.et al (2003). Global patterns of the isotopic composition of soil and plant nitrogen.Glob. Biogeochem. Cycles171–5. 10.1029/2002GB001903
3
BaumanD.FortunelC.CernusakL. A.BentleyL. P.McmahonS. M.RifaiS. W. (2022a). Tropical tree growth sensitivity to climate is driven by species intrinsic growth rate and leaf traits.Glob. Change Biol.281414–1432. 10.1111/gcb.15982
4
BaumanD.FortunelC.DelhayeG.MalhiY.CernusakL. A.BentleyL. P.et al (2022b). Tropical tree mortality has increased with rising atmospheric water stress.Nature608528–533. 10.1038/s41586-022-04737-7
5
BaumgartnerS.BautersM.BarthelM.DrakeT. W.NtabobaL. C.BazirakeB. M.et al (2021). Stable isotope signatures of soil nitrogen on an environmental–geomorphic gradient within the Congo Basin.SOIL783–94. 10.5194/soil-7-83-2021
6
BautersM.VerbeeckH.DemolM.BruneelS.TaveirneC.Van Der HeydenD.et al (2017). Parallel functional and stoichiometric trait shifts in South American and African forest communities with elevation.Biogeosciences145313–5321. 10.5194/bg-14-5313-2017
7
BaylyM. J.HolmesG. D.ForsterP. I.CantrillD. J.LadigesP. Y. (2013). Major clades of Australasian Rutoideae (Rutaceae) based on rbcL and atpB sequences.PLoS One8:e72493. 10.1371/journal.pone.0072493
8
BelbinL. (2011). “The atlas of living Australia’s spatial portal,” in Proceedings of the environmental information management conference, (Santa Barbara, CA: University of California), 28–29.
9
BinksO.CernusakL. A.LiddellM.BradfordM.CoughlinI.CarleH.et al (2022). Forest system hydraulic conductance: Partitioning tree and soil components.New Phytol.2331667–1681. 10.1111/nph.17895
10
BradfordM. G.MetcalfeD. J.FordA.LiddellM. J.MckeownA. (2014a). Floristics, stand structure and aboveground biomass of a 25-ha rainforest plot in the wet tropics of Australia.J. Trop. For. Sci.26543–553.
11
BradfordM. G.MurphyH. T.FordA. J.HoganD. L.MetcalfeD. J. (2014b). Long-term stem inventory data from tropical rain forest plots in Australia.Ecology952362–2362. 10.1890/14-0458R.1
12
CampbellG. S.NormanJ. M. (1998). An introduction to environmental biophysics.New York, NY: Springer-Verlag. 10.1007/978-1-4612-1626-1
13
CernusakL. A.ArandaJ.MarshallJ. D.WinterK. (2007a). Large variation in whole-plant water-use efficiency among tropical tree species.New Phytol.173294–305. 10.1111/j.1469-8137.2006.01913.x
14
CernusakL. A.WinterK.ArandaJ.TurnerB. L.MarshallJ. D. (2007b). Transpiration efficiency of a tropical pioneer tree (Ficus insipida) in relation to soil fertility.J. Exp. Bot.583549–3566. 10.1093/jxb/erm201
15
CernusakL. A.UbiernaN.WinterK.HoltumJ. A. M.MarshallJ. D.FarquharG. D. (2013). Environmental and physiological determinants of carbon isotope discrimination in terrestrial plants.New Phytol.200950–965. 10.1111/nph.12423
16
CernusakL. A.WinterK.TurnerB. L. (2009). Plant δ15N correlates with the transpiration efficiency of nitrogen acquisition in tropical trees.Plant Physiol.1511667–1676. 10.1104/pp.109.145870
17
CheesmanA. W.PreeceN. D.OosterzeeP.ErskineP. D.CernusakL. A. (2018). The role of topography and plant functional traits in determining tropical reforestation success.J. Appl. Ecol.551029–1039. 10.1111/1365-2664.12980
18
CheesmanA. W.WinterK. (2013). Growth response and acclimation of CO2 exchange characteristics to elevated temperatures in tropical tree seedlings.J. Exp. Bot.643817–3828. 10.1093/jxb/ert211
19
ChenZ.WangG.JiaY. (2017). Foliar δ13C Showed No Altitudinal Trend in an Arid Region and Atmospheric Pressure Exerted a Negative Effect on Plant δ13C.Front. Plant Sci.8:1070. 10.3389/fpls.2017.01070
20
CongdonR. A.HerbohnJ. L. (2009). Ecosystem dynamics of disturbed and undisturbed sites in north Queensland wet tropical rain forest. I. Floristic composition, climate and soil chemistry.J. Trop. Ecol.9349–363. 10.1017/S0266467400007409
21
CordellS.GoldsteinG.Mueller-DomboisD.WebbD.VitousekP. M. (1998). Physiological and morphological variation in Metrosideros polymorpha, a dominant Hawaiian tree species, along an altitudinal gradient: The role of phenotypic plasticity.Oecologia113188–196. 10.1007/s004420050367
22
CornelissenJ. H. C.LavorelS.GarnierE.DíazS.BuchmannN.GurvichD. E.et al (2003). A handbook of protocols for standardised and easy measurement of plant functional traits worldwide.Aust. J. Bot.51335–380. 10.1071/BT02124
23
CornwellW. K.WrightI. J.TurnerJ.MaireV.BarbourM. M.CernusakL. A.et al (2018). Climate and soils together regulate photosynthetic carbon isotope discrimination within C3 plants worldwide.Glob. Ecol. Biogeogr.271056–1067. 10.1111/geb.12764
24
CostionC. M.SimpsonL.PertP. L.CarlsenM. M.John KressW.CraynD. (2015). Will tropical mountaintop plant species survive climate change? Identifying key knowledge gaps using species distribution modelling in Australia.Biol. Conserv.191322–330. 10.1016/j.biocon.2015.07.022
25
CraineJ. M.BrookshireE. N. J.CramerM. D.HasselquistN. J.KobaK.Marin-SpiottaE.et al (2015). Ecological interpretations of nitrogen isotope ratios of terrestrial plants and soils.Plant Soil3961–26. 10.1007/s11104-015-2542-1
26
DiefendorfA. F.MuellerK. E.WingS. L.KochP. L.FreemanK. H. (2010). Global patterns in leaf 13C discrimination and implications for studies of past and future climate.Proc. Natl. Acad. Sci. U.S.A.1075738–5743. 10.1073/pnas.0910513107
27
FaheyT. J.ShermanR. E.TannerE. V. J. (2016). Tropical montane cloud forest: Environmental drivers of vegetation structure and ecosystem function.J. Trop. Ecol.32355–367. 10.1017/S0266467415000176
28
FarquharG.WongS. (1984). An empirical model of stomatal conductance.Funct. Plant Biol.11191–210. 10.1071/PP9840191
29
FickS. E.HijmansR. J. (2017). WorldClim 2: New 1-km spatial resolution climate surfaces for global land areas.Int. J. Climatol.374302–4315. 10.1002/joc.5086
30
ForbesS. J.CernusakL. A.NorthfieldT. D.GleadowR. M.LambertS.CheesmanA. W. (2020). Elevated temperature and carbon dioxide alter resource allocation to growth, storage and defence in cassava (Manihot esculenta Crantz).Environ. Exp. Bot.173:103997. 10.1016/j.envexpbot.2020.103997
31
GirardinC. A. J.EspejobJ. E. S.DoughtyC. E.HuascoW. H.MetcalfeD. B.Durand-BacaL. (2014). Productivity and carbon allocation in a tropical montane cloud forest in the Peruvian Andes.Plant Ecol. Divers.7107–123. 10.1080/17550874.2013.820222
32
GirardinC. A. J.MalhiY.AragaoL. E. O. C.MamaniM.HuascoW. H.DurandL.et al (2010). Net primary productivity allocation and cycling of carbon along a tropical forest elevational transect in the Peruvian Andes.Glob. Change Biol.163176–3192. 10.1111/j.1365-2486.2010.02235.x
33
GleasonS. M.ReadJ.AresA.MetcalfeD. J. (2010). Species-soil associations, disturbance, and nutrient cycling in an Australian tropical rainforest.Oecologia1621047–1058. 10.1007/s00442-009-1527-2
34
GongH.LiY.YuT.ZhangS.GaoJ.ZhangS.et al (2020). Soil and climate effects on leaf nitrogen and phosphorus stoichiometry along elevational gradients.Glob. Ecol. Conserv.23:e01138. 10.1016/j.gecco.2020.e01138
35
GrossiordC.BuckleyT. N.CernusakL. A.NovickK. A.PoulterB.SiegwolfR. T. W.et al (2020). Plant responses to rising vapor pressure deficit.New Phytol.2261550–1566. 10.1111/nph.16485
36
HatfieldJ. L.PruegerJ. H. (2015). Temperature extremes: Effect on plant growth and development.Weather Clim. Extrem.104–10. 10.1016/j.wace.2015.08.001
37
HeX.HouE.LiuY.WenD. (2016). Altitudinal patterns and controls of plant and soil nutrient concentrations and stoichiometry in subtropical China.Sci. Rep.6:24261. 10.1038/srep24261
38
HestrinR.HammerE. C.MuellerC. W.LehmannJ. (2019). Synergies between mycorrhizal fungi and soil microbial communities increase plant nitrogen acquisition.Commun. Biol.2:233. 10.1038/s42003-019-0481-8
39
HoffmannW. A.PoorterH. (2002). Avoiding bias in calculations of relative growth rate.Ann. Bot.9037–42. 10.1093/aob/mcf140
40
HoultonB. Z.SigmanD. M.HedinL. O. (2006). Isotopic evidence for large gaseous nitrogen losses from tropical rainforests.Proc. Natl. Acad. Sci. U.S.A.1038745–8750. 10.1073/pnas.0510185103
41
KobeR. K.IyerM.WaltersM. B. (2010). Optimal partitioning theory revisited: Nonstructural carbohydrates dominate root mass responses to nitrogen.Ecology91166–179. 10.1890/09-0027.1
42
KörnerC. (2003). “Plant ecology at high elevations,” in Alpine plant life, (Berlin: Springer), 1–7. 10.1007/978-3-642-18970-8_1
43
KörnerC. (2007). The use of ‘altitude’ in ecological research.Trends Ecol. Evol.22569–574. 10.1016/j.tree.2007.09.006
44
KörnerC.BannisterP.MarkA. (1986). Altitudinal variation in stomatal conductance, nitrogen content and leaf anatomy in different plant life forms in New Zealand.Oecologia69577–588. 10.1007/BF00410366
45
LefflerA. J.EnquistB. J. (2002). Carbon isotope composition of tree leaves from Guanacaste, Costa Rica: Comparison across tropical forests and tree life history.J. Trop. Ecol.18151–159. 10.1017/S0266467402002109
46
LenthR.SingmannH.LoveJ.BuerknerP.HerveM. (2018). Emmeans: Estimated marginal means, aka least-squares means. R package version 1, 3.
47
LiJ.WangG.LiuX.HanJ.LiuM.LiuX. (2009). Variations in carbon isotope ratios of C3 plants and distribution of C4 plants along an altitudinal transect on the eastern slope of Mount Gongga.Sci. China Ser. D Earth Sci.521714–1723. 10.1007/s11430-009-0170-4
48
LiuX.WangG.LiJ.WangQ. (2010). Nitrogen isotope composition characteristics of modern plants and their variations along an altitudinal gradient in Dongling Mountain in Beijing.Sci. China Ser. D Earth Sci.53128–140. 10.1007/s11430-009-0175-z
49
LiuX.ZhaoL.GasawM.GaoD.QinD.RenJ. (2007). Foliar δ13C and δ15N values of C3 plants in the Ethiopia Rift Valley and their environmental controls.Chin. Sci. Bull.521265–1273. 10.1007/s11434-007-0165-5
50
LiuX. Z.WangG. (2010). Measurements of nitrogen isotope composition of plants and surface soils along the altitudinal transect of the eastern slope of Mount Gongga in southwest China.Rapid Commun. Mass Spectrom.243063–3071. 10.1002/rcm.4735
51
LiyanageG.OffordC.CraynD.GujaL.WorboysS.SommervilleK. (2022). Understanding seed dormancy and germination aids conservation of rainforest species from tropical montane cloud forest: A case study confirming morphophysiological dormancy in the genus Tasmannia.Aust. J. Bot.70399–408. 10.1071/BT22011
52
LüdeckeD.Ben-ShacharM. S.PatilI.WaggonerP.MakowskiD. (2021). performance: An R package for assessment, comparison and testing of statistical models.J. Open Sour. Softw.6:3139. 10.21105/joss.03139
53
MaJ.-Y.SunW.LiuX.-N.ChenF.-H. (2012). Variation in the stable carbon and nitrogen isotope composition of plants and soil along a precipitation gradient in Northern China.PLoS One7:e51894. 10.1371/journal.pone.0051894
54
MalhiY.DoughtyC. E.GoldsmithG. R.MetcalfeD. B.GirardinC. A. J.MarthewsT. R. (2015). The linkages between photosynthesis, productivity, growth and biomass in lowland Amazonian forests.Glob. Change Biol.212283–2295. 10.1111/gcb.12859
55
MalhiY.GirardinC. A. J.GoldsmithG. R.DoughtyC. E.SalinasN.MetcalfeD. B.et al (2017). The variation of productivity and its allocation along a tropical elevation gradient: A whole carbon budget perspective.New Phytol.2141019–1032. 10.1111/nph.14189
56
MalhiY.SilmanM.SalinasN.BushM.MeirP.SaatchiS. (2010). Introduction: Elevation gradients in the tropics: Laboratories for ecosystem ecology and global change research.Glob. Change Biol.163171–3175. 10.1111/j.1365-2486.2010.02323.x
57
MartinR. E.AsnerG. P.BentleyL. P.ShenkinA.SalinasN.HuayparK. Q.et al (2020). Covariance of sun and shade leaf traits along a tropical forest elevation gradient.Front. Plant Sci.10:1810. 10.3389/fpls.2019.01810
58
MartinelliL. A.PiccoloM. C.TownsendA. R.VitousekP. M.CuevasE.McdowellW.et al (1999). Nitrogen stable isotopic composition of leaves and soil: tropical versus temperate forests.Biogeochemistry4645–65. 10.1007/BF01007573
59
McJannetD.WallaceJ.ReddellP. (2007). Precipitation interception in Australian tropical rainforests: II. Altitudinal gradients of cloud interception, stemflow, throughfall and interception.Hydrol. Process.211703–1718. 10.1002/hyp.6346
60
MumbanzaF. M.BautersM.MeunierF.BoeckxP.CernusakL. A.De DeurwaerderH. P. (2021). Lianas and trees exhibit divergent intrinsic water-use efficiency along elevational gradients in South American and African tropical forests.Glob. Ecol. Biogeogr.302259–2272. 10.1111/geb.13382
61
NeyretM.BentleyL. P.OliverasI.MarimonB. S.Marimon-JuniorB. H.Almeida De OliveiraE. (2016). Examining variation in the leaf mass per area of dominant species across two contrasting tropical gradients in light of community assembly.Ecol. Evol.65674–5689. 10.1002/ece3.2281
62
PajaresS.BohannanB. J. M. (2016). Ecology of nitrogen fixing, nitrifying, and denitrifying microorganisms in tropical forest soils.Front. Microbiol.7:1045. 10.3389/fmicb.2016.01045
63
PalmaA. C.WinterK.ArandaJ.DallingJ. W.CheesmanA. W.TurnerB. L.et al (2020). Why are tropical conifers disadvantaged in fertile soils? Comparison of Podocarpus guatemalensis with an angiosperm pioneer, Ficus insipida.Tree Physiol.40810–821. 10.1093/treephys/tpaa027
64
PeriP. L.LaddB.PepperD. A.BonserS. P.LaffanS. W.AmelungW. (2012). Carbon (δ13C) and nitrogen (δ15N) stable isotope composition in plant and soil in Southern Patagonia’s native forests.Glob. Change Biol.18311–321. 10.1111/j.1365-2486.2011.02494.x
65
PivovaroffA. L.McdowellN. G.RodriguesT. B.BrodribbT.CernusakL. A.ChoatB.et al (2021). Stability of tropical forest tree carbon-water relations in a rainfall exclusion treatment through shifts in effective water uptake depth.Glob. Change Biol.276454–6466. 10.1111/gcb.15869
66
PoorterH.NiinemetsÜPoorterL.WrightI. J.VillarR. (2009). Causes and consequences of variation in leaf mass per area (LMA): A meta-analysis.New Phytol.182565–588. 10.1111/j.1469-8137.2009.02830.x
67
PoorterH.NiklasK. J.ReichP. B.OleksynJ.PootP.MommerL. (2012). Biomass allocation to leaves, stems and roots: Meta-analyses of interspecific variation and environmental control.New Phytol.19330–50. 10.1111/j.1469-8137.2011.03952.x
68
PrenticeI. C.DongN.GleasonS. M.MaireV.WrightI. J. (2014). Balancing the costs of carbon gain and water transport: Testing a new theoretical framework for plant functional ecology.Ecol. Lett.1782–91. 10.1111/ele.12211
69
PrimackR. B.EllwoodE. R.GallinatA. S.Miller-RushingA. J. (2021). The growing and vital role of botanical gardens in climate change research.New Phytol.231917–932. 10.1111/nph.17410
70
R Core Team (2021). R: A language and environment for statistical computing.Vienna: R Foundation for Statistical Computing.
71
RappJ.SilmanM.ClarkJ.GirardinC.GalianoD.TitoR. (2012). Intra- and interspecific tree growth across a long altitudinal gradient in the Peruvian Andes.Ecology932061–2072. 10.1890/11-1725.1
72
RappJ. M. (2010). Climate control on plant performance across an Andean altitudinal gradient.Winston-Salem, NC: Wake Forest University.
73
ReadQ. D.MoorheadL. C.SwensonN. G.BaileyJ. K.SandersN. J. (2014). Convergent effects of elevation on functional leaf traits within and among species.Funct. Ecol.2837–45. 10.1111/1365-2435.12162
74
RoderickM. L.BerryS. L.SaundersA. R.NobleI. R. (1999). On the relationship between the composition, morphology and function of leaves.Funct. Ecol.13696–710. 10.1046/j.1365-2435.1999.00369.x
75
SahS.BrummeR. (2003). Altitudinal gradients of natural abundance of stable isotopes of nitrogen and carbon in the needles and soil of a pine forest in Nepal.J. For. Sci.4919–26. 10.17221/4673-JFS
76
SalinasN.MalhiY.MeirP.SilmanM.Roman CuestaR.HuamanJ.et al (2011). The sensitivity of tropical leaf litter decomposition to temperature: Results from a large-scale leaf translocation experiment along an elevation gradient in Peruvian forests.New Phytol.189967–977. 10.1111/j.1469-8137.2010.03521.x
77
ScalonM. C.BohnA.CoelhoG. C.MeisterL.AlvesR. D. F.SeccoR. T.et al (2022). Relationship between growth trajectories and functional traits for woody trees in a secondary tropical forest.Front. For. Glob. Change5:754656. 10.3389/ffgc.2022.754656
78
ScottK. D.McintyreC. L.PlayfordJ. (2000). Molecular analyses suggest a need for a significant rearrangement of Rutaceae subfamilies and a minor reassessment of species relationships within Flindersia.Plant System. Evol.22315–27. 10.1007/BF00985324
79
SparksJ. P.EhleringerJ. R. (1997). Leaf carbon isotope discrimination and nitrogen content for riparian trees along elevational transects.Oecologia109362–367. 10.1007/s004420050094
80
TitoR.VasconcelosH. L.FeeleyK. J. (2018). Global climate change increases risk of crop yield losses and food insecurity in the tropical Andes.Glob. Change Biol.24e592–e602. 10.1111/gcb.13959
81
TitoR.VasconcelosH. L.FeeleyK. J. (2020). Mountain ecosystems as natural laboratories for climate change experiments.Front. For. Glob. Change3:38. 10.3389/ffgc.2020.00038
82
Torello RaventosM. (2014). Environmental controls on wood density in tropical forests.Townsville: James Cook University.
83
TurtonS. M.HutchinsonM. F.AccadA.HancockP. E.WebbT. (1999). “Producing fine-scale rainfall climatology surfaces for Queensland’s wet tropics region,” in Geodiversity: Readings in Australian geography at the close of the 20th century. Special Publication Series. 6, edsKesbyJ. A.StanleyJ. M.McLeanR. F.OliveL. J. (Canberra, ACT: School of Geography and Oceanography, University College), 415–428.
84
UngerM.HomeierJ.LeuschnerC. (2012). Effects of soil chemistry on tropical forest biomass and productivity at different elevations in the equatorial Andes.Oecologia170263–274. 10.1007/s00442-012-2295-y
85
ValladaresF.NiinemetsÜ (2008). Shade tolerance, a key plant feature of complex nature and consequences.Annu. Rev. Ecol. Evol. System.39237–257. 10.1146/annurev.ecolsys.39.110707.173506
86
Van De WegM. J.MeirP.GraceJ.RamosG. D. (2012). Photosynthetic parameters, dark respiration and leaf traits in the canopy of a Peruvian tropical montane cloud forest.Oecologia16823–34. 10.1007/s00442-011-2068-z
87
VitousekP. M.FieldC. B.MatsonP. A. (1990). Variation in foliar δ13C in hawaiian metrosideros polymorpha: a case of internal resistance?Oecologia84362–370. 10.1007/BF00329760
88
VitousekP. M.ShearerG.KohlD. H. (1989). Foliar 15N natural abundance in Hawaiian rainforest: Patterns and possible mechanisms.Oecologia78383–388. 10.1007/BF00379113
89
WangH.PrenticeI. C.DavisT. W.KeenanT. F.WrightI. J.PengC. (2017). Photosynthetic responses to altitude: An explanation based on optimality principles.New Phytol.213976–982. 10.1111/nph.14332
90
WangX.JiangY.RenH.YuF.-H.LiM.-H. (2019). Leaf and soil δ15N patterns along elevational gradients at both treelines and shrublines in three different climate zones.Forests10:557. 10.3390/f10070557
91
WestobyM.DanielS.AngelaT.Moles, PeterA.VeskA.et al (2002). Plant ecological strategies: some leading dimensions of variation between species.Ann. Rev. Ecol. System.33125–159. 10.1146/annurev.ecolsys.33.010802.150452
92
WildJ.KopeckýM.MacekM.ŠandaM.JankovecJ.HaaseT. (2019). Climate at ecologically relevant scales: A new temperature and soil moisture logger for long-term microclimate measurement.Agricult. For. Meteorol.26840–47. 10.1016/j.agrformet.2018.12.018
93
WrightI. J.ReichP. B.CornelissenJ. H. C.FalsterD. S.GarnierE.HikosakaK.et al (2005). Assessing the generality of global leaf trait relationships.New Phytol.166485–496. 10.1111/j.1469-8137.2005.01349.x
94
WrightI. J.ReichP. B.WestobyM.AckerlyD. D.BaruchZ.BongersF.et al (2004). The worldwide leaf economics spectrum.Nature428821–827. 10.1038/nature02403
95
WuJ.HongJ.WangX.SunJ.LuX.FanJ.et al (2013). Biomass partitioning and its relationship with the environmental factors at the alpine steppe in Northern Tibet.PLoS One8:e81986. 10.1371/journal.pone.0081986
96
XiaoY.LiuS.TongF.ChenB.KuangY. (2018). Dominant species in subtropical forests could decrease photosynthetic N allocation to carboxylation and bioenergetics and enhance leaf construction costs during forest succession.Front. Plant Sci.9:117. 10.3389/fpls.2018.00117
97
YiX. F.YangY. Q. (2006). Enrichment of stable carbon and nitrogen isotopes of plant populations and plateau pikas along altitudes.J. Anim. Feed Sci.15661–667. 10.22358/jafs/66937/2006
98
ZichF.HylandB.WhiffinT.KerriganR. (2020). Australian tropical rainforest plants, 8th Edn. Available at https://apps.lucidcentral.org/rainforest/(accessed March 1, 2021).
99
ZieglerC.DusengeM. E.NyirambangutseB.ZiberaE.WallinG.UddlingJ. (2020). Contrasting dependencies of photosynthetic capacity on leaf nitrogen in early- and late-successional tropical montane tree species.Front. Plant Sci.11:500479. 10.3389/fpls.2020.500479
100
ZouJ.YuL.HuangZ. (2019). Variation of leaf carbon isotope in plants in different lithological habitats in a Karst Area.Forests10:356. 10.3390/f10040356
Summary
Keywords
elevation gradient, Flindersia, growth temperature, leaf δ13C, leaf δ15N, relative growth rate, root-to-shoot ratio, soil nutrient availability
Citation
Singh Ramesh A, Cheesman AW, Flores-Moreno H, Preece ND, Crayn DM and Cernusak LA (2023) Temperature, nutrient availability, and species traits interact to shape elevation responses of Australian tropical trees. Front. For. Glob. Change 6:1089167. doi: 10.3389/ffgc.2023.1089167
Received
04 November 2022
Accepted
04 January 2023
Published
19 January 2023
Volume
6 - 2023
Edited by
Lucy Penn Kerhoulas, Cal Poly Humboldt, United States
Reviewed by
Kelsey Bryant, University of Idaho, United States; John T. Van Stan, Cleveland State University, United States
Updates
Copyright
© 2023 Singh Ramesh, Cheesman, Flores-Moreno, Preece, Crayn and Cernusak.
This is an open-access article distributed under the terms of the Creative Commons Attribution License (CC BY). The use, distribution or reproduction in other forums is permitted, provided the original author(s) and the copyright owner(s) are credited and that the original publication in this journal is cited, in accordance with accepted academic practice. No use, distribution or reproduction is permitted which does not comply with these terms.
*Correspondence: Arun Singh Ramesh, arun.singhramesh@my.jcu.edu.au
This article was submitted to Forest Ecophysiology, a section of the journal Frontiers in Forests and Global Change
Disclaimer
All claims expressed in this article are solely those of the authors and do not necessarily represent those of their affiliated organizations, or those of the publisher, the editors and the reviewers. Any product that may be evaluated in this article or claim that may be made by its manufacturer is not guaranteed or endorsed by the publisher.