 Ingeborg Callesen
 Marjo Palviainen
 Kęstutis Armolaitis
 Charlotte Rasmussen
 O. Janne Kjønaas
- 1Department of Geosciences and Natural Resource Management, University of Copenhagen, Frederiksberg, Denmark
- 2Department of Forest Sciences, University of Helsinki, Helsinki, Finland
- 3Department of Silviculture and Ecology, Institute of Forestry, Lithuanian Research Center for Agriculture and Forestry (LAMMC), Girionys, Lithuania
- 4Department of Geoscience, Aarhus University, Aarhus, Denmark
- 5Department of Forest and Climate, Norwegian Institute of Bioeconomy Research (NIBIO), Ås, Norway
Purpose: Laser diffraction (LD) for determination of particle size distribution (PSD) of the fine earth fraction appeared in the 1990s, partly substituting the Sieving and Sedimentation Method (SSM). Whereas previous comparison between the two methods predominantly encompasses agricultural soils, less attention has been given to forest soils, including pre-treatment requirements related to their highly variable contents of carbon and Alox+ Feox. In this small collaborative learning study we compared (1) national SSM results with one type/protocol of LD analysis (Coulter), (2) LD measurements performed on three different LD instruments / laboratories, and (3) the replication error for LD Coulter analysis of predominantly sandy and loamy forest soils.
Methods: We used forest soil samples from Denmark, Norway and Lithuania and their respective national SSM protocols / results. LD analyses were performed on Malvern Mastersizer 2000, Sympatec HELOS version 1999, and Coulter LS230, located at University of Copenhagen, Aarhus University and Helsinki University, respectively. The protocols differed between laboratories, including the use of external ultrasonication prior to LD analysis.
Results: The clay and silt fractions content (<20 μm) from the LD analysis were not comparable with SSM results, with differences ranging from −0.5 to 22.3 percentage points (pp) for clay. Preliminary results from loamy samples with spodic material suggested inconsistent effects of external ultrasonication to disperse aggregates. The comparison between the three LD instruments showed a range in the clay and silt fractions content of 1.9–5.3 and 6.2–8.1 pp, respectively. Differences may be related to the instruments, protocols, and content of a given particle size fraction. The replication error of the Coulter LD protocol was found to be <3 pp in sandy soils, but up to 10 pp in loamy soils.
Conclusion: Differences in the clay fraction results partly affected the classification of soil types. The fast replication of the LD analysis enables more quality control of results. The pedological evaluation of non-silicate constituents and optional pre-treatment steps (e.g., soil organic matter or sesquioxides) remains the same for LD and SSM. For comparison of results, detailed descriptions of the analytical protocol including pre-treatments are needed irrespective of instrument and theoretical approach.
1. Introduction
Soil texture is a key soil physical property for soil quality, and particle size distributions (PSDs) are used in modeling studies as an input to pedotransfer functions (PTF) for the prediction of soil properties. In forest soils, there is a close relationship between soil carbon (C) stocks and soil texture (Callesen et al., 2003), and using stratified data on soil texture class has been recommended for calibrating carbon concentration when estimating soil C stocks in the absence of data on bulk density (Vanguelova et al., 2016). Additionally, a keen interest in separating clay and silt particles owes to the importance of the clay content for soil properties such as water retention, buffer capacity, surface reactions and soil fertility (where also clay mineralogy information is crucial). Accurate and precise determination of clay and silt (in general <20 μm) is therefore of special interest for soil quality assessments (Schoenholtz et al., 2000).
Soil texture is quantified by a PSD of the fine earth fraction (<2 mm) and is often translated into a texture class using defined separates of clay (<2 μm), silt from 2 to 20 μm (International Society of Soil Sciences), 50 μm (USDA) or 63 μm (The World Reference Base [WRB], 2015) and sand (from 20, 50, or 63 μm to 2 mm). Texture class is determined from a texture triangle, e.g., a “loamy sand” class, and a variety of national and international systems exist (Weil, 2016; Moeys, 2018). The texture classes are in some triangles divided based on 5% increments, or even less, on the axis for clay or sand content, e.g., the French GEPPA and the german BK (1994) (Moeys, 2018).
The common procedure for soil texture analysis since the 1950s has been pre-treatment followed by standardized sedimentation and sieving methods (SSM) (Day, 1950; Gee and Or, 2002), where pre-treatment methods may include removal of humus and carbonate by strongly oxidizing and acid agents, as well as particle dispersion methods using chemical dispersing agents. The pre-treatment protocols have, however, varied depending on the sectors and the scientific disciplines using the PSDs (Gee and Or, 2002; Hartmann, 2007). A range of dispersing agents and mechanical methods are used to obtain full dispersion of aggregated particles (Gee and Or, 2002). The choice of pre-treatment methods depends on an initial evaluation of the sample contents of salts, sesquioxides, carbonates, soil organic matter (SOM) and soil aggregates. Inappropriate disintegration of particles or insufficient dispersion can affect the PSD results greatly. A remarkable variation in test results between laboratories are observed in ring-tests involving unknown test samples (Jakovljevic, 2021). The reason for this variation is unclear, and may potentially include effects of diverging pre-treatment procedures, instrument calibrations or laboratory environment.
Pre-treatments to remove certain constituents can be time consuming, lasting up to a week, and may involve several steps of washing. The many steps entail an increasing risk of quantitative losses of soil material as well as unintended destruction of particles by mechanical force, such as brittle mica or non-crystalline iron oxides, e.g., found in soils with signs of chemical weathering (soil horizon suffix “s” and “w”). Pre-treatment of the soil sample is, however, required. For SSM analysis, it is assumed that separation of particles by their size in the gravitational sedimentation is in accordance with Stokes’ law (ISO 11277, 1998, 2020), which is based on a particle density of 2.65 g cm–3. This is valid for silicates, but is not valid for calcium carbonate, SOM, or Fe-rich heavy minerals like mica (Weil, 2016). The option of pre-treatment for calcium carbonate and SOM removal depends on an expert judgment of the content (Gee and Or, 2002). If the carbonate content is high, abstaining from removal may be sensible, as the remaining material would not give a representative characterization of the soil texture. To avoid the SOM removal pre-treatment step, high thresholds for SOM content may be used if less accurate results are acceptable. However, the threshold often varies, e.g., from being higher than 5% carbon (C) (Breuning Madsen et al., 1992), 5% SOM (Borggaard et al., 1988; Ministry of Agriculture, 1994), 3% SOM (ISO 11277, 1998, 2020), or 1.5% SOM (Pario, Meter group, Germany). Some protocols may even include this pre-treatment step irrespective of SOM content (Krogstad et al., 1991).
Additionally, pre-treatment should secure adequate dispersion of aggregates. This is of vital importance, since particles can be tied strongly together in organo-mineral complexes, which may require reductive dissolution using sodium dithionite (Na2S2O4) to remove the iron and H2O2 pre-treatment to remove SOM (Gee and Or, 2002). Variations in this pre-treatment step includes physical dispersion methods (e.g., overnight shaking, soaking and high-speed mixing, or ultrasonic treatments) combined with different chemical dispersing agents. End-over-end shaking with a dispersing agent, e.g., Na-pyrophosphate, to overcome flocculation is a common approach. The combination of mechanical energy, phosphate and sodium ions cause aggregated clay particles to separate. This will ideally yield a complete dispersion into single soil particles in suspension long enough for the sedimentation measurement to take place (Gee and Or, 2002), although the dispersion may be sample-dependent and not always successful (e.g., Shein, 2009; Polakowski et al., 2023).
Soil texture analysis involves a variety of considerations and approaches (Hartmann, 2007). SSM based hydrometer and pipette sedimentation methods require calibration of the methods including the apparatus itself and stable laboratory conditions with respect to atmospheric pressure and temperature during the measurement, as well as undisturbed settling conditions. To control temperature during the measurement period, cylinders can be placed in a thermostatic bath. In the simplest form of the sieving and hydrometer method, coarse sand, clay and silt fractions are determined, whereas the fine sand fraction (20–200 μm) is calculated from the measured fractions (clay <2 μm, silt 2–20 μm and coarse sand 200–2000 μm; Borggaard et al., 1988), and no control of mass preservation can thus be made. The SSM is biased if the hydrometer is not well calibrated (Day, 1950), and has limitations related to a set of theoretical assumptions (i.e. Stokes’ law and the concept of an equivalent particle diameter for the non-spherical clay particles). To obtain reproducible results, dedicated laboratory space, personnel and pedological knowledge is required.
The commonly used laser diffraction (LD) provides a highly resolved PSD, however, new problems arise related to factors such as optical parameters as well as representation of all size fractions in the commonly very small sample sizes that are being used. These add to the assumptions in SSM on, e.g., spherical particle shape, which need to be considered and ultimately solved. LD is a rapid analytical method, however, several studies warn that results differ from sieving and sedimentation results (Konert and Vandenberghe, 1997; Fisher et al., 2017; Bieganowski et al., 2018; Faé et al., 2019). Especially in fine-textured soil samples, the colloid-sized fractions measured by LD analysis are not comparable to those obtained with sedimentation and sieving methods when translated into the traditional particle size limits of clay, silt and sand (Buurman et al., 2001; Fisher et al., 2017). Specifically, the particle sizes with an upper equivalent diameter limit of 4–9 μm on a LD derived PSD curve has been found to be equivalent to the 2 μm separate in the SSM defined to separate clay and silt (Konert and Vandenberghe, 1997; Vandecasteele and De Vos, 2001; Fisher et al., 2017). Since clay has a strong influence on soil properties and classification, factors and pre-treatment related to the clay fraction are prominent in relation to LD analysis. The wide range of equivalent diameters for clay points to biases that may originate from methods, apparatus, sample types and algorithms for signal translation to the PSD. In LD devices, ultrasonication (US) is often a built-in feature with adjustable energy applied to the sample. Due to the small sample size required for LD analysis, US can be useful.
Generally, sample pre-treatments prior to SSM and LD analysis may be optional for a given operational procedure, depending on the intended use of the data. The lack of a strict protocol for soil texture analysis, with optional steps, may result in a method description that excludes key information on pre-treatment procedures in the reporting of the result. Further, absence of information on sources of error and bias makes comparisons between studies difficult. Underreporting of operational procedures and uncertainties are widespread for, e.g., legacy soil texture data in databases. Although the sources of error and uncertainties of the two very different SSM and LDM methods with different assumptions are quite well known (e.g., Bieganowski et al., 2018), limited focus has so far been given to problems related to forest soils. Thus, additional knowledge is needed to enable comparison of PSD results obtained by different protocols and methods. In the current paper, we applied a collaborative learning process approach to compare results from predominantly boreal and nemoral acid forest soils, to identify potential limitations and problems by use of PSD methods and instruments within a Nordic-Baltic forest soil research network, SNS-CARES III, 2016-2020. Following our purpose and aim, the objectives of our study were (Table 1).
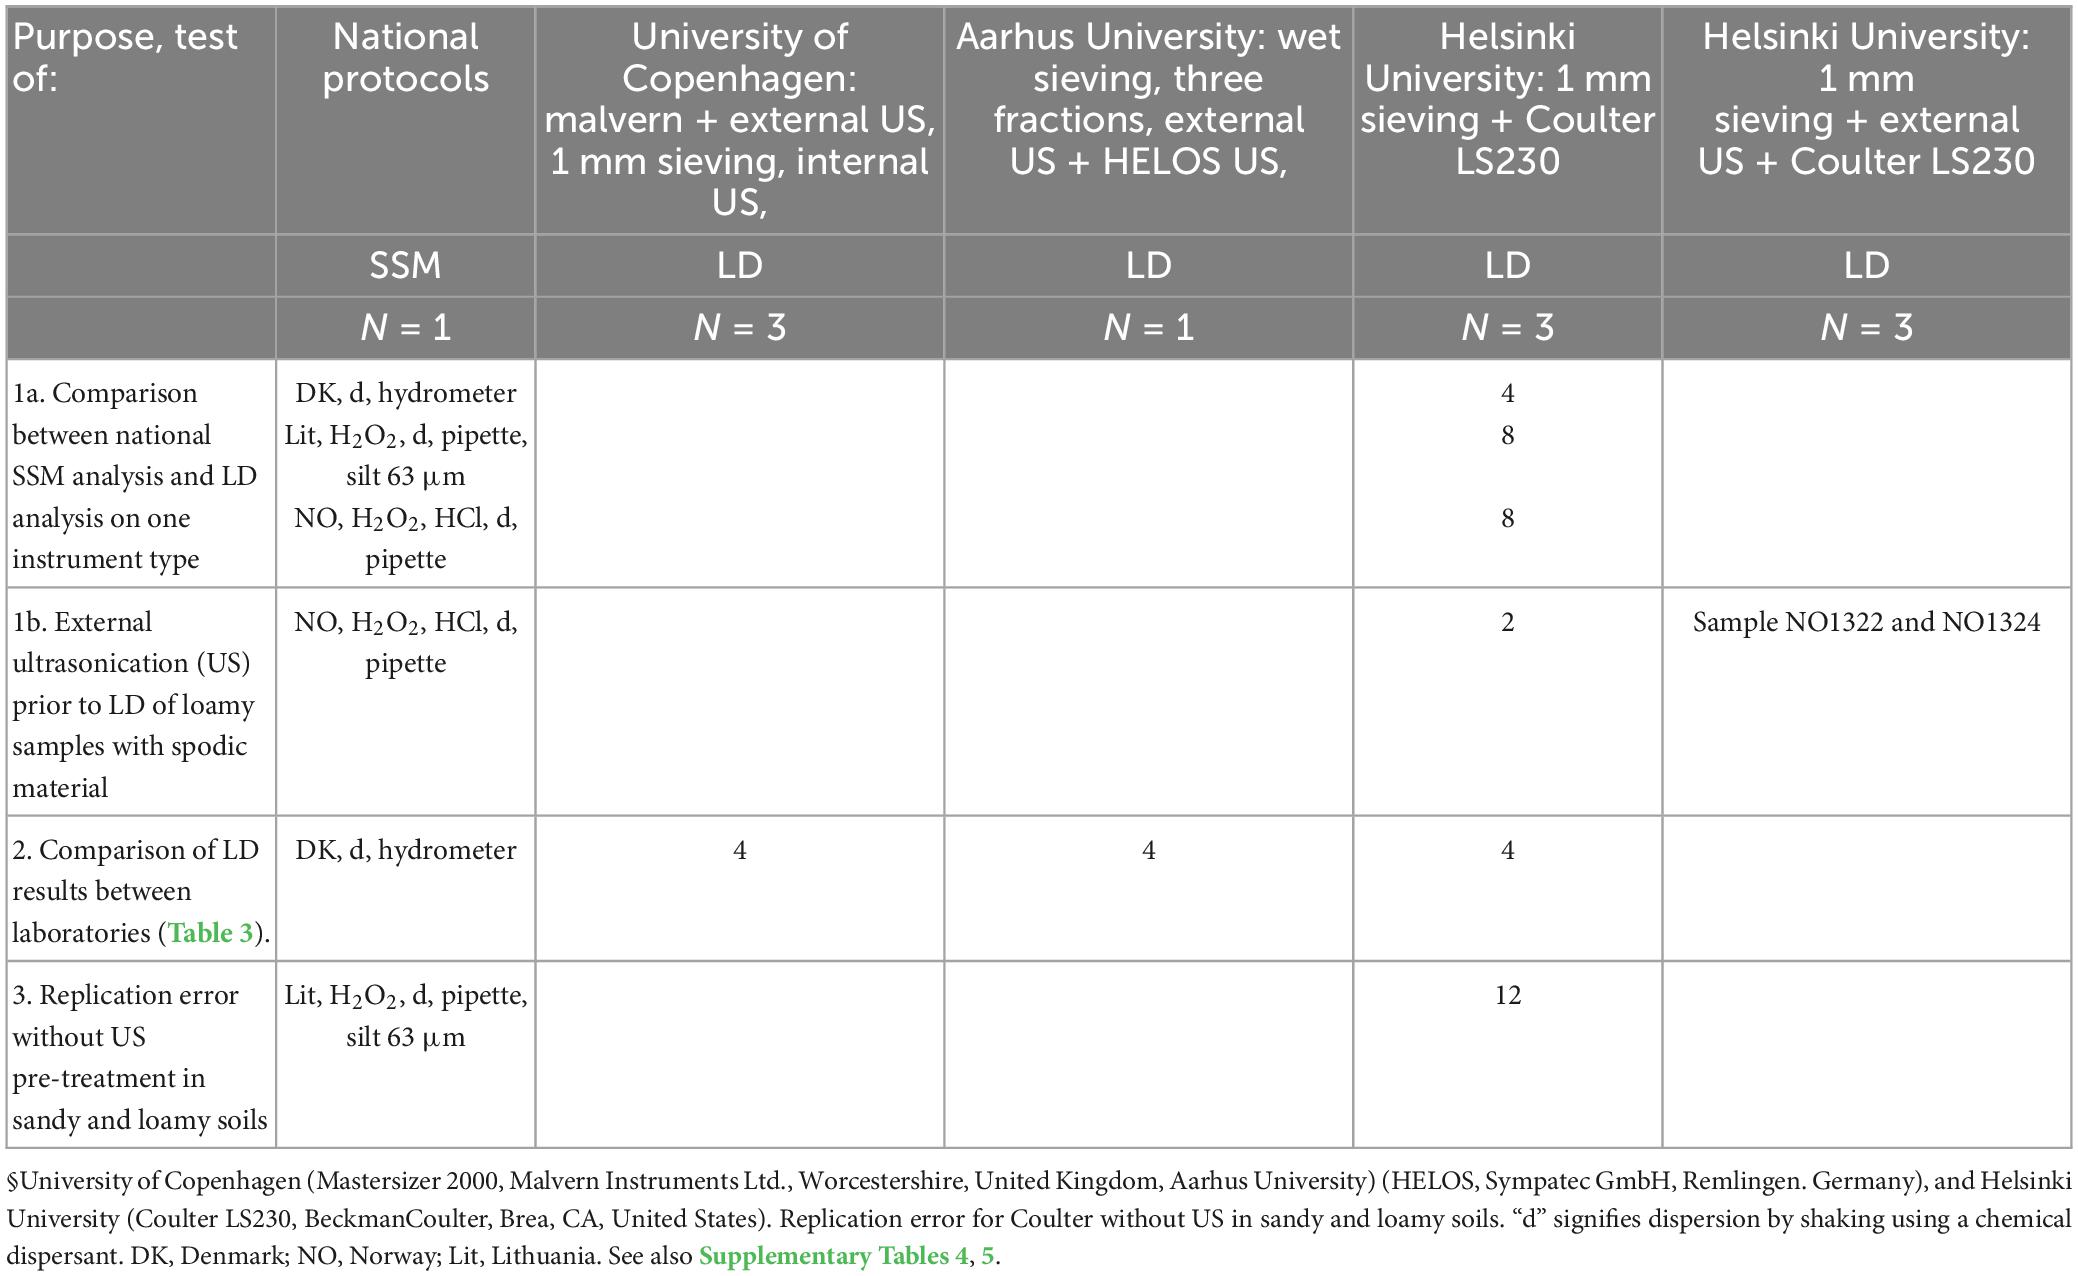
Table 1. Sample type, number of samples and applied methods for (1a) comparisons between national sieving and sedimentation (SSM) results and laser diffraction (LD) results from the Coulter LS230 (1 mm sieved samples), (1b) NO samples comparing SSM and LD with/without external ultrasonication (US) treatment; (2) Comparison of three LD instruments§ and laboratories, and (3).
1. To compare the analytical results from SSM and one type of LD analytical approach (Coulter LS230) on forest soil samples which contain highly variable contents of C and Alox + Feox (20 samples), including additional US pre-treatment from an external ultrasonicator (2 samples).
2. To test LD texture analysis performed at different instruments and laboratories by comparing the instruments Malvern Mastersizer 2000, Sympatec HELOS version 1999 and Coulter LS230 at the three laboratories University of Copenhagen, Aarhus University and Helsinki University, respectively, as well a comparison with one SSM approach (4 samples).
3. To study the replication error for LD analysis (Coulter LS230) without US in predominantly sandy and loamy forest soil samples (12 samples).
2. Materials and methods
The study followed the protocols and practices developed by the institutions for the respective instruments for soil samples. The study is therefore not a formal design applicable for quantifying reproducibility and repeatability. Instead, we chose to study PSDs of soil samples with a variety of forest soil properties to make a screening of potential problems that a formal study of reproducibility would need to take into account by using the existing protocols.
2.1. Soil samples
The study used three sets of forest soil samples from Denmark (DK), Norway (NO), and Lithuania (Lit) listed in Table 1 and Supplementary Tables 1–3. All samples were non-calcareous, based on evaluation of the pH range (Supplementary Table 1). The samples from DK and Lit were sandy and loamy and had low organic carbon contents (0.1–0.4% C). The samples from NO were sandy and loamy, had C contents in the range 0.4 to 7.3% as well as organically bound oxalate extractable Alox + Feox contents in the range 0.2–8%.
2.2. Sieving and sedimentation method (SSM)
The samples from DK were analyzed by hydrometer and sieving following the description in Annex 1 (Ministry of Agriculture, 1994). The samples from Lit were analyzed by SSM following Annex 1 (ISO 11277, 1998, 2020) whereas the NO samples were analyzed according to the method given by Krogstad et al. (1991) outlined in Annex 1. Removal of sesquioxides by reductive dissolution was not carried out on any of the samples. The sample volumes were between 20 and 100 g and a pipette or a hydrometer was used (Table 1 and Supplementary Table 5). In short, the pre-treatments in SSM were mechanical dispersion by shaking (at various speeds and durations, see Annex 1) using a chemical dispersing agent (Annex 1). The NO samples were subjected to an additional hydrochloric acid application for disaggregation (and potential removal of carbonates), and were analyzed for total C (Elementar Vario EL, USA equipped with a TCD detector), dry matter (105°C) and oxalate extractable Fe and Al (Ogner et al., 1999) (data inserted in Figure 4). The soil texture classification of NO and Lit samples used the USDA texture triangle (Soil Survey Staff, 2010; The World Reference Base [WRB], 2015) and was based on the SSM results given in the Table 3 and Supplementary Tables 2, 3. Danish samples were classified into texture class according to ISSS (Verheye and Ameryckx, 1984).
2.3. Laser diffraction (LD) analysis
2.3.1. General analytical principles
In laser diffraction the laser radiation passes through a spatial filter and a projection lens to form a beam of light. The beam passes through the sample where particles suspended in liquid scatter the incident light in characteristic patterns that depend on their sizes. Fourier optics collect the diffracted light and focus it onto detectors placed at different scattering angles. A diffraction pattern is the scattered light intensity as a function of scattering angle. The Fourier lens forms an image of the entire diffraction pattern of each particle and the image is centered on the Fourier plane. The individual diffraction patterns from the many moving particles in the sample cell are therefore superimposed, creating a single composite diffraction pattern that reflects the contributions from all the particles in the sample. The composite diffraction pattern is measured by a number of detectors (Table 2). These are placed at angles approximately 35° from the optical axis. The composite diffraction pattern is then decomposed into a number of diffraction patterns, one for each size class, and the relative amplitude (light intensity per unit area) of each pattern is used to measure the relative volume of particles of a given size. This computation is based on either the Fraunhofer or Mie model of light scattering by particles (ISO 13320, 2009).
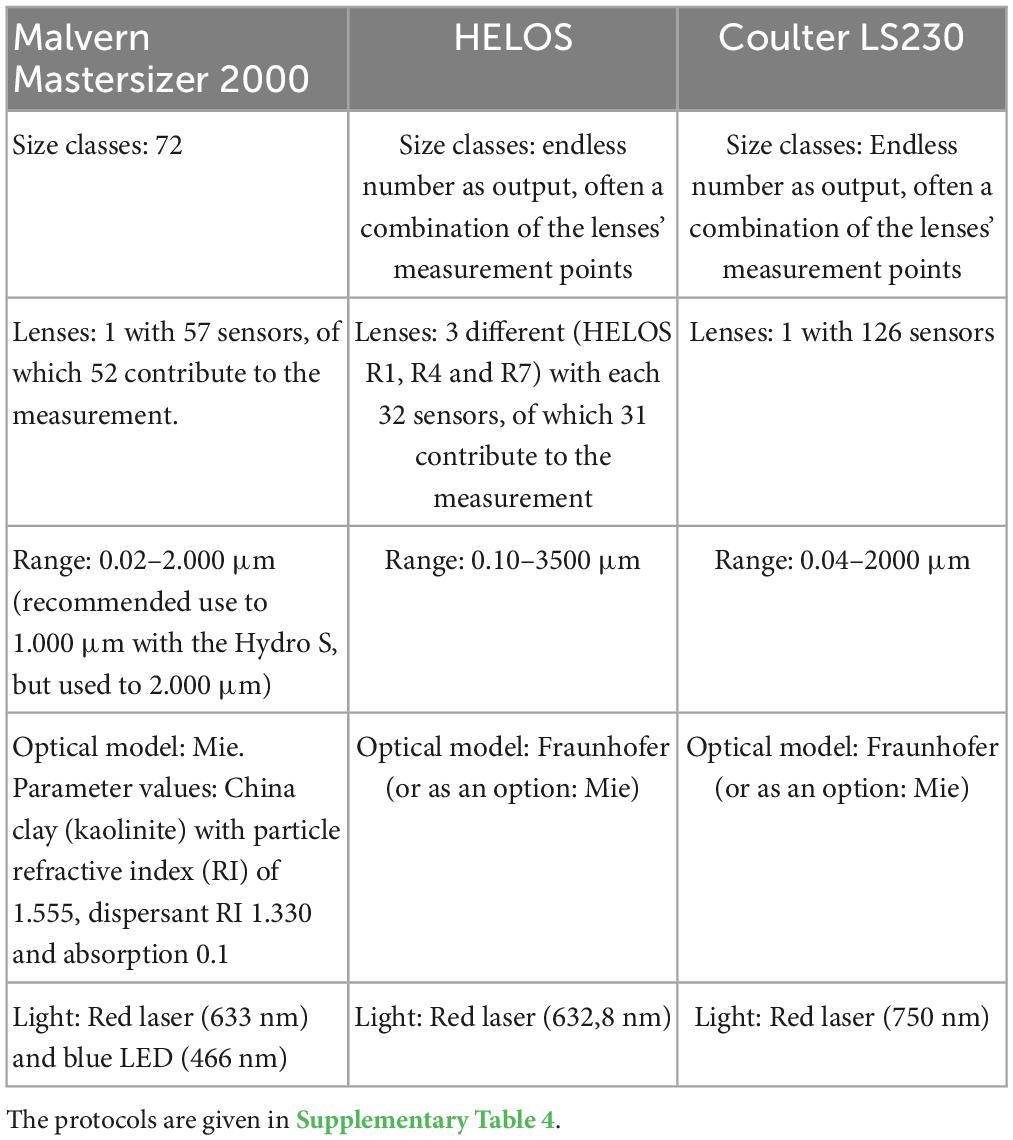
Table 2. Characteristics of the laser diffraction (LD) instruments used at University of Copenhagen (Mastersizer 2000, Malvern Instruments Ltd., Worcestershire, United Kingdom), Aarhus University (HELOS, Sympatec GmbH, Remlingen, Germany), and Helsinki University (Coulter LS230, BeckmanCoulter, Brea, CA, USA), respectively.
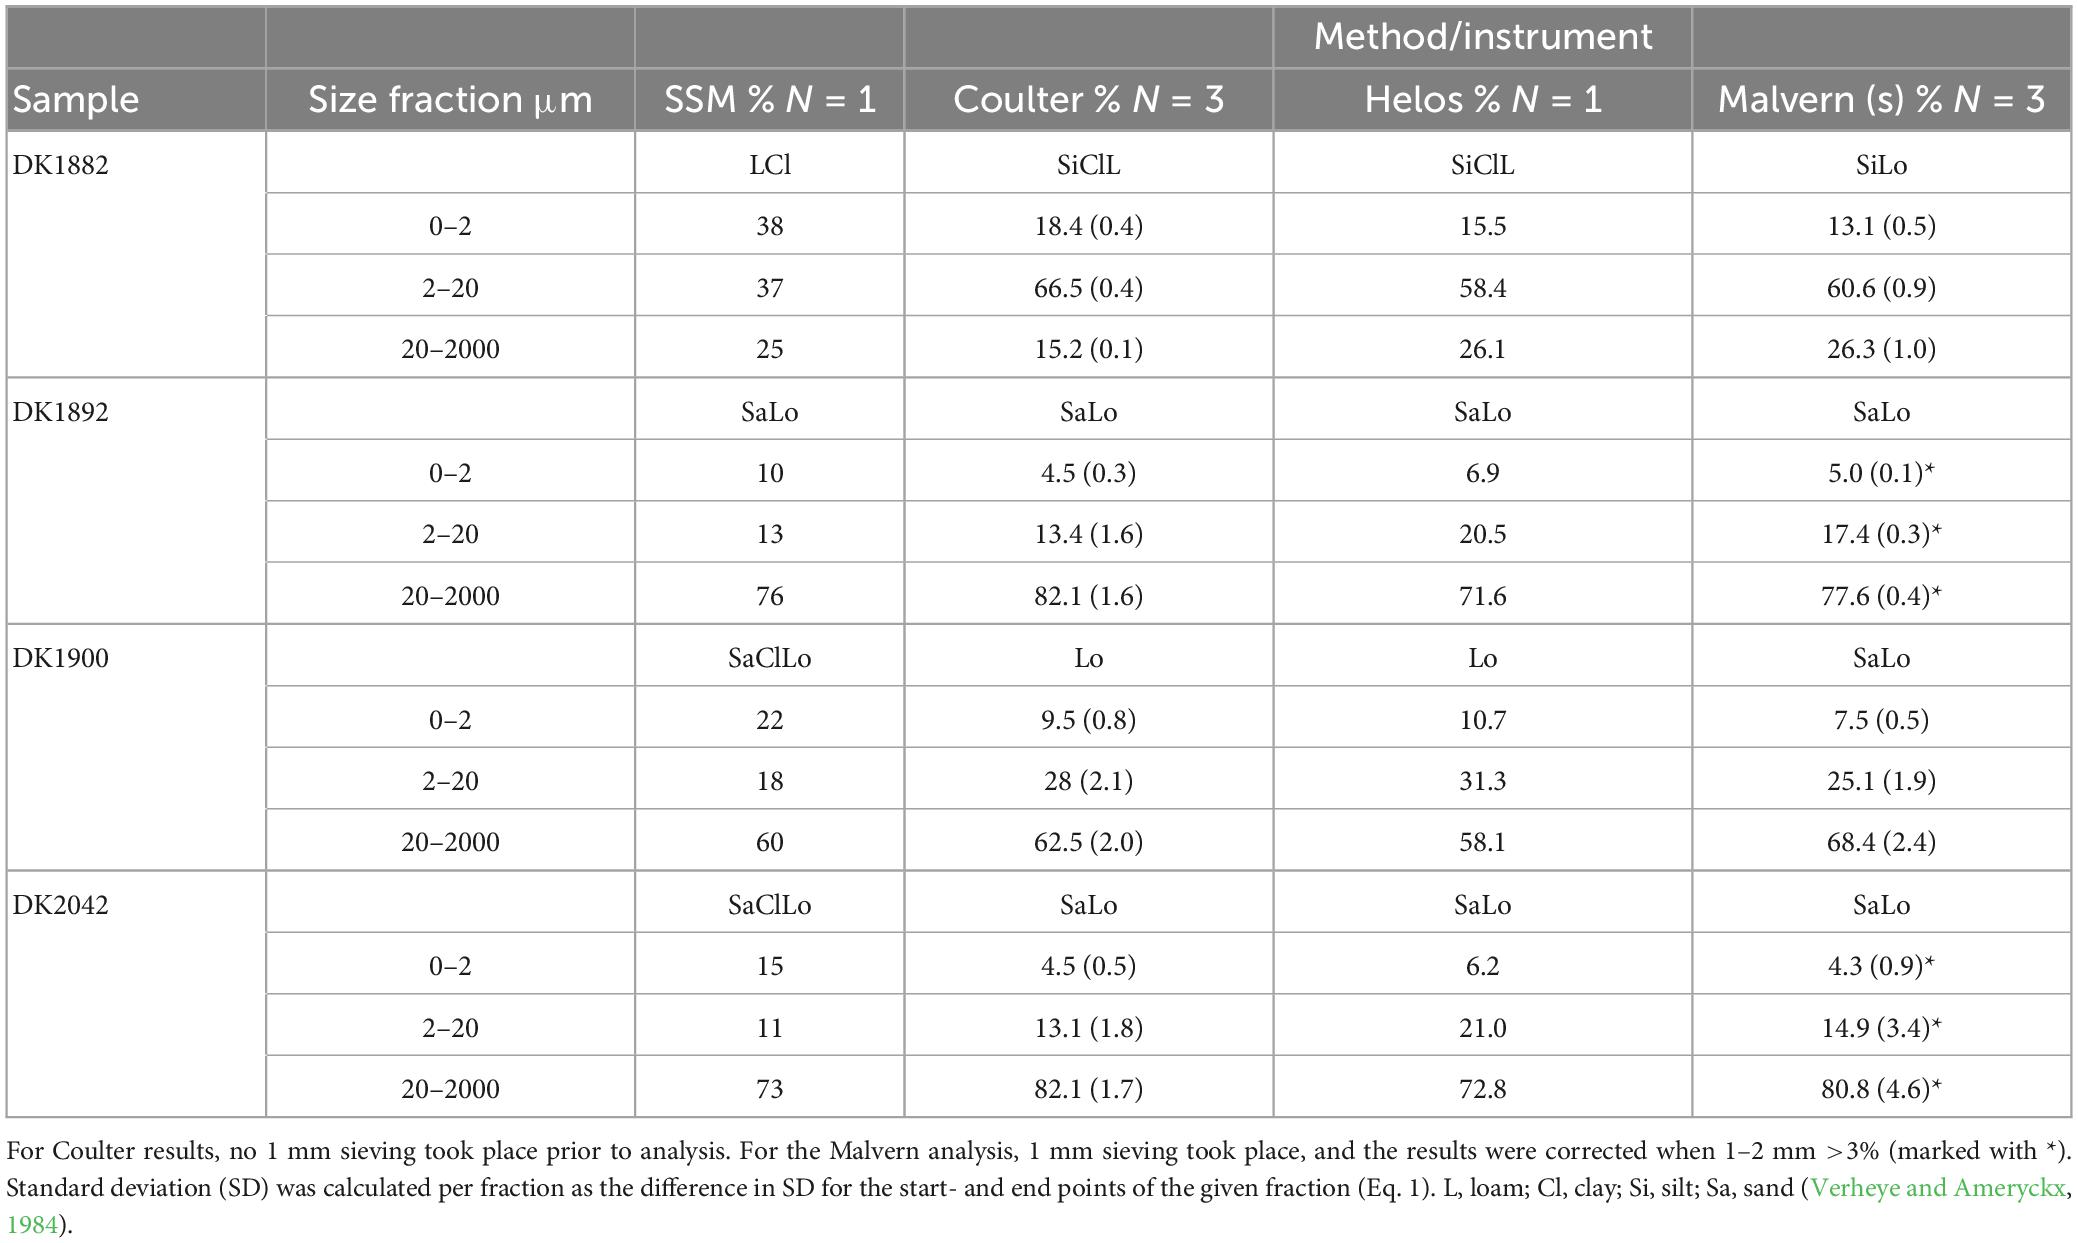
Table 3. Relative content of particle size fractions (%) obtained from soil texture analysis by use of sieving and sedimentation method (SSM) and three different laser diffraction (LD) instruments.
2.3.2. Study design
The comparison between the LD and the SSM analyses (1a, Table 1) was based on the SSM following the respective laboratory protocols as described above and in Annex 1, and LD analysis performed on the Coulter LS230 instrument at Helsinki University. The setup for the LD comparison (2, Table 1) was based on LD measurements on the DK samples performed at three different laboratories, namely University of Copenhagen (UCPH), Aarhus University (AU) and Helsinki University (HU) with the following LD instruments: Malvern Mastersizer 2000, Sympatec HELOS version 1999, and Coulter LS230, respectively (Table 2) and using their respective laboratory protocols. The instruments had been in operation for 10–20 years. To compare the replication error for LD Coulter LS230 analysis (3, Table 1), we used 12 samples from Lit, consisting of predominantly sandy and loamy forest soil, which were analyzed without US treatment (Table 2 and Supplementary Table 4).
Pre-treatment prior to LD analysis consisted of US with a duration of 2 min at full effect, except for Helsinki University (Coulter LS230) where no US was used in the LD comparison. The pre-treatment step to remove SOM was not performed on any of the samples for any LD measurement. The samples were generally analyzed in triplicate, and each measurement was repeated between three to five times on each instrument. The standard deviation of each sample measured in triplicate was calculated for the PSDs up to the diameter given at the x-axis (Figures 1-4), and for the individual fractions following the rule for calculating the standard deviation of differences between stochastic variables:
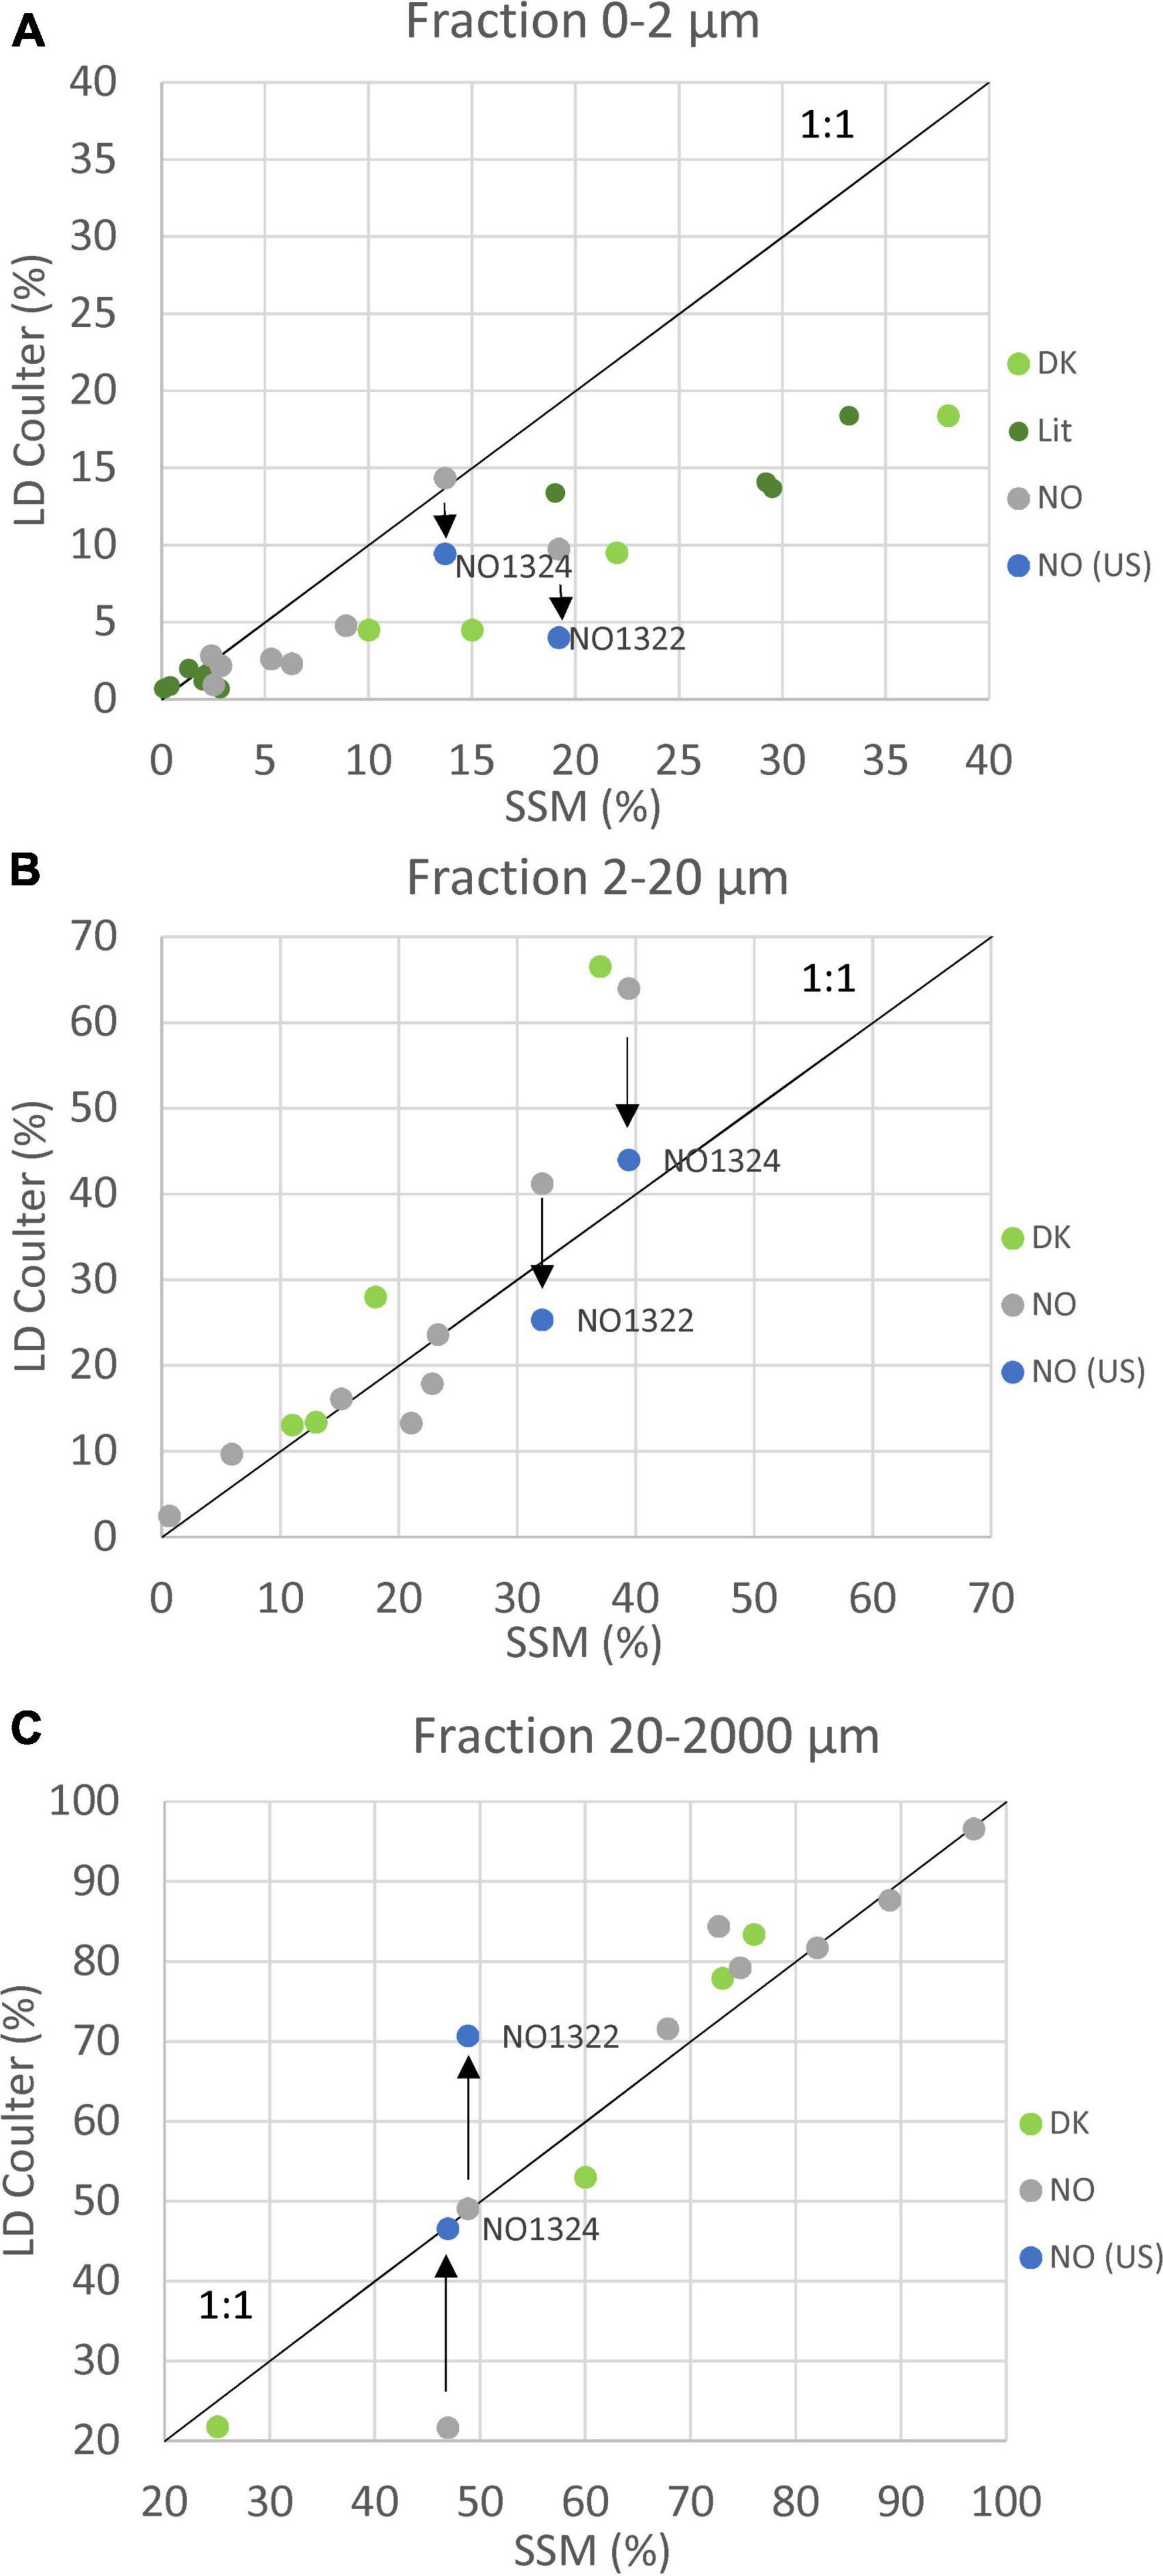
Figure 1. Comparison of the content of particle fractions according to the international society of soil sciences (continued as International Union of Soil Sciences, IUSS): (A) clay (0–2 μm), (B) silt (2–20 μm), and (C) sand (20–2000 μm). Samples from Lithuania were analyzed according to World Reference Base (2015) with silt fraction (2–63 μm). SSM data for silt (B) and sand (C) were thus not available in the ISSS system for the Lit samples. Black arrows indicate changes following external ultrasonication of sample NO1322 and NO1324.
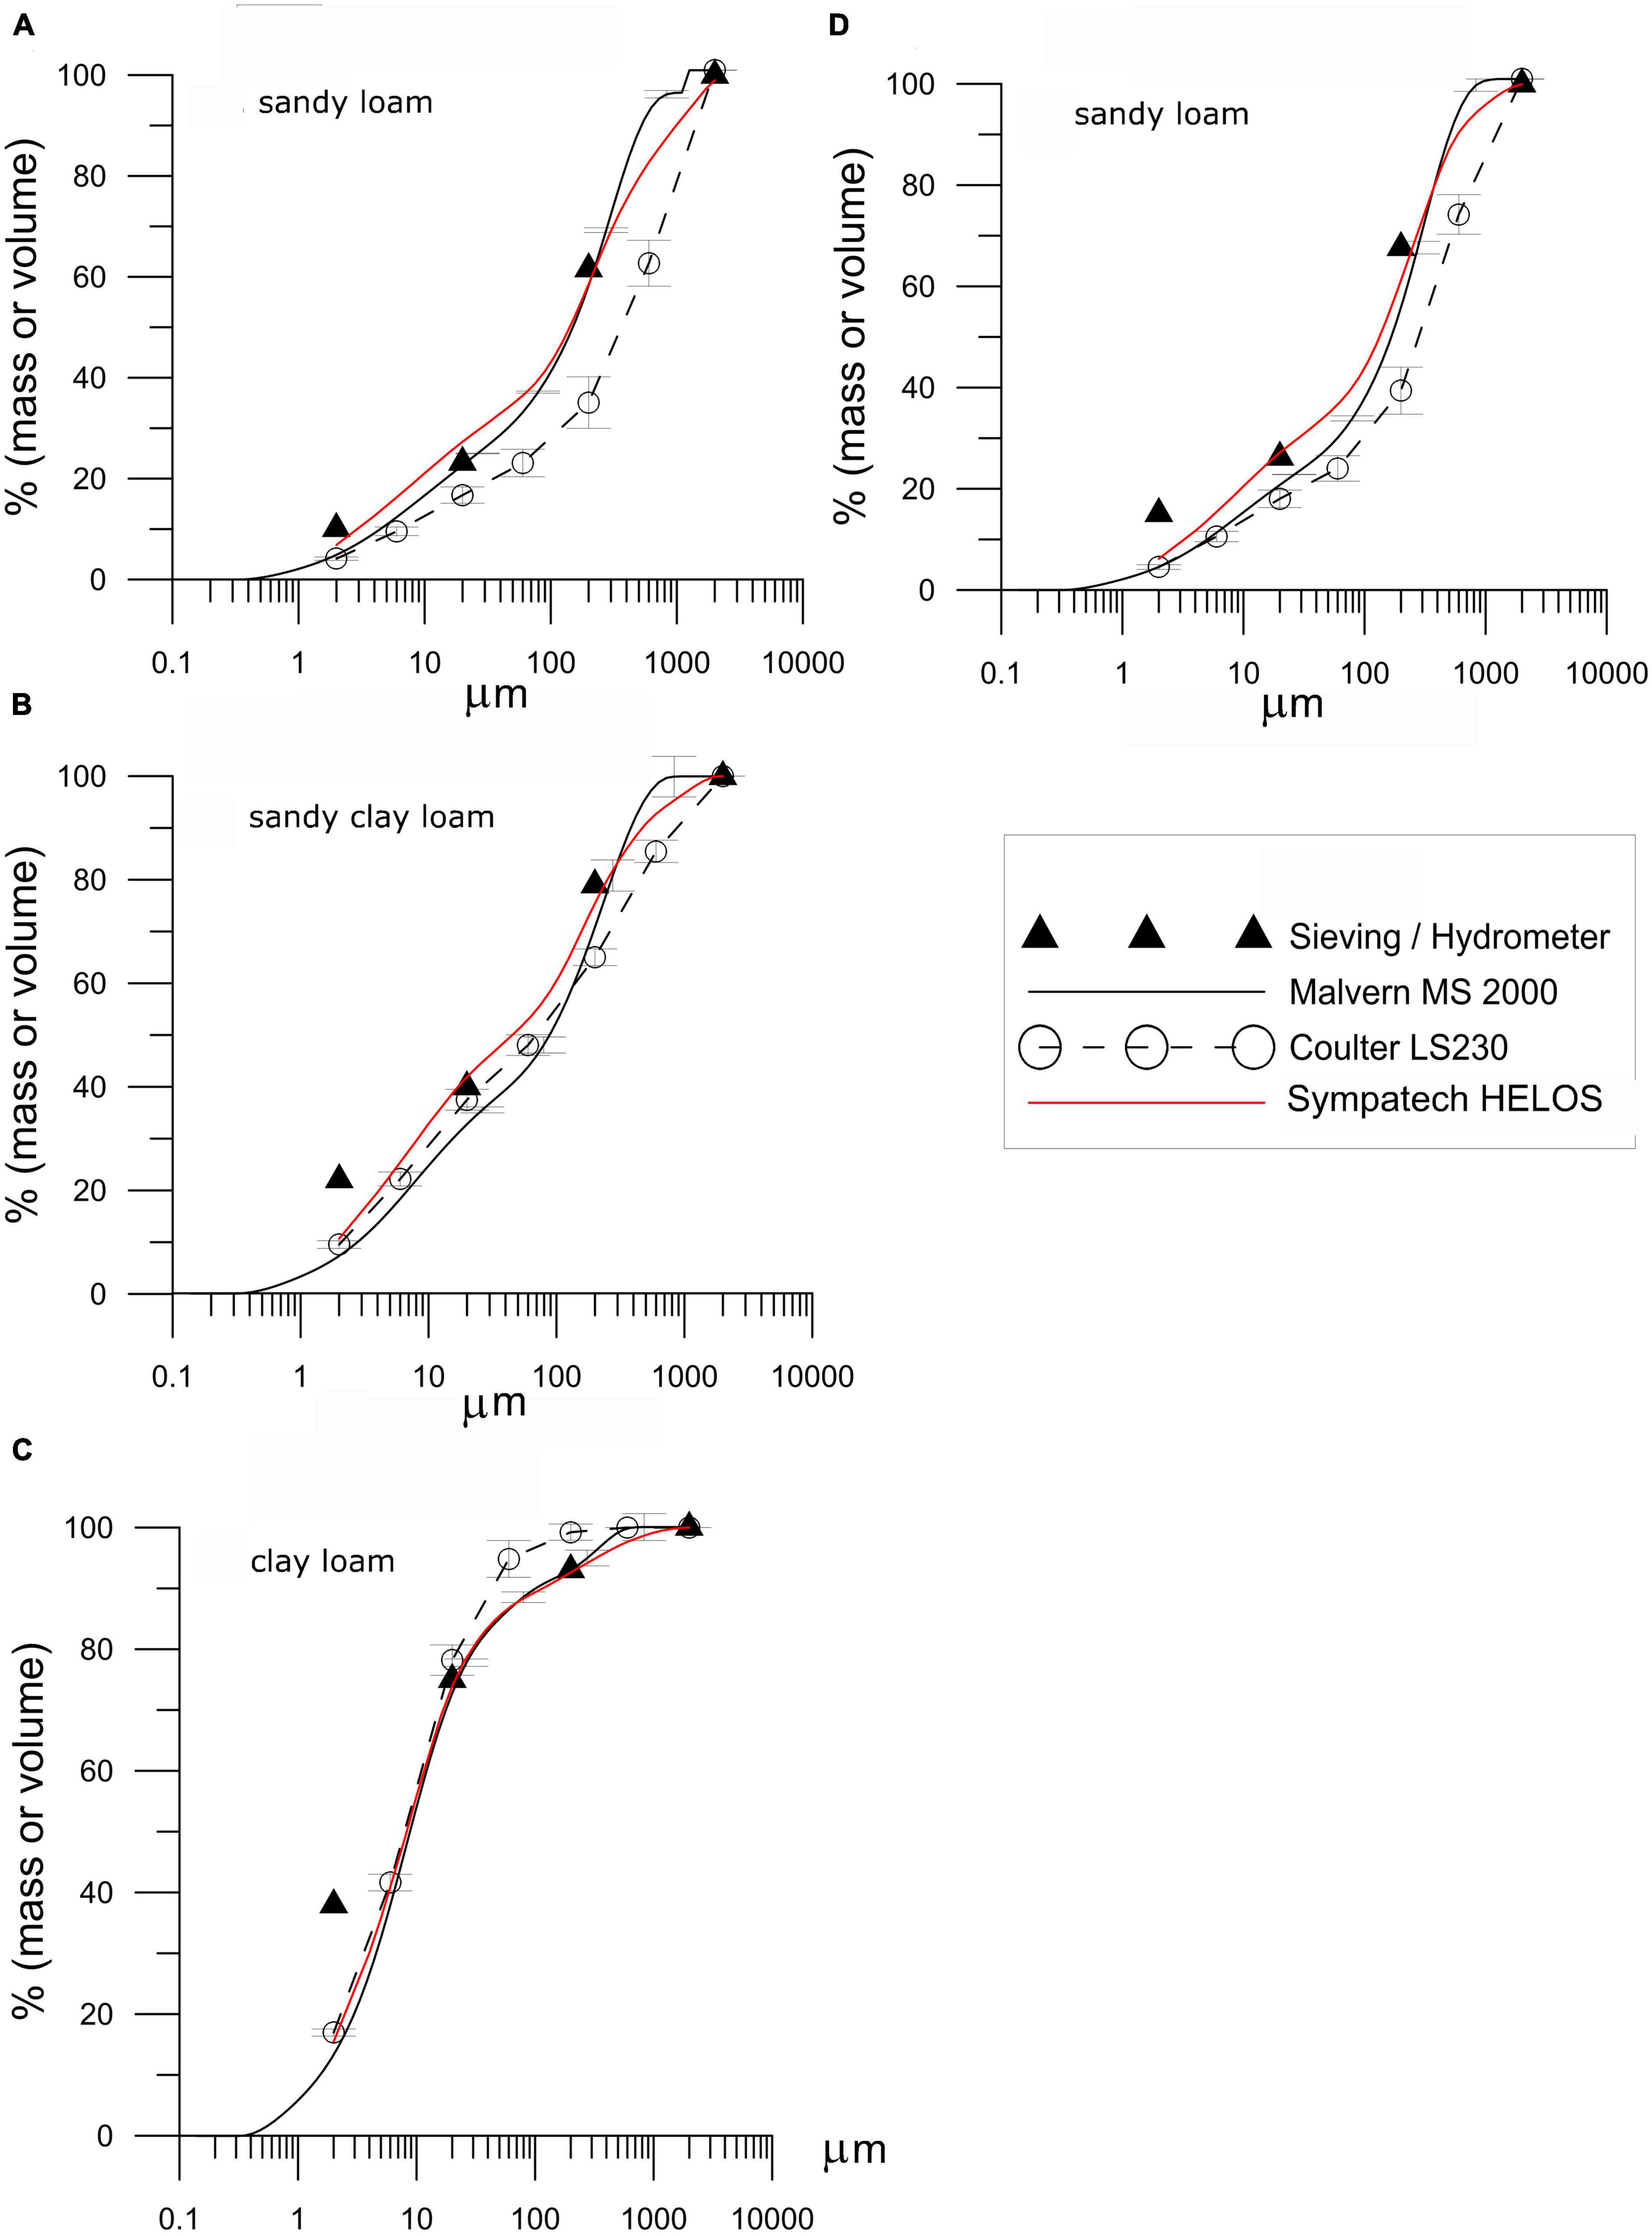
Figure 2. Cumulative content of fractions of fine earth particles vs. particle size produced by three different laser diffraction instruments (LD) (Table 3) and by sieving and sedimentation method (SSM; hydrometer or pipette, see Table 1). Each LD Coulter and Malvern point is the mean of three samples (N = 3) and error bars are 1 SD for the fraction up to the given diameter. (A) DK1892, (B) DK1900, (C) DK1882, (D) DK2042.
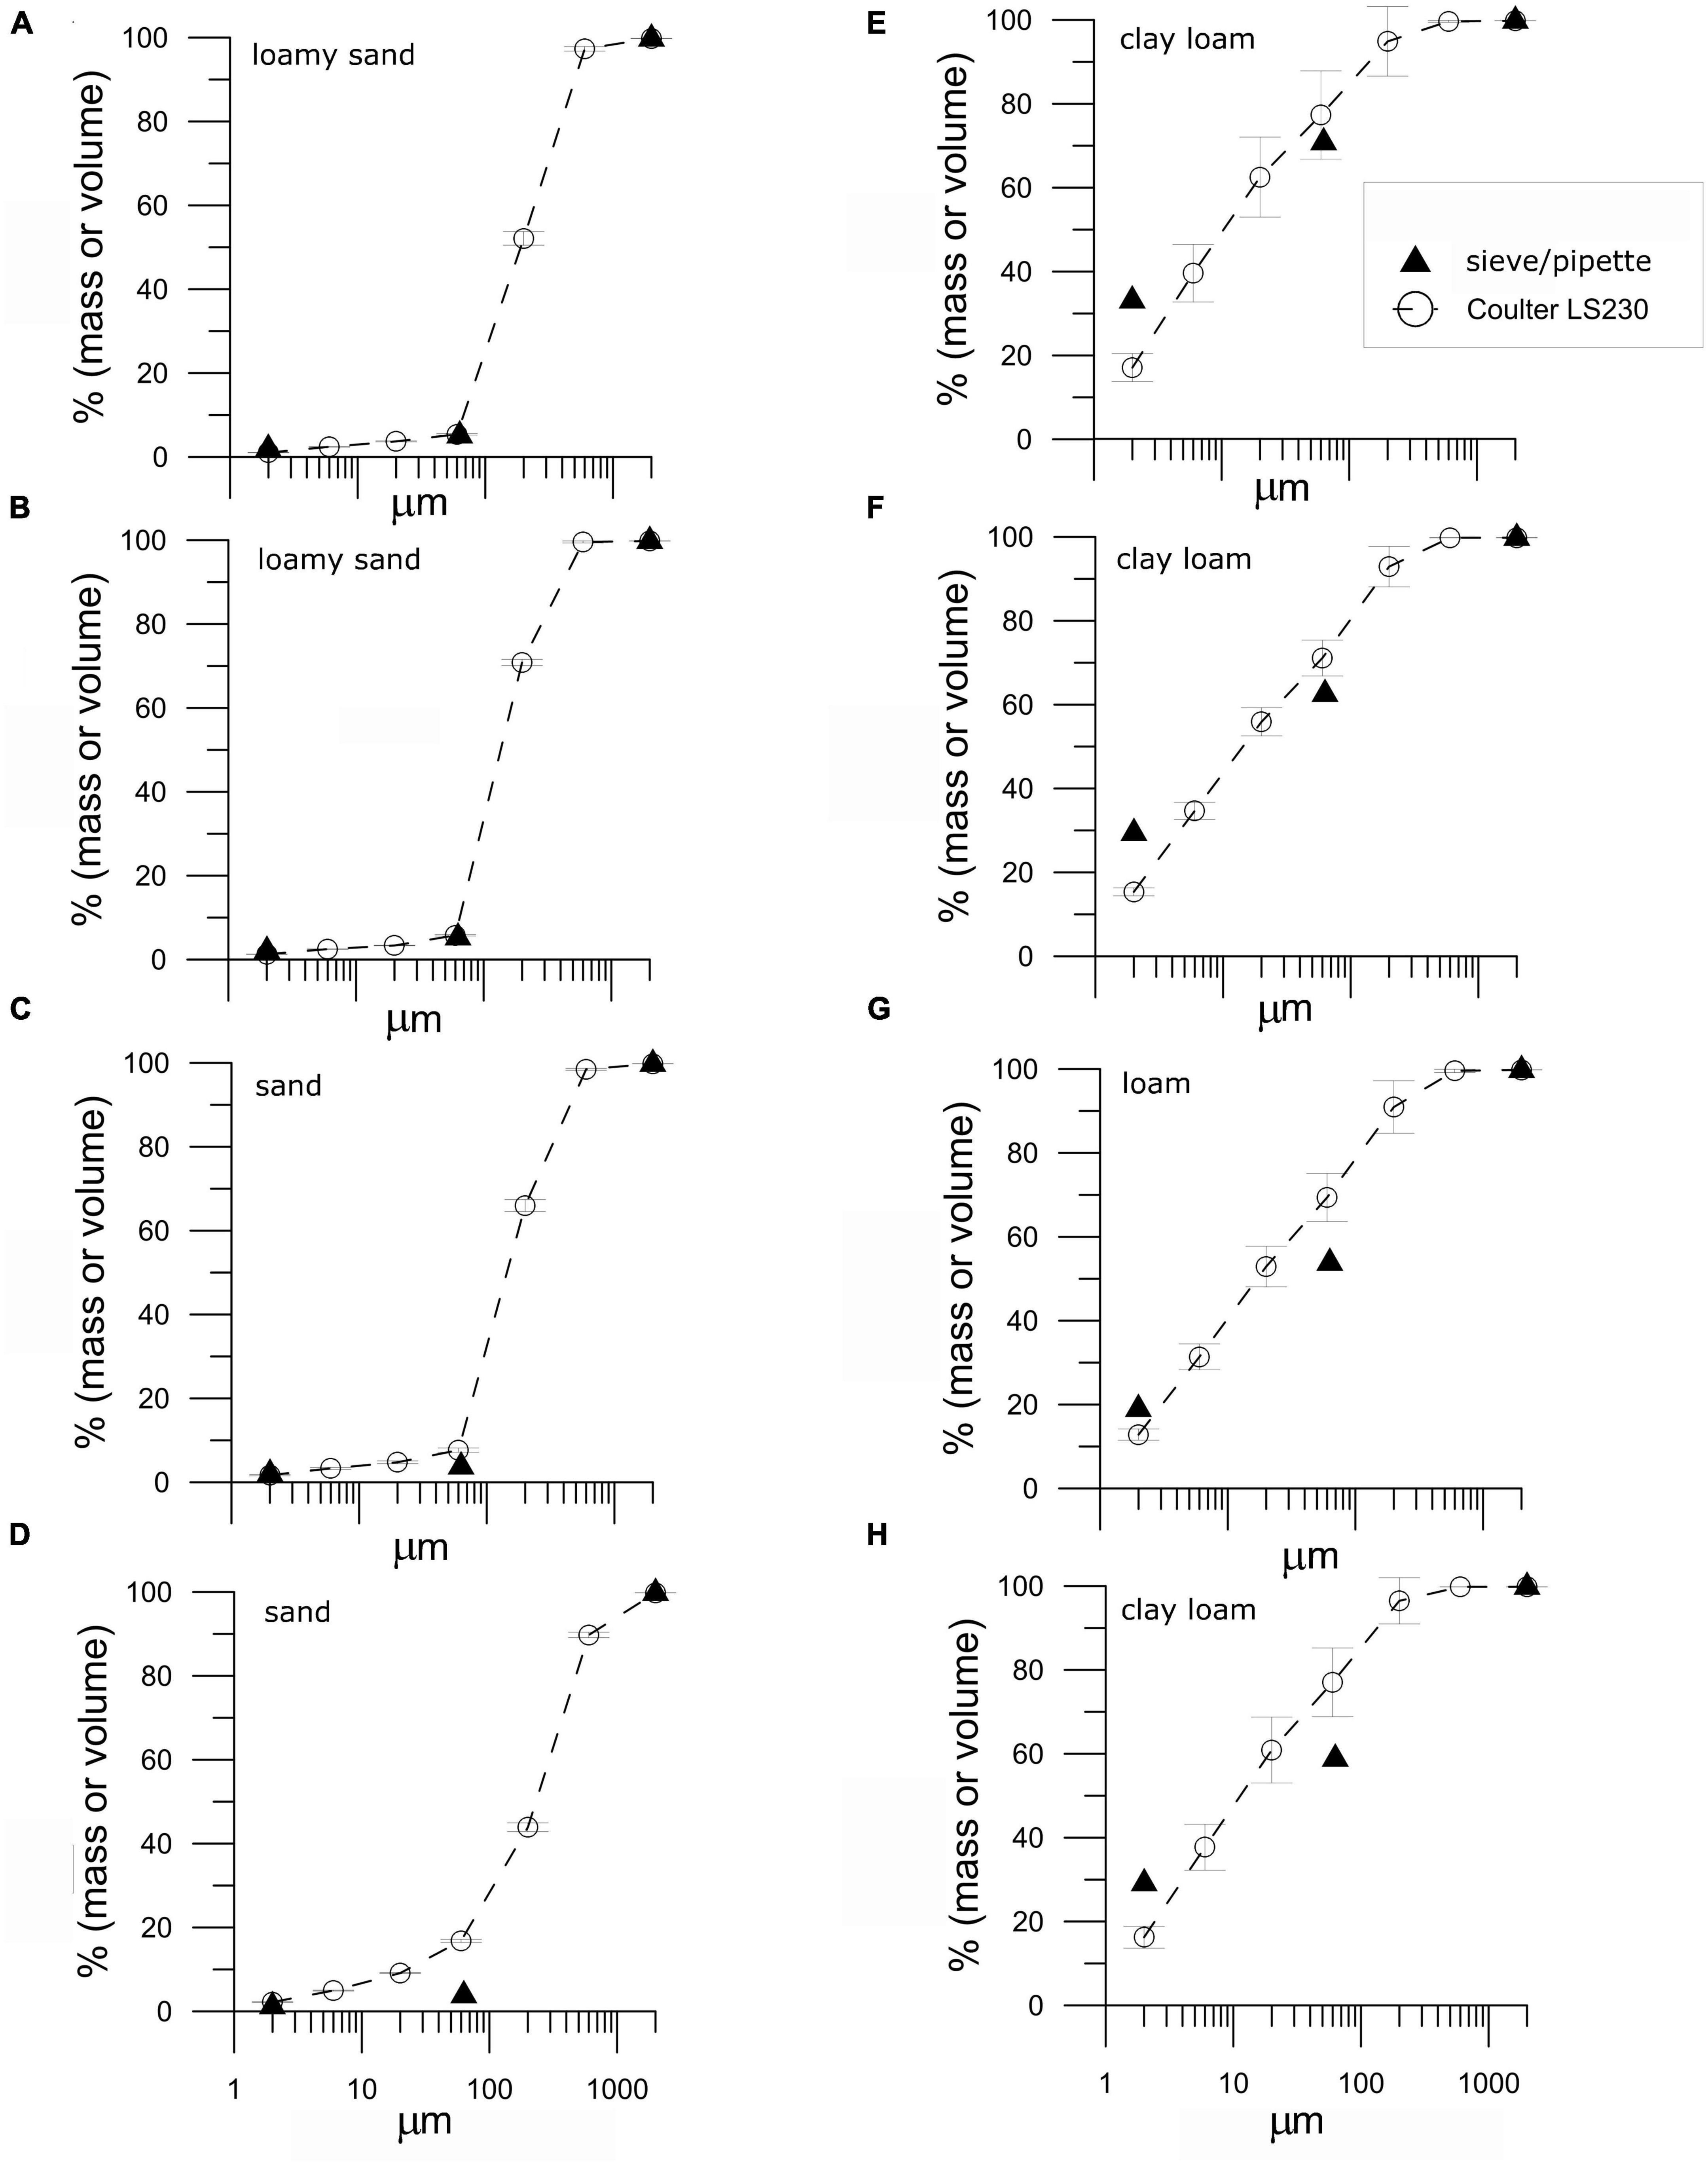
Figure 3. Cumulative content of fractions of fine earth particles vs. particle size. The Lithuanian (Lit) samples were sieved at 1 mm before laser diffraction (LD) measurement on Coulter LS230, and received no external ultrasonication (see Table 1). Each LD point is the mean of three samples (N = 3) and error bars are 1 SD for the fraction up to the given diameter. Sample numbers refer to Supplementary Table 1. (A) Lit1, (B) Lit3, (C) Lit5, (D) Lit7, (E) Lit9, (F) Lit10, (G) Lit11, (H) Lit12.
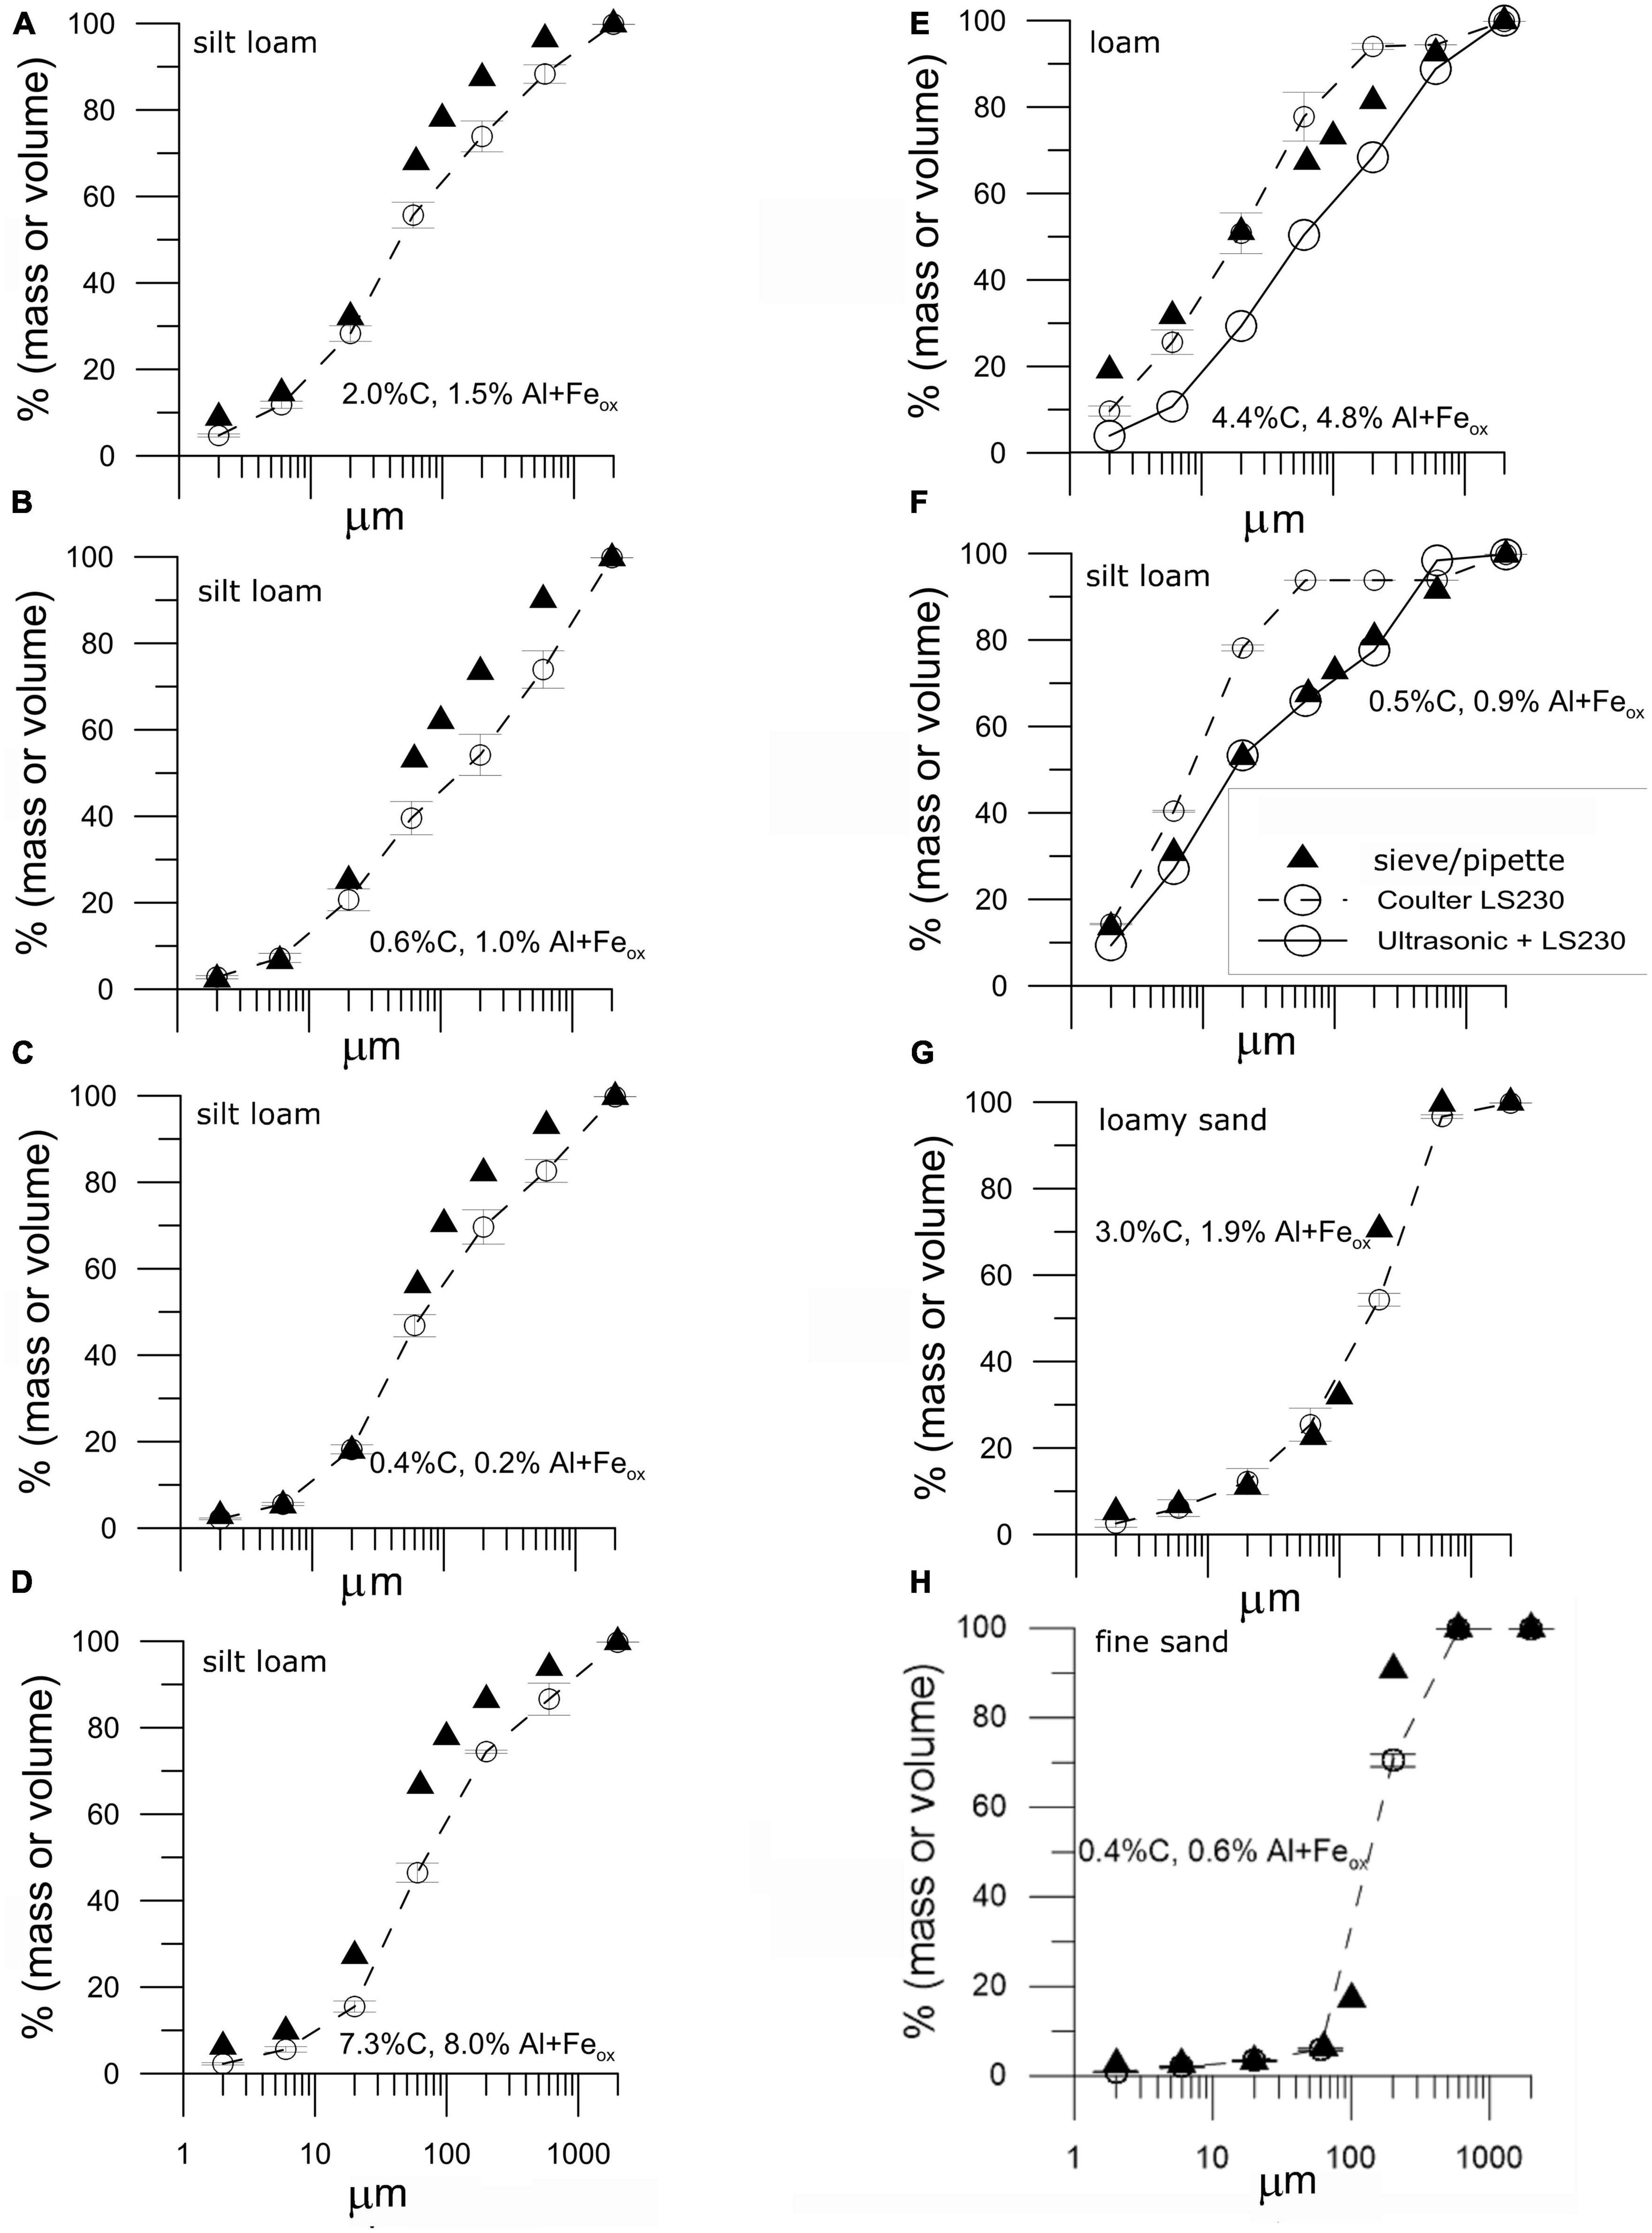
Figure 4. Cumulative content of fractions of fine earth particles vs. particle size by use of sieving and sedimentation (SSM) and laser diffraction (LD) Coulter LS230 (error bars are 1 SD up fraction up to that diameter for the LD samples). Norwegian soil samples–sieved at 1 mm before LD measurement on Coulter LS230 and corrected to 2 mm. The 1–2 mm fraction was estimated from the SSM data by interpolation of the 0.6–2 mm fraction and included in the LD particle size distribution (PSD). Each LD point is the mean of three samples (N = 3) and error bars are 1 SD for the fraction up to the given diameter. Sample numbers refer to Supplementary Table 1. (A) NO273, (B) NO275, (C) NO678, (D) NO679, (E) NO1322, (F) NO1324, (G) NO928, (H) NO931.
The current Malvern (UCPH) protocol involved sieving the 1 mm fraction based on 0.3–0.5 g sample in order to prevent larger sand grains to damage the flow cell. This was adopted also at Helsinki University for the Coulter LS230 as a variant of their method. Sieving of the samples using 1 mm aperture sieve results in missing data for the 1–2 mm sand fraction. As the sampling volume was small, the quantification of the 1–2 mm size fraction was anyhow uncertain. Therefore, the 1–2 mm sand fraction was determined based on sieving of a representative sample (50 g), and the sieved weight fraction was included in the estimated PSD for the DK and NO samples. Each fraction was adjusted for the 1–2 mm content by a recalculation according to the following equation:
2.3.3. Analytical procedure
An overview of the three laser diffraction protocols can be found in Supplementary Table 4, and are described further in this section.
2.3.3.1. Malvern Mastersizer 2000 (University of Copenhagen)
The Mastersizer 2000 uses dual-wavelength blue (short) and red (long) light, and has 52 detectors from 0.01 to 2.000 μm on a single lens. The scatter detection data are computed in an optical mathematical model to 72 particle size classes in the computation step (Malvern Instruments, 2007a). This gives a relative content of particles in 70 of the size classes (bins) ranging from 0.02 to 2.000 μm.
Between 0.3 and 0.5 g of homogenized soil samples from DK was sampled from a container. The sample received 10 ml 0.1 M sodium pyrophosphate, Na4P2O7, and about 40 ml demineralized water, and shortly after subjected to 2 min ultrasonic treatment at 20 kHz (ultrasonic converter HD220 connected to a SONOPULS Ultrasonic homogenizer HD2200 with maximum effect 200 W, Bandelin, Berlin). To avoid larger particles to harm the flow cell, the sample was sieved (1 mm). Wet sieving was done through a 1.0 mm sieve into a 250 ml beaker, and the dispersion was transferred quantitatively to the Malvern 2000 Hydro S unit (standard sample particle range <600 μm, Malvern Instruments, 2007b) where an ultrasound device integrated in the wet unit was applied with 50% of full effect.
Each sample was measured in five runs, and the last four runs were used for calculating an average PSD of the 0–1 mm fraction of the sample. Mie-scattering theory was used to compute the PSDs from the measured signals (ISO 13320, 2009). Assumptions for calculating the PSD by use of the Malvern Mastersizer 2000 were as follows: The particle name of the reference sample used in the analysis was “China clay,” the particle refractive index was 1.555, the particle absorption index was 0.1, the dispersant was demineralised water, and the dispersant refractive index 1.33. For details, see Callesen et al. (2018). The PSD was expressed in volume-%, equivalent to weight-% assuming a uniform specific density of particles across the particle size (e.g., no calcium carbonate).
2.3.3.2. Sympatec HELOS (Aarhus University)
The configuration of the Sympatec HELOS (Sympatec GmbH, Remlingen. Germany, model from 1999) is based on a laser wavelength of 632.8 nm (Rasmussen, 2020). In order to obtain a statistically sufficient number of particles, the initial sample size is typically 50–100 g, depending on the sample composition, the expected size range of the particles and the purpose of the study. Air dried samples from DK were sieved to obtain the fine earth fraction <2 mm, and then evaluated for carbonate and organic content. The DK samples did not require HCl or H2O2 pre-treatment for carbonate or organic matter removal. The material was split into three fractions: <63 μm, 63–250 μm and 250 μm–2 mm, first by wet sieving at <63 μm followed by dry sieving of the >63 fraction at 250 μm. The sieved soil (50 g, <2 mm) was dispersed in 40 ml 0.1 M sodium-pyrophosphate, Na4P2O7⋅10H2O, and 200 ml demineralized water and left in an end-over-end shaker overnight at 25 RPM. The dispersion was transferred to a 63 μm sieve, and the >63 μm fraction was dried and sieved on a 250 μm sieve. Then, the two dry fractions <2 mm were weighed. The wet fraction was transferred to a 500 ml polyethylene bottle and the mass of the fraction <63 μm was calculated from the masses of the two dry fractions subtracted from the initial mass of the sample <2 mm. Two minutes of ultrasonic treatment at full power (400 W) was applied prior to the LD analysis using a Labsonic P ultrasonic homogenizer (Sartorius group, Göttingen, Germany). Once sample material was added to the reservoir, the concentration in each wet suspension sample was adapted to obtain an obscuration of ca. 15–30%.
The wet and the two dry separates were measured on appropriate lenses covering the following three size ranges: (i) The 250 μm–2 mm sample separate was measured on the gravitational unit as dry, individual falling particles using the HELOS R7 lens. (ii) The 63–250 μm fraction was mixed with demineralized water into a homogenous paste and a small amount (pea size) was sampled with a spatula. The internal ultrasonic treatment was applied to remove air bubbles that may form inside the dispersion system prior to the measurements by use of a HELOS R7 lens. (iii) The dispersed <63 μm fraction was sampled with a small 5 ml sample beaker while agitated in order to obtain a sample from a homogeneous suspension. An additional short-term ultrasonication of the sample inside the instrument was performed prior to the measurement using the HELOS R4 lens.
To estimate the different fractions for the PSD model, the Fraunhofer theory was used, which is an approximation of the Mie scattering theory (ISO 13320, 2009). The Fraunhofer approximation is valid at angles <30 degrees and when the particles are at least 10 times larger than the wavelength of that of the laser (ISO 13320, 2009).
The total sample mass used in the analysis was high, 50–100 g, to ensure enough coarse particles, and thus, the LD analysis at Aarhus University was not replicated. However, the analysis included three repetitions on each of the three sample fractions: <63 μm, 63–250 μm and 250 μm–2 mm. Based on expert knowledge, the best curve among the three repetitions on each fraction was used in further data processing to obtain the final PSD representing the fine earth fraction (<2000 μm). The final PSDs were constructed from the measured three PSDs based on the relative mass of each fraction (<63 μm, 63–250 μm and 250 μm–2 mm).
2.3.3.3. Coulter LS230 (Helsinki University)
The Coulter LS230 (BeckmanCoulter, Brea, CA, USA) uses laser light with a wavelength of 750 nm. Five grams of soil was dispersed for less than 1 h in 0.05 M sodium-pyrophosphate solution to form a slurry, and between 0.5 and 4 g of paste was placed into the diffraction cell chamber using a spatula. The sample size is related to the obscuration percentage caused by the number of particles in the sample, the number increasing strongly with an increasing clay content. The recommended 8–12% obscuration range was used for all measurements. The speed of the water pump was set to 62%. The water module was rinsed for 2 min between the measurements. No internal ultrasonication was used in the Coulter LD analyses. Each sample was sub-sampled three times to obtain replicate analysis from each sample (Supplementary Table 1). For the test samples with high and low content of C and sesquioxides (samples NO1322 and NO1324), one additional sub-sample was ultrasonicated 2 min at 35 kHz by using an external ultrasonic treatment in an ultrasonic bath with nominal effect 215 Watt (SONOREX DIGITEC DT 514, Bandelin Electronic, Berlin, Germany). The particle size was calculated by use of a Fraunhofer model (ISO 13320, 2009).
3. Results
3.1. Comparison of SSM and LD by use of coulter LS230, including test of external ultrasonication
The LD method generally underestimated the clay content (Figure 1A) and overestimated the silt content (Figure 1B) when comparing the size fractions recommended by the International Society of Soil Sciences for use in a ternary diagram for texture class classification (Verheye and Ameryckx, 1984). The discrepancy between the analytical methods increased with increasing content of the given fraction, up to 24% pp for clay and 30% for silt. The sand fraction was the least affected by the method (Figure 1C).
For the single fractions of the DK soils, the clay content ranged from 10 to 38% and from 4.3 to 13.1% for the same samples analyzed with SSM and the Coulter LS230, respectively (Figures 1, 2 and Table 3). A similar pattern as for the DK clay samples was found for 4 out of 12 of the Lit samples, which consisted of texture class clay loam (Figures 1A, 3E-H and Supplementary Tables 1, 3).
For the NO samples, the clay fractions of the Coulter LS230 were lower than results from the SSM (Figures 1, 4) in six cases, and for two samples the two methods showed a similar clay content. A two-tailed paired t-test to detect potential significant differences between SSM and Coulter showed a p-value of 0.055 for clay, and somewhat larger p-values for the silt and sand fractions. The mean difference for eight NO samples was 2.6 percent points lower when analyzed by LD, but ranged up to 10 percent points for one sample (NO1322, Supplementary Table 2). The silt fractions were similar or slightly higher in four of the LD analysis relative to the SSM (Figures 1, 4A-D, G and Supplementary Table 2). For two samples with 21–23% silt by SSM (Supplementary Table 2, NO275 and NO679), the LD silt fractions were 5 and 7 pp lower, respectively, whereas for two samples the silt content by use of the LD Coulter was considerably higher relative to SSM (Supplementary Table 2, NO1322 and NO1324). The eight NO samples were generally characterized by a relatively high variation in the contents of SOC and oxalate extractable (considered organically bound) aluminum and iron (Figure 4).
There was no consistent effect of the external ultrasonic treatment in the two NO test-samples in terms of obtaining more similar results between the SSM and the LD methods (Figures 4E, F). For the loam sample NO1322, which had both high C and Feox + Alox contents (Figure 4E), the clay and silt fractions decreased by 6 and 15 pp, respectively, after performing the external ultrasonication, which resulted in a much lower clay content relative to the SSM method (Figure 1A). The shift in the silt content, on the other hand, resulted in a better agreement between the two methods (Figure 1B). Finally, the external ultrasonication treatment changed the originally similar SSM and LD analysis of the sand fraction, increasing the LD (US) sand fraction by 21 pp. For the silt loam sample (NO1324), which in comparison had relatively low content of C (Figure 4F), the external ultrasonication caused the clay and silt fractions to drop by 5 and 20 pp, respectively, and the sand fraction to increase by 25 pp (Figure 1B).
3.2. Comparison of LD analysis between 3 instruments/laboratories
All the three LD instruments showed considerably lower clay content relative to the SSM approach (Table 3 and Supplementary Table 6). These differences in the relative size fractions resulted in soils being classified into different soil texture classes for three of the four DK samples, where the sandy loam sample was the exception (Table 3). The sand fraction was slightly higher, and silt was in between for the Malvern in comparison with Coulter and Helos (Table 3). Both the clay and the silt contents were suggested to be slightly higher with the Helos compared to the two other LD instruments. However, the relative size fractions amongst these LD instruments resulted in the same classification for all samples when analyzed on Coulter and Helos, whereas the classification based on Malvern differed from the other LD instruments for two out of four samples (Table 3). The range in the percentage differences for the clay fraction between the tree laboratories / LD instruments were 1.9 to 5.3 pp for differences, which were on average 4.5 to 22.3 pp lower than the SSM result. For the silt fractions that were 5.1 to 24.4 pp higher than the SSM result, the silt fraction differences were in the range 6.2 to 8.1 pp. The sand fraction difference range was 9.3 to 11.1 pp, on average both higher and lower than the SSM result (Supplementary Table 6).
3.3. Replication error in sandy and loamy samples coulter LS230 analysis
When looking at cumulative PSDs for Lithuanian samples (Figure 3), the standard deviations (SD) for the three replicates analyzed on the Coulter LS230 following 1-mm sieving were relatively high for the clay loam and loam samples (Figures 3E-H), and minor for the sand and loamy sand (Figures 3A-D). Individual fractions were calculated and grouped into texture classes (four different samples in each) using the extended data. The replication errors varied between 0.2 and 10.2 pp for the samples classified as clay loam and loam, and in the range 0.1–2.5 pp for the loamy sand and sand texture classes (Table 4). The Coulter LS230 results were not corrected for the 1-mm fraction (Eq. 2) in the aggregated fraction of clay, silt and sand, as this was of minor importance when compared with the result from the analysis of the un-sieved samples.
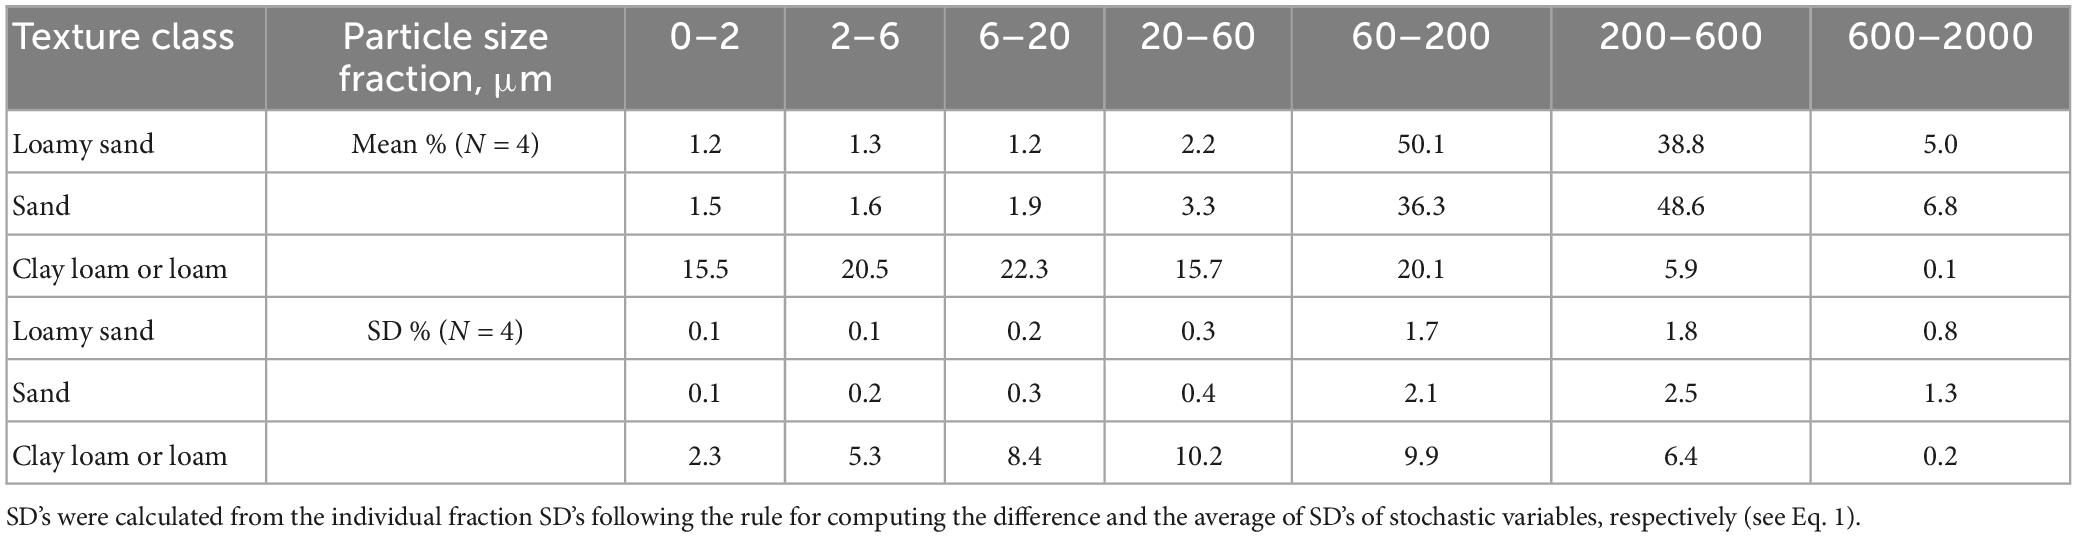
Table 4. Texture class means (%) and standard deviations (SD) in percentage points (%) from repeated analysis on the laser diffraction instrument Coulter LS230.
4. Discussion
The aim of the study was to compare protocols and practices for forest soil PSD analysis developed at three laboratories with three different LD instruments in a collaborative learning study. The study revealed that SSM protocols are very different, and that they also differ from the ISO 11277 standards, i.e., regarding removal of SOM also at low contents.
The underestimation of the clay content by LD relative to SSM is in accordance with previous findings (Konert and Vandenberghe, 1997; Vandecasteele and De Vos, 2001; Fisher et al., 2017; Mako et al., 2019; Qiu et al., 2021; Thomas et al., 2021). There is currently no consensus about the equivalent diameter for clay between SSM and LD, and the present screening showed differences between the protocols. The clay equivalent diameters have been investigated in many studies to resolve the clay/silt bias, with varying results. It has been found to be 4 μm (Thomas et al., 2021), 5 μm (Qiu et al., 2021), 6 μm (Vandecasteele and De Vos, 2001), and 7 μm (Mako et al., 2019) for clay, and 26 μm for fine silt (Fisher et al., 2017). These studies used reference methods that were based on both hydrometer and pipette data, however, the LD instruments were in general Malvern 2000, except for the study by Vandecasteele and De Vos (2001) (op. cit., Coulter LS200, BeckmanCoulter) and Thomas et al. (2021) (op. cit. Partica LA-960, Horiba Ltd.).
The discrepancy we found between the analytical methods and instruments resulted in different classification of the soil samples into soil types. On a larger scale, this analytical discrepancy may potentially lead to systematic differences in soil classes at regional and/or national scales, with subsequent differences in, e.g., evaluations of the soil capacity for soil water retention and soil fertility as well as estimates of soil C stocks in the absence of data on bulk density (Vanguelova et al., 2016). This may also be the case for evaluations related to discrepancies in the silt fractions, which are important for stabilizing soil organic carbon.
In spite of the relatively large uncertainty of the results from the LD analyses with respect to the clay fraction, the results were within the given acceptable limits in a ring-test of Jakovljevic (2021), and for some of the samples this was also the case for the silt and sand fractions (Figure 2). The ring-test undertaken by ICP forest (The International Co-operative Program on Assessment and Monitoring of Air Pollution Effects on Forests) was based on SSM soil texture analysis of four anonymous soil samples by 32 soil laboratories. The test revealed an extreme variability of recovery percentages relative to the true value of clay, silt or sand size fractions, but showed no bias (Jakovljevic, 2021). The acceptable limit to pass the ring-test and obtain accreditation of the laboratory was in the range 5–10 percent points around the mean, with a 50% relative error below 10% clay and a 35% relative error above 10% clay. This error pattern emerged even with the use of common operating procedures such as the ICP Forest manual for soil sampling and analysis (Cools and De Vos, 2016). The anonymous samples came without any site data, which may cause problems if they represent soil properties that differ substantially from the sample type common to a participating laboratory. In comparison, our findings of a maximum absolute difference of 5.3 pp in the measured clay fraction and 8.1pp for the silt fraction between the three different laboratories / LD instruments (Supplementary Table 6) were well within the 35% relative error and 10% (pp) absolute allowed error range stipulated in the ICP forest ringtest Jakovljevic (2021).
Causes of bias resulting from decisions made during pre-assessment, pre-treatment and analysis of test samples are difficult to detect in a ring-test, as these procedures are entirely the choice and responsibility of the participating laboratory. The decision to carry out pre-treatment procedures are usually based on the purpose of a study as well as sample characteristics, and is frequently related to the spodic material of eluviated SOM and sesquioxides with its ecologic importance related to, e.g., water holding capacity, cation exchange capacity and being a substrate for microbial life. The humus content can be judged visually based on experience or based on soil analyses that include SOC, loss on ignition (OM), as well as gravel and carbonate quantification. The two NO test samples represent an example of how various pre-treatment protocols may affect the results: For the NO1322 sample, the pre-treatment (no SOM removal, and ±US) produced very unstable results in relation to the SSM analysis. Here, the clay content measured by the SSM method was 20% whereas this fraction of clay sized particles was absent following the ultrasonic pre-treatment prior to the Coulter analysis. Ultrasonication can destruct SOM with less energy requirement than the more ordered oxides (Kaiser and Berhe, 2014), and the replacement of end-over-end shaking with US in texture analysis may thus pose a challenge. The SSM analysis involved H2O2 treatment for removal of SOM, but no removal of sesquioxides. Potentially, the fraction may contain grains of non-crystalline oxides complexed with humic and fulvic substances, that may dissolve. To limit the potential uncertainty for both SSM and LD, an option may be to measure the pedogenic iron oxides directly using the method by McKeague (1967), and then remove them prior to the texture analysis by reductive dissolution (Mehra and Jackson, 1960; Gee and Or, 2002). Another point to investigate for the LD analysis is including H2O2 pre-treatment, but avoiding US (similar to the SSM protocol for Norway).
In addition to organic matter enriched spodic material, the two NO test samples point to another soil property that may violate the assumptions on particle density in sedimentation analysis (hydrometer or pipette) and which also apply to the LD analysis, namely particle density of the minerals in the parent material. For other soil types, the content of carbonates is also of importance. The shape of the particles is a key factor related to clay minerals, carbonates (that often coat other particles), organic (fiber-like) material and other components. These may be platy, elongated or approximately spherical, and the approach of how the shape is measured and converted to a specific size will affect the final PSD (Rasmussen and Dalsgaard, 2017).
The sandy soils sampled at sites in Lithuania with relatively dry climate and a low clay content, showed generally a good agreement between SSM and LD (Figure 3, Table 4 and Supplementary Tables 1, 3) as well as a relatively low replication error. In contrast to the sandy soils, the replication error for loamy soils was quite high, up to 10 pp for the clay and silt fractions (Table 4), and thus in the upper range of the generally 10 pp acceptable limit to pass the above-mentioned ring-test (Jakovljevic, 2021). All the samples had some degree of chemical/physical dispersion (a slurry) for LD, whereas for SSM the pre-treatment consisted of H2O2 and overnight end-over-end shaking with a chemical dispersant. Zimmermann and Horn (2020) assigned a higher amount of coarser particles observed in PSDs by LD without US pre-treatment, in contrast to pretreated samples, to water soluble aggregates not being dispersed. In our case, however, the effect of no US treatment on the replication error of the sandy soil was minor. The SOC content of all the Lit samples was low (<1.5 % C, equivalent to about 3 % organic matter). Callesen et al. (2018) investigated the effect of H2O2 pre-treatment on six soil samples with rather low C content, and found that this step had no influence on the texture results of LD analysis. However, in this case also US was applied, thus the effect of H2O2 was not isolated. Whereas a low content of organic matter can add 1–2 percent points to the clay fraction if not removed (Gee and Or, 2002; Callesen et al., 2018), an error of this size is accepted in ring-tests (ISO 13320, 2009; Jakovljevic, 2021). The protocol for LD particle analysis (ISO 13320, 2009) sets the acceptable coefficient of variation (CV) for particle ranges to 5% for particles >10 μm and 10% for particle fractions <10 μm. The results for clay loam and loam samples from Lithuania, analyzed on the LD Coulter instrument, did not comply with this requirement for the replicates of any of the size fraction. The sand and loamy sand had high CVs between 6 and 60 μm and >600 μm (Table 4), however, at small-sized fractions the CV is not a robust measure. Rather than using relative error (ISO 13320 op. cit.), absolute values can be more suitable for soil samples as practiced in the ICP Forest ring-test for soils (Jakovljevic op. cit).
The climate gradient and glacial history of the three countries included in the current study produce very diverse forest soils, which may explain differences in protocols, e.g., the need for ultrasonication. Our preliminary comparison of SSM and LD indicates that more work is needed on alignment of protocols before the range of acceptable results can be narrowed. At the same time, soil texture data are often a legacy and part of databases with timelines of more than 30 years, which support a need for comparative studies between older protocols for SSM data along with results from new analytical approaches. Also, texture analysis should be available in every laboratory as a means to maintain knowledge and skills among staff and students. For that reason, it is to be expected that a variety of instruments, principles and methods are being used, and also will be continued in the future. In this perspective it is understandable that tolerances around the true result in the ICP Forest ring-tests are rather wide: 35 to 50% depending on fraction size. Thus, standards cannot be locked to the LD method, but may potentially be calibrated using image analysis as suggested by Bittelli et al. (2022). On the other hand, the current results, and the example from the ring test, show that detailed descriptions of the analytical protocol of SSM and LD, and any PSD analysis, are of critical importance to demonstrate awareness and secure comparability between reported soil texture data with respect to optional removal of organic matter, sesquioxides, dispersion by ultrasonication or soaking/shaking/mixing using a chemical dispersing agent. Our preliminary comparison also points to the need of additional comparative studies on forest soils, which are based on different theoretical approaches and analytical principles, a variety of instruments, pre-treatment methods and a variety of soil types.
5. Conclusion
Our study on predominantly boreal and nemoral acid forest soils showed a relatively large discrepancy between the SSM and LD for the fractions clay and silt, and a minor discrepancy for the sand fractions. The differences between SSM and LD results changed the classification of soil types according to systems with clay limits 5 and 15% (e.g., ISSS soil texture classification). PSDs obtained by the LD method for sandy soils were repeatable within the same lab and instrument but not for clay loamy/loamy soils, and results were in some cases not comparable between laboratories and instruments. Alignment of protocols for pre-treatment may improve this reproducibility, as may addressing the possible influence of SOM, aggregation and presence of non-silicate soil constituents in both LD and SSM analysis. As the clay and silt fractions are important for a variety of soil properties, any ecology-related application of LD should address the accuracy and precision of the soil texture results, especially for the clay and silt fractions. Pre-treatment methods in soil texture analysis should always be reported along with texture data in databases as well as publications, since laboratory protocols and practices within and between laboratories can vary, as well as change over time.
Data availability statement
The original contributions presented in the study are included in the article/Supplementary material.
Author contributions
IC conceived the study and drafted the manuscript include tables and figures. MP was responsible for laboratory analyses at HU and CR for analyses at AU. OK and IC were responsible for the manuscript revisions. All authors contributed to the manuscript.
Funding
This study was supported by the Danish Ministry of Energy, Utilities and Climate (Sinks 2, 2014–2021), Centre of Advanced Research on Environmental Services from Nordic Forest Ecosystems’ (CAR-ES III 2016–2020, the Nordic Council of Ministers), and Research Council of Norway (Grant number 255307; Contract No. 342631/L10).
Acknowledgments
We thank SW, LD, and CP reviewers for their critical comments on an earlier version of the manuscript.
Conflict of interest
The authors declare that the research was conducted in the absence of any commercial or financial relationships that could be construed as a potential conflict of interest.
Publisher’s note
All claims expressed in this article are solely those of the authors and do not necessarily represent those of their affiliated organizations, or those of the publisher, the editors and the reviewers. Any product that may be evaluated in this article, or claim that may be made by its manufacturer, is not guaranteed or endorsed by the publisher.
Supplementary material
The Supplementary Material for this article can be found online at: https://www.frontiersin.org/articles/10.3389/ffgc.2023.1144845/full#supplementary-material
References
Bieganowski, A., Ryżak, M., Sochan, A., Barna, G., Hernádi, H., Beczek, M., et al. (2018). Chapter five - laser diffractometry in the measurements of soil and sediment particle size distribution. Adv. Agron. 151, 215–279. doi: 10.1016/bs.agron.2018.04.003
Bittelli, M., Pellegrini, S., Olmi, R., Andrenelli, M. C., Simonetti, G., Borrelli, E., et al. (2022). Experimental evidence of laser diffraction accuracy for particle size analysis. Geoderma 409, 115627. doi: 10.1016/j.geoderma.2021.115627
Borggaard, O. K., Møberg, J. P., and Petersen, L. (1988). Vejledning i jordbundsanalyser [In Danish: Guide for soil analysis]. København: DSR Forlag.
Breuning Madsen, H., Nørr, A. H., and Holst, K. A. (1992). Den danske jordklassificering. København: Hans Reitzels Forlag.
Buurman, P., Pape, T., Reijneveld, J. A., de Jong, F., and van Gelder, E. (2001). Laser diffraction and pipette-method grain sizing of Dutch sediments: correlations for fine fractions of marine, fluvial, and loess samples. Netherlands J. Geosci. 80, 49–57. doi: 10.1017/S0016774600022319
Callesen, I., Keck, H., and Andersen, T. J. (2018). Particle size distribution in soils and marine sediments by laser diffraction using Malvern Mastersizer 2000—method uncertainty including the effect of hydrogen peroxide pretreatment. J. Soils Sediments 18, 2500–2510. doi: 10.1007/s11368-018-1965-8
Callesen, I., Liski, J., Raulund-Rasmussen, K., Olsson, M. T., Tau-Strand, L., Vesterdal, L., et al. (2003). Soil carbon stores in Nordic well-drained forest soils-relationships with climate and texture class. Glob. Chang. Biol. 9, 358–370. doi: 10.1046/j.1365-2486.2003.00587.x
Cools, N., and De Vos, B. (2016). “Part X: sampling and analysis of soil,” in Manual on methods and criteria for harmonized sampling, assessment, monitoring and analysis of the effects of air pollution on forests, ed. UICP Forests Programme Coordinating Centre (Eberswalde: Thünen Institute of Forest Ecosystems).
Day, P. R. (1950). Physical basis of particle size analysis by the hydrometer method. Soil Sci. 70, 363–374. doi: 10.1097/00010694-195011000-00004
Faé, G. S., Montes, F., Bazilevskaya, E., Añó, R. M., and Kemanian, A. R. (2019). Making soil particle size analysis by laser diffraction compatible with standard soil texture determination methods. Soil Sci. Soc. Am. J. 83, 1244–1252. doi: 10.2136/sssaj2018.10.0385
Fisher, P., Aumann, C., Chia, K., O’Halloran, N., and Chandra, S. (2017). Adequacy of laser diffraction for soil particle size analysis. PLoS One 12:e0176510. doi: 10.1371/journal.pone.0176510
Gee, G. W., and Or, D. (2002). “Particle size analysis,” in Methods of soil analysis, part 4, physical methods, soils science society of america, book series no. 5, eds J. H. Dane and G. C. Topp (Madison: SSSA), 255–293.
Hartmann, D. (2007). From reality to model: operationalism and the value chain of particle-size analysis of natural sediments. Sediment. Geol. 202, 383–401. doi: 10.1016/j.sedgeo.2007.03.013
ISO 11277. (1998, 2020) Soil quality – determination of particle size distribution in mineral soil material – Method by sieving and sedimentation. Geneva: International Organization for Standardization.
ISO 13320. (2009). Particle size analysis – laser diffraction methods. Geneva: International Organization for Standardization.
Jakovljevic, T. (2021). Soil interlaboratory test programme - 9th test 2021. Available online at: https://storage.ning.com/topology/rest/1.0/file/get/9789913099?profile=original (accessed February 25, 2022).
Kaiser, M., and Berhe, A. A. (2014). How does sonication affect the mineral and organic constituents of soil aggregates?-A review. J. Plant Nutr. Soil Sci. 177, 479–495. doi: 10.1002/jpln.201300339
Konert, M., and Vandenberghe, J. (1997). Comparison of laser grain size analysis with pipette and sieve analysis: a solution for the underestimation of the clay fraction. Sedimentology 44, 523–535. doi: 10.1046/j.1365-3091.1997.d01-38.x
Krogstad, T., Jørgensen, P., Sogn, T. A., Børresen, T., and Kolnes, A. G. (1991). Manual for analysis of particle size distribution following the pipette method. Pretreament and pipette procedures. (Manual for kornfordelingsanalyse etter pipettemetoden. Forbehandling og Pipetteprosedyre. Dataprogrammer for veiing, beregning og utskrift. In Norwegian). Ås: Institute for Soil Science, Agricultural University of Norway, 41.
Mako, A., Szabo, B., Rajkai, K., Szabo, J., Bakacsi, Z., Labancz, V., et al. (2019). Evaluation of soil texture determination using soil fraction data resulting from laser diffraction method. Int. Agrophys. 33, 445–454. doi: 10.31545/intagr/113347
Malvern Instruments. (2007a). Mastersizer 2000 User Manual MAN0384 Issue 1.0. Worcestershire: Malvern Instruments Ltd.
Malvern Instruments. (2007b). Hydro 2000G/S User Manual. MAN0385 Issue 1.0 March 2007. Worcestershire: Malvern Instruments Ltd.
McKeague, J. A. (1967). An evaluation of 0.1 M pyrophosphate and pyrophosphate-dithionite in comparison with oxalate as extractants of the accumulation products in podzols and some other soils. Can. J. Soil Sci. 47, 95–99. doi: 10.4141/cjss67-017
Mehra, O. P., and Jackson, M. L. (1960). Iron oxide removal from soils and clay by a dithionite-citrate system buffered with sodium bicarbonate. Clay Clay Miner. 7, 317–327. doi: 10.1346/CCMN.1958.0070122
Ministry of Agriculture. (1994). Landbrugsministeriets fælles arbejdsmetoder II (1994). III-2 Tekstur. 1–4. Available online at: https://www.retsinformation.dk/Forms/R0710.aspx?id=79498 (accessed April 17, 2023).
Moeys, J. (2018). The soil texture wizard: R functions for plotting, classifying, transforming and exploring soil texture data. Available online at: https://cran.r-project.org/web/packages/soiltexture/vignettes/soiltexture_vignette.pdf (accessed May 3, 2023).
Ogner, G., Wickstrøm, T., Remedios, G., Gjelsvik, S., Hensel, G. R., Jacobsen, J. E., et al. (1999). The chemical analysis program of the Norwegian Forest Research Institute 2000. Ås: Norwegian Forest Research Institute, 23.
Polakowski, C., Makó, A., Sochan, A., Ryżak, M., Zaleski, T., Beczek, M., et al. (2023). Recommendations for soil sample preparation, pretreatment, and data conversion for texture classification in laser diffraction particle size analysis. Geoderma 430:116358. doi: 10.1016/j.geoderma.2023.116358
Qiu, W., Hu, W., Curtin, D., and Motoi, L. (2021). Soil particle size range correction for improved calibration relationship between the laser-diffraction method and sieve-pipette method. Pedosphere 31, 134–144. doi: 10.1016/S1002-0160(20)60055-8
Rasmussen, C. (2020). Particle sizing in geosciences: explanation of various techniques and pre-treatments. Dep. Geoscience. Aarhus: Aarhus University. doi: 10.7146/aul.374
Rasmussen, C., and Dalsgaard, K. (2017). Working paper: documentation of tests on particle size methodologies for laser diffraction compared to traditional sieving and sedimentation analysis. Aarhus: Aarhus University. doi: 10.7146/aul.205.148
Schoenholtz, S. H., Miegroet, H. V., and Burger, J. A. (2000). A review of chemical and physical properties as indicators of forest soil quality: challenges and opportunities. For. Ecol. Manag. 138, 335–356. doi: 10.1016/S0378-1127(00)00423-0
Shein, E. V. (2009). The particle-size distribution in soils: problems of the methods of study, interpretation of the results, and classification. Eurasian Soil Sc 42, 284–291. doi: 10.1134/S1064229309030053
Soil Survey Staff. (2010). Keys to soil taxonomy United States, Eleventh Edn. Washington DC: Department of Agriculture Natural Resources Conservation Service, 346.
The World Reference Base [WRB] (2015). World reference base for soil resources 2014; international soil classification system for naming soils and creating legends for soil maps; world soil resources reports no. 106. Rome: FAO, 192.
Thomas, C. L., Hernandez-Allica, J., Dunham, S. J., McGrath, S. P., and Haefele, S. M. (2021). A comparison of soil texture measurements using mid-infrared spectroscopy (MIRS) and laser diffraction analysis (LDA) in diverse soils. Sci. Rep. 11:16. doi: 10.1038/s41598-020-79618-y
Vandecasteele, B., and De Vos, B. (2001). Relationship between soil textural fractions determined by sieve-pipette method and laser diffractometry. IBW Bb R 2001.003. Available online at: https://www.researchgate.net/publication/273948901_Relationship_between_soil_textural_fractions_determined_by_the_sieve-pipette_method_and_laser_diffractometry (accessed February 25, 2022).
Vanguelova, E. I, Bonifacio, E., De Vos, B., Hoosbeek, M. R., Berger, T. W., Vesterdal, L., et al. (2016). Sources of errors and uncertainties in the assessment of forest soil carbon stocks at different scales—review and recommendations. Environ. Monit. Assess. 188:630. doi: 10.1007/s10661-016-5608-5
Verheye, W., and Ameryckx, J. (1984). Mineral fractions and classification of soil texture. Pedologie 2, 215–225.
Keywords: particle size distribution (PSD), forest soil, sieving and hydrometer, method comparison, pre-treatment, pipette, LD, SSM
Citation: Callesen I, Palviainen M, Armolaitis K, Rasmussen C and Kjønaas OJ (2023) Soil texture analysis by laser diffraction and sedimentation and sieving–method and instrument comparison with a focus on Nordic and Baltic forest soils. Front. For. Glob. Change 6:1144845. doi: 10.3389/ffgc.2023.1144845
Received: 15 January 2023; Accepted: 01 June 2023;
Published: 23 June 2023.
Edited by:
Xiankai Lu, Chinese Academy of Sciences (CAS), ChinaReviewed by:
Susanne K. Woche, Leibniz University Hannover, GermanyLucian Dinca, National Institute for Research and Development in Forestry “Marin Drăcea”, Romania
Cezary Polakowski, Polish Academy of Sciences, Poland
Copyright © 2023 Callesen, Palviainen, Armolaitis, Rasmussen and Kjønaas. This is an open-access article distributed under the terms of the Creative Commons Attribution License (CC BY). The use, distribution or reproduction in other forums is permitted, provided the original author(s) and the copyright owner(s) are credited and that the original publication in this journal is cited, in accordance with accepted academic practice. No use, distribution or reproduction is permitted which does not comply with these terms.
*Correspondence: Ingeborg Callesen, aWNhQGlnbi5rdS5kaw==; orcid.org/0000-0001-5729-8686