 Conrad Trollip1,2*
 Angus J. Carnegie3
 Alexander M. Piper2
 Jatinder Kaur2
 Francesco Martoni2Quang Dinh2David Smith4,5,6
 Ross Mann2Brendan Rodoni1,2Jacqueline Edwards1,2
- 1School of Applied Systems Biology, La Trobe University, Bundoora, VIC, Australia
- 2AgriBio Centre for AgriBioscience, Agriculture Victoria Research, Department of Energy, Environment and Climate Action, Bundoora, VIC, Australia
- 3Forest Science, Department of Primary Industries, Parramatta, NSW, Australia
- 4ArborCarbon, Murdoch University, Murdoch, WA, Australia
- 5School of Ecosystem and Forest Sciences, University of Melbourne, Bunley, VIC, Australia
- 6Biosecurity and Agriculture Services, Agriculture Victoria, Department of Energy, Environment and Climate Action, Cranbourne, VIC, Australia
Post-border surveillance for forestry’s high priority pests and pathogens is conducted routinely through established programs focused on the main points-of-entry and across the major plantation growing regions. Currently, most diagnostic protocols used to identify fungal phytopathogens sampled during these surveys rely on traditional methods, such as morphological examination and DNA barcoding techniques. This stepwise process from isolation to species identification is often regarded as slow, expensive, and limited due to the need for disease manifestation and/or comprehensive expertise for rapid and accurate detection. In this study, we applied a recently validated high-throughput, dual-marker amplicon sequencing approach on insect surveillance traps from across Australia to assess its performance for the targeted surveillance of the Ophiostomatales, an order of fungi comprising notable phytopathogens which are vectored by bark beetles. By using a recently validated assay we were able to confidently characterize a range of Ophiostomatalean taxa known to be present in Australia, while reporting eight first detections from environmental DNA. Our study demonstrates the value of targeted multi-barcode amplicon sequencing for high-throughput screening of fungi caught in post-border surveillance traps, in addition to emphasizing research priorities that require further investigation before such methods can be implemented routinely for biosecurity.
1. Introduction
The combination of climate change and international trade and travel continues to drive organisms into new environments, increasing the likelihood of global range expansion and subsequent establishment of invasive pests and pathogens (Pyšek et al., 2010; Bebber, 2015). Invasive pests and pathogens pose a significant threat to forest ecosystems globally (Food and Agriculture Organization of the United Nations [FAO], 2020). Fungi are particularly worrying as they constitute arguably the largest threat to global biodiversity (Fisher et al., 2012), having enormous impacts on forest ecosystems through large scale population declines and, in severe cases, functional extinctions (Santini et al., 2013; Hughes et al., 2017; Bonello et al., 2020). As a result, forest biosecurity systems have been brought under review to address the needs for better harmonization, international collaboration, and continued investment to ensure better preparedness in the face of these invasive threats (Bonello et al., 2022). In Australia, a National Forest Pest Surveillance Program (NFPSP) has recently been established to fill gaps in post-border surveillance activities specific to the forest industry (Carnegie et al., 2022).
To date, post-border detections of exotic forest pests in Australia (Carnegie and Nahrung, 2019) and elsewhere (Wilson et al., 2004; Tobin et al., 2014; Gould, 2015) have largely been made through general/passive surveillance activities, such as those reported by the public, researchers, or industry. While effective, detections made through passive surveillance methods have a lower probability for successful eradication because the incursions will have likely extended beyond the initial phases of establishment by the time it is reported (Wilson et al., 2004; Carnegie and Nahrung, 2019; Paap et al., 2022). The NFPSP aims to increase the chance of early detection and eradication with a newly proposed framework encouraging better coordination across surveillance activities and risk-based analysis targeting entry pathways (Carnegie et al., 2022). Ideally, this will aim at detecting forestry’s high priority pests (Plant Health Australia [PHA], 2022b) at high-risk sites through tree health assessment and/or insect trapping. The success of post-border surveillance activities are, however, fundamentally dependent on the underlying diagnostics framework.
At present, most diagnostic protocols targeting fungal phytopathogens rely on traditional microbial isolation techniques followed by DNA barcoding or, in certain cases, pathogen-specific molecular assays such as quantitative PCR performed on symptomatic tissue (ities. This is due to a dependance on symptom development which needs to be recognized in-field, before skilled technicians or pathologists work through stepwise processes to make a reliable detection (Mumford et al., 2016). Screening for potential vectors through insect trapping does not require symptom development and offers a better opportunityNational Plant Biosecurity Diagnostic Network [NPBDN], 2022). Both diagnostic approaches are, however, limited by their targeted nature and not well suited for early detection during general surveillance activ to detect fungal pathogens that may be cryptic during the early stages of invasion. To this end, innovative approaches which rapidly screen for forest phytopathogens using high-throughput molecular techniques are increasingly desirable (Tremblay et al., 2018; Aguayo et al., 2021; Berube et al., 2022). While species-specific assays, such as quantitative PCR or loop-mediated isothermal amplification (LAMP), currently offer the most rapid and sensitive means of detecting pathogens from asymptomatic tissue (Luchi et al., 2020), they remain targeted to single/few species and are unlikely to be used in general surveillance activities which routinely monitor against lengthy target lists (Piombo et al., 2021). In this regard, high-throughput and comprehensive screening tools are needed to survey for the multitude of invasive pathogens that may be present within asymptomatic tissues or caught within surveillance traps (Bulman et al., 2018; Piombo et al., 2021).
Amplicon sequencing (metabarcoding) of environmental DNA (eDNA), defined here as the total DNA extracted from a given substrate (Taberlet et al., 2018), offers a robust, cost-effective, and high-throughput screening approach for early detection and broad-spectrum monitoring of exotic pests and pathogens (Comtet et al., 2015; Bulman et al., 2018). It is well established that eDNA metabarcoding is suitable for screening bulk insect trap catches, for both pests and pathogens, with several studies demonstrating the opportunities of applying the technique within existing surveillance frameworks (Malacrino et al., 2017; Batovska et al., 2018; Tremblay et al., 2018, 2019; Piper et al., 2022). Despite this, the reliability of detection and accuracy of identification when targeting fungal phytopathogens remains an important challenge (Lücking et al., 2020). Careful decision-making and optimization are required across various phases of an amplicon sequencing pipeline to achieve species-level resolution (Cobo-Díaz et al., 2019; Tedersoo et al., 2019).
We recently established a modular, dual-barcode amplicon sequencing pipeline to improve on high throughput diagnostics of the Ophiostomatales (Trollip et al., 2022), an economically important order of fungi that exhibits many of the key challenges to fungal species identification (Hulcr et al., 2020; Lücking et al., 2020). The Ophiostomatales are well-known for their associations with bark and ambrosia beetles (Curculionidae: Scolytinae, Platypodinae), benefiting from transport by their insect vectors (Six, 2012). While some of these associations can become catastrophic in novel environments (Fisher et al., 2012; Wingfield et al., 2017), others result in less severe disease and cause blue stain (sap stain) in the wood of economically valuable tree hosts (Seifert et al., 2013). Consequently, Australian forest biosecurity routinely targets bark and ambrosia beetles through insect trapping using semiochemical lures (Bashford, 2008), monitoring the already established pests in plantation forests [e.g., Ips grandicollis (Eichhoff) which vectors the blue stain fungus Ophiostoma ips (Rumbold)] and screening for potential exotics at high-risk sites (e.g., Ips and Dendroctonus spp.; Plant Health Australia [PHA], 2022b) (Carnegie et al., 2018, 2022). At present, diagnosis of trap catches during forest biosecurity surveillance is only conducted on insects, leaving an opportunity for Australian biosecurity agencies to improve their capacity by incorporating methods that can simultaneously screen for phytopathogens within the same traps. It is well established that semiochemical-baited insect traps are effective for fungal surveillance (Malacrino et al., 2017; Tremblay et al., 2018, 2019; Berube et al., 2022).
The aim of this study was to evaluate the efficacy of our dual-barcode amplicon sequencing approach for high throughput screening of fungi caught within insect surveillance traps collected across diverse geographic regions with variable environmental conditions and collection methods. To achieve this, we screened 45 insect panel traps collected from already established forest biosecurity surveillance programs across seven Australian states and territories. Our objectives included (i) an initial assessment of sample preparation for this specific trap type and (ii) to undertake targeted surveillance of the Ophiostomatales. This survey functions as a proof-of-concept for how high throughput sequencing approaches might be implemented in post-border surveillance activities for Australian forest pests and pathogens, and to identify where future research activities will continue to improve on their utility.
2. Materials and methods
2.1. Trap collection and sample processing
During post-border surveillance activities performed in the summer of 2020–2021, state agencies across Australia submitted insect panel-trap catches from 45 different locations (Figure 1 and Table 1). Trap catches were predominantly shared from within existing surveillance frameworks, including high risk site surveillance around ports-of-entry and in Pinus plantations where forest health surveillance activities are routinely conducted (Carnegie et al., 2018, 2022). Intercept panel traps (Alpha Scents, Inc, OR, USA and ChemTica Internacional, Heredia, Costa Rica) contained semiochemical lures designed to attract beetles of the Cerambycidae and Curculionidae families (Table 1), with insects collected into a preservative drowning fluid (Table 1) within collection cups attached at the bottom of each trap. Trap catches were collected monthly, with the preservative fluid replaced at this time. Trap catches, comprising a mix of target insect groups and bycatch, were either stored at 4°C or ambient temperature before being transported to the laboratory for further analysis.
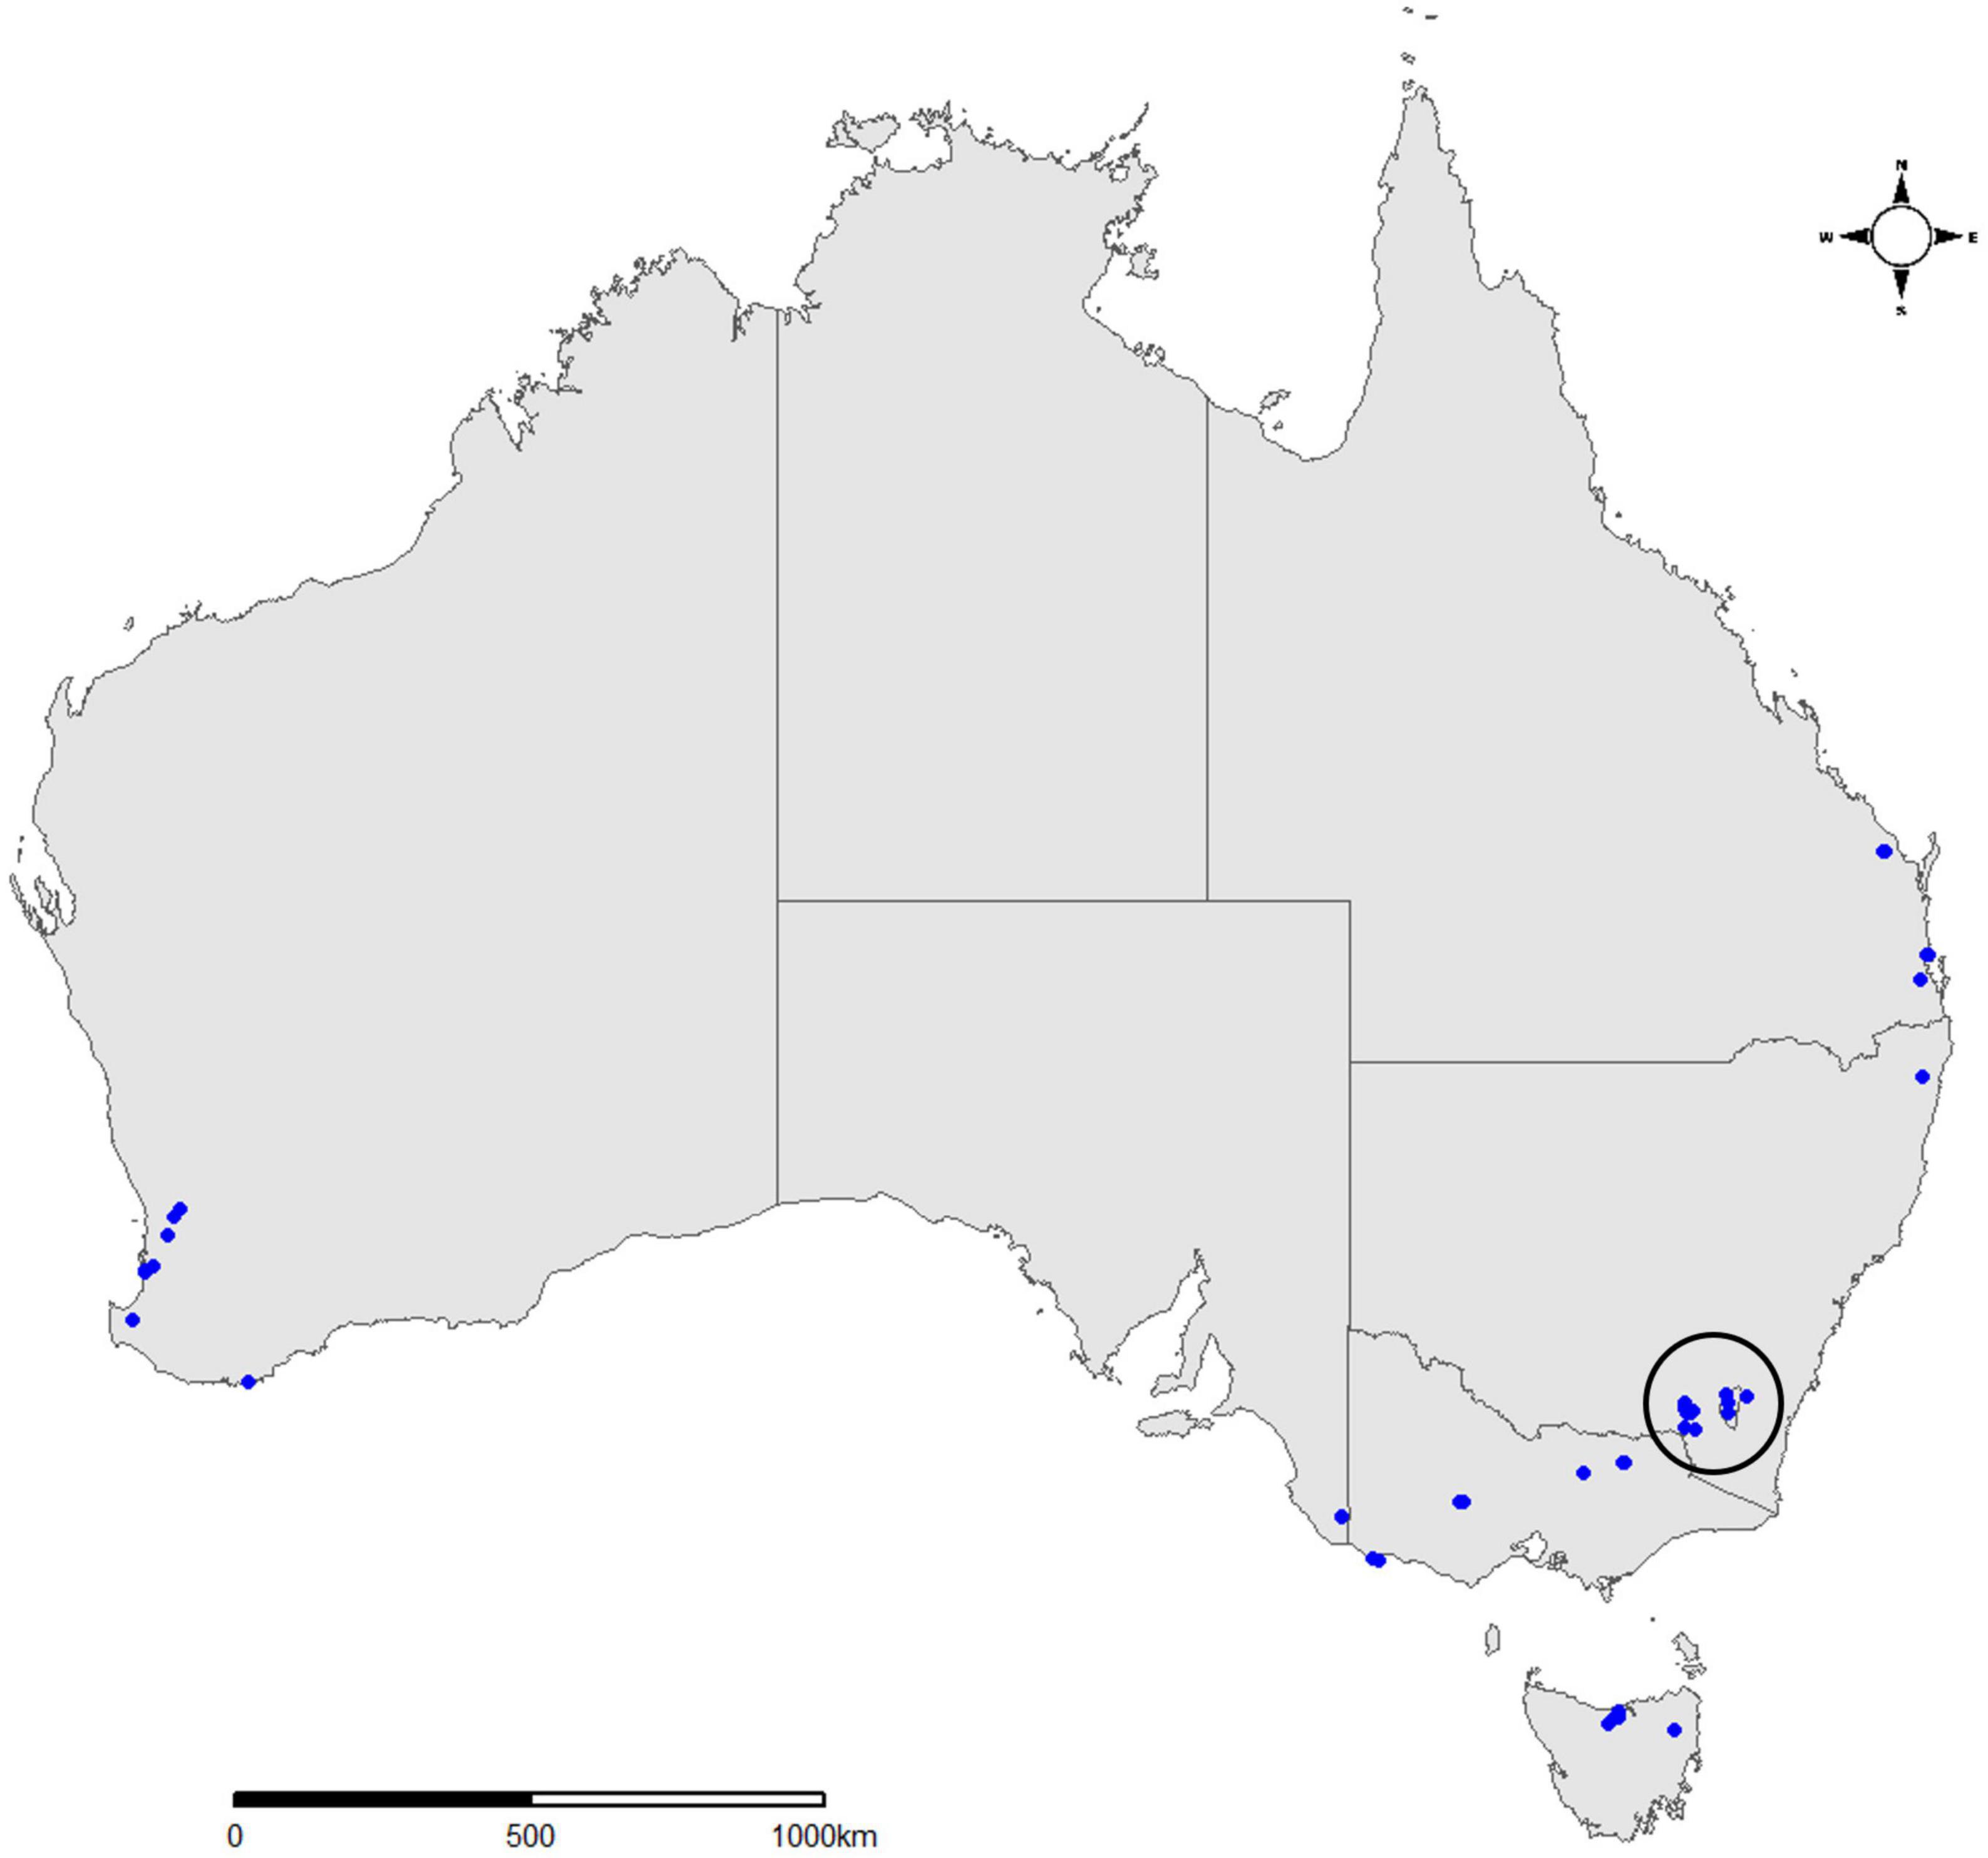
Figure 1. Map of Australia showing 45 sampling locations across seven states and territories from which trap samples were collected during the current study. Samples encircled from the Central Tablelands represent a 15-trap subset used to evaluate sample processing and barcode amplification from forestry surveillance traps. This figure was produced in R using the ggplot2, ggmap, ozmaps and ggsn R packages (Kahle and Wickham, 2013; Wickham, 2016; Sumner, 2021).
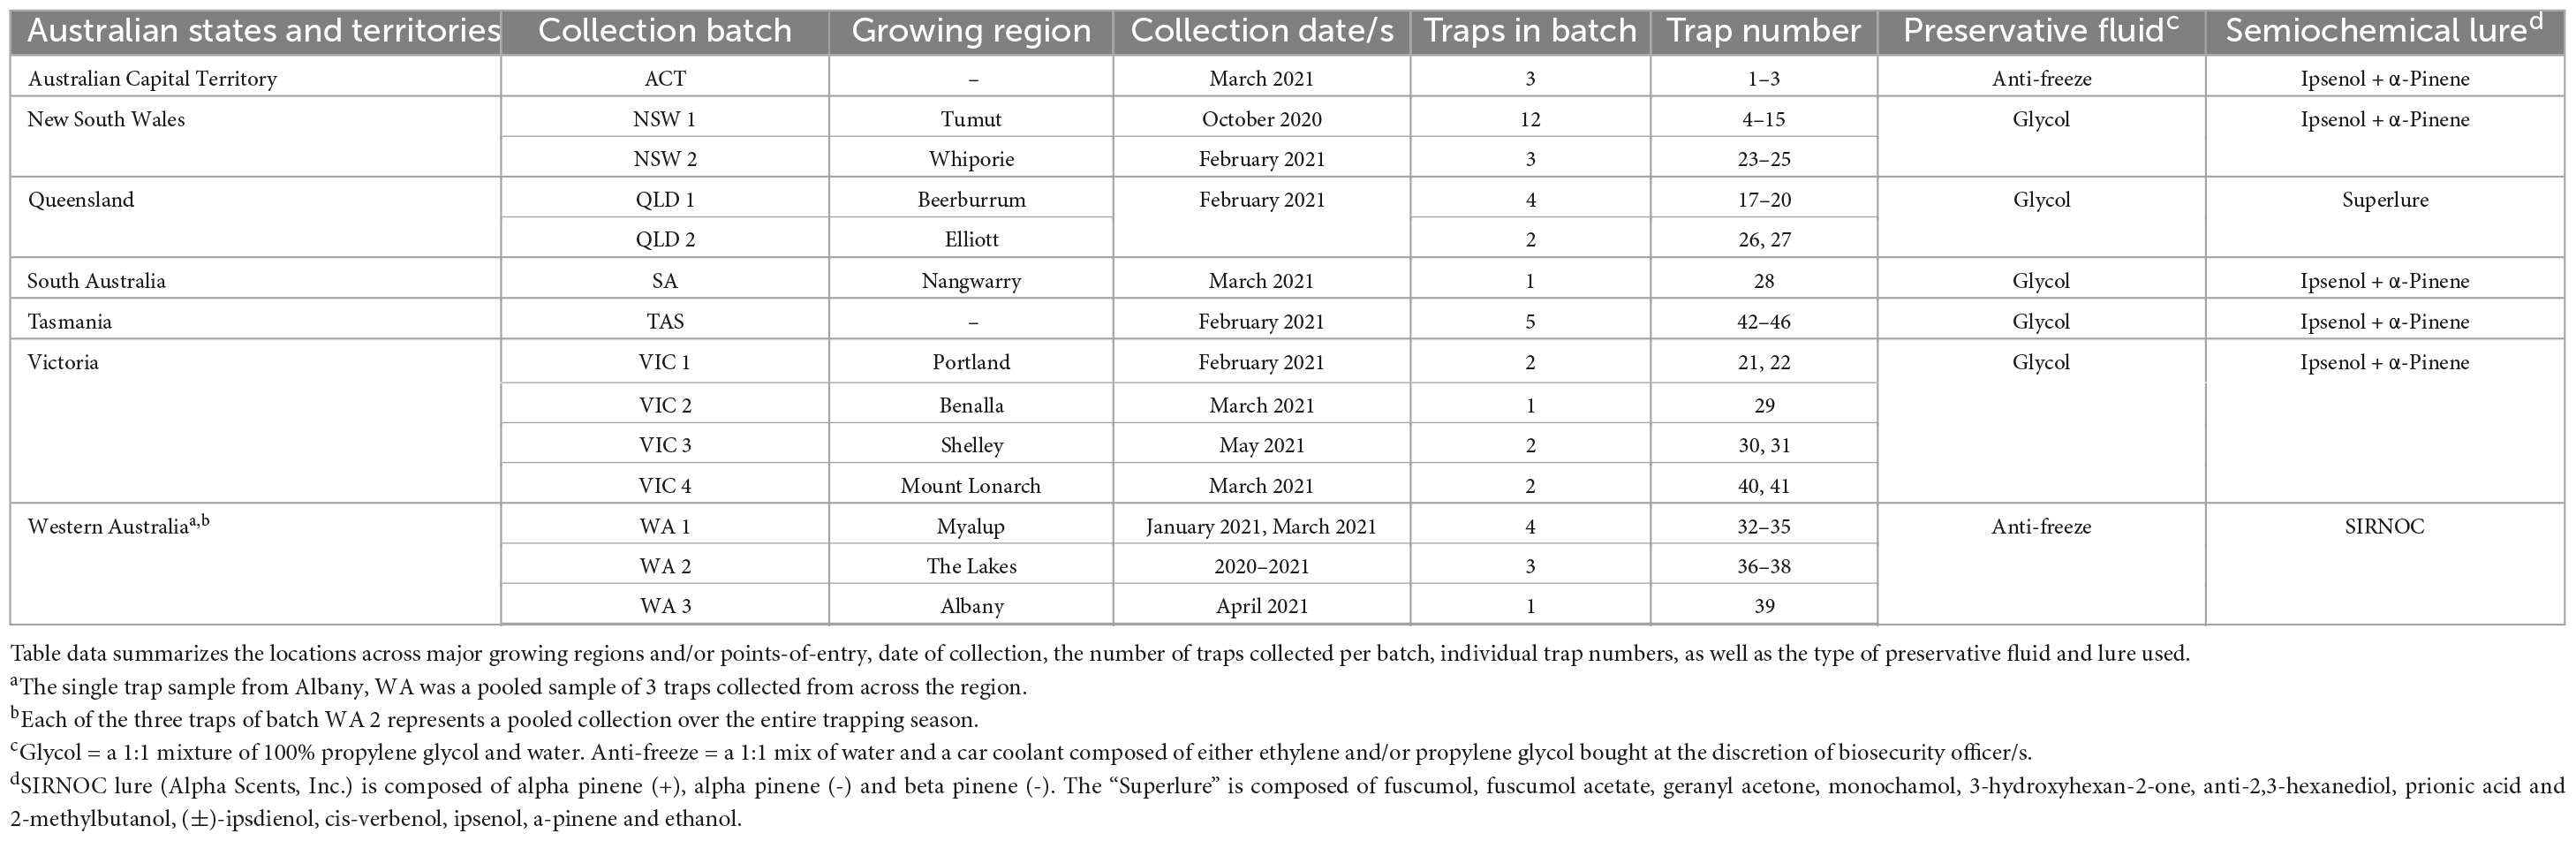
Table 1. Metadata for the trap batches collected and screened in this study.
Bulk trap catches were stored at 4°C for 10 to 17 months until they could be processed. For each trap catch, the sample contents were agitated by swirling and vortexing for 1 min before filtration through a sterile 100 μm Falcon mesh filter (Corning, AZ, USA). This resulted in the division of each trap catch into two subsamples, either comprising of a standardized volume of the preservative fluid (50 ml; excess discarded) or the bulk insect specimens, respectively. Preservative fluid subsamples were vacuum filtered through an EZ-Fit™ Filtration Unit (0.45 μm MCE membrane) using the EZ-Stream™ pump (Merck, Darmstadt, Germany). Vacuum filtration was performed for 5 min per sample or until all 50 ml of the preservative fluid passed through the filter membrane. Membrane filters for each sample were then cut in half using a sterile scalpel blade, with one half being used immediately for DNA extraction and the other stored as a backup at −20°C. Bulk insect specimen subsamples were stored in absolute ethanol at 4°C until DNA extractions and morphological assessment could be performed.
2.2. DNA extractions
DNA extractions were performed on both preservative fluid and bulk insect specimen subsamples in this study. An initial evaluation of sample processing was performed for these trap types using a subset of 15 traps collected from the Southern Tablelands in New South Wales (NSW1; Tumut region, n = 12) and the Australian Capital Territory (ACT; n = 3) (Table 1 and Figure 1). Extractions from preservative fluid subsamples were performed using the DNeasy® PowerSoil® Pro Kit (Qiagen, Hilden, Germany). Membrane filter halves (prepared as described in section “2.1. Trap collection and sample processing”) were suspended in 800 μl of Solution CD1 in PowerBead Pro tubes and incubated at 65°C for 10 min. Filter homogenization and spore lysis was then performed using a FastPrep 24 system (MP Biomedicals, Santa Ana, CA, USA) with the velocity set at 4 m/s for two 30 s cycles. The rest of the protocol followed the manufacturer’s instruction. Extractions performed on bulk insect specimen subsamples were also conducted with the DNeasy® PowerSoil® Pro Kit, however the sample preparation and lysis phase of the protocol was amended to accommodate a non-destructive workflow so that insect specimens could be retained for downstream morphological assessment (Batovska et al., 2021). First, the storage ethanol was removed from each bulk insect specimen subsample using a 1,000 μl pipette followed by air-drying in a laminar flow. After drying, the contents were resuspended in a 10:1 mix of Solution CD1 (800 μl minimum) and Proteinase K (Qiagen; 80 μl minimum) ensuring all insects were thoroughly submerged in the lysis solution. Samples were then vortexed and incubated at 56°C overnight. After incubation, the lysate from each sample was transferred to a PowerBead Pro tube and incubated at 65°C for 10 min with further mechanical lysis performed on the FastPrep system. Bulk insect subsamples containing the voucher specimens were then resuspended in absolute ethanol and stored at 4°C.
2.3. PCR amplification, library preparation and sequencing
Dual-barcode amplicon sequencing was performed as described in Trollip et al. (2022) using adapter-modified primer pairs of ITS1Fngs (5′-GGTCATTTAGAGGAAGTAA-3′) and ITS2ngs (5′-TTYRCKRCGTTCTTCATCG-3′) (Tedersoo et al., 2015, 2018) to target the internal transcribed spacer 1 (ITS1) barcode, and EF1087Fngs (5′-GTTCGAGGCTGGTATCTCC-3′) and EF646Rngs (5’-GTCTCRATACGGCCRAC-3’) (Trollip et al., 2022) to target the translation elongation factor 1-alpha (TEF1α) barcode. PCR amplification was performed independently for each barcode, with three PCR replicates amplified per sample. Successful amplifications were confirmed using gel electrophoresis (2% w/v agarose) before libraries were prepared for Illumina sequencing. Briefly, amplicons were cleaned and normalized using a SequalPrep™ Normalization Plate Kit (Thermo Fisher Scientific, MA, USA) before equal volumes of eluted product from each amplified barcode were pooled according to sample. Dual unique indexes, along with the remainder of the Illumina adapter sequence, were then annealed to each sample’s amplicon pool using qPCR. Indexing reactions consisted of 10 μl of 5 × Phusion HF Buffer (Thermo Fisher Scientific), 1 μl of dNTP mix (10 mM), 1 μl of 1/1,000 SYBR Green I Mix, 0.5 μl Phusion DNA polymerase (Thermo Fisher Scientific), 4 μl of sample-specific indexes (2.5 μM), and 10 μl (5–10 ng template) of sample-pooled amplicon product. Cycling conditions were 98°C for 30 s, followed by seven cycles of 98°C for 10 s, 65°C for 30 s, and 72°C for 30 s. Indexed amplicon libraries were cleaned and normalized for a second time using SequalPrep™, before being pooled equally to generate the final library. Final library QC was performed using a 2200 TapeStation (Agilent Technologies, Santa Clara, CA, USA), with final purifications completed using ProNex® Size-Selective Purification beads (Promega, WI, USA). Sequencing was performed in-house on an Illumina Miseq platform using V3 chemistry (2 × 250 bp) with a 15% PhiX spike-in.
2.4. Bioinformatics and data analysis
Raw sequencing reads were initially demultiplexed according to sample using bcl2fastq v2.2.0, before being further split into each barcode using the PCR primers as indexes with Seal in BBTools v38.9 (Bushnell, 2017). Demultiplexed reads were then trimmed of primers and sequencing adapters using BBDuK (BBTools suite) and filtered according to sequence quality profiles. Any reads and read tails that were determined to be of low-quality [based on expected error models (Edgar and Flyvbjerg, 2015)] or that contained ambiguous bases where removed. Filtered reads were then processed in DADA2 v1.20 (Callahan et al., 2016) with inferred amplicon sequence variants (ASVs) undergoing de novo chimera removal (removeBimeraDenovo). Sequence variants were length filtered (100–450 bp) before an initial taxonomic assignment performed using IDTAXA (Murali et al. (2018); trained on in-house reference sets (Trollip et al., 2022). The TEF1α reference database was expanded in this study to include available fungal sequences from the NCBI RefSeq database (O’Leary et al., 2016). All downstream analysis and data processing was performed using phyloseq v1.36.0 (McMurdie and Holmes, 2013) and tidyverse v1.3.1 (Wickham et al., 2019) R packages. Final ASVs were filtered according to the following criteria for detection: (i) a relative read abundance (RRA) value above the calculated switch rate threshold [determined by estimating the proportion of sequences that switched at both ends of the amplicon (Wilcox et al., 2018)] and (ii) presence in at least 2/3 PCR replicates (Alberdi et al., 2017). Before performing alpha diversity assessments, the breakaway v4.7.6 R package was used to estimate the number of unobserved species across samples, both before and after merging PCR replicates (Willis and Bunge, 2015; Willis et al., 2020). Alpha diversity metrics were then calculated on the merged datasets (i.e., taxa present if in 2/3 PCR replicates) using phyloseq, with breakaway and the DivNet v0.4.0 R packages used for hypothesis testing and batch-wise comparisons (Willis and Martin, 2022). Linear mixed-effect models [betta and bettarandom (Willis et al., 2015, 2017)] were used to test if any observed differences in the alpha diversity could be explained by the time traps spent in storage, with storage time considered a fixed effect and the collection batches considered random effects. All statistical analyses and figures were conducted or generated within the R v4.1.0 programming environment using the software listed above (R Core Team, 2013; Wickham, 2016). Finally, Ophiostomatales-specific ASVs were further curated in Geneious Prime® where additional reference-based chimera filtration was performed with UCHIME v4.2.40 and USEARCH v8.1 (Edgar, 2010). The remaining Ophiostomatales ASVs were aligned to publicly available reference sequences using MAFFT v7.450 (Katoh and Standley, 2013), where any remaining artifactual sequences were removed. Species-level taxonomic assignment was determined phylogenetically using RaxML v8.2.11 (Stamatakis, 2014).
3. Results
3.1. Sample processing and barcode amplification
Results from the initial sample processing comparison, performed on the 15 traps collected in Tumut, NSW and the ACT, showed that PCR amplification was most consistent from the preservative fluid DNA extractions compared to the bulk insect specimen subsamples (Table 2). This was consistent for both primer pairs, with the ITS1 primer pair performing most efficiently with successful amplification for all preservative fluid extracts. The TEF1α primer pair had an amplification success rate of 93% on the preservative fluid extracts, however, the efficiency of amplification was deemed lower than the ITS1 as five samples were observed with weak amplification (Table 1 footnote). For the bulk insect specimen sub-samples, PCR amplification was far less consistent with success rates of 40% for ITS1 and 20% for TEF1α. Additional PCR attempts were made using diluted template (1/10 and 1/100) to try and improve the recovery of amplicons; however, amplification remained unsuccessful (data not shown). Due to this, PCR amplification and sequencing of the remaining samples was performed on the preservative fluids only. Amplification results for the expanded dataset were consistent for the ITS1 barcode in 45/45 samples and the TEF1α barcode in 44/45 samples. The PCR efficiency of the TEF1α primer pair was again deemed lower than that of the ITS1 pair, with nine of the samples observed to have weaker amplification (data not shown).
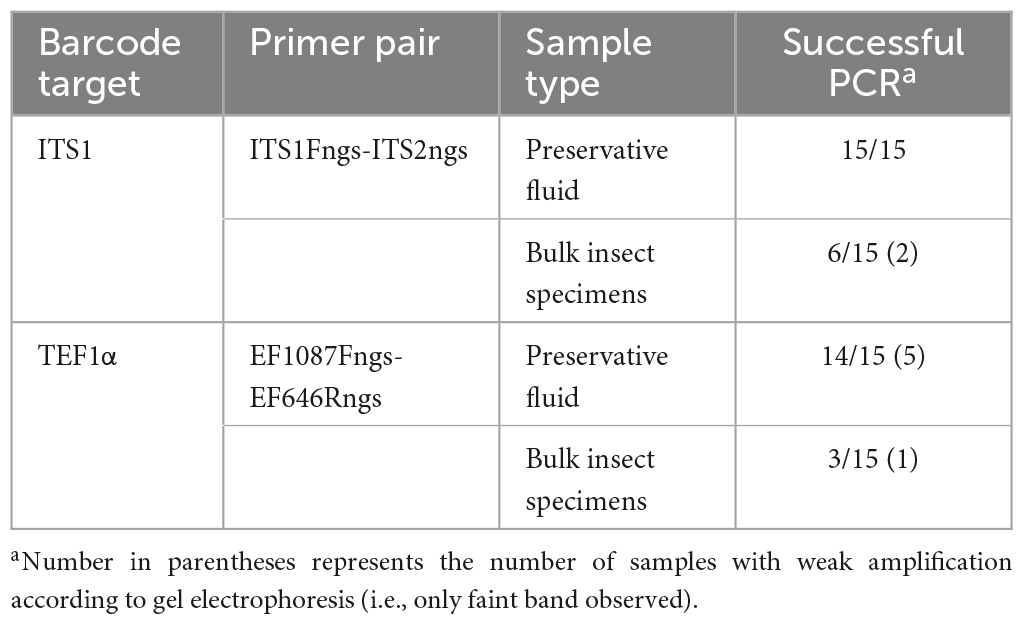
Table 2. PCR amplification success of preservative fluid and bulk insect specimen subsamples performed on the initial 15 trap subset sourced from Tumut, NSW (NSW1) and the ACT.
3.2. Fungal composition of forest surveillance traps
A total of 21,205,095 reads were demultiplexed from the MiSeq run, with 10,151,570 ITS1 reads and 1,443,255 TEF1α reads recovered after quality filtering. Read distributions differed for the two barcodes with 73,562 (±35,027 SD) ITS1 sequences and 10,852 (± 6,258 SD) TEF1α sequences recovered per sample. Reads assigned to an unclassified Malassezia ASV were detected in one of the blank extractions and the contaminant was subsequently removed from the dataset. For each sample, the number of observed ASVs was within the bounds of the species richness projections from breakaway, confirming appropriate sequencing depths were achieved (Supplementary Tables 1, 2). After merging PCR replicates and accepting only detections present in 2/3 replicates, a total of 3,422 and 1,683 ASVs were recovered for the ITS1 and TEF1α datasets, respectively. The observation counts of ASVs remained at 81 ± 13% per sample for the ITS1 dataset, and 55 ± 13% per sample for the TEF1α dataset (Supplementary Tables 1, 2) after merging.
The ITS1 dataset provided the most complete characterization of the fungal communities caught within the forest surveillance traps, where a total of 29 classes and 465 genera were identified. The top 10 most abundant fungal classes were the Dothideomycetes (Lowest 0.02 – (Mean 23.49 ± 16.44) – Highest 64.93%), Saccharomycetes (0.04 – (21.39 ± 28.78) – 99.20%), Tremellomycetes (0.04 – (12.82 ± 13.41) – 46.40%), Sordariomycetes (0.003 – (8.55 ± 14.13) – 87.75%), Cystobasidiomycetes (0.006 – (9.20 ± 12.99) – 55.52%), Eurotiomycetes (0.02 – (5.96 ± 7.30) – 35.07%), Agaricomycetes (0.001 – (4.50 ± 7.00) – 32.95%), Microbotryomycetes (0.04 – (8.27 ± 15.62) – 79.46%), Leotiomycetes (0.002 – (2.22 ± 4.01) – 19.12%), and the Pezizomycetes (0.01 – (7.04 ± 18.47) – 91.53%) (Figure 2A). Alpha diversity comparisons revealed significant differences in the observed richness and Shannon diversity explained by both storage time and collection batch, however the effect of storage time was only minor when collection batch was accounted for as a random effect (Estimated decrease in richness after storage of 0.67 ± 0.06, p < 0.001; Shannon diversity decrease after storage of 0.003 ± 0.0001, p < 0.001) (Supplementary Tables 3, 4). Batch–wise comparisons revealed that traps collected in NSW1 (Richness: 165.01 ± 32.68; Shannon diversity: 2.82 ± 0.02; both with p < 0.001), TAS (Richness: 163.00 ± 45.34, p = 0.001; Shannon diversity: 1.86 ± 0.32, p < 0.001), VIC1 (Richness: 152.82 ± 71.69, p < 0.05; Shannon diversity: 1.10 ± 0.54, p < 0.001), VIC2 (Richness: 87.27 ± 102.05, p < 0.05; Shannon diversity: 2.47 ± 0.52, p = 0.05), and VIC4 (Richness: 74.44 ± 71.69, p = 0.001; Shannon diversity: 0.44 ± 0.60, p < 0.001), contained significantly fewer species and lower diversity than the ACT (Figure 2B), while only NSW2 (Richness: 435.97 ± 58.53, p < 0.05) exhibited greater richness (Supplementary Tables 3, 4).
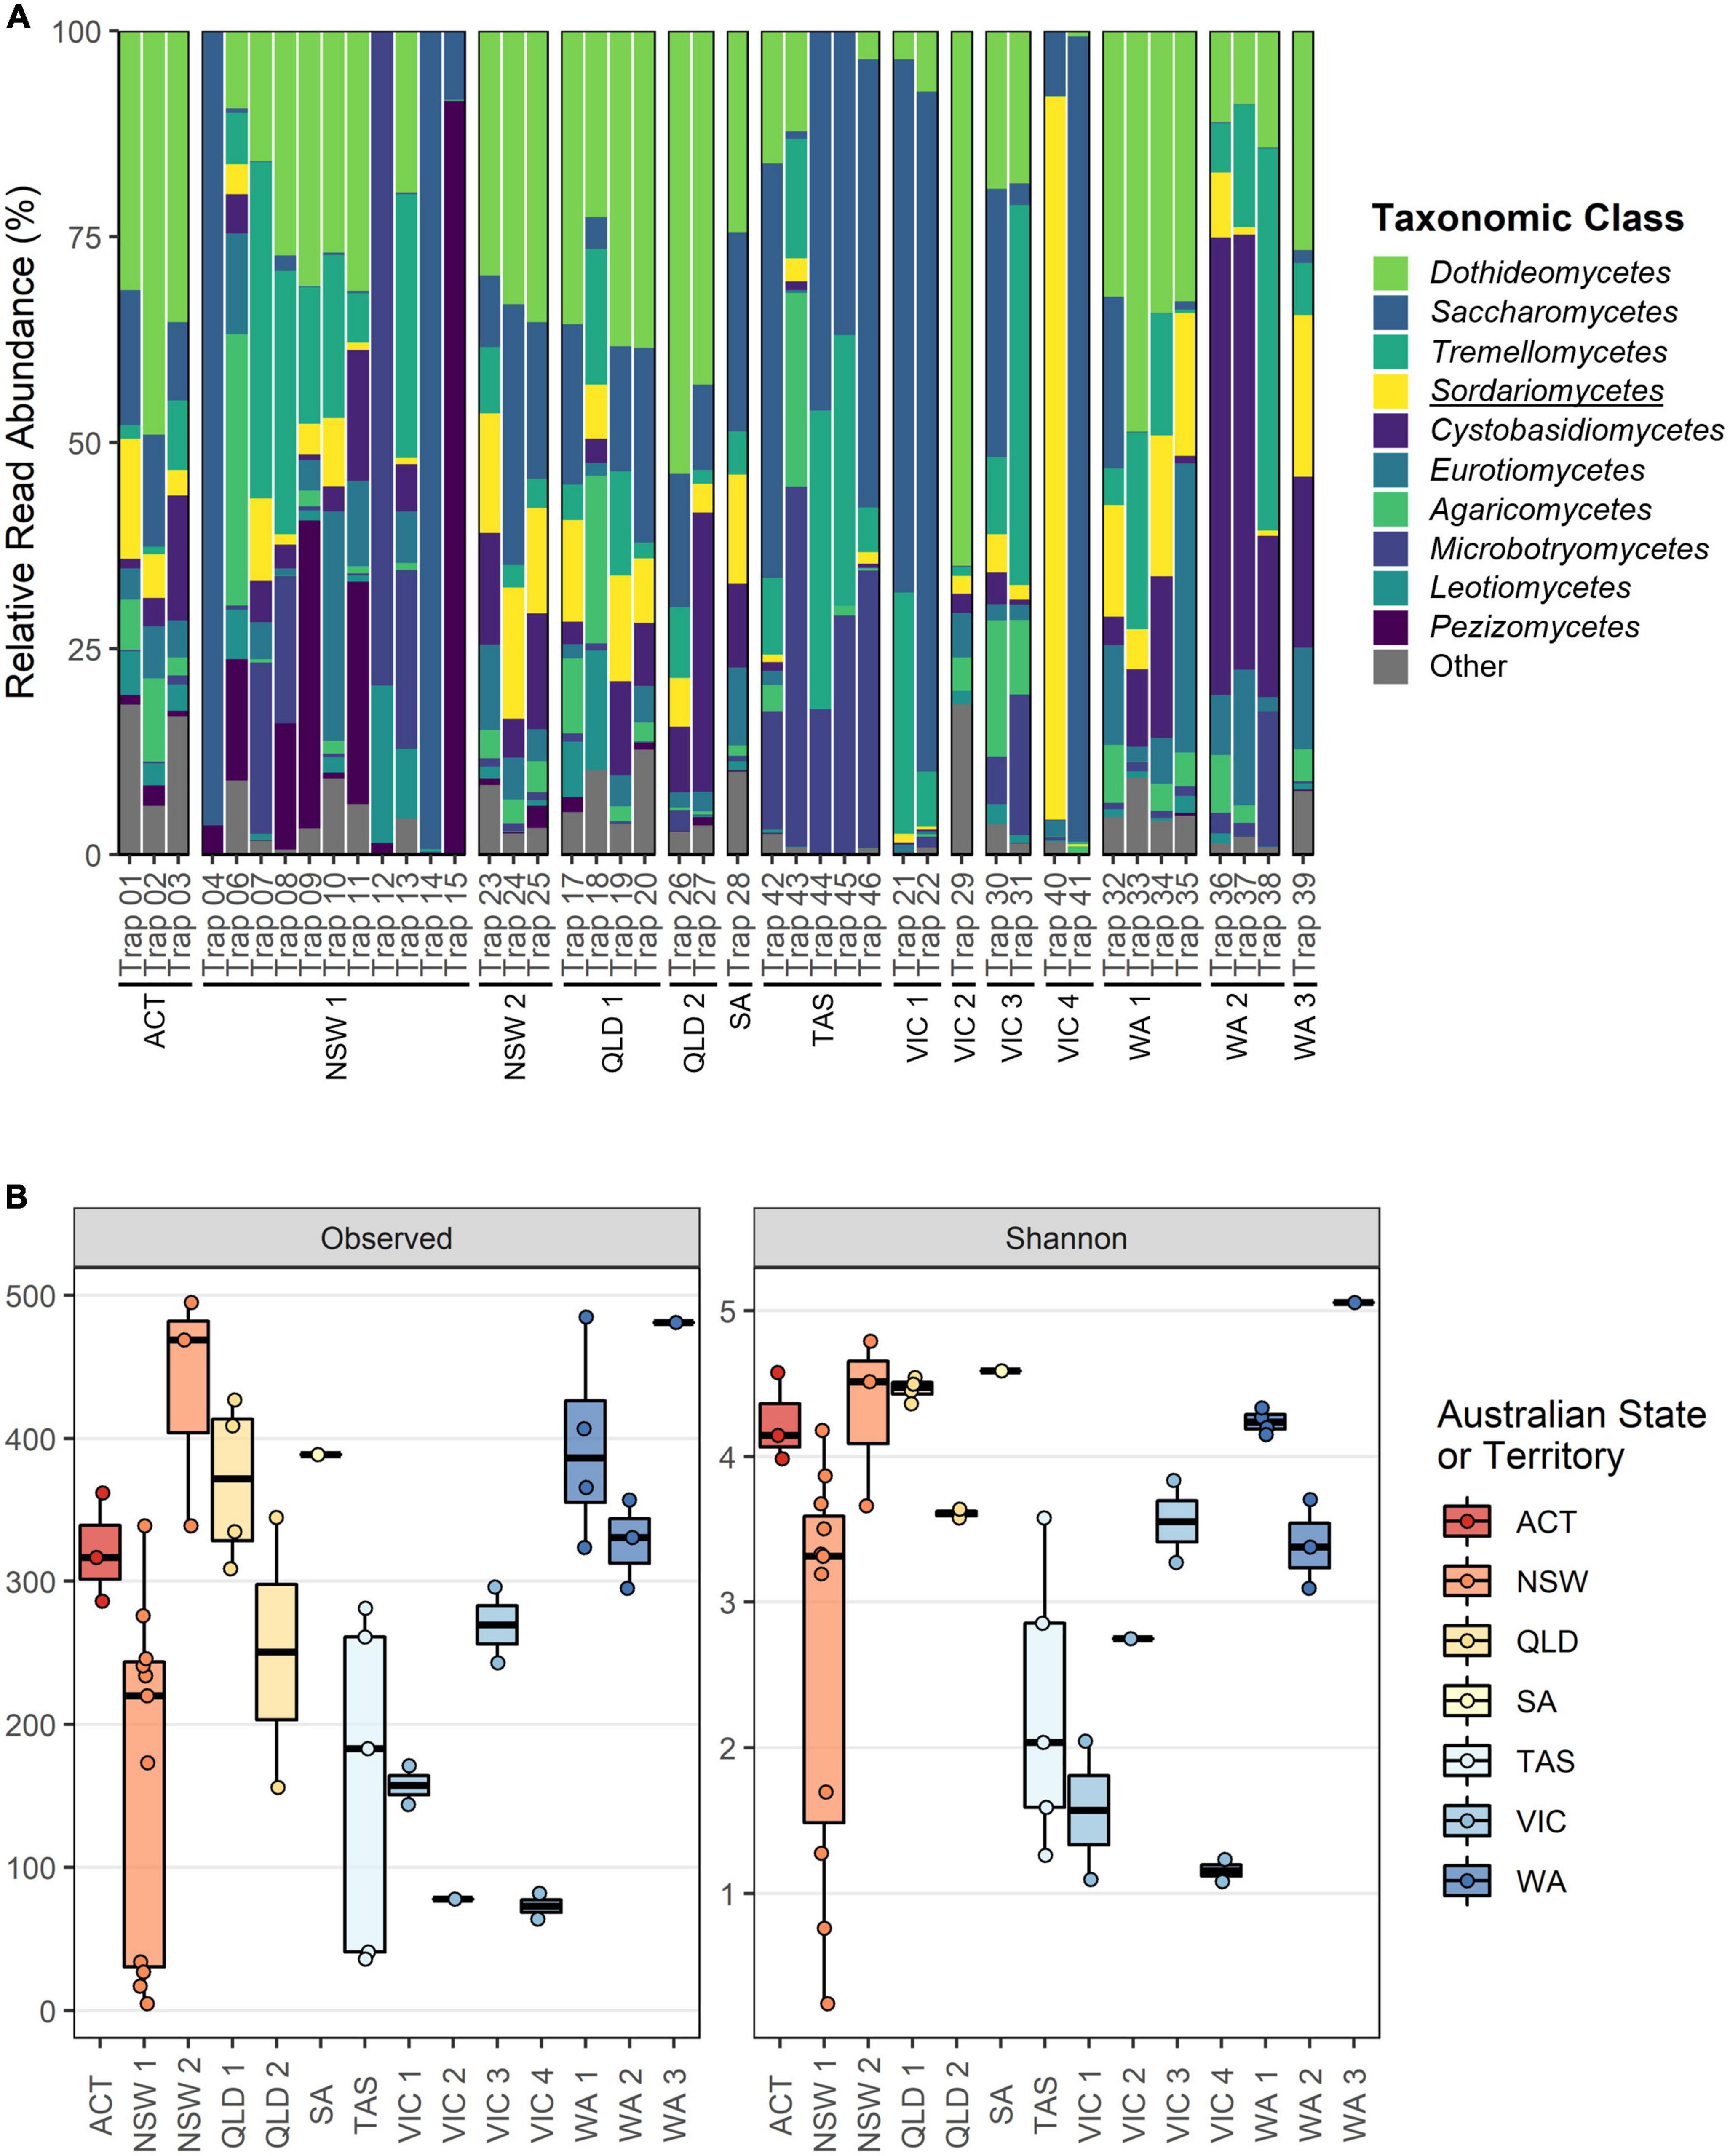
Figure 2. Overview of fungal class composition and alpha diversity metrics for the ITS1 dataset separated according to collection batch. (A) Relative read abundance (RRA) of the top 10 taxonomic classes. All taxa outside of the top 10 and any unclassified ASVs have been grouped under “Other.” The class wherein the targeted Ophiostomatales reside is underlined. (B) Observed richness and Shannon diversity metrics with batches colored according to Australian State or Territory.
Taxonomic classification was more difficult for the TEF1α dataset where a large proportion of reads remained unclassified at the fungal class rank within each sample (Figure 3A). Despite this, our current TEF1α reference database allowed for the recovery of Sordariomycetes (0.43 – (14.34 ± 16.50) – 75.56%), Dothideomycetes (0.07 – (11.26 ± 20.02) – 80.26%), Eurotiomycetes (0.28 – (21.54 ± 40.16) – 81.76%), Exobasidiomycetes (0.53 – (1.70 ± 1.66) – 2.87%), Taphrinomycetes (0.21 – (0.57 ± 0.45) – 1.08%), and Leotiomycetes (0.10 – (0.11 ± 0.004) – 0.11%). Alpha diversity assessments for the TEF1α merged dataset again exhibited minor but significant effects of storage time when the collection batch was treated as a random effect (Estimated richness decrease after storage of 0.36 ± 0.02, p < 0.001; Shannon diversity increase after storage of 0.02 ± 0.0002, p < 0.001) (Supplementary Tables 5, 6). Batch-wise comparisons in the TEF1α dataset showed greater richness for the traps collected in NSW2 (91.33 ± 16.16, p < 0.05), SA (120.53 ± 28.10, p < 0.05), TAS (119 ± 13.54), VIC1(107.84 ± 19.79), VIC3 (136.55 ± 20.65), WA1 (93.72 ± 13.99, p = 0.005), WA2 (95.71 ± 18.78, p < 0.05), and WA3 (144.24 ± 28.07, p = 0.001) (Supplementary Table 5). While Shannon diversity estimates in the TEF1α dataset appear to be lower for traps collected from NSW1, QLD1, QLD2, VIC2, and VIC4 (Figure 3B), batch-wise comparisons of diversity were inconsistent possibly due to the targeted and filtered nature of this dataset (data not shown; Supplementary Table 6).
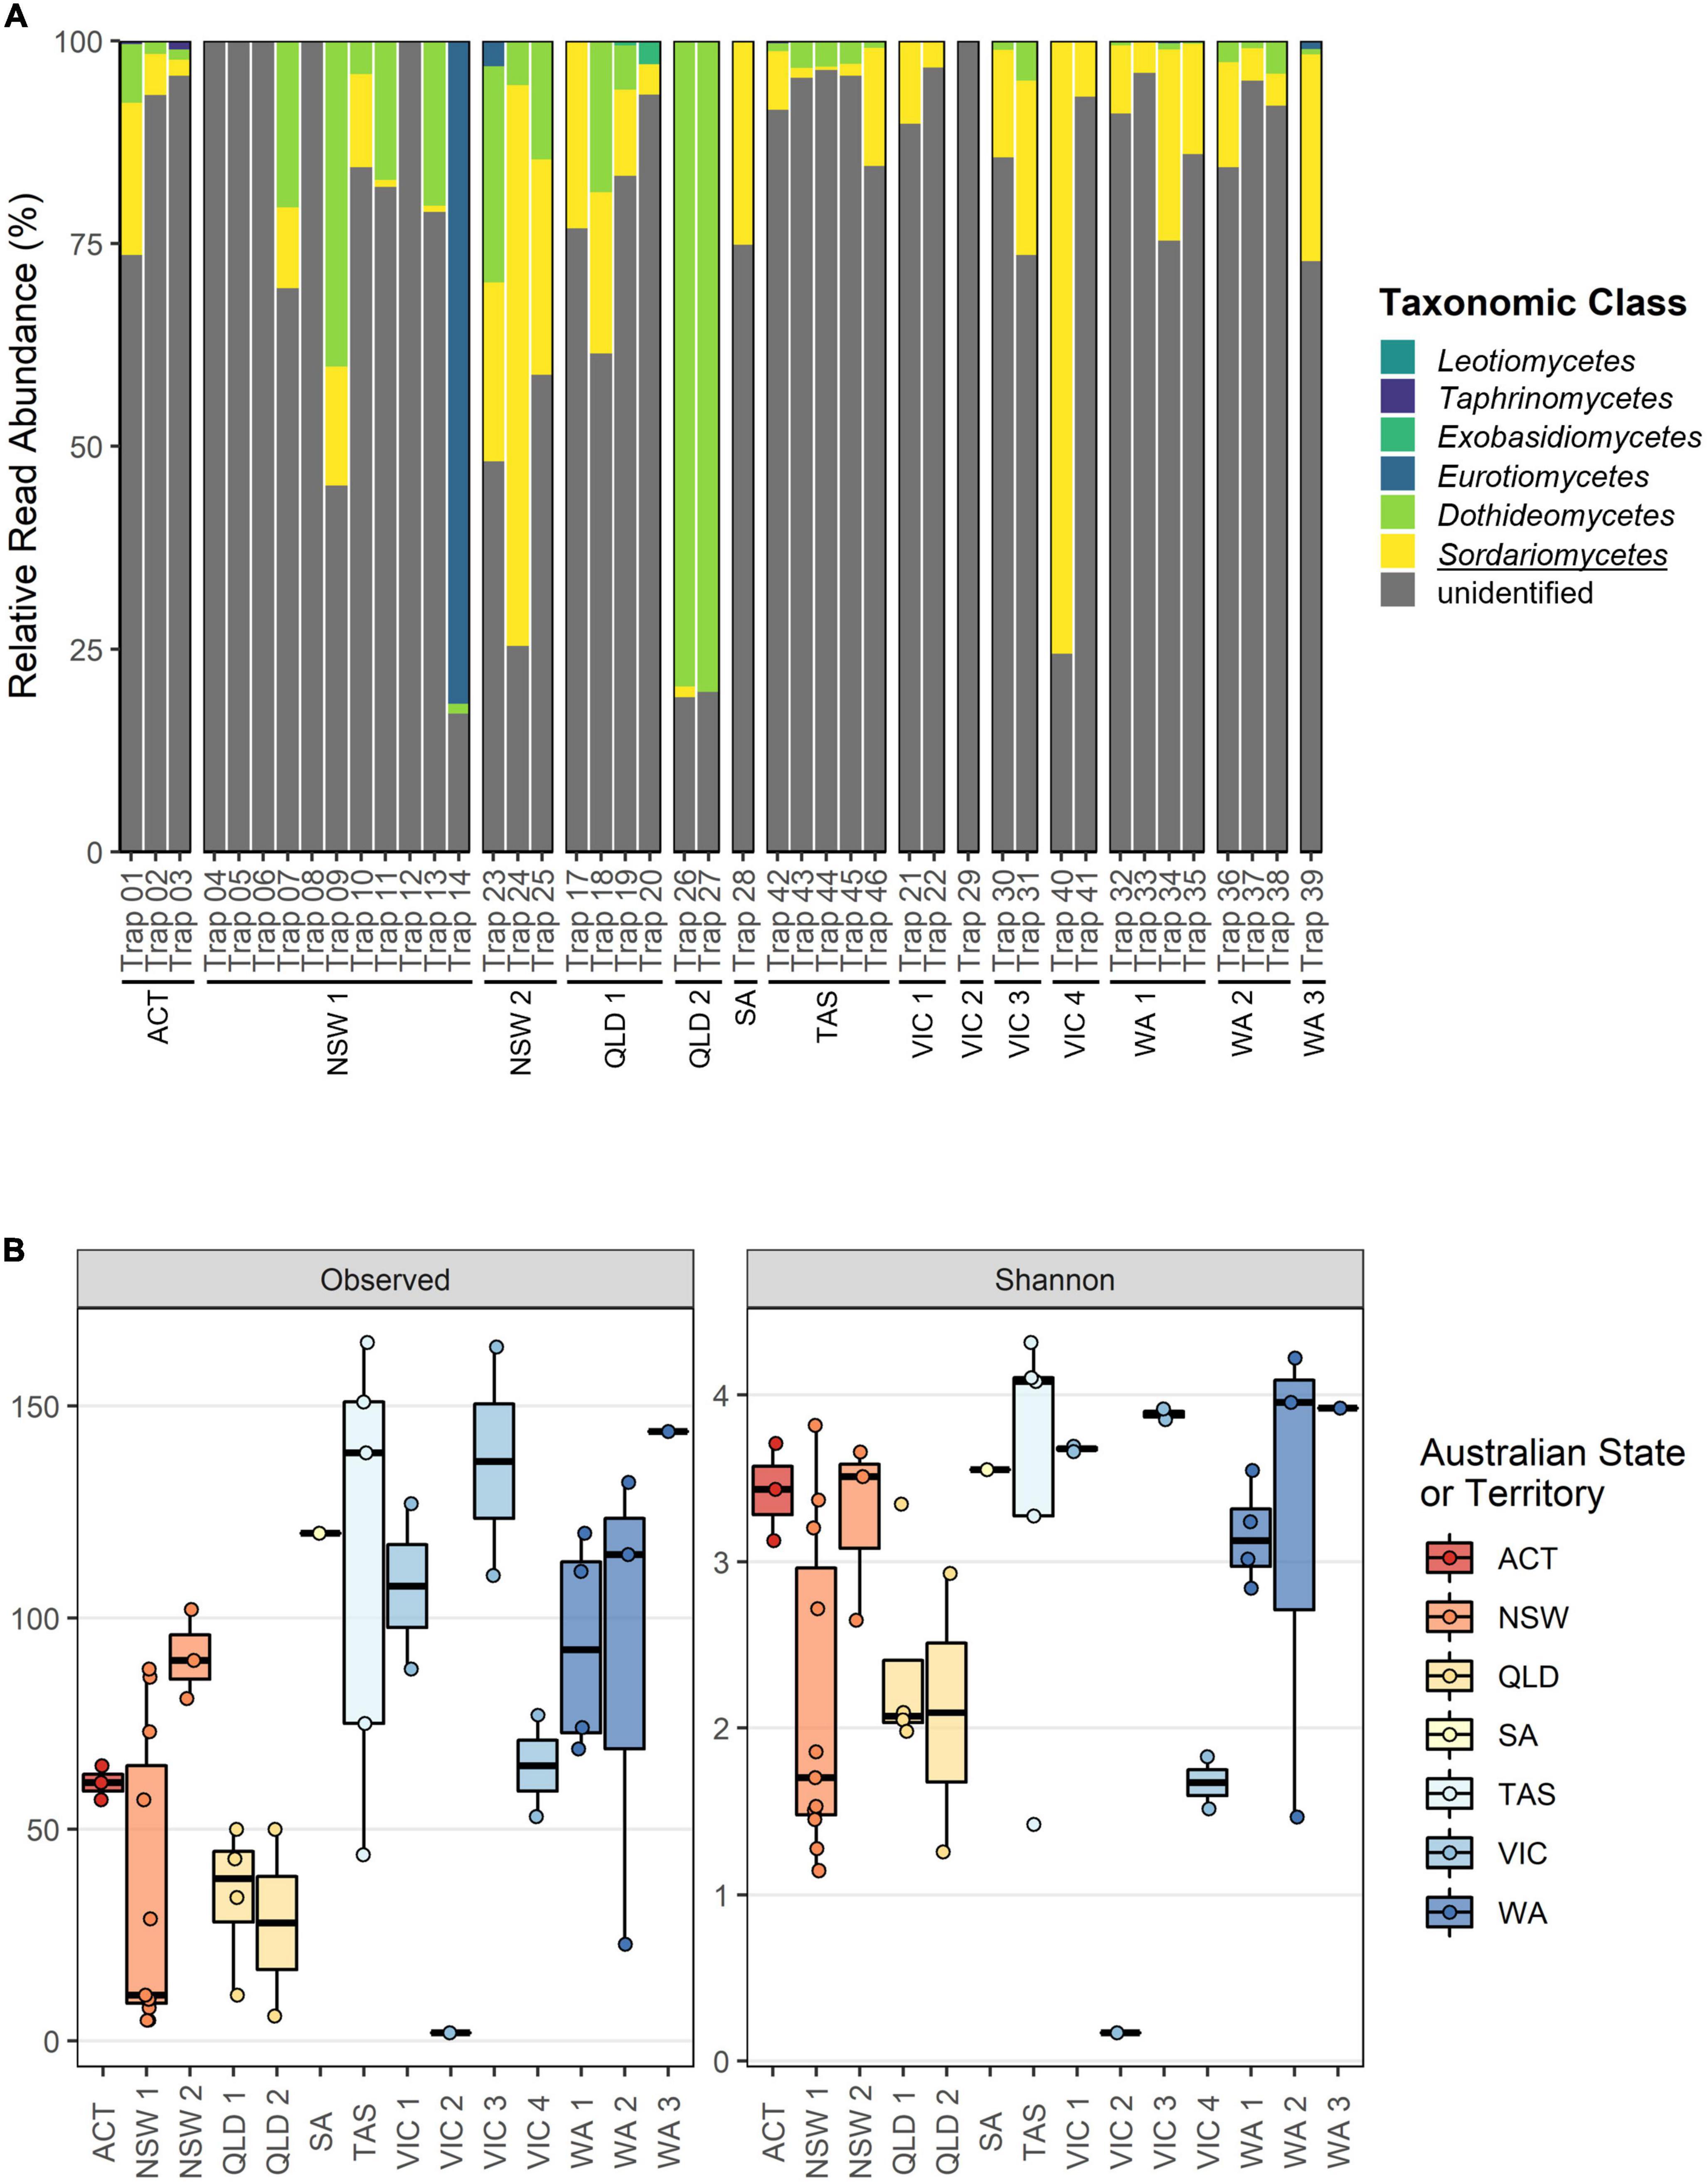
Figure 3. Overview of fungal class composition and alpha diversity metrics for the TEF1α dataset separated according to collection batch. (A) Relative read abundance (RRA) at taxonomic class rank. All ASVs have been agglomerated at the class rank, with all unclassified reads grouped as “unidentified.” The class wherein the targeted Ophiostomatales reside is underlined. (B) Observed richness and Shannon diversity metrics with batches colored according to Australian State or Territory.
3.3. Diagnostics of Ophiostomatales species
Ophiostomatales reads were recovered from 23 of the traps surveyed (51%), with 18 traps having Ophiostomatales-positive detections for both barcodes. The proportion of ITS1 reads assigned to the target group ranged from 0.005 to 8.89% (mean = 2.23%, SD = 2.32%) in 22 traps, while the proportion recovered for the TEF1α barcode ranged from 0.11-66.84% (mean = 11.99%, SD = 15.44%) in 19 traps. Following downstream processing and phylogenetic analysis, sixteen unique ITS1 ASVs and 22 unique TEF1α ASVs were recovered for the Ophiostomatales. Thirteen Ophiostomatales taxa, detected by 12 and 18 of the ITS1 ASVs and TEF1α ASVs, respectively, have previously been recorded and are known from culture in Australia (Table 3 and Supplementary Figures 1, 2). These included a Ceratocystiopsis sp. (Taxon 1; Trollip et al. (2021)), Graphilbum ipis-grandicollis, Gra. cf. rectangulosporium [Taxon 4; Trollip et al. (2021)], Leptographium huntii, L. radiaticola, Masuyamyces pallidulus, Ophiostoma angusticollis, Ophiostoma fasciatum, O. ips, Ophiostoma tsotsi, Raffaelea deltoideospora, Sporothrix stenoceras, and S. pseudoabietina (Nkuekam et al., 2011; Trollip et al., 2021; Farr and Rossmann, 2022). The remaining eight unique ASVs (four for ITS1 and four for TEF1α) correspond to taxa that have not been recorded in Australia. Here, we treated each novel ASV as an independent detection until more evidence can be gathered to link independent barcodes to a single taxon (i.e., a fungal culture). The eight novel eDNA sequences detected correspond to two previously described taxa [Dryadomyces sulphureus (= Raffaelea sulphurea) and the invalidly named Hawksworthiomyces sequentia ENAS (de Beer et al., 2016b)], five potentially novel or undescribed taxa (Ceratocystiopsis sp. AUS2-ITS1, Ceratocystiopsis sp. AUS3-TEF1α, Hawksworthiomyces sp. AUS1-TEF1α, Sporothrix sp. AUS1-ITS1, Sporothrix sp. AUS2- TEF1α) and one taxon that cannot be distinguished using the ITS sequence alone (Grosmannia sp. AUS1-ITS1).
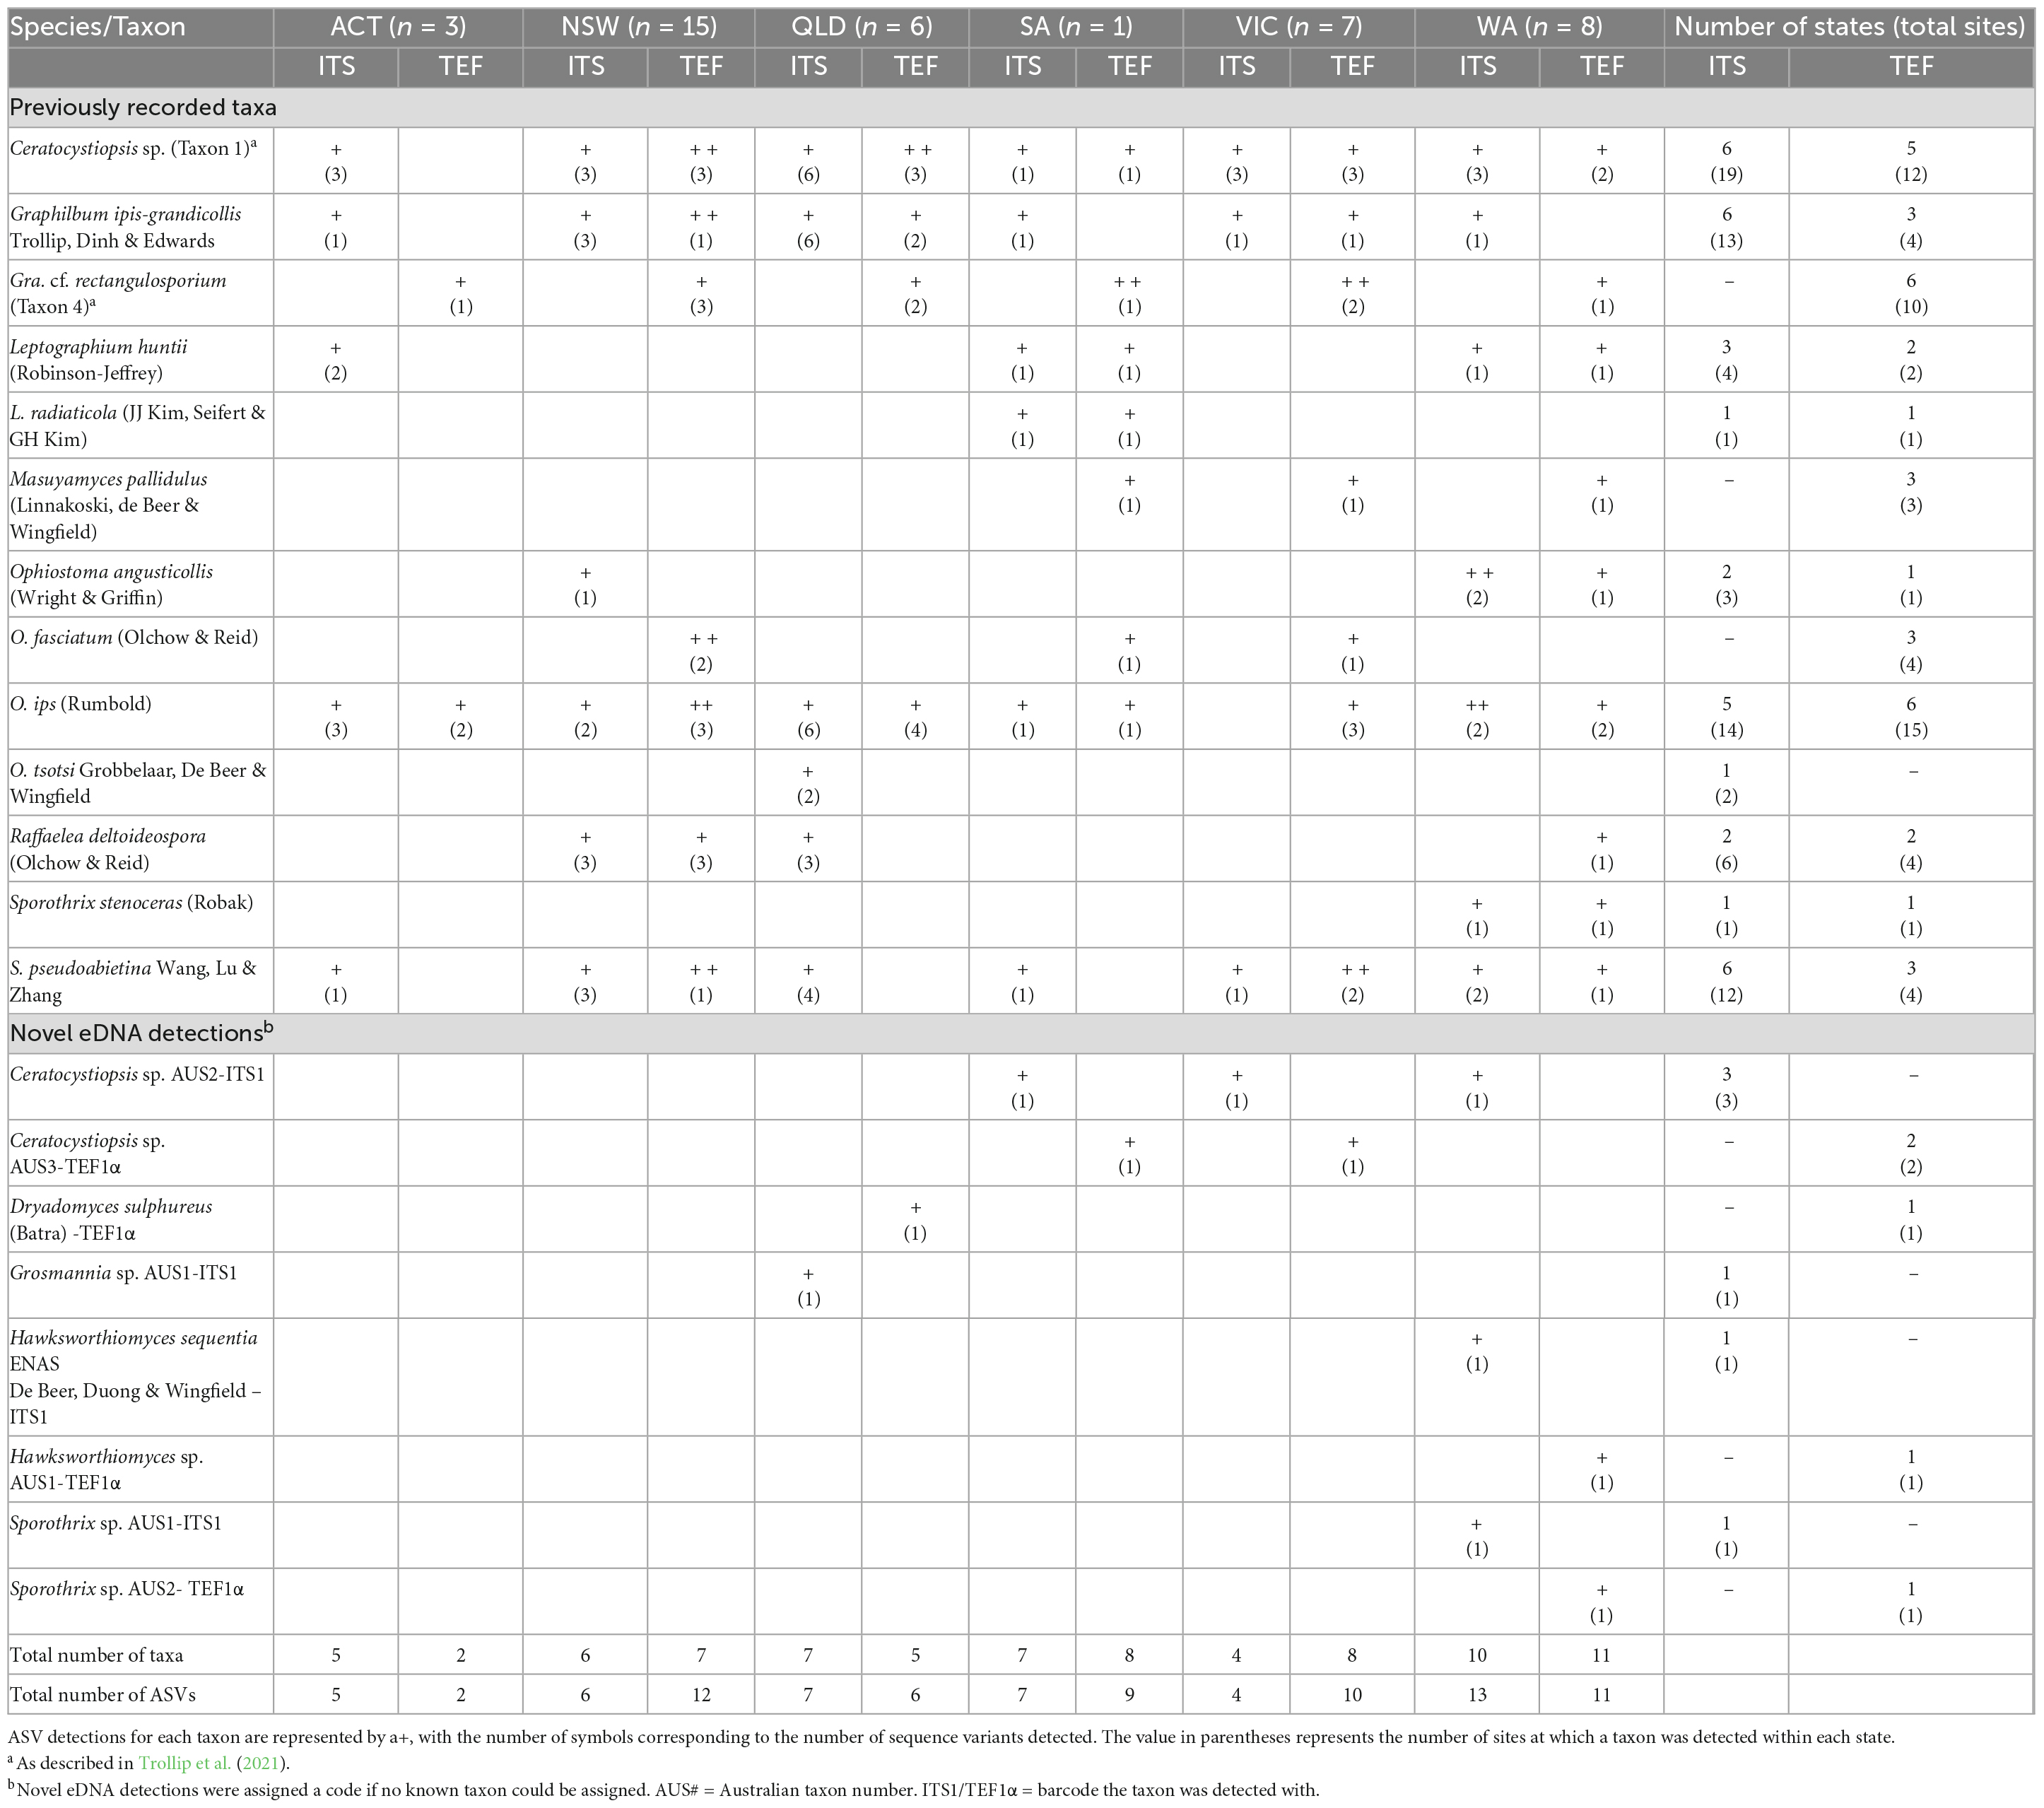
Table 3. Detections of Ophiostomatales taxa from surveillance traps collected across mainland Australia.
The most common Ophiostomatales taxa detected included Ceratocystiopsis sp. 1 (Taxon 1), O. ips, S. pseudoabietina, Gra. ipis-grandicollis, and Gra. cf. rectangulosporium, which were detected across all 6 mainland states and territories sampled (Table 3). For these, the ITS barcode detected the Ceratocystiopsis sp. (Taxon 1) in 19 sites, Gra. ipis-grandicollis in 13 sites, and S. pseudoabietina in 12 sites across all regions, while O. ips was not detected in Victoria and Gra. cf. rectangulosporium was not detected by this barcode. The TEF1α barcode detected O. ips in 15 sites and Gra. cf. rectangulosporium in 10 sites across all states, with the Ceratocystiopsis sp. (Taxon 1) (12 sites) not recovered in the ACT, and Gra. ipis-grandicollis and S. pseudoabietina both found in only four sites across three of the states (Table 3). The remaining detections were less common, where only L. huntii, M. pallidulus, O. angusticollis, O. fasciatum, R. deltoideospora, Ceratocystiopsis sp. AUS2-ITS1 and Ceratocystiopsis sp. AUS3-TEF1α were observed from more than a single site. No Ophiostomatales ASVs were detected in the Tasmanian traps collected during this study.
4. Discussion
The modular, multi-barcode amplicon sequencing approach implemented in this study demonstrates the utility of high throughput sequencing for diagnostics of fungal phytopathogens caught within insect surveillance traps. These results are consistent with previous studies in the rapidly expanding field of metabarcoding for biosurveillance. Notably, by using a validated pipeline for improved diagnostics of the Ophiostomatales (Trollip et al., 2022), we were able to accurately characterize the Ophiostomatales sequences captured in forestry surveillance traps from across Australia. This dataset represents the largest geographic survey targeting the Ophiostomatales in Australia to date, revealing novel eDNA sequences while establishing a baseline for the target group within Australian Pinus plantations. Additionally, our results highlight aspects of the protocol that require further investigation and optimization to ensure sensitivity and reproducibility when implementing high-throughput sequencing approaches within post-border surveillance systems.
A primary objective of this study was to investigate how sample processing might impact on the recovery of fungal DNA from insect traps during surveillance activities. Considering that the traps are currently used to monitor insect pests, our methodology focused on speed, scalability, and compatibility for targeting phytopathogens, and consequently incorporated non-destructive approaches when working with the insect specimen subsamples. Previous studies have established that semiochemical-baited insect traps are effective for fungal surveillance, whether sampling the preservative fluids alone (Tremblay et al., 2018, 2019; Berube et al., 2022) or through destructive sampling of the insect-specimens (Malacrino et al., 2017; Miller et al., 2019; Rassati et al., 2019). To our knowledge, however, the impact on recovering targeted fungi from insect trap subsamples (i.e., extracting from preservative fluids vs. insect specimens) is yet to be assessed. In this study we were able to consistently recover sequenceable amplicons from the preservative fluids, whereas the results of the non-destructive extractions were less reliable despite using a universally recommended DNA extraction kit (Lear et al., 2018). This may be explained by a combination of different factors, including variabilities in substrate composition (Lindahl et al., 2013), differences in insect biomass and tissue types impacting on spore recovery (Aguayo et al., 2018; Martoni et al., 2022), as well as degradation (Weigand et al., 2021; Tedersoo et al., 2022). For instance, the Tumut region (NSW1) recorded 200–300 mm of rainfall for October 2020 (Bureau of Meteorology, 2020) which could have reduced the efficacy of insect specimen preservation through dilution (Martoni et al., 2021; Weigand et al., 2021).
Due to the inability of recovering sequencable amplicons from the insect subsamples, we were unable to address our initial objective of comparing the different subsampling approaches. Our results do, however, substantiate the utility of preservative fluids for forest surveillance activities. This substrate provides a consistent and stable source from which to sample when targeting fungi and other microbes, allowing for standardization of an approach that extends beyond only screening for insect-vectored pathogens (Berube et al., 2022). While both the anti-freeze and glycol mixtures used in the current study showed no apparent difference in their efficacy for long-term storage (>300 days at 4°C), further investigation is needed to test for within sample differences that might exist for these substrates. Optimization and standardization of sampling materials and protocols is important for ensuring no significant bias is introduced by different collectors or across states, especially if HTS is to be implemented routinely within post-border surveillance activities (Nilsson et al., 2019; Martoni et al., 2022). Additionally, future research efforts should continue to optimize the non-destructive approach investigated in this study as this would improve our understanding of fungal community differences when extracting from preservative fluids vs. insect specimens for forestry surveillance. This is particularly important for ensuring that sampling approaches are compatible for both entomologists and pathologists, while remaining appropriate for the biology of any chosen targets. For example, bark and ambrosia beetles are known to have complex interactions with fungi, in some cases carrying them in specialized structures known as mycangia which can be positioned internally or externally (Six, 2012). It is currently unknown whether the non-destructive or preservative fluid extractions will obtain DNA of all fungal associates of these beetles, including those that reside in internal mycangia. Ensuring that the extraction methods appropriately “capture” all fungal associates within the trap is critical for the analytical sensitivity of these diagnostic tools. In the longer term, using methodologies that retain voucher specimens of captured insects is especially important for regulatory agencies looking to use high-throughput sequencing approaches (Martins et al., 2019; Batovska et al., 2021), while continued harmonization of sampling methods and laboratory protocols will unlock opportunities to monitor and compare communities from a more holistic viewpoint (Jactel et al., 2020).
In this study, targeted surveillance for the Ophiostomatales resulted in the detection of 13 taxa already known to be present in Australia, along with eight novel eDNA sequences from taxa not previously recorded. Naturally, the high-throughput approach used in this study uncovered greater diversity than observed in recent surveys across south-eastern Australia, where several first records were found through traditional diagnostics approaches (Trollip et al., 2021). While this is not an unexpected result, because the surveillance conducted in this study covers all major plantation forest regions of Australia and is expected to catch a diverse assemblage of beetles, it does highlight the efficiency and scale with which HTS approaches can be implemented. Ceratocystiopsis sp. (Taxon 1), Gra. ipis-grandicollis, Gra. cf. rectangulosporium (Taxon 4), O. ips, and S. pseudoabietina continue to represent the most common species recorded in Australia to date and are repeatedly found with their vector Ips grandicollis (Trollip et al., 2021, 2022). Our results confirm that the distribution of these fungi extends across all major Pinus growing regions on Australia’s mainland where I. grandicollis is known to occur. The less frequent detections of the Pinus-associated L. huntii, L. radiaticola, M. pallidulus, O. angusticollis, O. fasciatum, and R. deltoideospora are likely explained by the fact they have only previously been isolated from beetle galleries, other less common bark beetles or blue-stained wood chips (Trollip et al., 2021). The last of the previously recorded species included O. tsotsi, detected from two biosecurity surveillance traps in Brisbane, Queensland, and S. stenoceras, recorded from WA’s Albany region. O. tsotsi was first reported in Australia in 2011 where it was isolated from several Eucalyptus spp. (Nkuekam et al., 2011), while S. stenoceras, a ubiquitous fungus, has been recorded from bark beetles and soils globally (de Beer et al., 2016a; Farr and Rossmann, 2022). Noticeably, no Ophiostomatales taxa were observed from Tasmania, where no bark or ambrosia beetles were captured in the traps sampled for this study.
The eight novel Ophiostomatales eDNA sequences reported here should not be surprising considering that most were recorded from regions of Australia where the baseline Ophiostomatales diversity remains understudied. For example, the Ceratocystiopsis sp. AUS2-ITS1 and Ceratocystiopsis sp. AUS3-TEF1α sequences detected in SA, VIC, and WA, indicates the presence of a lineage closely related to Ceratocystiopsis sp. (Taxon 1). Both sequences provide further evidence of a link between the initial morphological records by Stone and Simpson in the late 1980s and an undescribed taxon from Canada (Stone and Simpson, 1987, 1990; Plattner et al., 2009; Trollip et al., 2021). Also, the detections of Dryadomyces sulphureus-TEF1α and Grosmannia sp. AUS1-ITS1 in Queensland are likely explained by the unexplored beetle-fungus associations that are present along the north-eastern coast where beetle assemblages show high species diversity (Stone et al., 2010), which would likely be reflected by their fungal associates. All novel Ophiostomatales eDNA sequences not previously recorded from Australia were considered in a biosecurity context, following guidelines in the Emergency Plant Pest Response Deed (Plant Health Australia [PHA], 2022a), and reported only as an indication of presence until a fungal culture, or taxonomic equivalent, can confirm status. Furthermore, novel ASV sequences should continue to be treated independently, even in cases where both the ITS1 and TEF1α barcodes support the presence of the same taxon or lineage until a culture can properly link them. Future studies should look to address the growing need for systematic surveys of fungus-beetle associations across Australia, particularly focusing on the Ophiostomatales and their insect vectors, if we are to better interpret occurrence patterns or associations that may be detected through environmental sequence data.
While the dual-barcode approach used in this study was primarily focused on the Ophiostomatales, it did allow for some general observations of the overall fungal communities caught within the forest surveillance trap fluids. This was mainly achieved by the ITS1 barcode, which benefits from extensive publicly available sequence data, where the observed fungal communities were largely consistent within each collection batch. The only exceptions were a handful of traps from NSW1 and VIC4 (Figure 2A). The 10 most abundant fungal classes recorded by ITS1 in this study were consistent with previous research efforts that focused on bark beetle associates and are all known to dominate forest ecosystems (Miller et al., 2019). Notably, the TEF1α barcode reported comparable proportions of the Sordariomycetes to ITS1 and demonstrates scope for characterizing diverse fungal communities with this alternative barcode. This is particularly promising considering that, at present, the TEF1α barcoding region described by Stielow et al. (2015) lacks a comparable database to the rRNA region (Meyer et al., 2019), and the primer pair used in this study was predominantly developed on Ophiostomatales reference sequences (Trollip et al., 2022). The TEF1α primer pair shows great potential beyond our current target group as future research looks to amplify multiple barcodes and alternative regions, independent of the rRNA (Cobo-Díaz et al., 2019; Hulcr et al., 2020). Nevertheless, in this study we chose to limit our species-level reporting to the pre-defined target, the Ophiostomatales, on which our current assay was developed and validated (Trollip et al., 2022). Any non-target or incidental detections outside of the scope of our experiment should be treated cautiously (Darling et al., 2020), especially while HTS-based surveillance transitions from general biomonitoring to high-throughput diagnostics. It is imperative that future research efforts continue to strive toward standardized and validated workflows which ensure sensitivity, reliability and confidence for end-users who are required to make informed decisions when using such data (Darling et al., 2020; Lebas et al., 2022; Massart et al., 2022). Multi-barcode amplicon sequencing, specifically using modular workflows (Swift et al., 2018; Piper et al., 2019; Trollip et al., 2022), offers adaptability for high-throughput forest diagnostics. These assays can be tailored for target-, or industry-specific objectives, and by incorporating validated diagnostic barcodes for species of concern, surveillance programs (such as Australia’s NFPSP) could begin to effectively screen against long priority pest lists, rapidly characterize entire disease complexes within a single assay, or survey insect pests and fungal pathogens from within the same surveillance trap.
Data availability statement
The full bioinformatics workflow and required R packages are available at https://alexpiper.github.io/iMapPESTS/local_metabarcoding.html. Representative ASVs of the Ophiostomatales taxa reported in this study are available for the ITS1 (OQ221141- OQ221156) and TEF1α (OQ241187-OQ241208) barcodes. Given that the data generated in this study originated from post-border biosecurity surveillance activities, all raw sequencing data supporting the conclusions of the article will be made available by the authors upon reasonable request.
Author contributions
CT, AC, BR, and JE conceptualized the study. CT, AC, and DS coordinated sample collection. CT performed laboratory work, bioinformatics and statistical analyses with supervision and guidance from AP, JK, FM, QD, and RM. CT wrote the draft manuscript with review and editing from AC, AP, JK, FM, BR, and JE. All authors read and agreed the final version of the manuscript.
Funding
This work was funded through the iMapPESTS project, supported by Horticulture Innovation Australia (grant ST16010) through funding from the Australian Government Department of Agriculture as part of its Rural R&D for Profit program, with funding from 16 partner organizations, including Forest and Wood Products Australia. CT was supported by a La Trobe University Postgraduate Research Scholarship and a La Trobe University Full Fee Research Scholarship at La Trobe University, Victoria, Australia. Funders had no role in the study design, data collection, analysis, writing or the decision to publish.
Acknowledgments
We thank the following for their assistance across various aspects of this study. We thank the forest growers, state agencies, and stakeholders for sharing samples from across Australia: Forestry Corporation NSW (via Matt Nagel and Dave Sargeant, NSW DPI), HQPlantations (via Michael Ramsden), Helen Nahrung (University of the Sunshine Coast), HVP Plantations (via Rudi Hoffman of AgVic, David Joyce and Andrew Bussau of HVP), OneFortyOne Plantations (via Danielle Wiseman), Anji Chandler (Forest Products Commission, WA), Peter Langdon (ACT Parks and Conservation Service), and Sustainable Timber Tasmania (via Nita Ramsden and Karl Wotherspoon). We also thank the entomology unit of Agriculture Victoria’s Crop Health Services for their assistance with beetle identifications when required.
Conflict of interest
DS is currently employed by ArborCarbon.
The remaining authors declare that the research was conducted in the absence of any commercial or financial relationships that could be construed as a potential conflict of interest.
Publisher’s note
All claims expressed in this article are solely those of the authors and do not necessarily represent those of their affiliated organizations, or those of the publisher, the editors and the reviewers. Any product that may be evaluated in this article, or claim that may be made by its manufacturer, is not guaranteed or endorsed by the publisher.
Supplementary material
The Supplementary Material for this article can be found online at: https://www.frontiersin.org/articles/10.3389/ffgc.2023.1149755/full#supplementary-material
References
Aguayo, J., Fourrier-Jeandel, C., Husson, C., and Ioos, R. (2018). Assessment of passive traps combined with high-throughput sequencing to study airborne fungal communities. Appl. Environ. Microbiol. 84, e02637–17. doi: 10.1128/AEM.02637-17
Aguayo, J., Husson, C., Chancerel, E., Fabreguettes, O., Chandelier, A., Fourrier-Jeandel, C., et al. (2021). Combining permanent aerobiological networks and molecular analyses for large-scale surveillance of forest fungal pathogens: A proof-of-concept. Plant Pathol. 70, 181–194. doi: 10.1111/ppa.13265
Alberdi, A., Aizpurua, O., Gilbert, M. T. P., Bohmann, K., and Mahon, A. (2017). Scrutinizing key steps for reliable metabarcoding of environmental samples. Methods Ecol. Evol. 9, 134–147. doi: 10.1111/2041-210x.12849
Bashford, R. (2008). “The development of a port surrounds trapping system for the detection of exotic forest insect pests in Australia,” in New advances and contribution to forestry research, ed. A. A. Oteng-Amoako (Rijeka: InTech), 85–100.
Batovska, J., Lynch, S., Cogan, N., Brown, K., Darbro, J., Kho, E., et al. (2018). Effective mosquito and arbovirus surveillance using metabarcoding. Mol. Ecol. Resour. 18, 32–40. doi: 10.1111/1755-0998.12682
Batovska, J., Piper, A. M., Valenzuela, I., Cunningham, J. P., and Blacket, M. J. (2021). Developing a non-destructive metabarcoding protocol for detection of pest insects in bulk trap catches. Sci. Rep. 11:7946. doi: 10.1038/s41598-021-85855-6
Bebber, D. P. (2015). Range-expanding pests and pathogens in a warming world. Annu. Rev. Phytopathol. 53, 335–356. doi: 10.1146/annurev-phyto-080614-120207
Berube, J., Allison, J. D., Van Rooyen, K., Hughes, C., Gagné, P. N., Ochoa, I., et al. (2022). Comparison of intercept trap fluids and aerial spore collectors to survey fungal spores. Front. For. Glob. Chang. 5:953130. doi: 10.3389/ffgc.2022.953130
Bonello, P., Campbell, F. T., Cipollini, D., Conrad, A. O., Farinas, C., Gandhi, K. J., et al. (2020). Invasive tree pests devastate ecosystems—a proposed new response framework. Front. For. Glob. Chang. 3:2. doi: 10.3389/ffgc.2020.00002
Bonello, P., Carnegie, A. J., and Ormsby, M. (2022). Forest biosecurity systems and processes: A global perspective. Front. For. Glob. Chang. 5:867860. doi: 10.3389/ffgc.2022.867860
Bulman, S., McDougal, R., Hill, K., and Lear, G. (2018). Opportunities and limitations for DNA metabarcoding in Australasian plant-pathogen biosecurity. Aust. Plant Pathol. 47, 467–474. doi: 10.1007/s13313-018-0579-3
Bureau of Meteorology (2020). New South Wales total rainfall October 2020. Available online at: http://www.bom.gov.au/climate/current/month/nsw/archive/202010.summary.shtml#:~:text=Widespread%20rain%2C%20heavy%20along%20the%20coast&text=For%20the%20state%20as%20a,the%20wettest%20October%20since%202010 (accessed October 21, 2022).
Bushnell, B. (2017). BBMap short read aligner, and other bioinformatic tools. Available online at: https://sourceforge.net/projects/bbmap/ (accessed October 2022).
Callahan, B. J., McMurdie, P. J., Rosen, M. J., Han, A. W., Johnson, A. J. A., and Holmes, S. P. (2016). DADA2: High-resolution sample inference from Illumina amplicon data. Nat. Methods 13, 581–583. doi: 10.1038/nmeth.3869
Carnegie, A. J., and Nahrung, H. F. (2019). Post-border forest biosecurity in Australia: Response to recent exotic detections, current surveillance and ongoing needs. Forests 10:336. doi: 10.3390/f10040336
Carnegie, A. J., Tovar, F., Collins, S., Lawson, S. A., and Nahrung, H. F. (2022). A coordinated, risk-based, national forest biosecurity surveillance program for Australian forests. Front. For. Glob. Chang. 4:756885. doi: 10.3389/ffgc.2021.756885
Carnegie, A., Lawson, S., Wardlaw, T., Cameron, N., and Venn, T. (2018). Benchmarking forest health surveillance and biosecurity activities for managing Australia’s exotic forest pest and pathogen risks. Aust. For. 81, 14–23. doi: 10.1080/00049158.2018.1433271
Cobo-Díaz, J. F., Baroncelli, R., Le Floch, G., and Picot, A. (2019). A novel metabarcoding approach to investigate Fusarium species composition in soil and plant samples. FEMS Microbiol. Ecol. 95:fiz084. doi: 10.1093/femsec/fiz084
Comtet, T., Sandionigi, A., Viard, F., and Casiraghi, M. (2015). DNA (meta) barcoding of biological invasions: A powerful tool to elucidate invasion processes and help managing aliens. Biol. Invasions 17, 905–922. doi: 10.1007/s10530-015-0854-y
Darling, J. A., Pochon, X., Abbott, C. L., Inglis, G. J., and Zaiko, A. (2020). The risks of using molecular biodiversity data for incidental detection of species of concern. Divers. Distrib. 26, 1116–1121. doi: 10.1111/ddi.13108
de Beer, Z. W., Marincowitz, S., Duong, T. A., Kim, J.-J., Rodrigues, A., and Wingfield, M. J. (2016b). Hawksworthiomyces gen. nov.(Ophiostomatales), illustrates the urgency for a decision on how to name novel taxa known only from environmental nucleic acid sequences (ENAS). Fungal Biol. 120, 1323–1340. doi: 10.1016/j.funbio.2016.07.004
de Beer, Z. W., Duong, T. A., and Wingfield, M. J. (2016a). The divorce of Sporothrix and Ophiostoma: Solution to a problematic relationship. Stud. Mycol. 83, 165–191. doi: 10.1016/j.simyco.2016.07.001
Edgar, R. C. (2010). Search and clustering orders of magnitude faster than BLAST. Bioinformatics 26, 2460–2461. doi: 10.1093/bioinformatics/btq461
Edgar, R. C., and Flyvbjerg, H. (2015). Error filtering, pair assembly and error correction for next-generation sequencing reads. Bioinformatics 31, 3476–3482. doi: 10.1093/bioinformatics/btv401
Farr, D., and Rossmann, A. (2022). Fungal Databases, U.S. National Fungus Collections, ARS, USDA. Available online at: https://nt.ars-grin.gov/fungaldatabases/ (accessed October 20, 2022).
Fisher, M. C., Henk, D., Briggs, C. J., Brownstein, J. S., Madoff, L. C., McCraw, S. L., et al. (2012). Emerging fungal threats to animal, plant and ecosystem health. Nature 484, 186–194. doi: 10.1038/nature10947
Food and Agriculture Organization of the United Nations [FAO] (2020). The state of the world’s forests: Forests, biodiversity and people. Rome: FAO.
Gould, B. (2015). “MPI surveillance and incursion management,” in Proceedings of the 13th annual FOA/MPI forest biosecurity workshop, (Rotorua: Ministry for Primary Industries).
Hughes, M., Riggins, J., Koch, F., Cognato, A., Anderson, C., Formby, J., et al. (2017). No rest for the laurels: Symbiotic invaders cause unprecedented damage to southern USA forests. Biol. Invasions 19, 2143–2157. doi: 10.1007/s10530-017-1427-z
Hulcr, J., Barnes, I., de Beer, Z. W., Duong, T. A., Gazis, R., Johnson, A. J., et al. (2020). Bark beetle mycobiome: Collaboratively defined research priorities on a widespread insect-fungus symbiosis. Symbiosis 81, 101–113. doi: 10.1007/s13199-020-00686-9
Jactel, H., Desprez-Loustau, M.-L., Battisti, A., Brockerhoff, E., Santini, A., Stenlid, J., et al. (2020). Pathologists and entomologists must join forces against forest pest and pathogen invasions. NeoBiota 58, 107–127. doi: 10.3897/neobiota.58.54389
Kahle, D. J., and Wickham, H. (2013). ggmap: Spatial visualization with ggplot2. R J. 5, 144–161. doi: 10.32614/RJ-2013-014
Katoh, K., and Standley, D. M. (2013). MAFFT multiple sequence alignment software version 7: Improvements in performance and usability. Mol. Biol. Evol. 30, 772–780. doi: 10.1093/molbev/mst010
Lear, G., Dickie, I., Banks, J., Boyer, S., Buckley, H. L., Buckley, T. R., et al. (2018). Methods for the extraction, storage, amplification and sequencing of DNA from environmental samples. N. Z. J. Ecol. 42, 10A–50A. doi: 10.20417/nzjecol.42.9
Lebas, B., Adams, I., Al Rwahnih, M., Baeyen, S., Bilodeau, G. J., Blouin, A. G., et al. (2022). Facilitating the adoption of high-throughput sequencing technologies as a plant pest diagnostic test in laboratories: A step-by-step description. EPPO Bull. 52, 394–418. doi: 10.1111/epp.12863
Lindahl, B. D., Nilsson, R. H., Tedersoo, L., Abarenkov, K., Carlsen, T., Kjøller, R., et al. (2013). Fungal community analysis by high-throughput sequencing of amplified markers–a user’s guide. New Phytol. 199, 288–299. doi: 10.1111/nph.12243
Luchi, N., Ioos, R., and Santini, A. (2020). Fast and reliable molecular methods to detect fungal pathogens in woody plants. Appl. Microbiol. Biotechnol. 104, 2453–2468. doi: 10.1007/s00253-020-10395-4
Lücking, R., Aime, M. C., Robbertse, B., Miller, A. N., Ariyawansa, H. A., Aoki, T., et al. (2020). Unambiguous identification of fungi: Where do we stand and how accurate and precise is fungal DNA barcoding? IMA Fungus 11:14. doi: 10.1186/s43008-020-00033-z
Malacrino, A., Rassati, D., Schena, L., Mehzabin, R., Battisti, A., and Palmeri, V. (2017). Fungal communities associated with bark and ambrosia beetles trapped at international harbours. Fungal Ecol. 28, 44–52. doi: 10.1016/j.funeco.2017.04.007
Martins, F. M., Galhardo, M., Filipe, A. F., Teixeira, A., Pinheiro, P., Paupério, J., et al. (2019). Have the cake and eat it: Optimizing nondestructive DNA metabarcoding of macroinvertebrate samples for freshwater biomonitoring. Mol. Ecol. Resour. 19, 863–876. doi: 10.1111/1755-0998.13012
Martoni, F., Nogarotto, E., Piper, A. M., Mann, R., Valenzuela, I., Eow, L., et al. (2021). Propylene glycol and non-destructive DNA extractions enable preservation and isolation of insect and hosted bacterial DNA. Agriculture 11:77. doi: 10.3390/agriculture11010077
Martoni, F., Piper, A. M., Rodoni, B. C., and Blacket, M. J. (2022). Disentangling bias for non-destructive insect metabarcoding. PeerJ 10:e12981. doi: 10.7717/peerj.12981
Massart, S., Adams, I., Al Rwahnih, M., Baeyen, S., Bilodeau, G. J., Blouin, A. G., et al. (2022). Guidelines for the reliable use of high throughput sequencing technologies to detect plant pathogens and pests. Peer Commun. J. 2:e62. doi: 10.24072/pcjournal.181
McMurdie, P. J., and Holmes, S. (2013). phyloseq: An R package for reproducible interactive analysis and graphics of microbiome census data. PLoS One 8:e61217. doi: 10.1371/journal.pone.0061217
Meyer, W., Irinyi, L., Hoang, M. T. V., Robert, V., Garcia-Hermoso, D., Desnos-Ollivier, M., et al. (2019). Database establishment for the secondary fungal DNA barcode translational elongation factor 1α (TEF1α). Genome 62, 160–169. doi: 10.1139/gen-2018-0083
Miller, K. E., Inward, D. J., Gomez-Rodriguez, C., Baselga, A., and Vogler, A. P. (2019). Predicting the unpredictable: How host specific is the mycobiota of bark and ambrosia beetles? Fungal Ecol. 42:100854. doi: 10.1016/j.funeco.2019.07.008
Mumford, R., Macarthur, R., and Boonham, N. (2016). The role and challenges of new diagnostic technology in plant biosecurity. Food Secur. 8, 103–109. doi: 10.1007/s12571-015-0533-y
Murali, A., Bhargava, A., and Wright, E. S. (2018). IDTAXA: A novel approach for accurate taxonomic classification of microbiome sequences. Microbiome 6:140. doi: 10.1186/s40168-018-0521-5
National Plant Biosecurity Diagnostic Network [NPBDN] (2022). National diagnostic protocols list. Available online at: https://www.plantbiosecuritydiagnostics.net.au/national-diagnostic-protocol-list/ (accessed October 24, 2022).
Nilsson, R. H., Anslan, S., Bahram, M., Wurzbacher, C., Baldrian, P., and Tedersoo, L. (2019). Mycobiome diversity: High-throughput sequencing and identification of fungi. Nat. Rev. Microbiol. 17, 95–109. doi: 10.1038/s41579-018-0116-y
Nkuekam, G. K., de Beer, Z. W., Wingfield, M. J., Mohammed, C., Carnegie, A. J., Pegg, G. S., et al. (2011). Ophiostoma species (Ophiostomatales, Ascomycota), including two new taxa on eucalypts in Australia. Aust. J. Bot. 59, 283–297. doi: 10.1071/BT10231
O’Leary, N. A., Wright, M. W., Brister, J. R., Ciufo, S., Haddad, D., McVeigh, R., et al. (2016). Reference sequence (RefSeq) database at NCBI: Current status, taxonomic expansion, and functional annotation. Nucleic Acids Res. 44, D733–D745. doi: 10.1093/nar/gkv1189
Paap, T., Wingfield, M. J., Burgess, T. I., Wilson, J. R., Richardson, D. M., and Santini, A. (2022). Invasion frameworks: A forest pathogen perspective. Curr. For. Rep. 8, 74–89. doi: 10.1007/s40725-021-00157-4
Piombo, E., Abdelfattah, A., Droby, S., Wisniewski, M., Spadaro, D., and Schena, L. (2021). Metagenomics approaches for the detection and surveillance of emerging and recurrent plant pathogens. Microorganisms 9:188. doi: 10.3390/microorganisms9010188
Piper, A. M., Batovska, J., Cogan, N. O., Weiss, J., Cunningham, J. P., Rodoni, B. C., et al. (2019). Prospects and challenges of implementing DNA metabarcoding for high-throughput insect surveillance. GigaScience 8:giz092. doi: 10.1093/gigascience/giz092
Piper, A. M., Cunningham, J. P., Cogan, N. O., and Blacket, M. J. (2022). DNA metabarcoding enables high-throughput detection of spotted wing drosophila (Drosophila suzukii) within unsorted trap catches. Front. Ecol. Evol. 10:822648. doi: 10.3389/fevo.2022.822648
Plant Health Australia [PHA] (2022b). ”Plantation forests biosecurity plan (Version 3.1 – 2022). Canberra, ACT: Plant Health Australia.
Plant Health Australia [PHA] (2022a). Emergency plant pest response deed. Available online at: https://www.planthealthaustralia.com.au/biosecurity/emergency-plant-pest-response-deed/ (accessed October 12, 2022).
Plattner, A., Kim, J. J., Reid, J., Hausner, G., Lim, Y. W., Yamaoka, Y., et al. (2009). Resolving taxonomic and phylogenetic incongruence within species Ceratocystiopsis minuta. Mycologia 101, 878–887. doi: 10.3852/08-132
Pyšek, P., Jarošík, V., Hulme, P. E., Kühn, I., Wild, J., Arianoutsou, M., et al. (2010). Disentangling the role of environmental and human pressures on biological invasions across Europe. Proc. Natl. Acad. Sci. U.S.A. 107, 12157–12162. doi: 10.1073/pnas.1002314107
R Core Team (2013). R: A language and environment for statistical computing. Vienna: R Foundation for Statistical Computing.
Rassati, D., Marini, L., and Malacrinò, A. (2019). Acquisition of fungi from the environment modifies ambrosia beetle mycobiome during invasion. PeerJ 7:e8103. doi: 10.7717/peerj.8103
Santini, A., Ghelardini, L., De Pace, C., Desprez-Loustau, M.-L., Capretti, P., Chandelier, A., et al. (2013). Biogeographical patterns and determinants of invasion by forest pathogens in Europe. New Phytol. 197, 238–250. doi: 10.1111/j.1469-8137.2012.04364.x
Seifert, K. A., de Beer, Z. W., and Wingfield, M. J. (2013). The ophiostomatoid fungi: Expanding frontiers. Utrecht: CBS-KNAW Biodiversity Centre.
Six, D. L. (2012). Ecological and evolutionary determinants of bark beetle—fungus symbioses. Insects 3, 339–366. doi: 10.3390/insects3010339
Stamatakis, A. (2014). RAxML version 8: A tool for phylogenetic analysis and post-analysis of large phylogenies. Bioinformatics 30, 1312–1313. doi: 10.1093/bioinformatics/btu033
Stielow, J. B., Levesque, C. A., Seifert, K. A., Meyer, W., Irinyi, L., Smits, D., et al. (2015). One fungus, which genes? Development and assessment of universal primers for potential secondary fungal DNA barcodes. Pers. Mol. Phylogeny Evol. Fungi 35, 242–263. doi: 10.3767/003158515X689135
Stone, C., and Simpson, J. (1987). Influence of Ips grandicollis on the incidence and spread of bluestain fungi in Pinus elliottii billets in north-eastern New South Wales. Aust. For. 50, 86–94. doi: 10.1080/00049158.1987.10674500
Stone, C., and Simpson, J. (1990). Species associations in Ips Grandicollis galleries in Pinus Taeda. N. Z. J. For. Sci. 20, 75–96.
Stone, C., Goodyer, G., Sims, K., Penman, T., and Carnegie, A. (2010). Beetle assemblages captured using static panel traps within New South Wales pine plantations. Aust. J. Entomol. 49, 304–316. doi: 10.1111/j.1440-6055.2010.00769.x
Sumner, M. (2021). ozmaps: Australia maps. Available online at: https://github.com/mdsumner/ozmaps (accessed October 2022).
Swift, J. F., Lance, R. F., Guan, X., Britzke, E. R., Lindsay, D. L., and Edwards, C. E. (2018). Multifaceted DNA metabarcoding: Validation of a noninvasive, next-generation approach to studying bat populations. Evol. Appl. 11, 1120–1138. doi: 10.1111/eva.12644
Taberlet, P., Bonin, A., Zinger, L., and Coissac, E. (2018). Environmental DNA: For biodiversity research and monitoring. Oxford: Oxford University Press, doi: 10.1093/oso/9780198767220.001.0001
Tedersoo, L., Anslan, S., Bahram, M., Põlme, S., Riit, T., Liiv, I., et al. (2015). Shotgun metagenomes and multiple primer pair-barcode combinations of amplicons reveal biases in metabarcoding analyses of fungi. MycoKeys 10, 1–43. doi: 10.3897/mycokeys.10.4852
Tedersoo, L., Bahram, M., Zinger, L., Nilsson, R. H., Kennedy, P. G., Yang, T., et al. (2022). Best practices in metabarcoding of fungi: From experimental design to results. Mol. Ecol. 31, 2769–2795. doi: 10.1111/mec.16460
Tedersoo, L., Drenkhan, R., Anslan, S., Morales-Rodriguez, C., and Cleary, M. (2019). High-throughput identification and diagnostics of pathogens and pests: Overview and practical recommendations. Mol. Ecol. Resour. 19, 47–76. doi: 10.1111/1755-0998.12959
Tedersoo, L., Tooming-Klunderud, A., and Anslan, S. (2018). PacBio metabarcoding of Fungi and other eukaryotes: Errors, biases and perspectives. New Phytol. 217, 1370–1385. doi: 10.1111/nph.14776
Tobin, P. C., Kean, J. M., Suckling, D. M., McCullough, D. G., Herms, D. A., and Stringer, L. D. (2014). Determinants of successful arthropod eradication programs. Biol. invasions 16, 401–414. doi: 10.1007/s10530-013-0529-5
Tremblay, É. D., Duceppe, M.-O., Bérubé, J. A., Kimoto, T., Lemieux, C., and Bilodeau, G. J. (2018). Screening for exotic forest pathogens to increase survey capacity using metagenomics. Phytopathology 108, 1509–1521. doi: 10.1094/PHYTO-02-18-0028-R
Tremblay, É. D., Kimoto, T., Bérubé, J. A., and Bilodeau, G. J. (2019). High-throughput sequencing to investigate phytopathogenic fungal propagules caught in baited insect traps. J. Fungi 5:15. doi: 10.3390/jof5010015
Trollip, C., Carnegie, A. J., Dinh, Q., Kaur, J., Smith, D., Mann, R., et al. (2021). Ophiostomatoid fungi associated with pine bark beetles and infested pines in south-eastern Australia, including Graphilbum ipis-grandicollis sp. nov. IMA Fungus 12:24. doi: 10.1186/s43008-021-00076-w
Trollip, C., Kaur, J., Piper, A. M., Martoni, F., Mann, R., Dinh, Q., et al. (2022). Modular, multi-barcode amplicon sequencing for improved species-level detection of fungal phytopathogens: A case study of pipeline establishment targeting the Ophiostomatales. Environ. DNA 00, 1–17. doi: 10.1002/edn3.368
Weigand, A. M., Desquiotz, N., Weigand, H., and Szucsich, N. (2021). Application of propylene glycol in DNA-based studies of invertebrates. Metabarcoding Metagenom. 5:e57278. doi: 10.3897/mbmg.5.57278
Wickham, H., Averick, M., Bryan, J., Chang, W., McGowan, L., François, R., et al. (2019). Welcome to the Tidyverse. J. Open Source Softw. 4:1686. doi: 10.21105/joss.01686
Wilcox, T. M., Zarn, K. E., Piggott, M. P., Young, M. K., McKelvey, K. S., and Schwartz, M. K. (2018). Capture enrichment of aquatic environmental DNA: A first proof of concept. Mol. Ecol. Resour. 18, 1392–1401. doi: 10.1111/1755-0998.12928
Willis, A. D., and Martin, B. D. (2022). Estimating diversity in networked ecological communities. Biostatistics 23, 207–222. doi: 10.1093/biostatistics/kxaa015
Willis, A., and Bunge, J. (2015). Estimating diversity via frequency ratios. Biometrics 71, 1042–1049. doi: 10.1111/biom.12332
Willis, A., Bunge, J., and Whitman, T. (2015). Inference for changes in biodiversity. arXiv [Preprint]. doi: 10.48550/arXiv.1506.05710
Willis, A., Bunge, J., and Whitman, T. (2017). Improved detection of changes in species richness in high diversity microbial communities. J. R. Stat. Soc. Ser C Appl. Stat. 66, 963–977. doi: 10.1111/rssc.12206
Willis, A., Martin, B. D., Trinh, P., Barger, K., and Bunge, J. (2020). Breakaway: Species richness estimation and modeling. R package version, 4.7.6. Available online at: https://adw96.github.io/breakaway/
Wilson, J., Stephenson, B., Gill, G., Randall, J., and Vieglais, C. (2004). Principles of response to detections of new plant pest species and the effectiveness of surveillance. N. Z. Plant Prot. 57, 156–160. doi: 10.30843/nzpp.2004.57.6896
Keywords: forest biosecurity, environmental DNA sequencing, metabarcoding, fungal diagnostics, bark beetles, Ophiostomatales
Citation: Trollip C, Carnegie AJ, Piper AM, Kaur J, Martoni F, Dinh Q, Smith D, Mann R, Rodoni B and Edwards J (2023) High throughput screening of fungal phytopathogens caught in Australian forestry insect surveillance traps. Front. For. Glob. Change 6:1149755. doi: 10.3389/ffgc.2023.1149755
Received: 23 January 2023; Accepted: 13 March 2023;
Published: 28 March 2023.
Edited by:
Alberto Santini, Institute for Sustainable Plant Protection, National Research Council (CNR), ItalyReviewed by:
Neil Boonham, Newcastle University, United KingdomJaime Aguayo, Agence Nationale de Sécurité Sanitaire de l’Alimentation, de l’Environnement et du Travail (ANSES), France
Copyright © 2023 Trollip, Carnegie, Piper, Kaur, Martoni, Dinh, Smith, Mann, Rodoni and Edwards. This is an open-access article distributed under the terms of the Creative Commons Attribution License (CC BY). The use, distribution or reproduction in other forums is permitted, provided the original author(s) and the copyright owner(s) are credited and that the original publication in this journal is cited, in accordance with accepted academic practice. No use, distribution or reproduction is permitted which does not comply with these terms.
*Correspondence: Conrad Trollip, Y29ucmFkLnRyb2xsaXBAZHBpLm5zdy5nb3YuYXU=