 Tomas Lämås1*
 Lars Sängstuvall1Karin Öhman1Johanna Lundström1Jonatan Årevall1Hampus Holmström1Linus Nilsson2Eva-Maria Nordström1Per-Erik Wikberg1Peder Wikström3
 Jeannette Eggers1
- 1Department of Forest Resource Management, Swedish University of Agricultural Sciences, Umeå, Sweden
- 2Nilsin AB, Umeå, Sweden
- 3Treesys AB, Umeå, Sweden
For several decades, computerized forest decision support systems (DSS) have helped managers and decision makers to analyze different management options and supported the search for preferred management alternatives. In Sweden, a country rich in forests and with a long tradition in intensive forest management, such systems have been developed and available since the 1970s. Changes in societal as well as in forest owners’ preferences and objectives in the 1990s led to a need for forest DSS handling broader perspectives compared to precedent single-objective timber-oriented systems. In Sweden, this led to the initiation of a research programme in the beginning of the 2000s aiming at developing a versatile and multi-objective forest DSS, resulting in the first version of the Heureka forest DSS released in 2009. The system handles several forest values, such as timber and biofuel production, carbon sequestration, dead wood dynamics, habitat for species, recreation and susceptibility to forest damages (spruce bark beetle, wind-throw and root rot). It contains a suite of software for different problem settings and geographical scales and uses simulation as well as optimization techniques. Three software handle projections of the forest using a common core of growth and yield models for simulating forest dynamics. A fourth software, built for multi-criteria decision analysis and including a web-version, enables also group decision making and participatory planning. For more than 10 years, the Heureka system has been used in teaching, environmental analysis, research and as decision support in practical forestry. For example, several research groups using the system for analyses in different problem areas have so far published more than 80 scientific papers. The system is used for nation-wide forest impact analysis for policy support and all large and many medium-sized forest owners use it for their long-term forest planning, meaning that it directly influences forest management decisions and activities on more than 50% of the Swedish forest area. Besides presenting the present system and its use, we also discuss lessons learned and potential future development.
Introduction
Forest ecosystems are inherently complex and dynamic and provide individuals and societies with a broad mix of ecosystem services (Millennium Ecosystem Assessment [MEA], 2005). Forests also cover large geographical areas, a large and diverse number of management objectives and a plethora of management alternatives. Moreover, due to the long time it takes for a tree to reach harvestable dimensions, today’s management actions will affect the outcome of forest ecosystem services over a long period of time. During the last decades, different forest management paradigms have been proposed and applied, such as sustainable timber management, multiple-use forestry, ecosystem management, sustainable forest management and climate-smart forestry (Hahn and Knoke, 2010; MacDicken et al., 2015; Verkerk et al., 2020). Independent of management paradigm, tools projecting forest development including the outcome of different ecosystem services are needed to support the search for preferred management alternatives.
A category of tools designed for this problem area is forest decision support systems (DSS). There are a number of different definitions of what a DSS is. These range from very simple definitions such as “it helps someone make decisions” to more comprehensive definitions such as “Decision support systems (DSS) have been defined as computer-based systems that integrate data sources with modeling and analytical tools; facilitate development, analysis, and ranking of alternatives; assist in management of uncertainty; and enhance overall problem comprehension.” (Mowrer, 2000), or “DSS are computer-based tools which provide support to solve ill-structured decision problems by integrating database management systems with analytical and operational research models, graphic display, tabular reporting capabilities and the expert knowledge of scientists, managers and decision makers.” (Vacik et al., 2015). Many of the definitions have in common that they define DSS as systems that are (1) computer-based, (2) intended to support decision-making, (3) based on analytical methods, and that (4) present results in an efficient and accessible manner. In this paper we define a forest DSS as a computer-based system that supports forest management planning and analysis involving multiple objectives by integrating analytical methods and models for projecting the future development of forests and their production of ecosystem services based on assumptions about, e.g., forest management and price trends.
Forest DSS can be constructed in various ways (system design and programming, more or less modular, etc.), focus on different ecosystem services, and apply different techniques for the search of preferred solution (Packalen et al., 2013; Segura et al., 2014). Methodologically, DSS can be classified into three groups based on the technique applied for the analysis: DSS based on simulation, DSS based on optimization, and DSS used for multi-criteria decision analysis (MCDA). In this context, simulation means that a set of forest management rules are specified, and the outcome (consequences) is based on an application of these rules (Nobre et al., 2016). The simulator thus projects the likely development of the forest and the resulting ecosystem services for one management alternative under the pre-defined management rules. Simulators are useful for answering “what if” questions, i.e., for assessing the consequences of a limited set of pre-defined management scenarios. The advantage of simulation approaches lies in the relative ease of formulating the problem and interpreting the output. A DSS based on optimization, in contrast, generates a large set of potential management alternatives from which the best alternative is selected using an optimizing algorithm based on the objectives and constraints of the planning problem. These kinds of DSS can be used for answering “how to” questions, i.e., for finding the optimal way to reach certain objectives. Optimization problems thus require that the user defines forest management objectives and constraints rather than strict management rules. Both simulation and optimization approaches can be used to generate a number of scenarios, which can be used in a MCDA DSS to identify the scenario that best fits decision makers’ preferences for different objectives. MCDA is the collective term for a set of mathematical methods and approaches used to find solutions to decision problems with multiple conflicting objectives.
Research on and development of forest DSS has for decades been characterized by high activity worldwide (Borges et al., 2014; Vacik et al., 2015). For example, the community of practice ForestDSS1 gathered information and experiences on forest DSS and on its Wiki page more than 80 systems are listed. While early DSS were designed to address relatively narrow, well-defined problems, more recent systems tend to be used for more general purposes and are multifunctional, allowing for the assessment of multiple forest ecosystem services (Reynolds et al., 2008). Today’s DSS can therefore be used for diverse decision-making problems at different temporal and spatial scales (Nobre et al., 2016). Thus, many modern DSS can be used not only for the planning and timing of management activities but also for assessing the impact of different management practices on the provision of a multitude of ecosystem services.
Sweden is rich in forests, mainly boreal and hemiboreal, to some extent also temperate forests in the southernmost part. A large part of its total 23.4 Mha productive forestland is intensively used for timber production. During 2002–2009 a research programme–the Heureka programme–was carried out at the Swedish University of Agricultural Sciences (SLU) and at the Forestry Research Institute of Sweden (Skogforsk), The research programme aimed at developing a new forest DSS with the capacity to substantially contribute to sustainable and multi-objective management of forest landscapes (Lämås and Eriksson, 2003). The research programme was financed by a broad and probably unique constellation of financers; a university and a research institute (SLU and Skogforsk), a research foundation (Kempe foundations), an environmental research foundation (Swedish Foundation for Strategic Environmental Research), and forest industries (Swedish Forest Industries Federation). The outcome of the research programme was the Heureka DSS containing a set of software for different problem areas and users (Wikström et al., 2011). Since 2011, the administration and management of Heureka are handled by the unit of Forest Sustainability Analyses at the Department of Forest Resource Management, at SLU in Umeå, Sweden. User organizations from both research, authorities and industry co-finance the continuous development of the system. The Heureka system is documented online on a Wiki (Swedish University of Agricultural Sciences [SLU], 2022a) containing information about system design, structure and definitions and on a help documentation page (Swedish University of Agricultural Sciences [SLU], 2022b) describing workflows for different processes. All software can be downloaded free of charge from the Wiki, along with necessary third-party components. For more than 10 years, the Heureka DSS has been widely used in teaching, research, environmental assessment and in practical forestry for making short and long-term analysis and producing forest management plans. More than 80 scientific papers making use of the Heureka system have been published in different scientific areas and by different research groups (Supplementary material). All large [1–3.2 Mha productive forest land (site productivity ≥ 1 m3ha–1year–1)] and several medium-sized Swedish forest companies use the system for their long-term planning and in some cases also for medium-term planning. This means that Heureka is used to plan forest management on more than half of the productive forest area in Sweden. Recurrent national forest impact analyses are performed using the Heureka system on the commission of the Swedish Forest Agency (e.g., Claesson et al., 2015; Bergqvist et al., 2022). The system is also used for environmental assessment, e.g., projections of forest carbon balances according to international agreements (Ministry for the Environment, 2019).
In this paper we present the Heureka system, a versatile and extensive forest DSS enabling planning and analysis for a wide range of forest related questions and challenges. The aim is to describe its design, key functionality and analytical framework together with experiences from a decade of applications of the system in various settings. We aim at a description that can serve as a reference for developers of future forest DSS but also for DSS users in general and for Heureka users in particular.
Below we first describe the design of the Heureka DSS; models and functions included in the software handling forest dynamics and in the MCDA based software, followed by system design and programming. We then present applications of the system in practical forestry, environmental monitoring, teaching and research. Thereafter, we discuss experiences of system development, the users of the system and functionality of the system, including some recommendations for future development of different forest DSS. See also Figure 1 for a schematic overview of the Heureka DSS as well as the content of this paper.
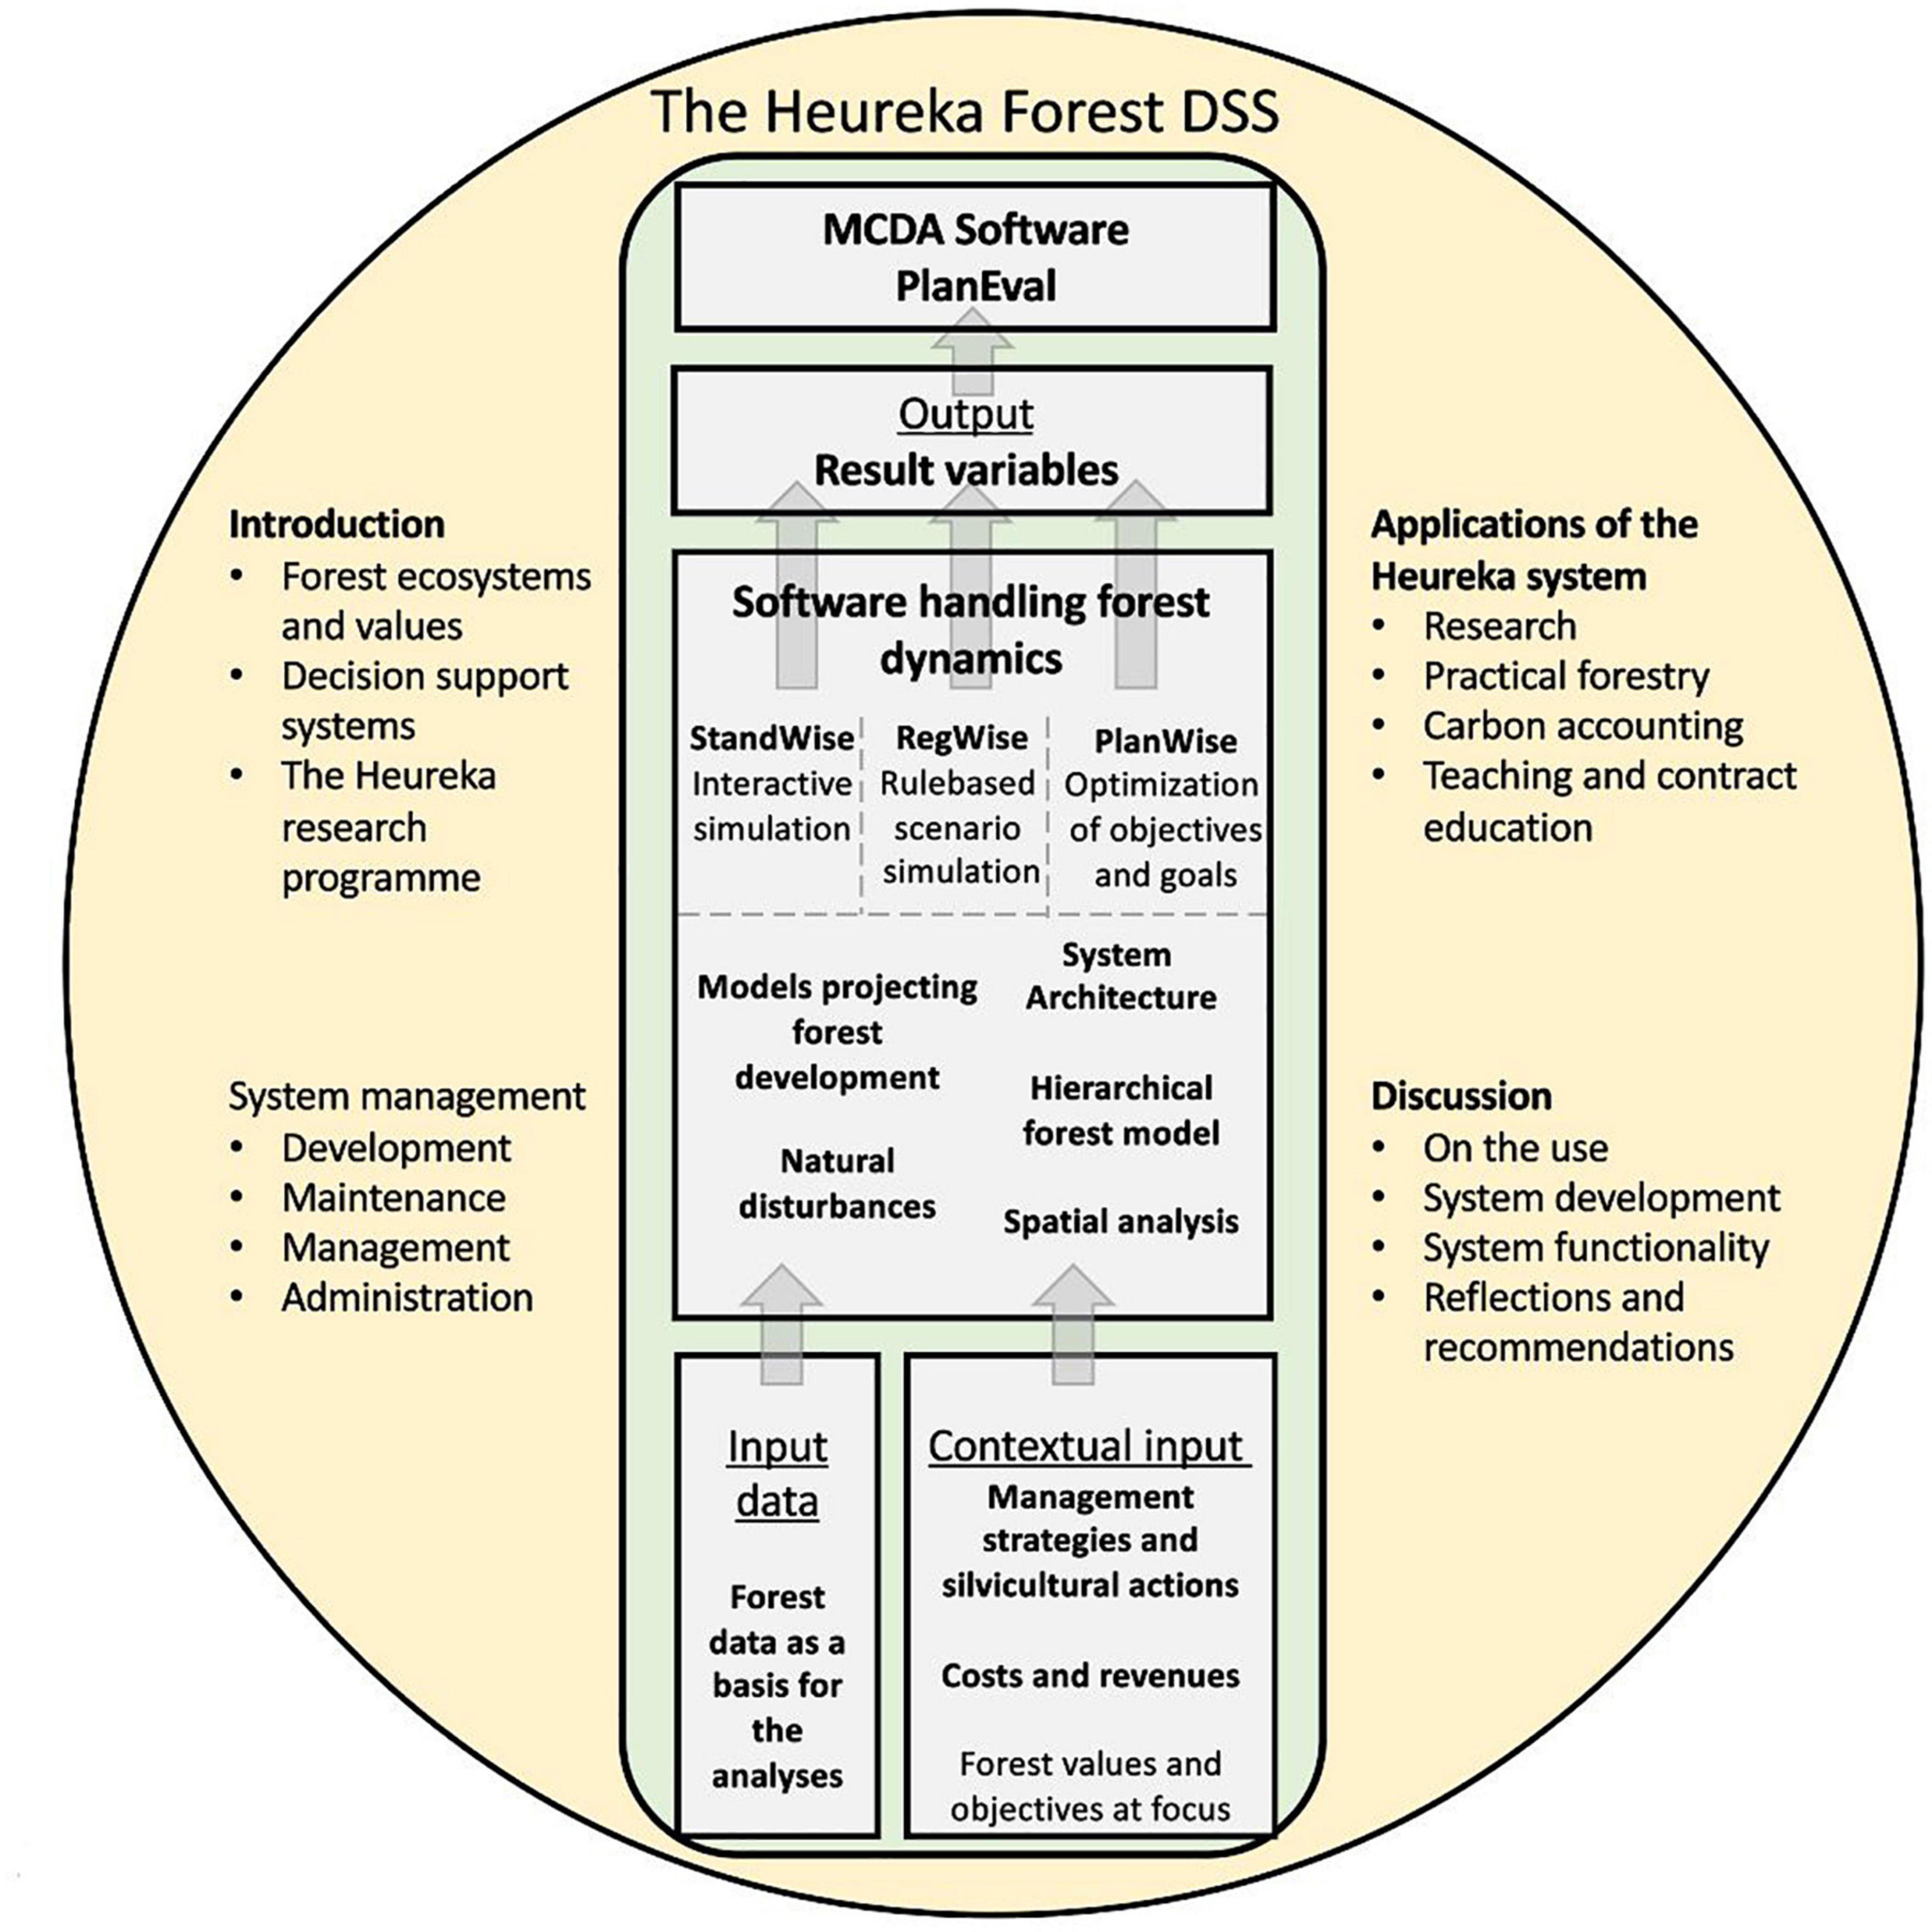
Figure 1. A schematic overview of the content and sections in this paper, in the structural form of an overview of also the system itself and its contexts. Bold text indicates specific sections in the paper.
The Heureka system
The Heureka system contains a suite of software of which three–named StandWise, RegWise, and PlanWise–are used for projecting the future forest development (Figure 2). The StandWise software is an interactive simulator for analyses of individual stands. RegWise and PlanWise are both applicable on different levels, e.g., stand, estate, landscape and national level. RegWise is based on a ruled-based simulation framework while PlanWise uses optimization techniques. The three software have a common kernel of (mainly empirical) tree- and plot-level growth and yield models that projects the development of the forest over time. A treatment unit is usually the equivalent to an individual stand or individual sample plot and is the lowest level at which a management action (such as thinning, final felling or no active measures) is applied, see further in the Hierarchical forest model section. Hereafter the term treatment unit is used when referring to stands and/or plots. The three software include also other common ecological and economic models enabling scenario analysis and management planning including e.g., the effect of different silvicultural actions on the outcomes for a wide range of indicators for different ecosystem services and biodiversity. A fourth software, PlanEval, based on MCDA, is used to systematically rank and evaluate scenarios generated with any of the three software handling forest dynamics (particularly RegWise and PlanWise).
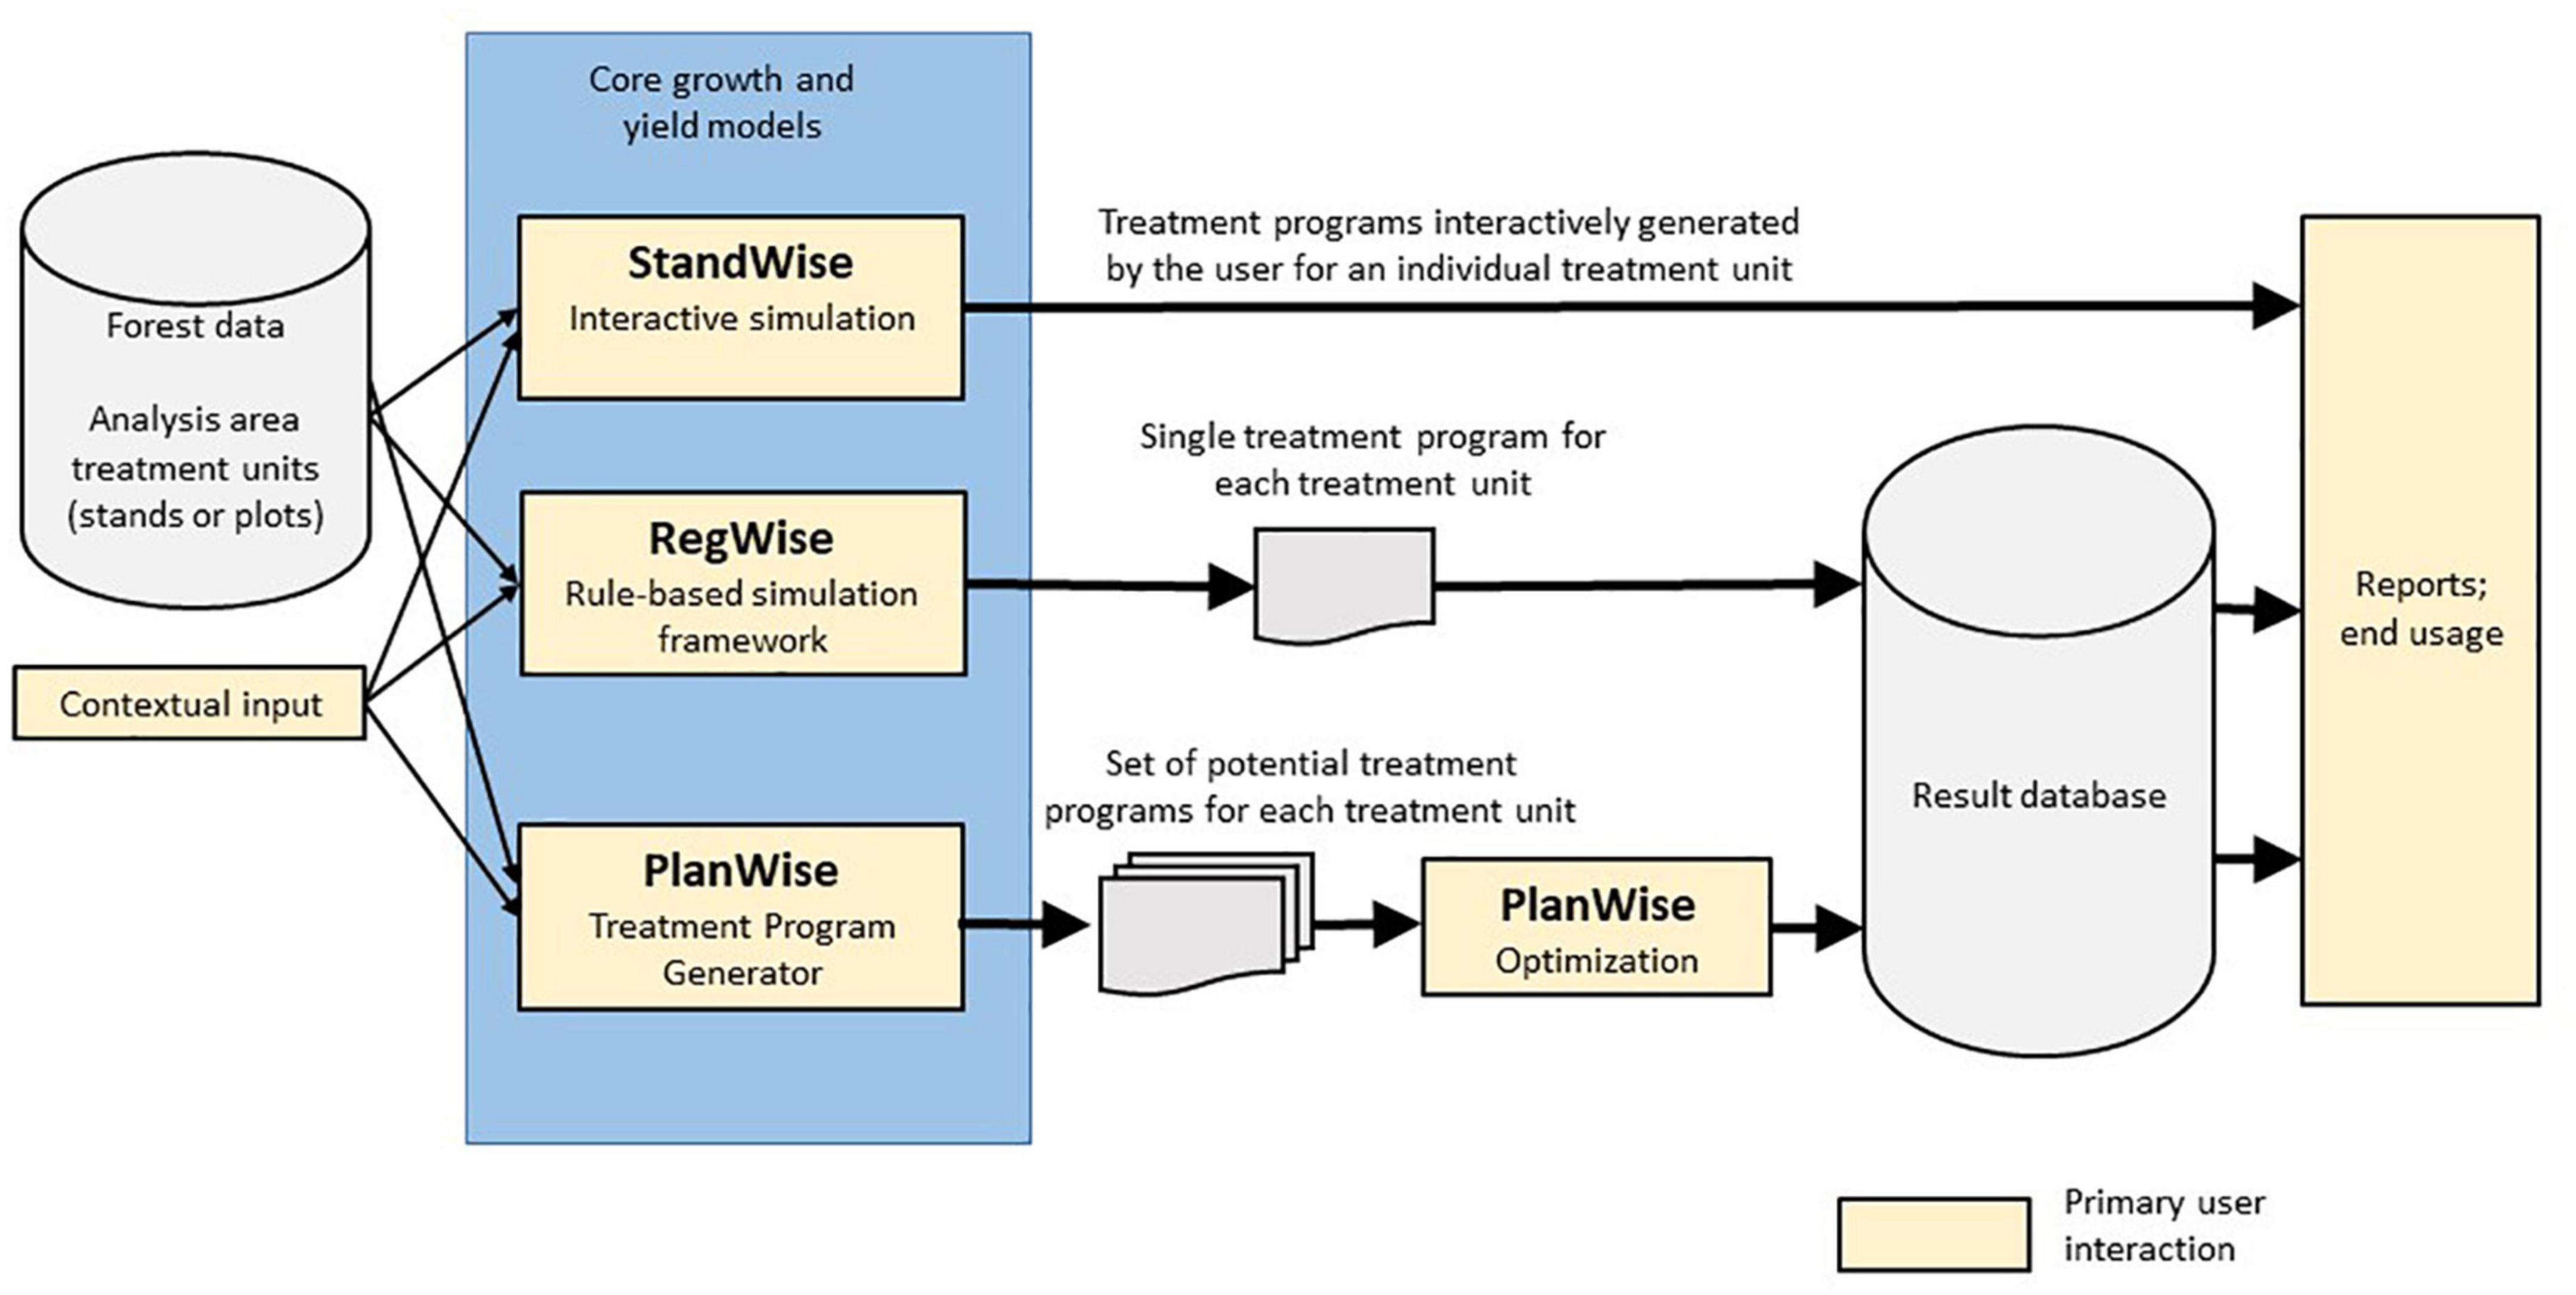
Figure 2. A schematic view of the three Heureka software projecting forest development. The figure focuses on showing the main and principal differences between the three software, i.e., not a formal system description.
The Heureka software handling forest dynamics
Below we first describe the three software concerned. We then describe common components and approaches in them, such as common models projecting forest development, forest data used in analyses, result variables, etc.
The StandWise interactive simulator
The StandWise software is to be applied on an individual stand or plot. Management actions, e.g., thinning and final felling, are specified by the user by interactively using the core growth and yield models and by stepping forward in time period by period (5 years). As an alternative to the interactive simulation, there is a pseudo-optimization tool choosing a management alternative yielding the highest net present value (NPV, Faustmann, 1849). The same auto-generation of treatment programs is also used for extending the simulation of management actions after the time horizon explicitly and interactively handled by the user, which is needed to calculate NPV.
The initial state of the forest can be stand data imported to the Heureka system from a traditional forest management plan or plot data from, e.g., the Swedish National Forest Inventory (NFI). Stand data can also be entered interactively via a StandWise interface.
A stand can be visualized in a 2D map and in 3D view (Figure 3). If available when importing stand data, true positions of the trees are used, otherwise positions are simulated using a Poisson process. In the 2D map, the user can locate strip roads manually or automatically in a regular pattern, trees within them automatically harvested in the next thinning operation.
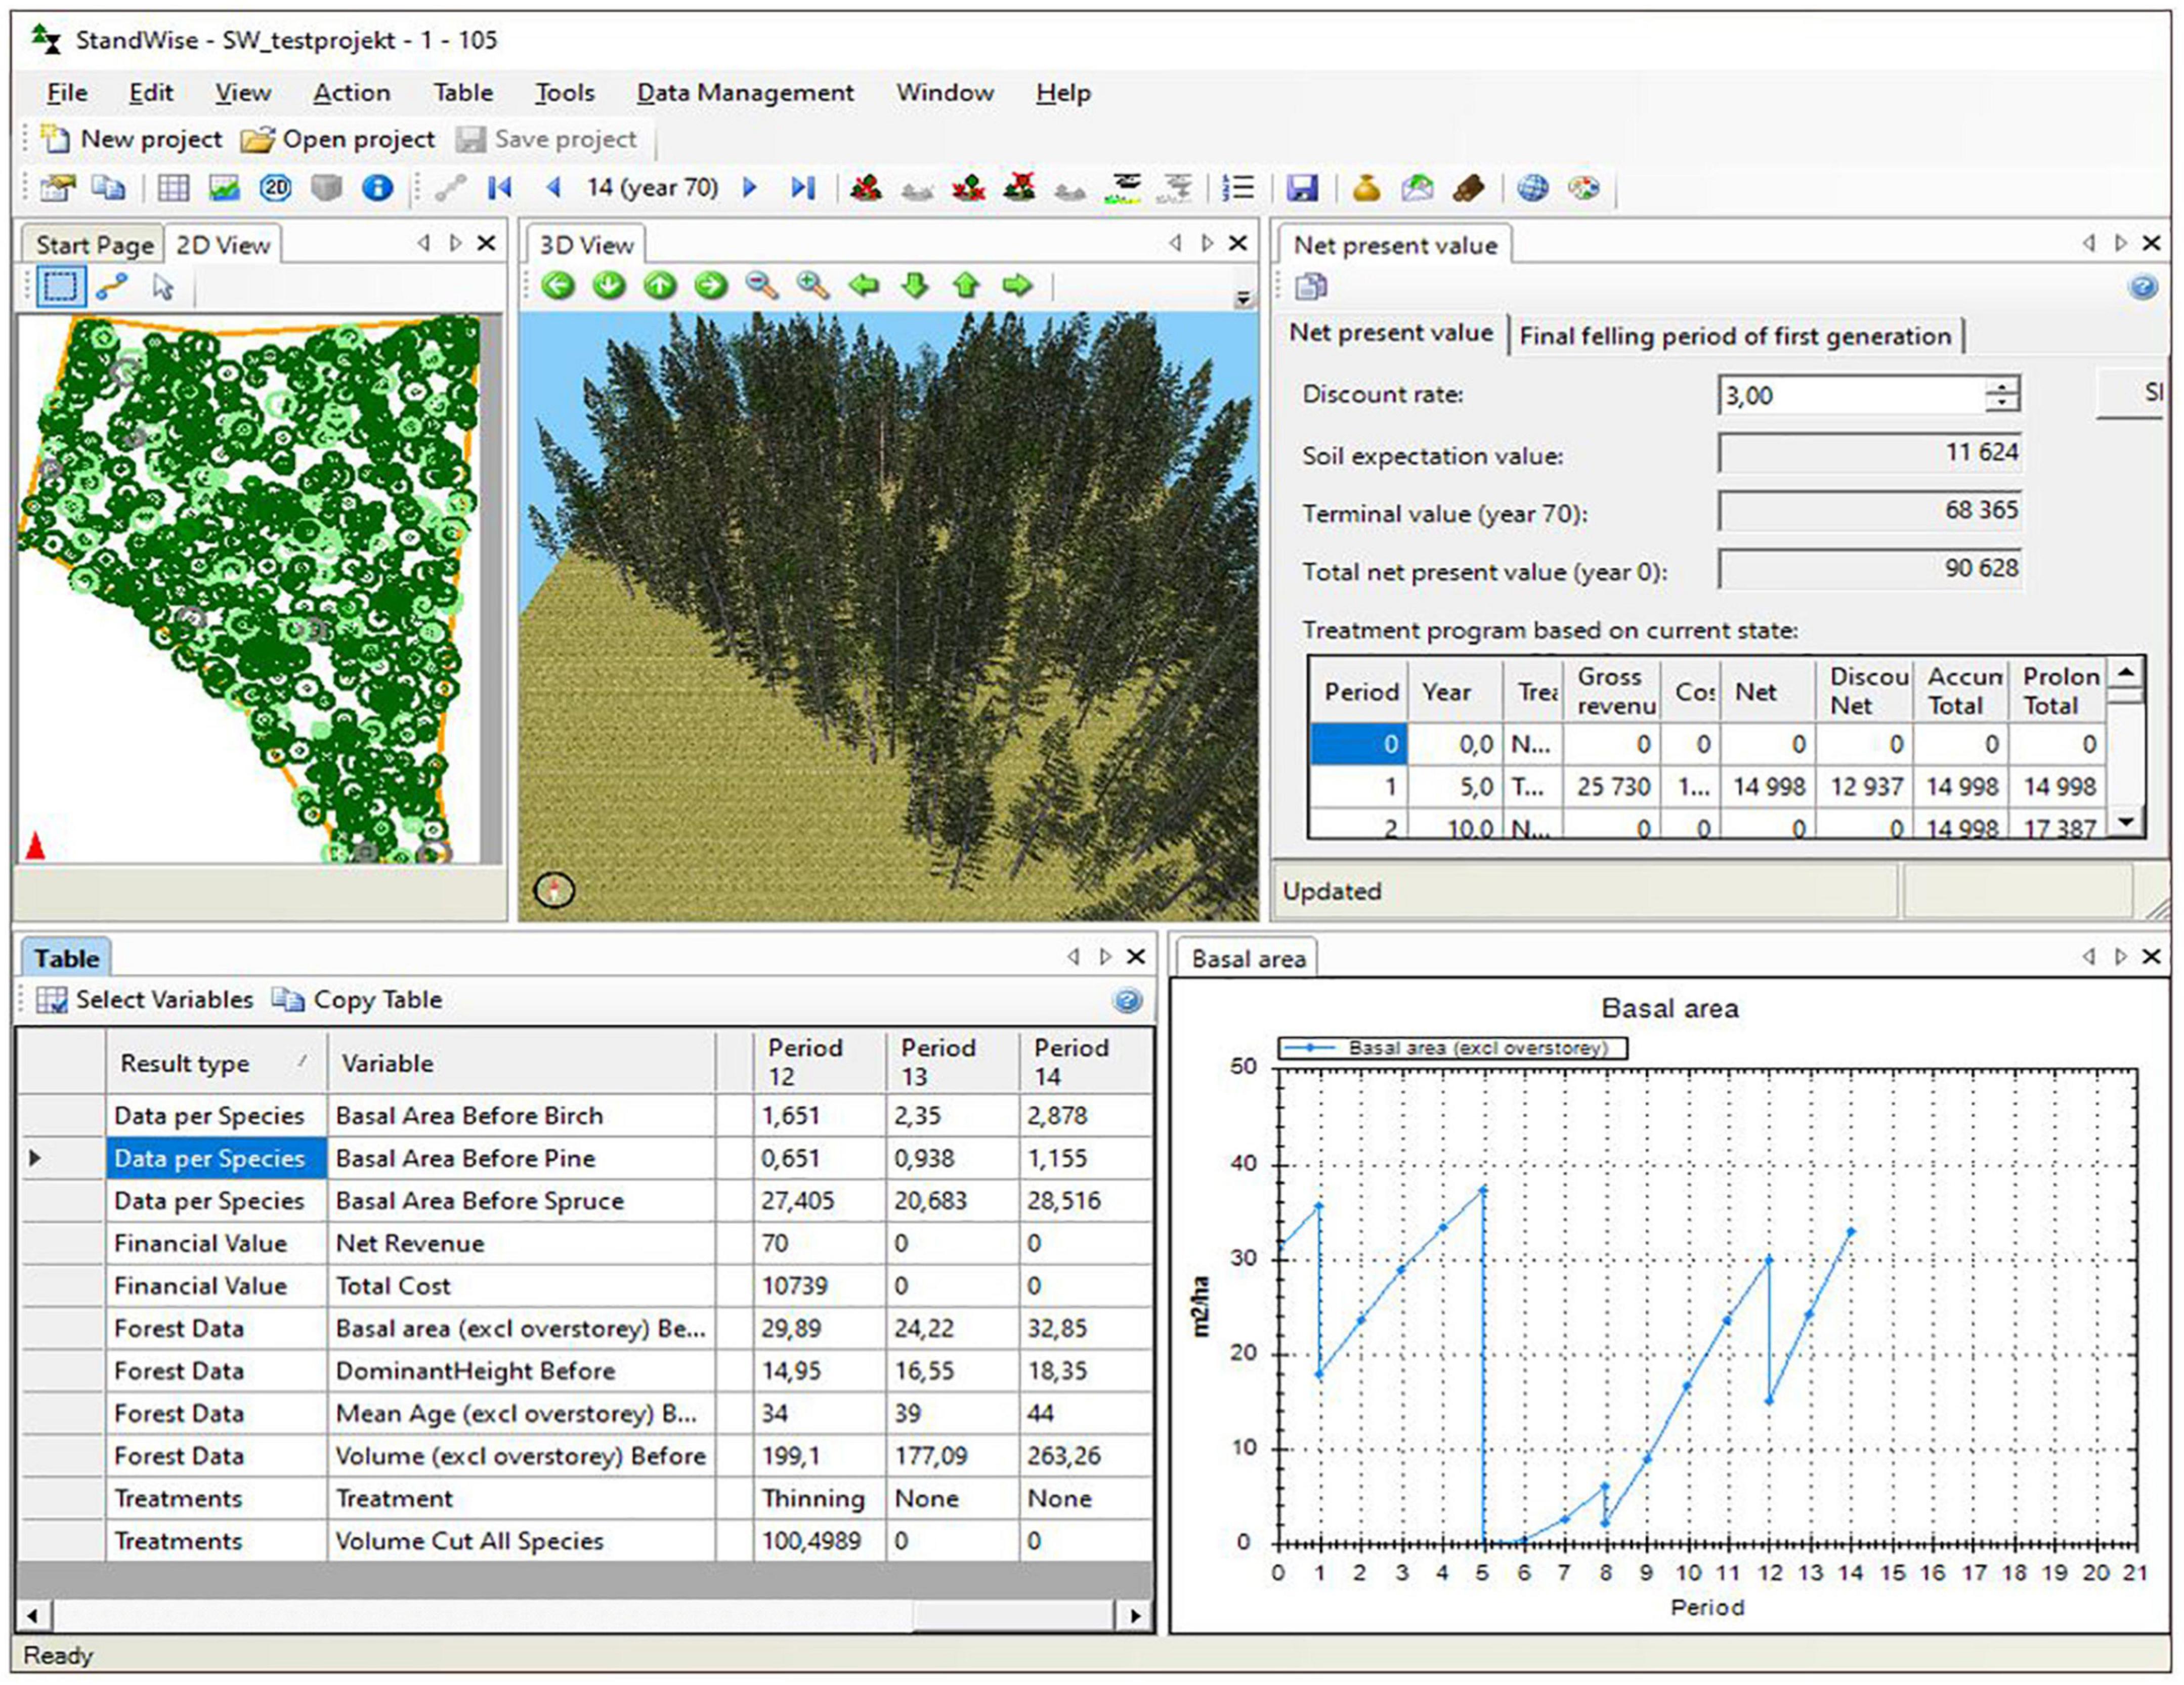
Figure 3. Example of the graphical user interface in one of the Heureka software; the StandWise interactive simulator were the user steers stand development and management actions in 5-year time steps. Upper panels: to the left a 2D map of the stand showing the position, species and seize of individual trees, in the mid a computer drawn 3D image of the stand, to the right the results of a system generated pseudo-optimization. Lower panels: to the left examples of result variables, to the right basal area development for a specific interactive simulation run.
The RegWise software based on a rule-based simulation framework
In RegWise, the core growth and yield models are combined with rule-based framework controlling management actions. The latter is based on user-specified management strategies and the chosen method for allocation of treatment programs to treatment units within those frames. For prioritizing silvicultural and harvesting actions, logistic regression functions can be used. The user can choose between functions that have been elaborated based on actions undertaken and registered on permanent NFI plots, or functions based on management recommendations. The action-based functions provide probabilities for final felling and thinning. Recommendation-based functions are available for pre-commercial thinning, thinning, fertilization and final felling. For final fellings, users can either prioritize volume growth (slow-growing stands to be harvested first) or prioritize harvesting stands that have a high risk for wind-throw. Random “jumps” in the priority list can also be applied to reflect variation within forestry. There are two ways to perform a simulation in RegWise: (i) the user can specify the amount of harvest volume to be thinned or final felled in each 5-year period, or (ii) the user can specify a proportion of the estimated growth in the previous period that is to be harvested in each period. It is also possible to simulate changes of land use, such as transferring forestland to agricultural land or vice versa.
RegWise is well suited for national and regional level scenario analyses based on NFI plots (Claesson et al., 2015; Bergqvist et al., 2022) but can be run also on other data, such as data from stand registers at forest companies, or data based on a combination of remote sensing data and NFI data (Eggers et al., 2015, 2019).
The PlanWise software based on a optimization framework
In PlanWise, the treatment unit projection simulator is implemented as a Treatment Program Generator (TPG), generating a set of potential treatment programs in the realm of one or several management strategy frames for each treatment unit (Figure 4). Each treatment program consists of a sequence of actions, e.g., planting, thinning and final felling, for a treatment unit from the current time to the end of the planning horizon (Figure 5). The TPG is linked to a built-in optimization tool for finding the preferred treatment program for each unit. All aforementioned result variables can be used as parameters in the subsequent optimization.
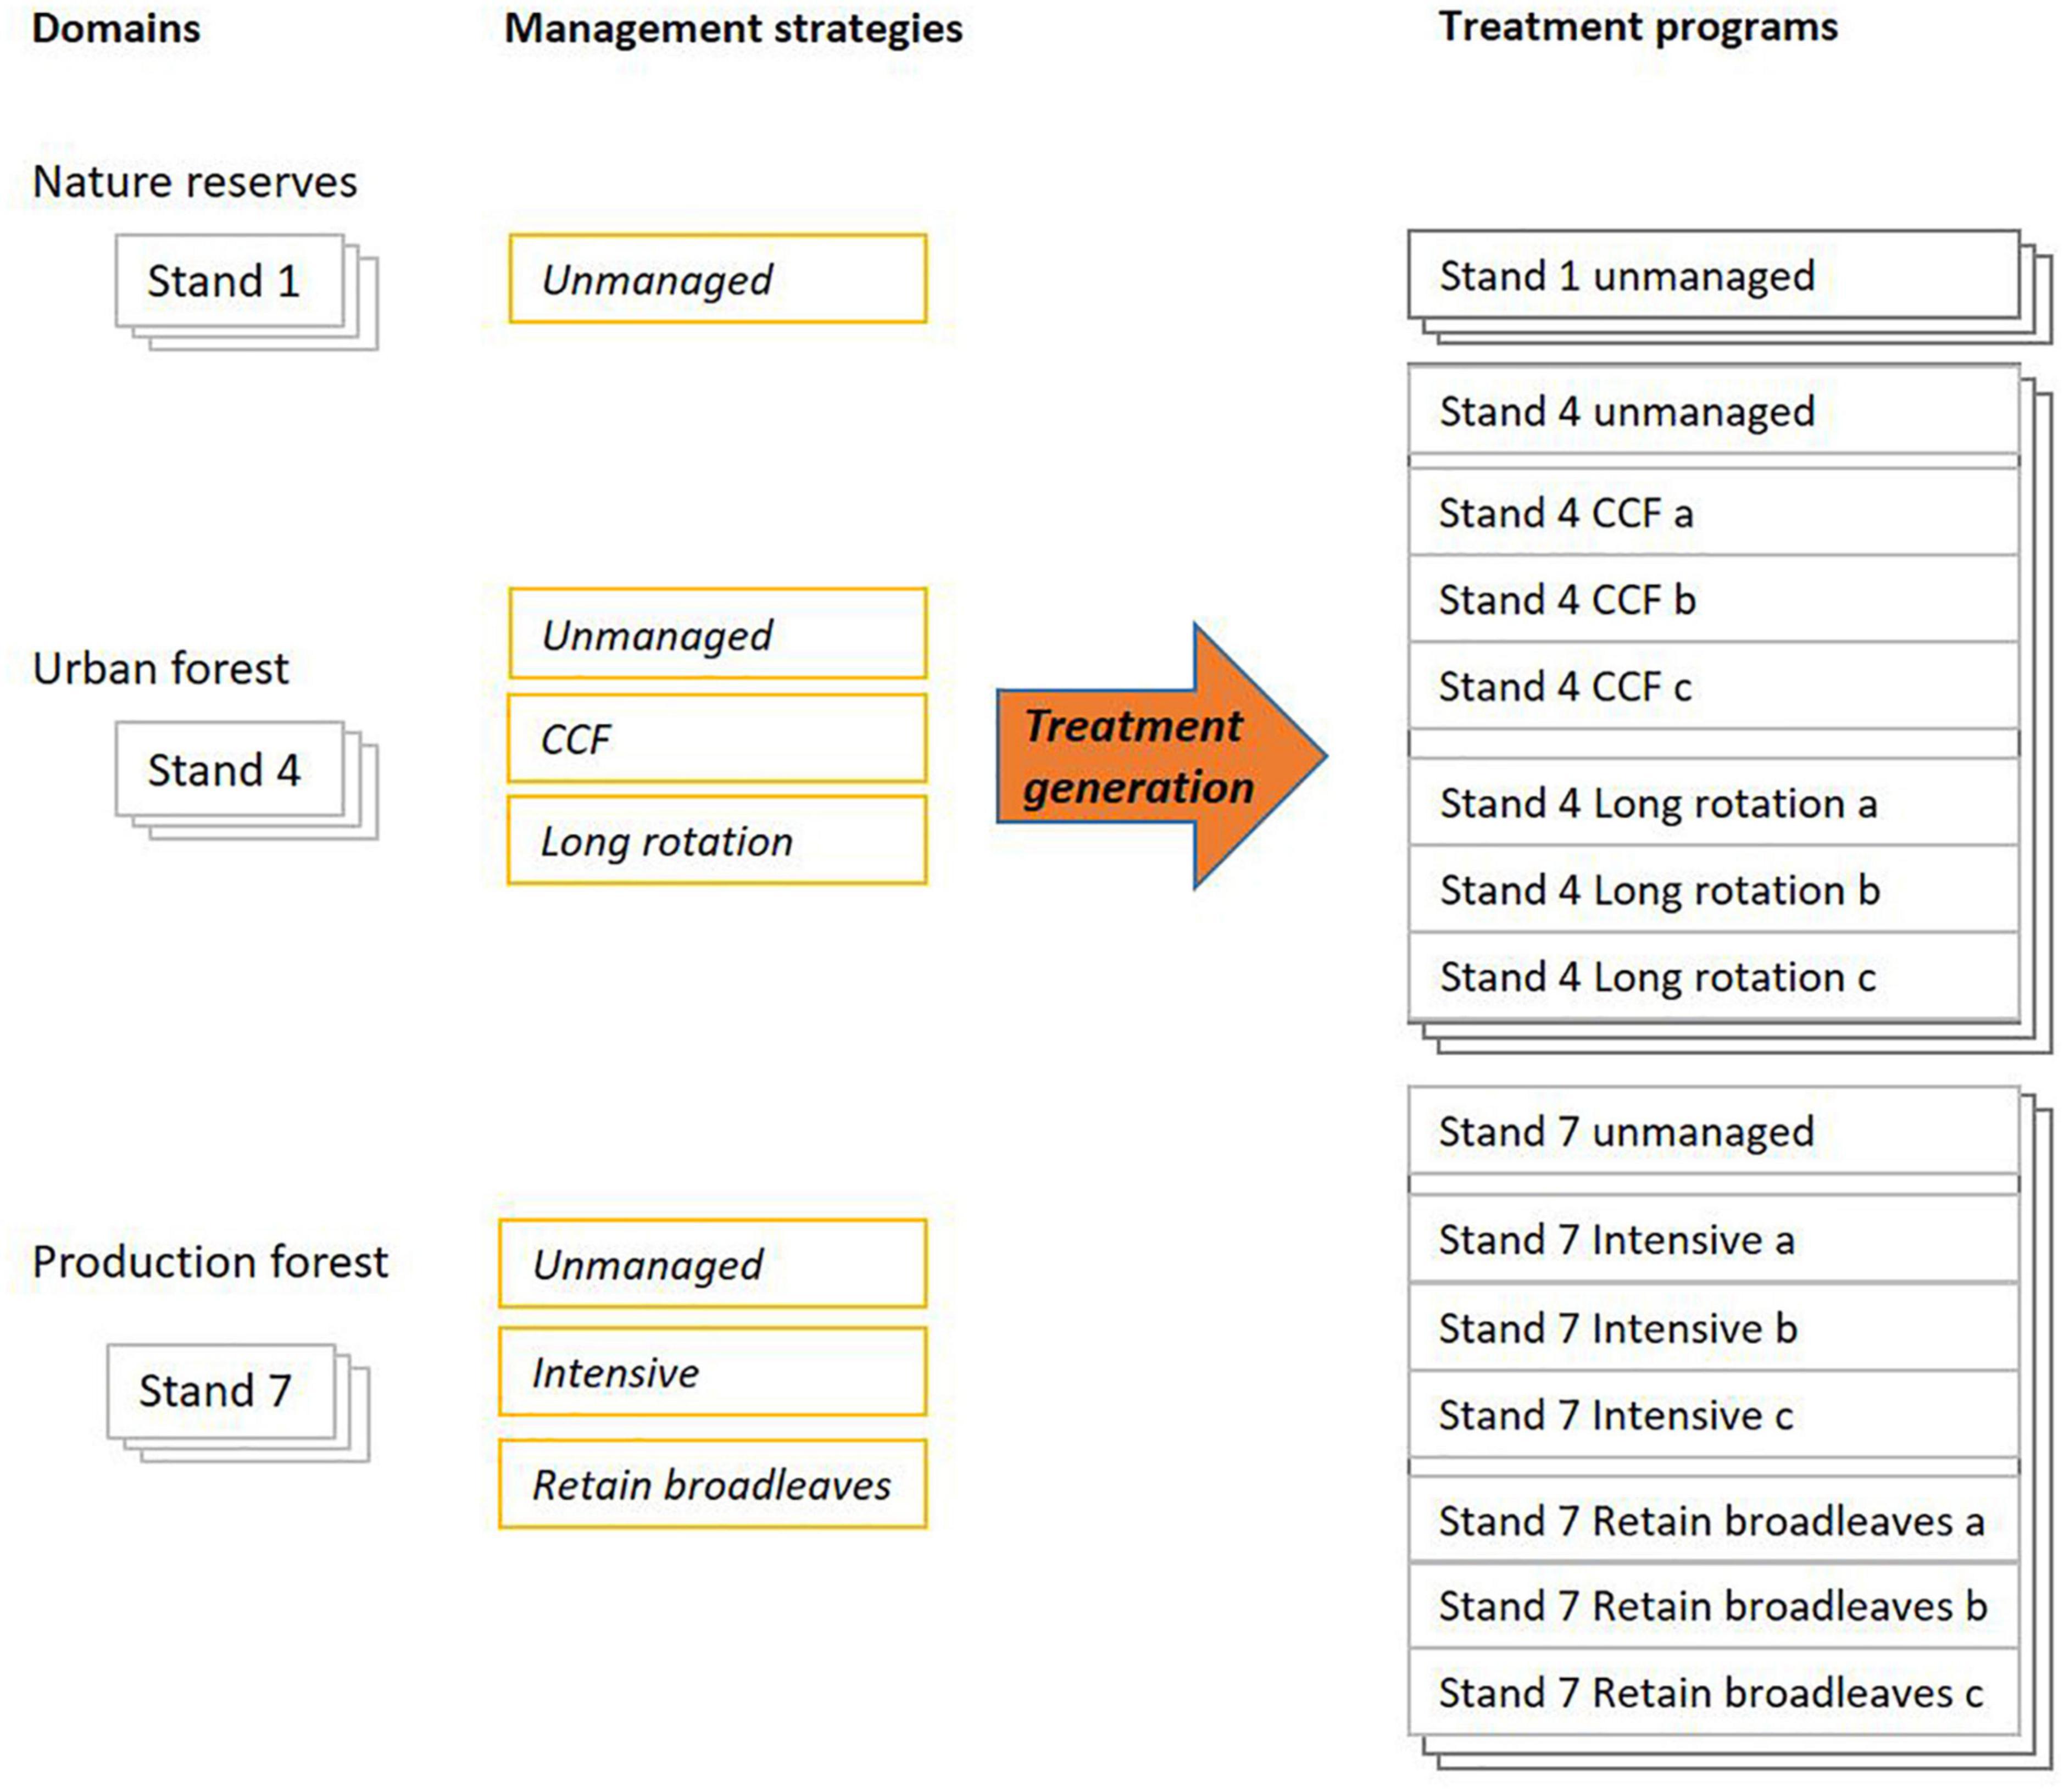
Figure 4. A tentative illustration of the terms domain (left), management strategy (middle) and treatment program (right), for the latter see also Figure 5 (cf. Eggers and Öhman, 2020).
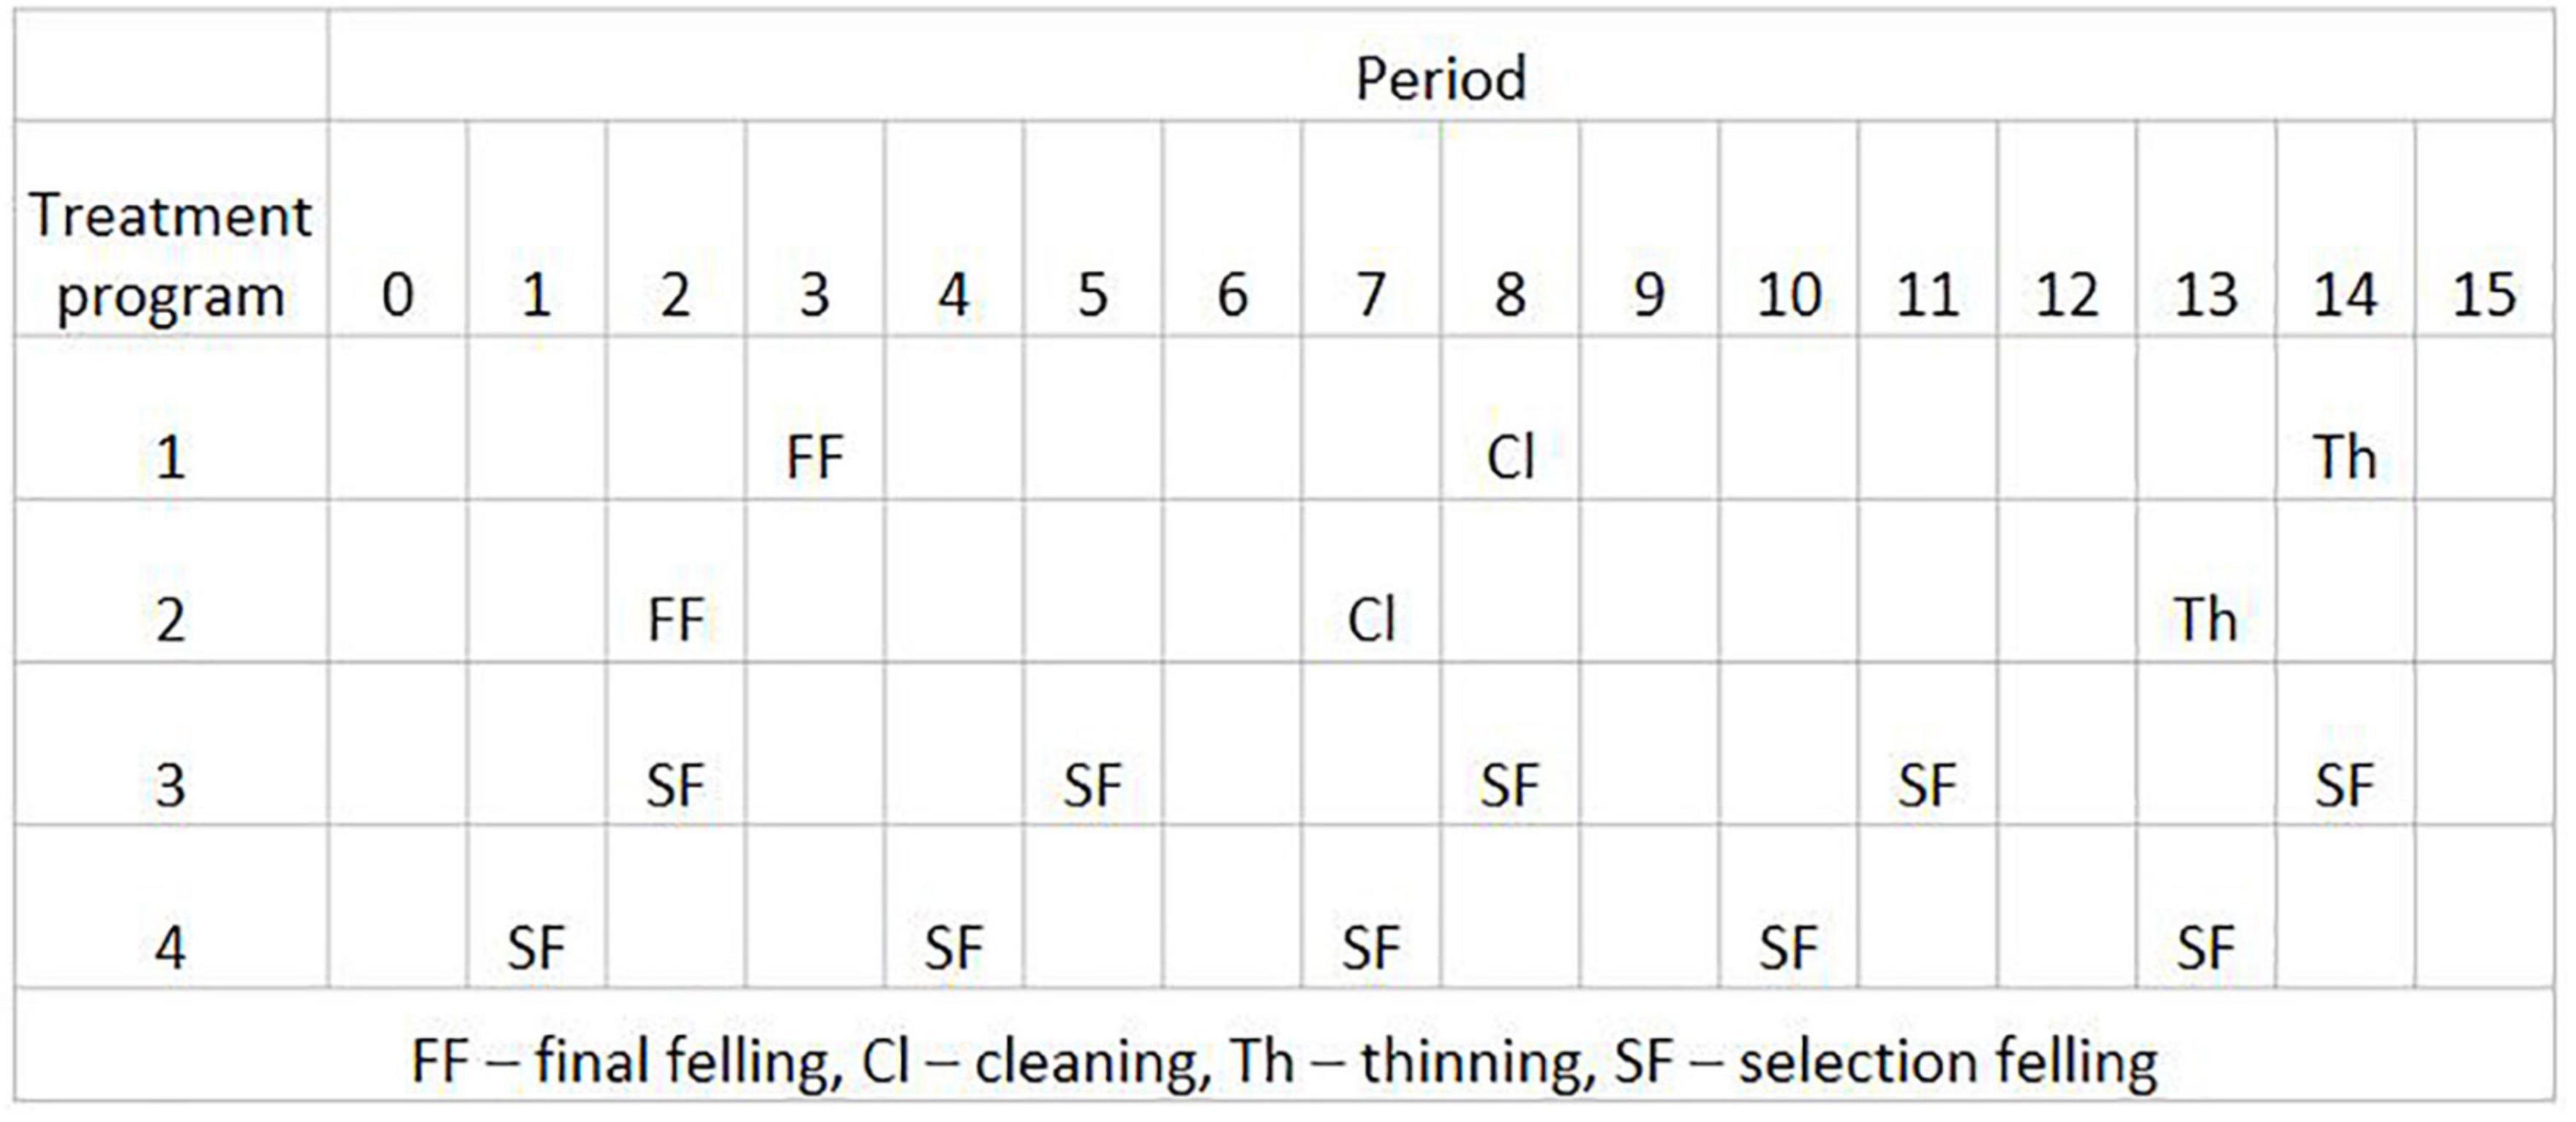
Figure 5. Potential treatment programs for an arbitrary treatment unit over 16 5-year periods (cf. Eggers and Öhman, 2020).
The optimization tool, which is a graphical user interface to the ZIMPL optimization modeling language (Koch, 2005), finds the optimal combination of treatment programs for each treatment unit so that the user-defined objective function is maximized or minimized, while the user-defined constraints are fulfilled. The objective function and the constraints can be based on any of the parameters projected by Heureka in the TPG or a combination of several as long as response of the output of interest could be expressed as a sum over the treatment programs for the treatment unit. Typical examples of objective functions are: NPV; total harvest volume over the entire planning horizon; and area of old forest at a certain point in time, or average over time. Examples of constraints are even timber flow constraints (the harvest volume should not vary too much over time), area proportions that are to be left unmanaged or managed with selection felling, the standing volume of broadleaves not decreasing, and the standing timber stock in the end compared to the beginning of the planning period.
The optimization problem is solved with either linear programming (LP) or mixed integer programming (MIP). This depends on whether the decision variable, i.e., the proportion of the area of a treatment unit that is assigned to a certain treatment program, is defined to be continuous, i.e., can take any value between 0 and 1 (LP), or binary (MIP), i.e., can only take the values of 0 or 1. The practical implication of this aspect is whether it is allowed to split treatment units and assign different treatment programs to the different parts. For solving the optimization problem, the open-source MIP/LP solver CoinOR CBC/CLP (Lougee-Heimer, 2003) is included, but also external third-party solvers (CPLEX, GUROBI, or MOSEK) can be used and directly linked to the optimization tool in PlanWise.
Typically, PlanWise is used for strategic analysis with 5-year periods over time horizons of 30 to 100 years. For more short-term and detailed planning, a tactical TPG is available mainly intended for harvest planning of e.g., harvest volume assortments per season and year, but potentially also for other uses. In the tactical TPG, the user sets the number of planning periods and period length (1–5 years), and 5-year projections of forest development are resized to reflect development corresponding to the stated tactical period length. Only a single harvest action per treatment unit can be simulated during the tactical planning horizon, which in practice limits the horizon to roughly 15 years. The same use of management strategies is available when running both the strategic as well as the tactical TPG.
Models projecting forest development
The large number of interlinked models projecting the development of the tree layer over time are of central concern in a forest DSS as most other aspects rely on the outcome of these models. In many cases, users of the Heureka DSS are given a choice between different growth models.
For stand establishment on initially bare land or after final felling, height and species distributions in the new stand are either imported from a large database containing data from field-measured plots (Elfving, 1982) or estimated with functions based on data from the same database. Growth of seedlings/plants is calculated with height growth functions (Elfving, 1982, 2011d). Damages on young trees (2–6 m) are simulated according to Näslund (1986), and lead to mortality and reduced height growth. The level of damage can be individually controlled for damage caused by moose, vole, snow-break, snow-blight, frost and whipping.
The growth models concern two key stages of stand development: the stand establishment period and the development of the established stand, both modeled in 5-year time steps. The transition between these stages is at 6–7 m stand height. Basal area growth of established forest is modeled by individual tree models of Söderberg (1986) or, by default, of Elfving (2011b). The individual tree models are by default used in combination with a stand level basal area growth model of Elfving (2011a). Elfving’s basal area growth functions are valid for most native Swedish tree species, individually (Scots pine, Norway spruce, aspen, beech, oak) or in groups (birches, other deciduous–noble and trivial, respectively). Larch and Lodgepole pine (the single exotic species handled) are handled as Scots pine. For a full listing of species and species groups, see Supplementary material. When used, the stand level model projects the total growth and the individual tree model then distributes the total growth to individual trees. The models are based on data from the Swedish National Forest Inventory (NFI) and have been evaluated using NFI data and data from long-term field trials with a wide variation of treatment programs (Fahlvik et al., 2014; Aldea et al., 2023). The growth models are quite accurate for even-aged forest management in single-species and mixed stands. Uneven-aged management, on the other hand, has for decades been practised to a negligible extent in Sweden. Data as a basis for growth models for this management is very sparse in the NFI, making the growth models for uneven-aged management less accurate. For a multi-layered forest stand, Drössler et al. (2015) show that the models in an 8-year growth projection underestimate basal area and volume growth.
The effects on growth due to climate change can be included by adjusting the empirical growth functions based on results from an analysis (50 × 50 km2 grid over all Sweden) with the BIOMASS process-based vegetation model (McMurtrie et al., 1990). Three climate scenarios are available, ECHAM5_A1B, MPI 4.5 and MPI 8.5 (Freeman, 2009). The process-based vegetation model does not, however, account for increased risks that are expected to follow climate change, such as more frequent storm-fellings, summer droughts and insect infestations.
Height development in established stands is modeled by functions of Elfving and Kiviste (1997) for Scots pine and of Liziniewicz et al. (2016) for Lodgepole pine and there are also functions for Norway spruce (Elfving, 2003), birch (Eriksson et al., 1997), aspen, beech, oak and larch (Elfving, 2011c). Ingrowth of trees (diameter at breast height ≥ 4 cm) in established stands is calculated according to Wikberg (2004). A number of tree mortality models for established stands are available (users’ choice); models by Fridman and Ståhl (2001) or more recent ones by Elfving (2014) or Siipilehto et al. (2020), the latter being a result of joint Nordic research. Moreover, mortality of retention trees after final felling are handled separately with user-defined mortality rates [default settings based on Roberge et al. (2015)].
Non-productive forest land (productivity < 1 m3ha–1year–1) has largely been neglected in Swedish forest modeling until recently, when specific growth models for these areas were developed based on NFI data [Nyström, 2018 (Unpublished)2 ]. According to the Swedish Forestry Act (Skogsvårdslag, 1979) no harvest activities are allowed on non-productive land, but this land class is important to consider when it comes to other ecosystem services and biodiversity, it is for example included in forest carbon balances (Ministry for the Environment, 2019).
Above-stump tree biomass is estimated with either models by Petersson (1999) or models by Marklund (1988). Stump and root biomass is estimated with models by Petersson and Ståhl (2006). For young stands, above-ground tree biomass is estimated by models by Claesson et al. (2001). Decay of coarse woody debris is modelled based on Harmon et al. (2000), Kruys et al. (2002), and Sandström et al. (2007). There are also an optional parameter affecting the destruction of dead wood at final felling and subsequent soil preparation - if any - in the ordinary stands as well as in retention patches (Roberge et al., 2015).
The occurrence and decomposition of soil carbon and soil nitrogen on mineral sites are depicted with a mechanistic model, which is based on the so-called Q-model by Ågren and Bosatta (1998). Input to the Q-model is provided by a litter production model and by harvest residues. On organic sites, emissions factors are used if ditching is present, and constant values in the case of no ditching.
Forest data as a basis for analyses
The Heureka system can use different types of forest input data, mainly from two types of sources:
• Sample plot data, e.g., from forest company level surveys or from the Swedish NFI.
• Stand-level data, typically data from a traditional forest management plan or a stand register database, often including spatially explicit information of the stands’ extents. Thus, when using this type of data the user can also import a forest map and link it to the imported stand register.
The structure of the hierarchical forest data model is further described in the System design and programming section. Irrespective of the data source, a number of variables are needed to describe the current state of the forest and to allow projections of the tree layer. This concerns several site- and tree layer variables for each stand or plot:
Variables describing the site: stand/plot area (and/or the area that the plot represents in the case of plot level input), location (county, altitude, latitude), site index3, soil moisture, vegetation type of the field layer, and presence of peat. These variables are used to simulate tree growth, but they remain constant throughout the simulation.
Variables describing the tree layer: age, diameter, height and species of individual trees, or in the more common case of mean stand data: mean age, number of stems, basal area, and tree species distribution. Tree-species specific diameters and heights are optional, but it is recommended to include them as they improve the quality of the projections, and are simulated if not provided. Variables describing the tree layer are projected, i.e., they change over time.
In addition, the user has the option to include information on deadwood volumes, as well as a number of user-defined variables, describing, e.g., ownership or management class to be used in the subsequent analyses.
The three software handling forest dynamics use a common (dedicated) database containing initial forest information as basis for analysis and planning. Thereby, data from one and the same analysis area (individual stand, forest/estate or region) can be used in all three software.
Management strategies and silvicultural actions
Within the forest-level software (RegWise and PlanWise), the user can define which management strategies should be applied when projecting the state of the forest into the future, in so called control categories. The user can group treatment units into domains based on either their spatial location or their characteristics (e.g., dominant species, management class, protection status) and assign these groups one or several different management strategies (Figure 4).
A variety of management strategies can be simulated, including different variants of even-aged and uneven-aged management, nature conservation-focused management, retention practices and no management. A large number of parameters control how forest management is simulated in each management strategy, and the users can modify many of them. For example, when simulating even-aged management strategies, users can choose between several regeneration options (including planting, seeding, and natural regeneration with seed trees), fertilization regimes, settings for (pre-)commercial thinnings, rotation length–adhering to legislative restrictions or bypassing them for sensitivity analyses, if and where harvesting residues should be extracted as well as retention practices, such us leaving individual retention trees and high stumps. Also, shelterwood management and checkerboard management are available. Uneven-aged management is implemented as a series of selection fellings, which are parameterized and tested for spruce-dominated forest (Wikström, 2008) and include options for leaving retention trees. Management to benefit nature conservation values includes options to selectively clean or thin specific tree species (such as spruce), and to leave (a fraction of) these stems in the forest as deadwood. Altogether, the management alternative settings define a more or less broad management strategy framework of variation for different forest management programs. The given frames are then utilized differently in the different software, as further described in their respective sections.
Retention trees and retention patches can be generated in both even- and uneven aged management. Retention patches can be non-spatial, e.g., 5% of stand area can be retained but it is not stated where in the stands patches are located. Spatial retention patches concern two different cases, either retention patches are explicitly delineated in the imported forest map, or Heureka simulates patches (to a given area proportion of the stand) as a rectangular patch around the centroid of the stand.
Costs and revenues
Plantation costs are calculated by multiplying a user-defined per seedling cost with the planting density. Soil preparation costs are handled as a fixed per ha cost as entered by the user. Cost for pre-commercial thinning can either be handled as a fixed cost per ha or calculated with a density- and height-dependent time consumption function (Bergstrand et al., 1986) multiplied with a user-defined hourly cost.
Costs for harvest operations are calculated with time consumption functions for harvesters and forwarders in thinning and final felling (Brunberg, 1995, 1997, 2004) as well as for harvesters and forwarders in forest fuel thinning operations (Sängstuvall et al., 2012, 2014). The calculated operation times (depending on factors such as terrain, slope and stem density) are multiplied with an hourly cost for the machine type used. The function coefficients can be modified by users, for example if they have access to their own harvest operations cost statistics. Harvest residue and stump extraction costs are calculated via terrain transport distance dependent functions.
Cost for fertilization can be entered as a fixed cost or a cost that depends on the fertilizer amount and unit cost.
For calculating revenues from harvested trees, theoretical bucking is used (Näsberg, 1985), using dynamic programming and a pricelist defined for each assortment. Each pricelist may consist of a table with prices for each diameter class, with optional length correction factors. The quality distribution of harvested trees for each assortment can be set by the user. The default values are based on timber quality statistics from the Swedish timber measurement organization (Möller and Moberg, 2007).
Both prices and costs are handled in real terms, unaffected by inflation. Real price trends can be included by the user by setting a future relative price change at an arbitrary time breakpoint. For time periods between today’s prices and the time breakpoint when the future price applies, prices are interpolated. Prices after the selected breakpoint are assumed to level out. Cost trends can be set individually for each treatment type, and price changes for timber, pulpwood and biofuel can be set separately. Default costs are based on business statistics (Eliasson, 2022), whereas default prices are based on arbitrarily representative pricelists.
The NPV (Faustmann, 1849) is often used as an index of economic performance of different forest management alternatives. In Heureka, it is the sum of discounted revenues minus costs, and with the real discount rate set by the user. In PlanWise, the calculation of NPV is done for an approximately infinite time horizon. For even-aged forestry, PlanWise approximates an infinite time horizon by assuming that the third forest rotation management regime will be repeated in perpetuity. For uneven-aged management, the last cutting within the planning period is assumed to be repeated in perpetuity with a cutting time interval equal to the time elapsed between the last two cuttings projected. In RegWise, only the simulation period plus potential additional periods (number defined by the user) are used to calculate the NPV.
Result variables
There is a large set of result variables that can be calculated when simulating the development of the forest over time. Result variables are stored in a dedicated result database. To reduce execution times and data storage requirements, many variables are optional. Result variables include, among others:
• Basal area, diameter, height, age, number of stems, and volume, per species
• Above- and belowground biomass and carbon stocks of trees, per species.
• Soil carbon stock.
• Deadwood volume per decay class and tree species (pine, spruce, broadleaved species).
• Detailed information on silvicultural treatment performed (e.g., type of treatment, thinning form, thinning grade, treated area, biomass of cut trees, regeneration method).
• Harvest volume (timber, pulpwood, and fuelwood, per tree species and harvest type).
• Diameter distribution of cuttings.
• Harvested wood products (inflow, stock, and CO2 emissions).
• Harvest residue extraction (tops, branches, foliage and stumps).
• Current and mean tree growth (both net and gross).
• Natural mortality, per species and diameter class.
• Susceptibility indices for root rot, storm and spruce bark beetles.
• Recreation index.
• Carbon stocks in harvested wood products (pulpwood, sawn wood and wood-based panels).
• Means and standard variation for age, diameter, height, stems and volume.
• Structural diversity (whether a stand is even- or uneven-aged, tree size diversity).
• Costs and revenues, net present value, soil expectation value.
Note that only the tree layer is projected and changed over time. Site-level information (e.g., field layer, site index) remains constant throughout the simulation. The user can either export all result variables per treatment unit that are of interest and analyze them externally or use the built-in reporting functionality to get summaries of result variables. A number of standard report templates are available, but it is also possible to create new report templates. The report templates allow users to combine several result variables using conditions. Examples where such combinations are needed include the sum of forest area with a minimum volume of deadwood (of interest for, among others, the Swedish Environmental Objective “Living forests”), the volume harvested in final fellings, or the area of forest managed with a certain management strategy. Heureka also provides basic GIS functionality, allowing users to view results over time in maps.
Spatial analysis
In many forest management problems, spatial aspects are prominent, i.e., the choice of management depends on the location or how surrounding areas are managed. Examples include buffer zones around protected forests or waterways, controlling the maximum size of final felled areas (greening up constraints) or objectives to minimize fragmentation by maintaining large contiguous areas with old forest conditions.
In the Heureka DSS identification and delineation of buffer zones can be done directly with the built-in GIS-functionality by identifying stands situated within a buffer zone (categorized as buffer stands) and dividing stands that are partly within the buffer zone into: buffer stands if they are located within the defined buffer zone, or parent stands if they are outside (Lundström et al., 2018). Keeping track of the connection between the divided stands makes it possible to assume dependency between them, e.g., increased mortality in the buffer stand when the parent stand is final felled, or allowing some management in the buffer stand if it is done the same period as management is performed in the parent stand. A special feature of the buffer tool is also developed so that users who have access to blue targeting classification (Bleckert et al., 2011) can set the buffer width based on blue targeting class. Another tool for spatial analysis available in Heureka is built-in habitat models for six species (Perisorues infaustus, Bonasa bonasia, Dendrocopus minor, Harminius undulatus, Alectoria sarmentosa, and Sciuris vulgaris). The plans or scenarios generated with either RegWise or PlanWise can be analyzed with these habitat models to evaluate the area of suitable habitat for the corresponding species. The models check whether an individual stand fulfills the habitat criteria - including edge effects along stand borders if applicable (local scale), and optionally also if criteria for the surrounding forest are fulfilled (landscape scale). Users can also define their own habitat models.
In PlanWise, spatial aspects can also be handled during the optimization (for more details on the optimization, see the section “PlanWise based on a optimization framework” below). Built-in spatial pre-calculation tools together with the optimization models can be used to solve different problems involving spatial aspects. The pre-calculation tools include the option to calculate the length of common stand borders between adjacent stands, specific cliques and clusters needed for an extended area restriction model (Goycoolea et al., 2005), and to compute the area of other individual stands within the neighboring area of a specific stand (within a user specified radius from the specific stand centroid). The outcome of the pre-calculation tools can then be used in the objective function or constraints in the optimization.
Natural disturbances (storm, bark beetle, root rot)
Natural disturbances are mainly included as indicators describing the susceptibility of a forest for different disturbance types – storm, spruce bark beetles and root rot. In Scandinavia, storm felling is one of the largest catastrophic events affecting forests. The storm susceptibility index is based on empirical functions developed from data on storm fellings. It assesses the predisposition of forest stands to storm fellings, based on local conditions. This allows users to analyze the change in susceptibility over time given different management strategies, and to compare different management strategies. It is also possible to regulate the length of edges prone to storm felling (due to large height difference between stands) in the optimization, and thus plan for more storm-resilient forest landscapes (López-Andújar Fustel et al., 2021). The spruce bark beetle index (Nordkvist et al., 2023) describes the relative susceptibility of forest stands to the occurrence of spruce bark beetle infestation. The index is based on empirical findings and expert opinions and takes both climatic and stand variables into account. The root rot index gives the basal area, volume and number of stems that are likely to be infected by root rot, based on functions developed using the Swedish NFI data (Thor et al., 2005).
Besides the susceptibility indices, a storm module is available in RegWise. It is based on the historical frequency of storms (1953–2012) and NFI data on volumes of storm-felled timber and salvage logged timber at the same storm events. A wind damage model (Lagergren et al., 2012) has been calibrated to reflect the damage levels in the historic data. In the model, stand attributes like tree species, tree height and time since last thinning are included. Calibration is performed by adjusting a wind factor in the model. Users can change both the timing, frequency and strength of the simulated storms.
Heureka software for evaluating and ranking different alternatives (PlanEval)
The fourth software in the Heureka suite is PlanEval, based on MCDA, and used for systematic ranking and evaluation of plans or scenarios (in this section called alternatives) generated with the other Heureka software. However, since PlanEval is a standalone software, it can also be used in analysis where the alternatives are generated with some other system. The ranking and evaluation of alternatives can be done by either one or several decision makers or stakeholders (in this section jointly called stakeholders). This allows PlanEval to be used in group decision-making situations or participatory planning processes. Unlike the other software in the Heureka suite, PlanEval is available both for local installation and as a web application.
In PlanEval, a finite number of alternatives are evaluated with the help of a four-step procedure. In step 1, the criteria against which the different alternatives will be evaluated are defined. Different stakeholders can weigh different criteria. In this step, it is also defined which criteria each stakeholder is allowed to weigh and which alternatives they are allowed to evaluate. In step 2, the stakeholders assign weights representing the relative importance of each criterion according to their preferences using either Analytic Hierarchy Process (AHP) (Saaty, 1990) or Simple Multi-Attribute Rating Technique (SMART) (Olson, 1996). In step 3, the stakeholders evaluate each alternative in terms of how well the alternatives perform in terms of each criterion. For this, the same methods as in step 2 may be used, but it is also possible to create value functions in cases where the outcome of a criterion for an alternative can be described quantitatively, e.g., by an average value for all periods. Finally, in step 4, an overall ranking of the alternatives is calculated, showing which alternative is the most suitable one, considering the preferences of the stakeholders and the alternatives available. The ranking is based on both the weighting of the objectives and attributes in step 2 and the evaluation of alternatives with respect to each attribute in step 3. If there are several stakeholders involved, both their separate rankings of alternatives are reported but also their combined ranking. The combined ranking is done either by calculating the arithmetic mean of the individual rankings or by using a weighted average, which means that the stakeholders will have different influence on the overall ranking.
System design and programming
Hierarchical forest model
In Heureka, forests are divided into area nodes, which can contain further sub-area nodes and treatment units. Treatment units, in turn, can be divided into several cells which each link to a reference unit. An area node can be any area, such as a holding, landscape, or forest. A treatment unit is usually the equivalent to an individual stand or individual (e.g., NFI) plot and is the lowest level at which a treatment (such as thinning or final felling) is applied. A cell is an abstract construction, which links a reference unit to a treatment unit while keeping information of the reference unit. A reference unit is the representation of a sample plot at which all trees have been measured. The data in a reference unit can either be from actual measurements of a sample plot or imputed. The relationship of cells to reference unit allows several cells to share a reference unit.
System architecture
Heureka uses a multitier approach to systems architecture divided into three tiers: base layer, domain layer, and application layer. The base layer contains common functions not specific to the domain (here: field of application, not to be confused with domain as a forest management strategy term elsewhere in this text), such as math utilities, database-, error-, and configuration-handling. The domain layer contains subsystems, or modules, which are divided conditionally on their respective function. These modules comprise the core of the Heureka system. The application layer contains the composite applications built from functions in the domain layer (i.e., PlanWise, RegWise, StandWise, and PlanEval).
Many of the more time-consuming calculations are parallelized, such as the calculation of initial state, evaluation of forest domains and the generation of treatment programs in PlanWise, yielding large performance improvements over the single-core case.
Heureka uses Microsoft SQL Server (Microsoft Corporation, 2023a) as database engine. For spatial computations and map renderings, Heureka uses DotSpatial’s GIS-library (DotSpatial, 2023). DotSpatial is free, open-source, fast, and provides a lot of features that form a foundation for Heureka’s GIS-capabilities. A user can use Heureka to inspect the initial state and results after optimization directly without using third-party GIS-software.
Heureka also contains a plugin framework. Several built-in functions can thus be replaced by a third party that needs to use their own models. Examples of functionality supporting user plugins are: single-tree growth, stand-level growth, forwarder- and harvester-cost, and LP/MIP-solver. Reversely, Heureka models are also implemented in an API, which allows integration of Heureka functionality in external software.
The software suite is written in C# and is developed in Visual Studio 2017/2022 (Microsoft Corporation, 2023b). Heureka targets.NET Framework 4.5.2, and supports Microsoft SQL Server (2008 or newer).
Applications of the Heureka system
The first version of the Heureka DSS was released in 2009 and the system is now widely applied in research, teaching, environmental analysis, as well as in practical forestry. Some of its uses are presented below. Concerning the research area, the Heureka DSS is used within several research disciplines such as forest management and planning, silviculture, ecology and soil science. Research is also a major driver for further development of the system; thus, research applications are described in a separate sub-section below.
Practical forestry: Swedish large forest companies use Heureka PlanWise predominantly with a strata-based sample approach in their strategic forest management planning. An area-based (spatially comprehensive) approach is, however, getting more common (Ulvdal et al., 2022) and is more frequently used by small- and medium-sized forest owners. Either way, the choice of PlanWise means that an optimization approach is used, often to find strategic forest management plans (expressed as harvest levels over time) that maximize the decision makers’ goal fulfilment with the forestry. Typical for such analyses is to maximize the NPV of the forestry at a specified interest rate, subject to even flow-harvest and ecological restrictions, using the strategic module spanning over a 100-year horizon with 5-year period length. Different forest owners/managers use Heureka with slightly different approaches depending on the aim of the analysis. Two main use cases can be identified in practical forestry: the first case concern exploratory analyses in which e.g., management settings or other contextual input (cf. Figure 1) is altered, and the software and results are used as decision support mainly in relative terms for e.g., silvicultural guidelines. The second case concern business analyses where the quality of input data is controlled, management strategies are given, and the results are used mainly in absolute terms for e.g., forest holding appraisal and/or wood procurement agreements. Combinations of the two use cases are common among users. Only a few applications of the tactical module in PlanWise are known (Flisberg et al., 2014; Asmoarp et al., 2020). International applications of the Heureka system in practical forestry have been noted in, e.g., Norway and Latvia, facilitated by the growth model plugin functionality.
Carbon accounting: Sweden annually reports emissions of greenhouse gases to the Climate Convention and to the EU. SLU is responsible for the land use sector, Land use, Land use change and Forestry (LULUCF). RegWise, together with data from the NFI, is used as projection tool within the national carbon accounting framework (European Union [EU], 2018). The development of the carbon pools living biomass, soil carbon (including stumps), deadwood and harvested wood products within the LULUCF sector is simulated and transformed into emissions of CO2. One example of these projections is the Forest Reference Level (Ministry for the Environment, 2019). According to the Paris Agreement, EU member states were obliged to set a reference level for the LULUCF sector for the period 2020–2030 to which the actual emissions are compared. This was done by mimicking forestry as it was carried out during the period 2000–2009 during the simulations.
National forest impact analysis: In 2022, the Swedish Forestry Agency published results of a national forestry impact analysis (termed SKA 22, Bergqvist et al., 2022). The analysis was done on behalf of the government and in collaboration with SLU, using Heureka RegWise. This kind of impact analysis is done every 5–7 years in Sweden to assess the future needs and potential for forest raw materials, biological diversity, and other benefits the forest can provide as well as projections of the forest’s development given different scenarios. The 2022 analysis included six scenarios that differed in how the forest is managed and what the aim of the forest management is–ranging from focusing on increasing wood production, to climate adaptation and biodiversity, and including a business-as-usual scenario that continues current management practices. The analysis serves as decision support for the forest sector.
Teaching and contract education: The Heureka DSS is used in teaching at SLU, but also at other educational institutions. It is used on undergraduate, graduate, as well as on high school level. On graduate and undergraduate level, Heureka is used by students to compare the estimated consequences of applying different management strategies and goals on specific forest properties. On high school level, focus is on a combination of harvest simulators and StandWise, thereby integrating the topics of forest operations and silviculture. Interdisciplinary usage is appreciated in teaching, e.g., how ecological and economic values are affected by a certain forest management, but even more the possibilities of observing cause and effect in virtual forests (instead of wasting real ones). Contract education has been given to forest companies of varying sizes but also consultants helping forest owners with forest management and planning. Such courses, spanning from hours to days and weeks, have been adapted to the client’s specific planning problem and system use.
Application within research
The design and capabilities of the Heureka DSS make it a versatile and powerful tool for analysis within different research disciplines. Several research projects have also initiated the implementation of functionality needed for the specific project, making it available for all users. Below is a short overview giving examples of studies from different research areas. A complete list of published scientific papers using the system4 (87 papers as in December 2022) is found in Supplementary material. The extent to which the system is used in the analyses varies, in some cases all parts of the analyses are done using the system or, in other cases, the system is used to, e.g., generate a set of potential management alternatives for each treatment unit (stand or plot), then transferring this information to other tools. As the core of the system concerns the development of the tree layer, it has frequently been used for examining the effect of different management systems or silvicultural actions on timber production. Examples include assessments of continuous cover versus clear-cut forestry (Nordström et al., 2013; Lundmark et al., 2016), regeneration efforts (Lula et al., 2021; Jonsson et al., 2022) and pre-commercial thinning (Fahlvik et al., 2015, 2017; Holmström et al., 2016). As above and below ground biomass is calculated in the system, several studies have assessed bioenergy potentials (Snäll et al., 2017; Eggers et al., 2020a), carbon sequestration as well as the combination of these two aspects (Cintas et al., 2017). Carbon sequestration is one measure of climate change mitigation, the latter being studied in relation to, e.g., forest owner behavior (Lodin et al., 2020), the entire Swedish forest sector (Petersson et al., 2022) and also combined with global scenarios for demand of woody biomass (Nordström et al., 2016).
The development of the tree layer sets the living condition for a multitude of forest-dwelling species. A number of published studies concern biodiversity aspects, e.g., in relation to rotation lengths and thinning regimes (Felton et al., 2017; Roberge et al., 2018) as well as intricate studies involving habitat models based on citizen science data (Bradter et al., 2021). Tree retention practices and voluntarily set asides are broadly practiced in Swedish forestry and the Heureka system has been used to explore long-term effects of these measures (Lämås et al., 2015; Roberge et al., 2015). Reserves (formally protected areas) is another measure to preserve biodiversity and Lundström et al. (2011; 2014; 2016) used the Heureka DSS to study strategies for reserve selection.
Forestry affects the water quality in streams, which has been the topic of several studies. Öhman et al. (2009) checked the effects of water quality criteria stated on catchment level versus stated on sub-catchment level. Tiwari et al. (2016), Lundström et al. (2018), and Sonesson et al. (2021) all studied the effects of different widths and management of buffer zones. Another landscape level aspect is reindeer herding, practiced on 50% of the Swedish forest area. Among others, forestry and reindeer herding interactions (Korosuo et al., 2014), forestry and reindeer herding value chains (Berg et al., 2016), the need for migration corridors (St John et al., 2016), and reindeer herding being a component in land use priorities (Horstkotte et al., 2016) have been studied. Forests also provide recreational opportunities and the balance between timber production and recreation–including the spatial distribution of high potential recreation forests–were studied by Eggers et al. (2018).
Forests are prone to several risk and uncertainty factors. Here, the Heureka DSS has been used to analyze adaptation potentials related to climate change (Subramanian et al., 2015), the risk of wind- throw (López-Andújar Fustel et al., 2021) and browsing damages of ungulates (Nilsson et al., 2015).
Forest management planning is typically divided into a hierarchy of different levels–strategic, tactical and operational planning. The Heureka DSS has been used in this traditional setting (Flisberg et al., 2014) but also to question this paradigm (Eriksson et al., 2014). Also, the potential for new planning approaches in terms of dynamic treatment units–contrary to the traditional static treatment unit approach–has been analyzed (Wilhelmsson et al., 2021, 2022).
Forests truly includes multiple goals and stakeholders, facts recognized when designing the Heureka DSS. Eggers et al. (2019) used the MCDA capabilities available in the PlanEval software to balance timber production, biodiversity, recreation and reindeer herding. PlanEval also enables participatory planning, a feature used by Nilsson et al. (2016) involving preferences of multiple stakeholders within a municipality in northern Sweden.
Based on assumptions on different forest policies, involvement of stakeholders, and uncertainties of future climate a plethora of different scenarios for forests and forestry are plausible. The Heureka DSS and NFI data have been used to form and evaluate scenarios in different settings. Eggers et al. (2020b) involved stakeholders to define scenarios to check how well these scenarios balanced economic and ecological values. In scenario analysis, the Heureka DSS has also been used in combination with a forest sector model to downscale global timber demand to national level (Eriksson et al., 2020).
Since most management decisions involve several objectives, it can be of interest to investigate the conflicts and synergies between objectives. One approach to doing that is by creating a set of pareto-optimal plans, i.e., plans where the result for any one of the objectives cannot be improved without impairing the result for another objective. Based on the possibility of an increased wood demand Eggers et al. (2022), used this approach for studying trade-offs between biodiversity and biomass harvest, including the potential for increasing biodiversity indicators while maintaining or increasing harvest levels.
Discussion
The vision of the research programme developing the Heureka DSS was to significantly contribute to the sustainable and multi-objective management of Swedish forests by providing up-to-date forest decision support tools for different stakeholders, ranging from governmental organizations to private forest owners (Anon, 2009). One specific aim was to enable analyses of different forest-related topics within the same framework, i.e., based on the same type of input data for the analyses and the same models used for calculations and projections. It should thereby be possible to avoid analyses using different data and models providing outcomes that are hard to compare or even – due to the methodologies and data used – contradictory.
The Heureka system is today widely applied in research, teaching, environmental analysis, as well as in practical forestry. Among the factors contributing to the broad application of the Heureka system are that the development of the system took place at a university, making use of broad expertise and long-term field data (in particular, the NFI data). Another factor was that the timing was right – there was a demand for a forest DSS dealing not only with wood production but also including other forest values. In addition, there was enough financing to engage professional system developers, which contributed to a flexible system architecture that allowed for adding new functionality over time. However, yet importantly, the development would not have been possible without committed and enthusiastic people dedicating their time and energy.
System development and maintenance
A university being the main body for system development has pros and cons. A system like Heureka contains a large amount of research results in terms of models and approaches from different research disciplines. The development of the system as well as applications of it can thereby serve as a communication link - spreading research results–between different disciplines enhancing transdisciplinary research. Operating a large IT project at a university may, however, be seen as an odd activity - not a core university business. Here, two factors can be mentioned. First, Heureka predecessors (the Forest management Planning Package [Indelningspaketet in Swedish, Jonsson et al., 1993) and Hugin (Lundström and Söderberg, 1996)] were also developed by SLU and thereby such activity had been done earlier at the university. Second, besides research and teaching, public outreach is another task for Swedish academia, including information to and communication with the society and stakeholders. Here, a DSS like Heureka acts as an important channel continuously transferring research results to applications in the forestry, environmental and energy sectors. Maintenance and further development of any IT system is a challenge. Since the release of the first Heureka version in 2009 the continuous administration, management and development of the system have been handled by SLU (see the SLU Programme for Forest Sustainability Analysis).5 The decision to let SLU continue as the main body was taken after discussions with stakeholders in the end of the research programme. System maintenance is organized in a broad consortium with co-financing of research by authorities, forest owner associations and industrial organizations, a construct that ensures relevance among stakeholder categories. The location at SLU ensures direct connection to state-of-the-art research in all relevant forest-related topics and has been key in keeping Heureka as a freeware. Some challenges exist with this solution, such as balancing interests among stakeholder categories and ensuring necessary system management and development competences but have been of manageable magnitude to this day. Here, the challenge of not ending up with the system in the hands of a few people is also to be mentioned. That is, the importance of transferring knowledge on system functioning and system design to new collaborators.
The Heureka system could potentially be published as open source, which would enable user-initiated development of e.g., sought-after spatial functionality. Possibilities and challenges associated with such solutions and more open data in general could be further investigated for guidance on potential development efforts to this end.
On the use of the Heureka DSS
Although frequently used, we still see the potential for an increased use of Heureka as well as any formal DSS within forestry. Barriers hampering wider use are found among users as well as within systems, such as user friendliness and functionality. Users need considerable knowledge and training to use Heureka. Although SLU includes the Heureka DSS in teaching on undergraduate as well as on graduate levels, there are still few advanced users outside of SLU. On the one hand, any advanced DSS quite naturally requires proficient and well-trained users; on the other hand, a system should be user-friendly and intuitive. A potential further development is a less complex, user-friendly system that can be used intuitively and does not require users to install any software on their computers (discussed in terms of “Heureka light”). In this context, complexity vs. simplicity is a prominent issue both from a user as well as from a system design perspective; the details and complexity desired in some cases vs. the (limited) functionality needed to analyze other problems. It naturally relates also to, among others, system complexity, time for running analyses, need for data and database sizes (c.f. Eriksson and Bergh, 2022).
The research papers using the Heureka DSS for analysis are published in 36 different journals, indicating a broad spectrum of research areas (Figure 6 and Supplementary material). The majority of the studies, however, concern economic aspects. Most of these studies combine economic and ecological aspects, in a dozen cases also with social aspects, i.e., combining all three aspects. Studies handling only ecological or social aspects are few. Climate factors (mitigation or adaptation) are most frequently handled in combination with economic aspects. A handful of studies concern climate as a single factor. Of the three software handling forest dynamics, PlanWise is most frequently used, i.e., the software based on optimization for finding preferred solutions. StandWise (interactive simulation) and RegWise (rule-based simulation framework) are used at roughly the same frequency. The PlanEval MCDA software is used in less than ten papers, most often in combination with PlanWise. Based on these published papers we still see a potential for an expanding use of the system within non-traditional forestry topics, i.e., ecological and social aspects, and in integrated analysis covering several different aspects. Concerning the use of the different software, it might be that the optimization-based software PlanWise - used in more than half of the cases - is applied more or less routinely. Instead, applying the rule-based simulation framework in RegWise might be more appropriate and straightforward for some analyses.
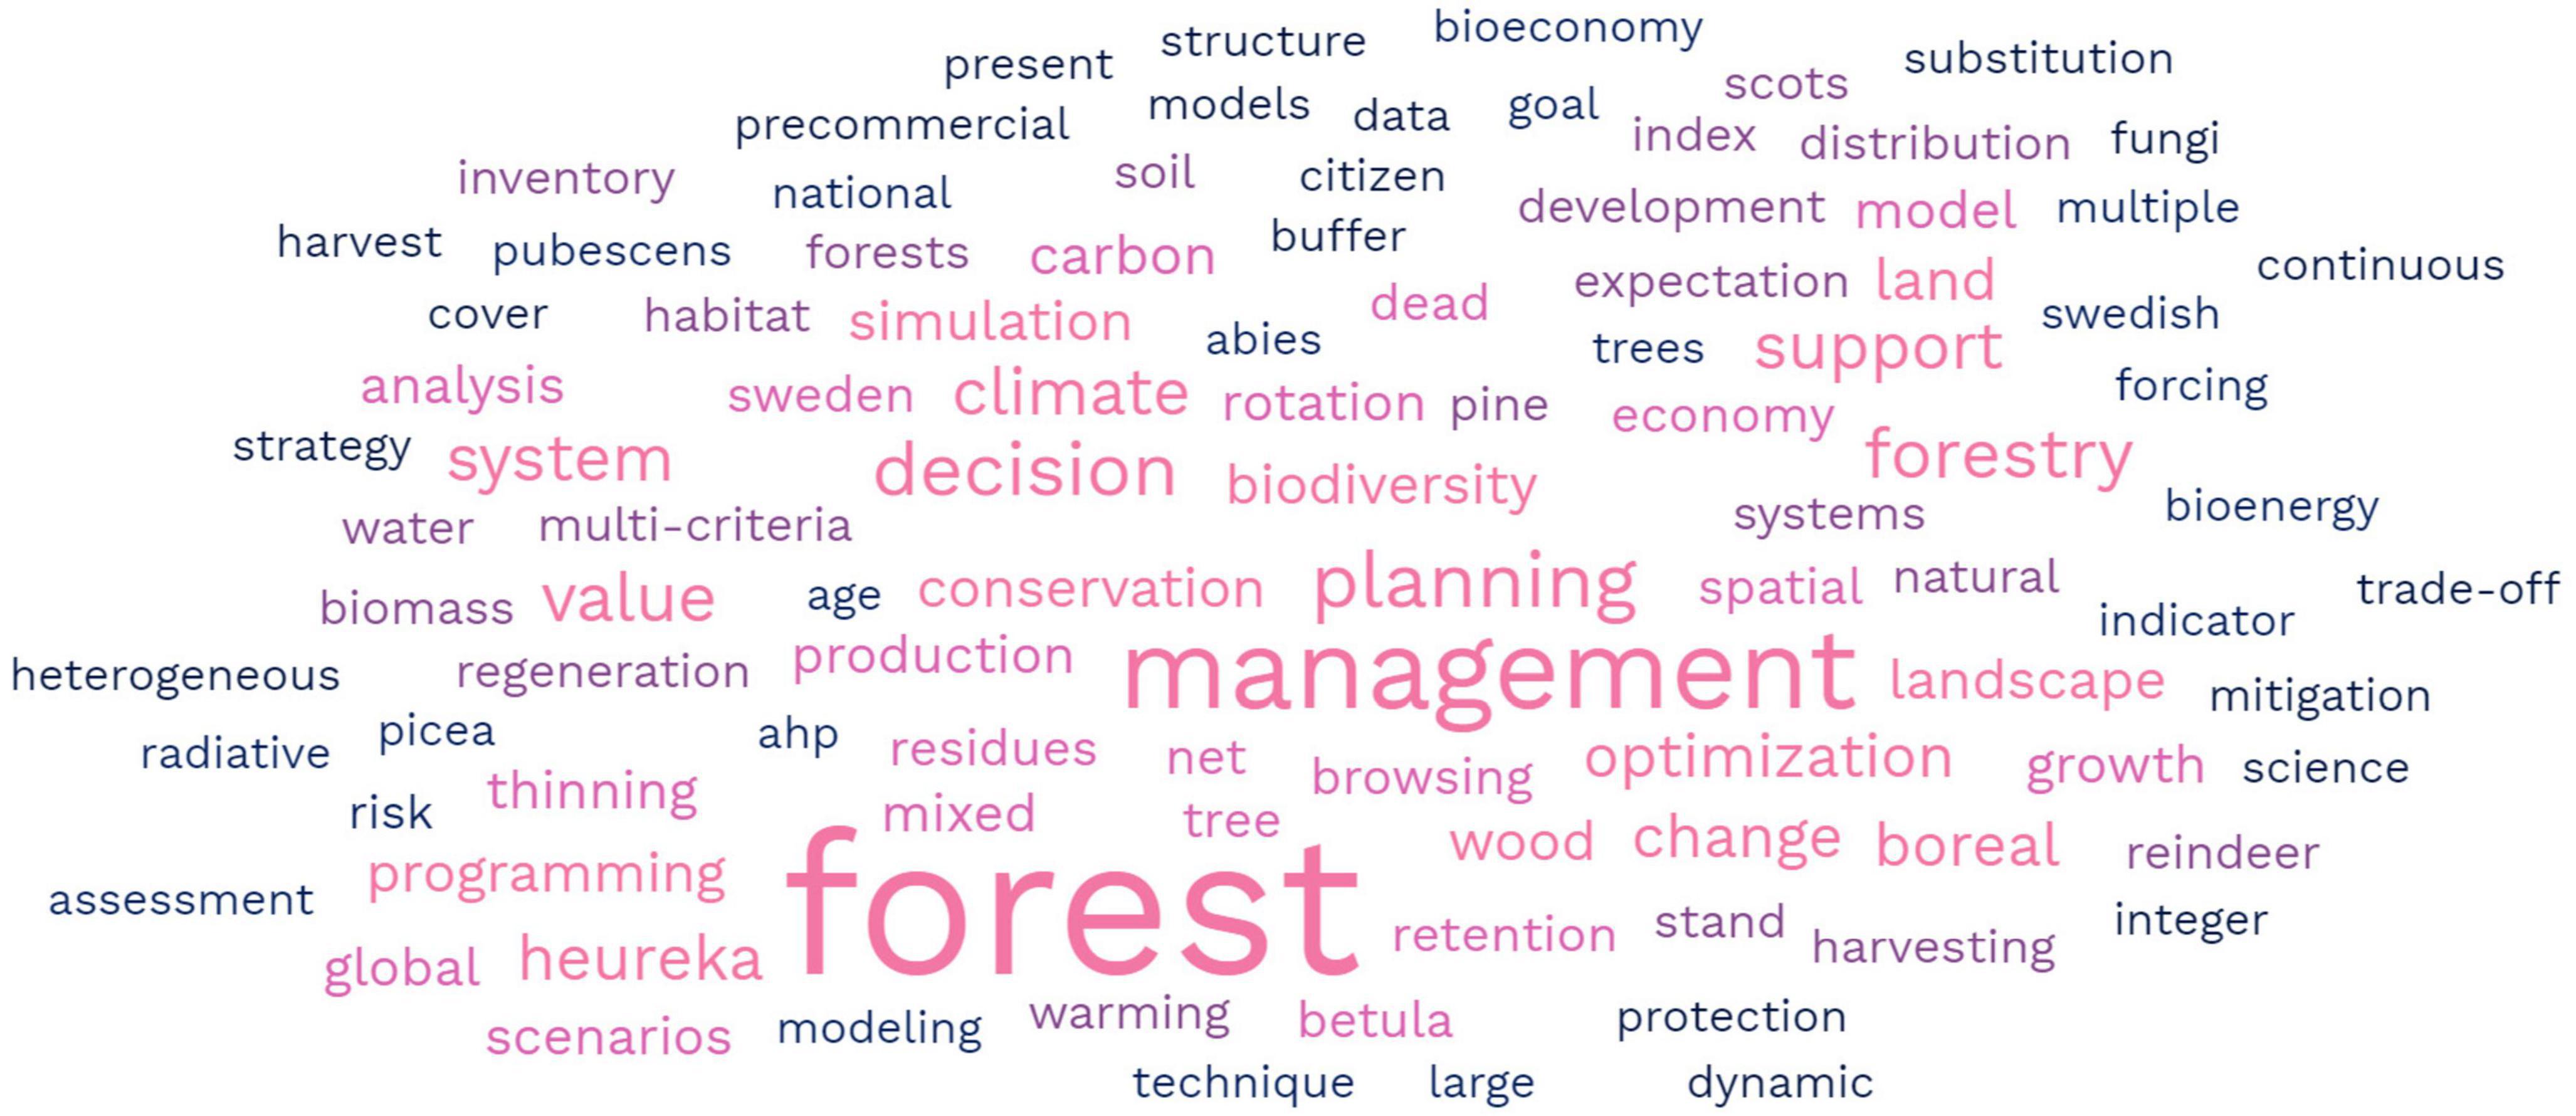
Figure 6. A word cloud made out of the keywords for the 87 scientific papers (16 papers did not include keywords) including analyses using the Heureka DSS (as in December 2022), see Supplementary material.
System functionality
The division of Heureka into three different software for handling forest dynamics is related to the diverse mechanisms used for assigning forest management activities to treatment units among the three software (interactive simulation, rule-based simulation and optimization, respectively). It is partly a legacy from similar structures in the Heureka predecessors [c.f. systems built in a strict modular way, e.g., the Finnish SIMO (Rasinmäki et al., 2009)]. Consequently, additional differences among the software have emerged over time. It makes sense to reconsider this structure in the designing of the next generation of forest DSS (e.g., successor of Heureka), since more complex diversifications of other processes already exist within the individual software. Still, it is notable that there exists only one version of the system (the four individual software). You could easily think of one version for researchers or very advanced users and another version for other users. The single version so far simplifies system maintenance as there is only one version of the system (the four individual software).
Spatial problems typically grow to large combinatorial problems. Such problems, as well as large non-spatial problems containing many treatment units are troublesome to solve with exact optimization methods. Despite the name, heuristic methods, i.e., methods using the computational power of computers to search for good solutions, are so far not implemented in the Heureka DSS. Instead, the PlanWise software is based on exact solution methods (LP and MIP). Traditionally, exact methods are applicable only to small problems due to the long solution times for large and complex problems. Developments in efficient problem formulations, computing power and advanced solvers have now made it possible to solve larger problems than before. However, there are still problems that can only be described by non-linear functions, which prevent the use of methods such as LP or MIP. For these problems, different heuristics would be an option.
The Heureka DSS builds on empirical growth models, which have the inherent weakness that it is difficult to capture rare occurrences in the modeling. This means that while the system includes some functionality when it comes to management strategies that are rare in Swedish forestry, such as continuous cover forestry, the results produced are more uncertain than for the mainstream even-aged forestry. Moreover, contrary to process-based models, empirical models are not good at depicting cause and effect relationships (Larocque, 2016; Felton et al., 2017). The Heureka system applies a hybrid model for considering effects of climate change on tree growth, thereby combining empirical with process-based models.
Further, the system set-up also imply that the economic value of timber production is the overriding objective, such as the sorting of treatment schedules according to net present values, and net present value being the default objective function in optimization models. In addition, the system so far lacks models that allow users to simulate the development of other vegetation than the tree layer, thus ignoring, e.g., the impact of the tree layer on the ground vegetation. Here, work is though ongoing to include models for the presence and distribution or dwarf shrubs.
Empirical growth and yield models typically have their roots within the discipline of forest management and planning, the focus being timber production [e.g., Heureka and the Finnish MELA (Nuutinen et al., 2011) and MOTTI (Hynynen et al., 2015) systems]. As is the case with the Heureka DSS, the scope of such systems is often progressively broadened to include aspects related to, among others, environmental and nature conservation aspects. Forest succession models, on the other hand, have their roots within ecological research (Larocque, 2016; Felton et al., 2017). These models describe successional pathways based on mechanisms and processes for seedling establishment and tree growth and mortality [e.g., systems like JABOWA (Ashraf et al., 2012) and LANDIS (Mladenoff, 2004)]. Successional models might be preferable when considering seed dispersal, wildfire spread, wind-throw risk, or pest outbreaks (i.e., when internal ecological feedback is of importance for modeling forest development). Systems of this kind, like LANDIS, often also include timber management activities. Thereby, the two types of systems - systems stemming from forest management planning vs. systems stemming from ecological research - are converging and may handle partly overlapping concerning problem areas.
Spatially explicit wall-to-wall high-resolution data based on combinations of field surveys and remote sensing are becoming frequently available. One such example is the Swedish grid cellmaps based on data from national laser scanning projects and data from the Swedish NFI (Skogsstyrelsen, 2016). Although such data have been used as forest input data in Heureka (e.g., Lodin et al., 2020), there are so far no streamlined import routines. Among other things, this type of data typically does not include all variables needed and consequently missing data have to be handled. Routines to handle this sort of data (including missing data) are urgently needed if, among others, approaches such as dynamic treatment units evolve further (Wilhelmsson et al., 2021, 2022).
A current focus area for further development of the Heureka system is to broaden the consideration of risk and uncertainty in the analysis framework, in addition to the aforementioned natural disturbance models. Functionality for Monte Carlo simulation is currently being implemented in RegWise. The Monte Carlo functionality will allow for arranged repeated simulations and special result visualization. It is intended to be used along with stochastic models, some already implemented such as mortality.
Reflections and recommendations
When initiating the development of the Heureka system in the end of the 1990s, there was a fairly clear view of what should be the outcome of the effort (Dahlin et al., 1997). At that time, there were changes in forest policies, new knowledge emerged in disciplines such as landscape ecology and conservation biology and management approaches were formed like New Forestry in the Pacific North West, US (Swanson and Franklin, 1992). It was clear that new DSS were needed to replace DSS single-focused on timber production. Still some aspects were considered more or less as given such as forest development modeling (tree growth, etc.) was considered to be fairly straight-forward and the number of management alternatives quite limited.
In our opinion, the field for developing the next generation of forest DSS is now wider open then before; deeper and broader knowledge in related research disciplines, more modeling approaches available, a more diversified and contradictory expectation of forest management and forest uses, as well as a multitude of alternatives for building computerized systems. An obvious general and global factor is the increased uncertainty concerning the future (Steffen et al., 2015; Intergovernmental Science-Policy Platform on Biodiversity and Ecosystem Services [IPBES], 2019; Intergovernmental Panel on Climate Change [IPCC], 2022). Consequently, future forest DSS should therefore be able to deal with risks and uncertainties to a greater extent than current systems (Pasalodos-Tato et al., 2013; De Pellegrin Llorente et al., 2023). It also relates to the core of DSS systems modeling forest development; given environmental changes, empirical growth functions have severe limitations. Simulations of forest development should be able to explicitly account for changes in climate and other environmental factors, calling for hybrid (Goude et al., 2022) or process-based growth functions. When developing growth functions, one should account for which kind of input data a forest DSS will be using, in the near and medium future. In particular, the variables used in the growth models should reflect what input data is easily available and be relevant for different kinds of forest management. This demands a group of well-informed, broad-minded and diverse model and system developers. Since all systems are only as good as their model components, and forest DSS are very dependent on reliable growth functions, much effort should be put on developing and continuously updating these functions as new data and knowledge become available.
Given the complex nature of truly sustainable forest management under rapidly changing environmental and social conditions, future forest DSS should include a variety of ecosystem services and make it easy for its users to include them in the analysis.
There are trade-offs between pooling resources and building one DSS, to be used in several countries with similar forest conditions and management approaches, and making the DSS relevant for local and regional users. The trade-off is, however, less pronounced when it comes to the development of growth functions, where more available input data, e.g., from several countries, may allow for more robust models.
Another trade-off exists between the complexity of the DSS (and thus its potential to handle a variety of problems and use cases), and its user-friendliness. Instead of developing one big, complex system, it might be advisable to develop smaller, simpler systems that are tailor-made for the need of certain user groups. Building large systems also takes time, thereby the final system in the worst case doesn’t answer the topical questions. With all that in mind, it seems advisable to build modular, flexible systems that are easy to adapt. These factors have, however, to be weighed against “economies of scale” and the possibilities to handle a broader spectrum of analyses within the same framework when building larger systems.
Finally, it must be remembered that outcomes of any DSS should be considered decision support in its true sense. The aim is not primarily to produce the “absolute truth,” but rather to better understand the problem and situation. By running various forms of analysis using systems like Heureka, one learns more about the possibilities and limitations of different options and about synergies and trade-offs between different objectives. It thus enables informed decisions that meet the objectives of forest management as far as possible.
Data availability statement
The original contributions presented in this study are included in the article/Supplementary material, further inquiries can be directed to the corresponding author.
Author contributions
TL (lead), LS, KÖ, JL, and JE: conceptualization. All authors has provided parts of the text and scrutinized the manuscript.
Acknowledgments
We especially acknowledge those who participated in the Heureka research programme 2002–2009 developing the Heureka DSS; researcher, system architects, software designers and programmers, communicators, project leaders, etc. We also acknowledge those besides the authors who are–or have been–involved in SLU Forest Sustainability Analysis, the body being responsible for further development and the maintenance of the system.
Conflict of interest
Concerning commersial enteties listed as affiliations: The Heureka decision support system is developed and owned by the Swedish University of Agricultural Sciences (SLU) and SLU is responsible for the management and distribution of the system. SLU employees as well as consultants are working in the Heureka IT system development team. Co-author PW at Treesys AB was employed at SLU during the development phase of the Heureka system until 2012. He was then engaged as a consultant for the management and further development of the Heureka system until 2021 when he left the Heureka team. Co-author LN at Nilsin AB has worked as a consultant in the Heureka team since 2011. The Heureka system is freely available and there are no user fees. Thereby, the mentioned co-authors have no economic interest emerging from the use and distribution of the system and there are no conflicts of interest concerning the two co-authors.
The remaining authors declare that the research was conducted in the absence of any commercial or financial relationships that could be construed as a potential conflict of interest.
Publisher’s note
All claims expressed in this article are solely those of the authors and do not necessarily represent those of their affiliated organizations, or those of the publisher, the editors and the reviewers. Any product that may be evaluated in this article, or claim that may be made by its manufacturer, is not guaranteed or endorsed by the publisher.
Supplementary material
The Supplementary Material for this article can be found online at: https://www.frontiersin.org/articles/10.3389/ffgc.2023.1163105/full#supplementary-material
Footnotes
- ^ http://www.forestdss.org
- ^ Nyström, K. (2018). Growth models for nonproductive forest land (Umeå, Swedish University of Agricultural Sciences). Unpublished.
- ^ Site index can also be calculated by the system if all needed site information is available (latitude, altitude, slope, soil texture, soil depth, field vegetation type, soil moisture, soil water regime, presence of peat).
- ^ The list of papers in the Supplementary material include first author, year, title, keywords, aim, what Heureka software being used, etc.
- ^ https://www.slu.se/sha
References
Ågren, G., and Bosatta, E. (1998). Theoretical ecosystem ecology: Understanding element cycles. Cambridge: Cambridge University Press.
Aldea, J., Bianchi, S., Nilsson, U., Hynynen, J., Lee, D., Holmström, E., et al. (2023). Evaluation of growth models for mixed forests used in Swedish and Finnish decision support systems. For. Ecol. Manag. 529:120721. doi: 10.1016/j.foreco.2022.120721
Anon (2009). The Heureka research programme. Final report for Phase 2, October 2005 - September 2009. Umeå: Swedish University of Agricultural Sciences, 119.
Ashraf, M. I., Bourque, C. P.-A., MacLean, D. A., Erdle, T., and Meng, F.-R. (2012). Using JABOWA-3 for forest growth and yield predictions under diverse forest conditions of Nova Scotia, Canada. For. Chron. 88, 708–721. doi: 10.5558/tfc2012-137
Asmoarp, V., Bergqvist, M., Flisberg, P., and Gustavsson, O. (2020). Tactical harvest planning – Integrated analysis using the VägRust and Heureka decision support tools. Uppsala: Skogforsk.
Berg, S., Valinger, E., Lind, T., Suominen, T., and Tuomasjukka, D. (2016). Comparison of co-existing forestry and reindeer husbandry value chains in northern Sweden. Silva Fenn. 50:1384. doi: 10.14214/sf.1384
Bergqvist, J., Eriksson, A., Eggers, J., Nilsson, C., Paulsson, J., Pettersson, J., et al. (2022). Skogliga konsekvensanalyser 2022. Syntesrapport [Forest Impact Assessments 2022]. Jönköping: Skogsstyrelsen, 70.
Bergstrand, K., Lindman, J., and Petré, E. (1986). Instruments for use in setting productivity targets for motor-manual cleaning. Uppsala: SkogForsk.
Bleckert, S., Degerman, E., and Henrikson, L. (2011). NPK+ och Blå målklassning - enkla verktyg för skoglig vattenplanering [NPK+ and blue targeting classification – simple tools for planning of forest waters]. Available online at: http://www.wwf.se/source.php/1408811/Blå%20målklasser%20NPK+.pdf (accessed January 16, 2023).
Borges, J. G., Nordström, E. M., Garcia-Gonzalo, J., Hujala, T., and Trasobares, A. (eds) (2014). Computer-based tools for supporting forest management. The experience and the expertise world-wide. Umeå: Swedish University of Agricultural Sciences, 503.
Bradter, U., Ozgul, A., Griesser, M., Layton-Matthews, K., Eggers, J., Singer, A., et al. (2021). Habitat suitability models based on opportunistic citizen science data: Evaluating forecasts from alternative methods versus an individual-based model. Diver. Distrib. 27, 2397–2411. doi: 10.1111/ddi.13409
Brunberg, T. (1995). Basic data for productivity norms for heavy-duty singlegrip harvesters in final felling. Uppsala: SkogForsk.
Brunberg, T. (1997). Basic data for productivity norms for single-grip harvesters in thinning. Uppsala: SkogForsk.
Cintas, O., Berndes, G., Cowie, A. L., Egnell, G., Holmström, H., Marland, G., et al. (2017). Carbon balances of bioenergy systems using biomass from forests managed with long rotations: Bridging the gap between stand and landscape assessments. Glob. Change Biol. Bioenergy 9, 1238–1251. doi: 10.1111/gcbb.12425
Claesson, S., Duvemo, K., Lundström, A., and Wikberg, P. (2015). Skogliga konsekvensanalyser 2015 - SKA 15 [Forest impact analyses 2015 – SKA 15]. Rapport 10, 2015. Jönköping: Skogsstyrelsen, 108.
Claesson, S., Sahlén, K., and Lundmark, T. (2001). Functions for biomass estimation of young Pinus sylvestris, Picea abies and Betula spp. from stands in northern Sweden with high stand densities. Scand. J. For. Res. 16, 138–146.
Dahlin, B., Ekö, P.-M., Holmgren, P., Lämås, T., and Thuresson, T. (1997). Heureka – a model for forest resource management. A research strategy prepared at the Faculty of Forestry. Report 17. Uppsala: Swedish University of Agricultural sciences, 115.
De Pellegrin Llorente, I., Eyvindson, K., Mazziotta, A., Lämås, T., Eggers, J., and Öhman, K. (2023). Perceptions of uncertainty in forest planning: Contrasting forest professionals’ perspectives with the latest research. Can. J. For. Res. 1–16. doi: 10.1139/cjfr-2022-0193
DotSpatial (2023). DotSpatial. Available online at: https://github.com/DotSpatial (accessed January 24, 2023).
Drössler, L., Ekö, P. M., and Balster, R. (2015). Short-term development of a multilayered forest stand after target diameter harvest in southern Sweden. Can. J. For. Res. 45, 1198–1205. doi: 10.1139/cjfr-2014-0471
Eggers, J., and Öhman, K. (2020). Overview of the PlanWise application and examples of its use. Umeå: Swedish University of Agricultural Sciences, 28.
Eggers, J., Holmgren, S., Nordström, E.-M., Lämås, T., Lind, T., and Öhman, K. (2019). Balancing different forest values: Evaluation of forest management scenarios in a multi-criteria decision analysis framework. For. Policy Econ. 103, 55–69. doi: 10.1016/j.forpol.2017.07.002
Eggers, J., Lämås, T., Lind, T., and Öhman, K. (2015). Accounting for a diverse forest ownership structure in projections of forest sustainability indicators. Forests 6, 4001–4033. doi: 10.3390/f6114001
Eggers, J., Lindhagen, A., Lind, T., Lämås, T., and Öhman, K. (2018). Balancing landscape-level forest management between recreation and wood production. Urban For. Urban Greening 33, 1–11. doi: 10.1016/j.ufug.2018.04.016
Eggers, J., Lundström, J., Snäll, T., and Öhman, K. (2022). Balancing wood production and biodiversity in intensively managed boreal forest. Scand. J. For. Res. 37, 213–225. doi: 10.1080/02827581.2022.2066170
Eggers, J., Melin, Y., Lundström, J., Bergström, D., and Öhman, K. (2020a). Management strategies for wood fuel harvesting—Trade-offs with biodiversity and forest ecosystem services. Sustainability 12:4089. doi: 10.3390/su12104089
Eggers, J., Räty, M., Öhman, K., and Snäll, T. (2020b). How well do stakeholder-defined forest management scenarios balance economic and ecological forest values? Forests 11:86. doi: 10.3390/f11010086
Elfving, B. (1982). HUGIN’s ungskogstaxering 1976-1979. [HUGIN’s young forest survey 1976-1979] Projekt HUGIN, report 27. Umeå: Swedish University of Agricultural Sciences.
Elfving, B. (2003). Övre höjdens utveckling i granplanteringar. [Top height development in Norway spruce plantations] Dept of Silviculture, Arbetsrapporter 185. Umeå: Swedish University of Agricultural Sciences.
Elfving, B. (2011d). “The Hugin young stand survey: Database and functions”, in Growth modelling in the Heureka system. (Umeå: Swedish University of Agricultural Sciences).
Elfving, B. (2011b). “Basal area growth functions for single trees”, in “Growth modelling in the Heureka system, (Umeå: Swedish University of Agricultural Sciences).
Elfving, B. (2011a). “A stand basal area growth function for whole Sweden”, in Growth modelling in the Heureka system, (Umeå: Swedish University of Agricultural Sciences). doi: 10.3389/fpls.2021.787297
Elfving, B. (2011c). “Height development functions”, in Growth modelling in the Heureka system, (Umeå: Swedish University of Agricultural Sciences).
Elfving, B. (2014). Modellering av naturlig avgång i Heureka [Modelling of natural mortality in Heureka]. Umeå: Swedish University of Agricultural Sciences.
Elfving, B., and Kiviste, A. (1997). Construction of site index equations for Pinus sylvestris L. using permanent plot data in Sweden. For. Ecol. Manag. 98, 125–134. doi: 10.1016/S0378-1127(97)00077-7
Eliasson, L. (2022). Skogsbrukets kostnader och intäkter 2021 [Costs and revenues in Swedish forestry 2021] Webresultat No. 29–2022. Uppsala: Skogforsk.
Eriksson, H., Johansson, U., and Kiviste, A. (1997). A site-index model for pure and mixed stands of Betula pendula and Betula pubescens in Sweden. Scand. J. For. Res. 12, 149–156. doi: 10.1080/02827589709355396
Eriksson, L. O., and Bergh, J. (2022). A tool for long-term forest stand projections of Swedish forests. Forests 13:816. doi: 10.3390/f13060816
Eriksson, L. O., Forsell, N., Eggers, J., and Snäll, T. (2020). Downscaling of long-term global scenarios to regions with a forest sector model. Forests 11:500. doi: 10.3390/f1105
Eriksson, L. O., Wahlberg, O., and Nilsson, M. (2014). Questioning the contemporary forest planning paradigm: Making use of local knowledge. Scand. J. For. Res. 29, 56–70. doi: 10.1080/02827581.2013.834960
European Union [EU], (2018). Regulation (Eu) 2018/841. EUR-Lex - 32018R0841 - EN - EUR-Lex (europa.eu). Brussels: European Union.
Fahlvik, N., Berglund, M., Holmström, H., and Nilsson, U. (2017). Simulation of the long-term effects of different strategies for precommercial thinning in Pinus Sylvestris. Scand. J. For. Res. 33, 347–356. doi: 10.1080/02827581.2017.1383508
Fahlvik, N., Ekö, P. M., and Petersson, N. (2015). Effects of precommercial thinning strategies on stand structure and growth in a mixed even-aged stand of Scots pine, Norway spruce and birch in southern Sweden. Silva Fenn. 49:1302. doi: 10.14214/sf.1302
Fahlvik, N., Elfving, B., and Wikström, P. (2014). Evaluation of growth models used in the Swedish forest planning system Heureka. Silva Fenn. 48:1013. doi: 10.14214/sf.1013
Faustmann, M. (1849). Berechnung des Wertes welchen Waldboden sowie noch nicht haubare Holzbestände für die Waldwirtschaft besitzen. Allgemeine Forst Jagd Zeitung 15, 7–44.
Felton, A., Ranius, T., Roberge, J.-M., Öhman, K., Lämås, T., Hynynen, J., et al. (2017). Projecting biodiversity and wood production in future forest landscapes: 15 key modeling considerations. J. Environ. Manag. 197, 404–414. doi: 10.1016/j.jenvman.2017.04.001
Flisberg, P., Frisk, M., and Rönnqvist, M. (2014). Integrated harvest and logistic planning including road upgrading. Scand. J. For. Res. 29, 195–209. doi: 10.1080/02827581.2014.929733
Freeman, M. (2009). “Impact of climate on tree growth”, in The Heureka research programme. Final report for phase 2, October 2005 - September 2009, (Umeå: Swedish University of Agricultural Sciences).
Fridman, J., and Ståhl, G. (2001). A three-step approach for modelling tree mortality in Swedish forests. Scand. J. For. Res. 16, 455–466. doi: 10.1080/02827580152632856
Goude, M., Nilsson, U., Mason, E., and Vico, G. (2022). Using hybrid modelling to predict basal area and evaluate effects of climate change on growth of Norway spruce and Scots pine stands. Scand. J. For. Res. 37, 59–73. doi: 10.1080/02827581.2022.2039278
Goycoolea, M., Murray, A. T., Barahona, F., Epstein, R., and Weintraub, A. (2005). Harvest scheduling subject to maximum area restrictions: Exploring exact approaches. Operat. Res. 53, 490–500. doi: 10.1287/opre.1040.0169
Hahn, W. A., and Knoke, T. (2010). Sustainable development and sustainable forestry: Analogies, differences, and the role of flexibility. Eur. J. For. Res. 129, 787–801. doi: 10.1007/s10342-010-0385-0
Harmon, M., Krankina, O., and Sexton, J. (2000). Decomposition vectors: A new approach to estimating woody detritus decomposition dynamics. Can. J. For. Res. 30, 76–84. doi: 10.1139/x99-18
Holmström, E., Hjelm, K., Karlsson, M., and Nilsson, U. (2016). Scenario analysis of planting density and pre-commercial thinning: Will the mixed forest have a chance? Eur. J. For. Res. 135, 885–895. doi: 10.1007/s10342-016-0981-8
Horstkotte, T., Lind, T., and Moen, J. (2016). Quantifying the implications of different land users’ priorities in the management of boreal multiple-use forests. Environ. Manag. 57, 770–783. doi: 10.1007/s00267-015-0643-5
Hynynen, J., Salminen, H., Ahtikoski, A., Huuskonen, S., Ojansuu, R., Siipilehto, J., et al. (2015). Long-term impacts of forest management on biomass supply and forest resource development: A scenario analysis for Finland. Eur. J. For. Res. 134, 415–431. doi: 10.1007/s10342-014-0860-0
Intergovernmental Panel on Climate Change [IPCC] (2022). “Climate change 2022: Impacts, adaptation, and vulnerability,” in Contribution of working group II to the sixth assessment report of the Intergovernmental Panel on Climate Change, eds H.-O. Pörtner, D. C. Roberts, M. Tignor, E. S. Poloczanska, K. Mintenbeck, A. Alegría, et al. (Cambridge: Cambridge University Press), 3056. doi: 10.1017/9781009325844
Intergovernmental Science-Policy Platform on Biodiversity and Ecosystem Services [IPBES] (2019). Global assessment report on biodiversity and ecosystem services of the Intergovernmental Science-Policy Platform on Biodiversity and Ecosystem Services. Bonn: IPBES secretariat. doi: 10.5281/zenodo.3831673
Jonsson, A., Elfving, B., Hjelm, K., Lämås, T., and Nilsson, U. (2022). Will intensity of forest regeneration measures improve volume production and economy? Scand. J. For. Res. 37, 200–212. doi: 10.1080/02827581.2022.2085784
Jonsson, B., Jacobsson, J., and Kallur, H. (1993). The forest management planning package: Theory and application. Stud. For. Suec. 189:56.
Koch, T. (2005). Rapid mathematical programming. Ph.D. thesis. Berlin: Technische Universität Berlin.
Korosuo, A., Sandström, P., Öhman, K., and Eriksson, L. O. (2014). Impacts of different forest management scenarios on forestry and reindeer husbandry. Scand. J. For. Res. 29, 234–251. doi: 10.1080/02827581.2013.865782
Kruys, N., Jonsson, B. G., and Ståhl, G. (2002). A stage-based matrix model for decay-class dynamics of woody debris. Ecol. Appl. 123, 773–781.
Lagergren, F., Jönsson, A. M., Blennow, K., and Smith, B. (2012). Implementing storm damage in a dynamic vegetation model for regional applications in Sweden. Ecol. Modell. 247, 71–82.
Lämås, T., and Eriksson, L. O. (2003). Analysis and planning systems for multi-resource, sustainable forestry. The Heureka research programme at Swedish University of Agricultural Sciences. Can. J. For. Res. 33, 500–508. doi: 10.1139/X02-213
Lämås, T., Sandström, E., Jonzén, J., Olsson, H., and Gustafsson, L. (2015). Tree retention practices in boreal forests: What kind of future landscapes are we creating? Scand. J. For. Res. 30, 526–537. doi: 10.1890/1051-07612002012[0773:ASBMMF]2.0.CO;2
Liziniewicz, M., Nilsson, U., Agestam, E., Ekö, P., and Elfving, B. (2016). A site index model for lodgepole pine (Pinus contorta Dougl. var. latifolia) in northern Sweden. Scand. J. For. Res. 31, 583–591. doi: 10.1080/02827581.2016.1167238
Lodin, I., Eriksson, L. O., Forsell, N., and Korosuo, A. (2020). Combining climate change mitigation scenarios with current forest owner behavior: A scenario study from a region in southern Sweden. Forests 11:346. doi: 10.3390/f11030346
López-Andújar Fustel, T., Eggers, J., Lämås, T., and Öhman, K. (2021). Spatial optimization for reducing wind exposure of forest stands at the property level. For. Ecol. Manag. 502:119649. doi: 10.1016/j.foreco.2021.119649
Lougee-Heimer, R. (2003). The common optimization interface for operations research: Promoting open-source software in the operations research community. IBM J. Res. Dev. 47, 57–66. doi: 10.1147/rd.471.0057
Lula, M., Trubins, R., Ekö, P. M., Johansson, U., and Nilsson, U. (2021). Modelling effects of regeneration method on the growth and profitability of Scots pine stands. Scand. J. For. Res. 36, 263–274. doi: 10.1080/02827581.2021.1908591
Lundmark, T., Bergh, J., Nordin, A., Fahlvik, N., and Poudel, B. C. (2016). Comparison of carbon balances between continuous-cover and clear-cut forestry in Sweden. Ambio 45, 203–213. doi: 10.1007/s13280-015-0756-3
Lundström, A., and Söderberg, U. (1996). “Outline of the Hugin system for long-term forecasts of timber yields and possible cut,” in Large scale forestry scenario models: Experiences and requirements, Vol. 5, eds R. Päivinen, L. Roihuvuo, and M. Siitonen (Joensu: European Forest Institute), 63–77.
Lundström, J., Öhman, K., and Laudon, H. (2018). Comparing buffer zone alternatives in forest planning using a decision support system. Scand. J. For. Res. 33, 493–501. doi: 10.1080/02827581.2018.1441900
Lundström, J., Öhman, K., Perhans, K., Rönnqvist, M., and Gustafsson, L. (2011). Cost-effective age structure and geographical distribution of boreal forest reserves. J. Appl. Ecol. 48, 133–142. doi: 10.1111/j.1365-2664.2010.01897.x
Lundström, J., Öhman, K., Rönnqvist, M., and Gustafsson, L. (2014). How reserve selection is affected by preferences in Swedish boreal forests. For. Policy Econ. 41, 40–50. doi: 10.1016/j.forpol.2013.12.007
Lundström, J., Öhman, K., Rönnqvist, M., and Gustafsson, L. (2016). Considering future potential regarding structural diversity in selection of forest reserves. PLoS One 11:e0148960. doi: 10.1371/journal.pone.0148960
MacDicken, K. G., Sola, P., Hall, J. E., Sabogal, C., Tadoum, M., and de Wasseige, C. (2015). Global progress toward sustainable forest management. For. Ecol. Manag. 352, 47–56. doi: 10.1016/j.foreco.2015.02.005
Marklund, L. G. (1988). Biomass functions pine, spruce and birch in Sweden. Dept of Forest Survey, Report 45. Umeå: Swedish University of Agricultural Sciences.
McMurtrie, R. E., Rook, D. A., and Kelliher, F. M. (1990). Modelling the yield of Pinus radiata on a site limited by water and nitrogen. For. Ecol. Manag. 30, 381–413. doi: 10.1016/0378-1127(90)90150-A
Microsoft Corporation (2023a). Microsoft SQL server. Available online at: https://www.microsoft.com/en-us/sql-server/sql-server-2022/ (accessed January 24, 2023).
Microsoft Corporation (2023b). Microsoft visual studio. Available online at: https://visualstudio.microsoft.com/ (accessed January 24, 2023).
Millennium Ecosystem Assessment [MEA] (2005). Ecosystems and human well-being: Synthesis. Washington, DC: Island Press.
Ministry for the Environment (2019). Revised national forestry accounting plan for Sweden. Stockolm: Ministry for the Environment.
Mladenoff, D. J. (2004). LANDIS and forest landscape models. Ecol. Model. 180, 7–19. doi: 10.1016/j.ecolmodel.2004.03.016
Möller, J., and Moberg, L. (2007). Stambank VMF Qbera VMR 1-07 [The stem database VMF Qbera VMR 1-07]. Arbetsrapport No. 645. Uppsala: Skogforsk, 23.
Mowrer, H. T. (2000). Uncertainty in natural resource decision support systems: Sources, interpretation, and importance. Comput. Electr. Agric. 27, 139–154. doi: 10.1016/S0168-1699(00)00113-7
Näsberg, M. (1985). Mathematical programming models for optimal log bucking. Linköping studies in science and technology. Ph.D. thesis. Linköping: Linköping University.
Näslund, B. (1986). Simulering av skador och avgång i ungskog och deras betydelse för beståndsutvecklingen [Simulation of damage and mortality in young stands and associated stand development effects]. Ph.D. thesis. Umeå: Swedish University of Agricultural Sciences.
Nilsson, H., Nordström, E., and Öhman, K. (2016). Decision support for participatory forest planning using AHP and TOPSIS. Forests 7:100. doi: 10.3390/f7050100
Nilsson, U., Berglund, M., Bergquist, J., Holmström, H., and Wallgren, M. (2015). Simulated effects of browsing on the production and economic values of Scots pine (Pinus sylvestris) stands. Scand. J. For. Res. 32, 279–285. doi: 10.1080/02827581.2015.1099728
Nobre, S., Eriksson, L.-O., and Trubins, R. (2016). The use of decision support systems in forest management: Analysis of FORSYS country reports. Forests 7:72. doi: 10.3390/f7030072
Nordkvist, M., Eggers, J., López-Andújar Fustel, T., and Klapwijk, M. J. (2023). Development and implementation of a spruce bark beetle susceptibility index: A framework to compare bark beetle susceptibility on stand level. Trees For. People 11:100364.
Nordström, E., Forsell, N., Lundström, A., Korosuo, A., Bergh, J., Havlík, P., et al. (2016). Impacts of global climate change mitigation scenarios on forests and harvesting in Sweden. Can. J. For. Res. 46, 1427–1438. doi: 10.1139/cjfr-2016-0122
Nordström, E.-M., Holmström, H., and Öhman, K. (2013). Evaluating continuous cover forestry based on the forest owner’s objectives by combining scenario analysis and multiple criteria decision analysis. Silva Fenn. 47:1046. doi: 10.14214/sf.1046
Nuutinen, T., Anola-Pukkila, A., Hirvelä, H., Kärkkäinen, L., and Mäkelä, H. (2011). Information and communication technology connecting mathematical modelling with multipurpose forest management. J. For. Plan. 16, 91–98. doi: 10.20659/jfp.16.Special_Issue_91
Öhman, K., Seibert, J., and Laudon, H. (2009). An approach for including consideration of stream water dissolved organic carbon in long term forest planning. Ambio 38, 387–393. doi: 10.1579/0044-7447-38.7.387
Olson, D. L. (1996). “Smart,” In: Decision aids for selection problems. Springer series in operations research, ed P. Glynn (New York, NY: Springer), doi: 10.1007/978-1-4612-3982-6_4
Packalen, T., Marques, A. F., Rasinmäki, J., Mounir, F., Rosset, C., Rodriguez, L. C. E., et al. (2013). Review. A brief overview of forest management decision support systems (FMDSS) listed in the FORSYS wiki. For. Syst. 22, 263–269.
Pasalodos-Tato, M., Mäkinen, A., Garcia, J., Borges, J., Lämås, T., and Eriksson, L. O. (2013). Assessing uncertainty and risk in forest planning and decision support systems: Review of classical methods and introduction of new approaches. For. Syst. 22, 282–303. doi: 10.5424/fs/2013222-03063
Petersson, H. (1999). Biomassafunktioner för trädfraktioner av tall, gran och björk i Sverige.[Biomass functions for tree fractions of pine, spruce and birch in Sweden.] Arbetsrapport 59, Dept of forest resource management and geomatics. Umeå: Swedish University of Agricultural Sciences.
Petersson, H., and Ståhl, G. (2006). Functions for below-ground biomass of Pinus sylvestris, Picea abies, Betula pendula and Betula pubescens in Sweden. Scand. J. For. Res. 21, 84–93. doi: 10.1080/14004080500486864
Petersson, H., Ellison, D., Mensah, A. A., Berndes, G., Egnell, G., Lundblad, M., et al. (2022). On the role of forests and the forest sector for climate change mitigation in Sweden. Glob. Change Biol. Bioenergy 14, 793–813. doi: 10.1111/gcbb.12943
Rasinmäki, J., Mäkinen, A., and Kalliovirta, J. (2009). SIMO: An adaptable simulation framework for multiscale forest resource data. Comput. Electr. Agric. 66, 76–84. doi: 10.1016/j.compag.2008.12.007
Reynolds, K. M., Twery, M., Lexer, M. J., Vacik, H., Ray, D., Shao, G., et al. (2008). “Decision support systems in forest management,” in Handbook on decision support systems, eds F. Burstein and C. Holsapple (Berlin: Springer), 499–533.
Roberge, J.-M., Lämås, T., Lundmark, T., Ranius, T., Felton, A., and Nordin, A. (2015). Relative contributions of tree retention and set-asides to the long-term availability of key forest biodiversity structures at the landscape scale. J. Environ. Manag. 154, 284–292. doi: 10.1016/j.jenvman.2015.02.040
Roberge, J.-M., Öhman, K., Lämås, T., Felton, A., Ranius, T., Lundmark, T., et al. (2018). Modified forest rotation lengths: Long-term effects on landscape-scale habitat availability for specialized species. J. Environ. Manag. 210, 1–9. doi: 10.1016/j.jenvman.2017.12.022
Saaty, T. L. (1990). Multicriteria decision making: The analytic hierarchy process; planning, priority setting, resource allocation. New York, NY: RWS Publications.
Sandström, F., Petersson, H., Kruys, N., and Ståhl, G. (2007). Biomass conversion factors (density and carbon concentration) by decay classes for dead wood of Pinus sylvestris, Picea abies and Betula spp. in boreal forests of Sweden. For. Ecol. Manag. 243, 19–27. doi: 10.1016/j.foreco.2007.01.081
Sängstuvall, L., Bergström, D., Lämås, T., and Nordfjell, T. (2012). Simulation of harvester productivity in selective and boom-corridor thinning of young forests. Scand. J. For. Res. 27, 56–73. doi: 10.1080/02827581.2011.628335
Sängstuvall, L., Lämås, T., and Nordfjell, T. (2014). Application of a primarily deductive framework describing time consumption for hauling of logs to road-side. Ann. Operat. Res. 219, 477–489. doi: 10.1007/s10479-012-1172-8
Segura, M., Ray, D., and Maroto, C. (2014). Decision support systems for forest management: A comparative analysis and assessment. Comput. Electr. Agric. 101, 55–67. doi: 10.1016/j.compag.2013.12.005
Siipilehto, J., Allen, M., Nilsson, U., Brunner, A., Huuskonen, S., Haikarainen, S., et al. (2020). Stand-level mortality models for Nordic boreal forests. Silva Fenn. 54, 1–21.
Skogsstyrelsen (2016). Skogliga skattningar från laserdata [Estimations of forest data from airborne laser scanning]. Jönköping: Skogsstyrelsen.
Skogsvårdslag (1979). SFS 1979:429. Skogsvårdslag. [The Swedish Forestry Act] Stockholm: Sveriges Riksdag.
Snäll, T., Johansson, V., Jönsson, M., Ortiz, C., Hammar, T., Caruso, A., et al. (2017). Transient trade-off between climate benefit and biodiversity loss of harvesting stumps for bioenergy. Glob. Change Biol. Bioenergy 9, 1751–1763. doi: 10.1111/gcbb.12467
Söderberg, U. (1986). Functions for forecasting of timber yields. Increment and form height for individual trees of native species in Sweden. Section of forest mensuration and management, Report 14. Umeå: Swedish University of Agricultural Sciences.
Sonesson, J., Ring, E., Högbom, L., Lämås, T., Widenfalk, O., Mohtashami, S., et al. (2021). Costs and benefits of seven alternatives for riparian forest buffer management. Scand. J. For. Res. 36, 135–143. doi: 10.1080/02827581.2020.1858955
St John, R., Öhman, K., Tóth, S. F., Sandström, P., Korosuo, A., and Eriksson, L. O. (2016). Combining spatiotemporal corridor design for reindeer migration with harvest scheduling in northern Sweden. Scand. J. For. Res. 31, 655–663. doi: 10.1080/02827581.2016.1195441
Steffen, W., Richardson, K., Rockström, J., Cornell, S. E., Fetzer, I., Bennett, E. M., et al. (2015). Planetary boundaries: Guiding human development on a changing planet. Science 347:1259855. doi: 10.1126/science.1259855
Subramanian, N., Bergh, J., Johansson, U., Nilsson, U., and Sallnäs, O. (2015). Adaptation of forest management regimes in southern Sweden to increased risks associated with climate change. Forests 7:8. doi: 10.3390/f7010008
Swanson, F. J., and Franklin, J. F. (1992). New forestry principles from ecosystem analyses of Pacific Northwest forests. Ecol. Appl. 2, 262–274. doi: 10.2307/1941860
Swedish University of Agricultural Sciences [SLU] (2022a). Heureka Wiki. Available online at: https://www.heurekaslu.se/wiki/Heureka_Wiki (accessed February 2, 2023).
Swedish University of Agricultural Sciences [SLU] (2022b). Heureka Help. Available online at: https://www.heurekaslu.se/help/en/index.htm?introduktion.htm (accessed February 2, 2023).
Thor, M., Ståhl, G., and Stenlid, J. (2005). Modelling root rot incidence in Sweden using tree, site and stand variables. Scand. J. For. Res. 20, 165–176. doi: 10.1080/02827580510008347
Tiwari, T., Lundström, J., Kuglerová, L., Laudon, H., Öhman, K., and Ågren, A. M. (2016). Cost of Riparian Buffer Zones: A comparison of hydrologically adapted site-specific riparian buffers with traditional fixed widths. Water Resourc. Res. 52, 1056–1069. doi: 10.1002/2015WR018014
Ulvdal, P., Öhman, K., Eriksson, L. O., Staal Wästerlund, D., and Lämås, T. (2022). Handling uncertainties in forest information: The hierarchical forest planning process and its use of information at large forest companies. Forestry 96, 62–75. doi: 10.1093/forestry/cpac028
Vacik, H., Borges, J. G., Garcia-Gonzalo, J., and Eriksson, L.-O. (2015). Decision support for the provision of ecosystem services under climate change: An Editorial. Forests 6, 3212–3217. doi: 10.3390/f6093212
Verkerk, P. J., Costanza, R., Hetemäki, L., Kubiszewskib, I., Leskinena, P., Nabuurs, G. J., et al. (2020). Climate-smart forestry: The missing link. Forest Policy Econ. 115:10216. doi: 10.1016/j.forpol.2020.102164
Wikberg, P. E. (2004). Occurrence, morphology and growth of understory saplings in Swedish forest. Ph.D. thesis. Umeå: Swedish University of Agricultural Sciences.
Wikström, P. (2008). Jämförelse av ekonomi och produktion mellan trakthyggesbruk och blädning i skiktad granskog - analyser på beståndsnivå baserade på simulering. [Comparison of economy and production between evenaged and uneven-aged spruce forest – stand level simulation based analysis.]. Jönköping: Skogsstyrelsen Rapport, 24.
Wikström, P., Edenius, L., Elfving, B., Eriksson, L. O., Lämås, T., Sonesson, J., et al. (2011). The Heureka forestry decision support system: An overview. Math. Comput. For. Nat. Res. Sci. 3, 87–94.
Wilhelmsson, P., Lämås, T., Wallerman, J., Eggers, J., and Öhman, K. (2022). Improving dynamic treatment unit forest planning with cellular automata heuristics. Eur. J. For. Res. 141, 887–900. doi: 10.1007/s10342-022-01479-z
Keywords: multi-objective forest planning, forest management planning, ecosystem services, simulation, optimization, multi criteria decision analysis, trade-offs, computer system
Citation: Lämås T, Sängstuvall L, Öhman K, Lundström J, Årevall J, Holmström H, Nilsson L, Nordström E-M, Wikberg P-E, Wikström P and Eggers J (2023) The multi-faceted Swedish Heureka forest decision support system: context, functionality, design, and 10 years experiences of its use. Front. For. Glob. Change 6:1163105. doi: 10.3389/ffgc.2023.1163105
Received: 10 February 2023; Accepted: 02 May 2023;
Published: 18 May 2023.
Edited by:
Keith Morgan Reynolds, United States Department of Agriculture (USDA), United StatesReviewed by:
Matija Klopčič, University of Ljubljana, SloveniaJordi Garcia-Gonzalo, Forest Technology Center of Catalonia (CTFC), Spain
Copyright © 2023 Lämås, Sängstuvall, Öhman, Lundström, Årevall, Holmström, Nilsson, Nordström, Wikberg, Wikström and Eggers. This is an open-access article distributed under the terms of the Creative Commons Attribution License (CC BY). The use, distribution or reproduction in other forums is permitted, provided the original author(s) and the copyright owner(s) are credited and that the original publication in this journal is cited, in accordance with accepted academic practice. No use, distribution or reproduction is permitted which does not comply with these terms.
*Correspondence: Tomas Lämås, dG9tYXMubGFtYXNAc2x1LnNl