 Jinghua Chen
 Shaoqiang Wang
 Hao Shi
 Bin Chen
 Junbang Wang
 Chen Zheng
 Kai Zhu
- 1Key Laboratory of Ecosystem Network Observation and Modeling, Institute of Geographic Sciences and Natural Resources Research, Chinese Academy of Sciences, Beijing, China
- 2College of Resources and Environment, University of Chinese Academy of Sciences, Beijing, China
- 3Key Laboratory of Regional Ecological Process and Environment Evolution, School of Geography and Information Engineering, China University of Geosciences, Wuhan, China
- 4State Key Laboratory of Urban and Regional Ecology, Research Center for Eco-Environmental Sciences, Chinese Academy of Sciences, Beijing, China
Forest resilience is crucial to the mitigation of climate change, due to the enormous potential of forests to reduce atmospheric carbon dioxide concentrations and the possible conversion of forests from net carbon sinks into carbon sources following external disturbances. Subtropical forests are suffering the highest rates of forest change, but how they are evolving in response to climate change is little known. In this study, we estimated the spatial pattern and temporal trend of the resilience of subtropical evergreen forests in China by applying the lag-one autocorrelation (AC1) method to satellite kernel normalized difference vegetation index (kNDVI) data over the past two decades and identified the influential environmental factors that affect the ecosystem resilience by developing random forest (RF) regression models. The computed long-term AC1 based on kNDVI for the 2001–2020 period depicts considerable spatial variability in the resilience of the subtropical evergreen forests in China, with lower resilience at lower latitudes. The RF regression analysis suggests that the spatial variability in the forest resilience can be re-established by forest and climatic variables, and is largely affected by climate, with the three most influential variables being solar radiation (SR, %incMSE = 20.7 ± 1.8%), vapor pressure deficit (VPD, %incMSE = 13.8 ± 0.2%) and minimum temperature (Tmin, %incMSE = 13.3 ± 1.2%). Higher forest resilience is more likely to be located in areas with less radiation stress, adequate water availability, and less warming. Trend analysis shows a declining trend for the resilience of subtropical evergreen forests in China since the 2000s but an increasing forest resilience in the last decade, which is mainly dominated by temperature changes, including average and minimum temperatures. Considering the expected warming-dominated period in times of rapid climatic change, we suggest potential critical responses for subtropical forest productivity to the disturbances should be of greater concern in the future.
1. Introduction
Forests cover nearly 30% of the global land surface, or approximately 41 million km2. Forest ecosystems play an essential role in global carbon cycle, offsetting one-third of the anthropogenic carbon emissions (Pan et al., 2011; Friedlingstein et al., 2022). They are regarded as a core component of mitigating future climate change. However, forest ecosystems are severely threatened by more frequent and severe disturbances due to climate change. The persistence and functionality of forests are highly dependent on their ability to withstand and recover from environmental disturbances, that is, their resilience (Ibáñez et al., 2019; Forzieri et al., 2022). Resilience is the ability of a system to absorb change and disturbance and recover to pre-disturbance structure and function (Holling, 1973; Bai et al., 2019; Yi and Jackson, 2021). Forest resilience may not withstand an increase in disturbances caused by climate change, resulting in permanent alterations of ecosystems or transitions to non-forest ecosystems when tipping points are reached (Seidl et al., 2017). There is a possibility of the transition of tropical rainforests to savanna due to the trigger of external disturbances (Verbesselt et al., 2016; Lovejoy and Nobre, 2018; Hubau et al., 2020). Moreover, the risk of transitions to alternative ecosystem states becomes a global feature, and extends to higher latitudes (Abis and Brovkin, 2017). Forests hold enormous potential for reducing atmospheric carbon dioxide concentrations (Lewis et al., 2019), but ecosystem transitions could convert net carbon sinks into sources (Hubau et al., 2020), so the resilience of forests is essential to the mitigation of climate change.
Resilience can be characterized by the rate of an ecosystem recovering to equilibrium from disturbances (Scheffer et al., 2009). Theoretically, the recovery rate of an ecosystem after external disturbances can be detected by its internal natural fluctuations. The state fluctuations of the ecosystem resulting from disturbances can reflect the declines in recovery rates through an increase in temporal autocorrelation, i.e., the ecosystem state becomes more correlated in subsequent time (Verbesselt et al., 2016). Thus, the lag-one autocorrelation (AC1), which measures the degree to which adjacent time spans of a given time series are correlated, has been proposed as a gauge of vegetation resilience in several studies (Dakos et al., 2012; Verbesselt et al., 2016; Liu et al., 2019). Higher AC1 represents lower resilience, and the increase in AC1 has been termed as an early-warning signal for critical transition. Empirically, recovery rate can be estimated by fitting the time series of vegetation structure or function to an exponential function, as it recovers toward its previous state after each abrupt negative transition (Smith et al., 2022). Studies on the empirical recovery rate (r) have demonstrated that the theoretical resilience AC1 is related to the empirical resilience r through an exponential relationship, that is, AC1 = erΔt, which corroborates the effectiveness of AC1 by the empirical recovery rate from external disturbances (Scheffer et al., 2009; Smith et al., 2022).
Recent studies reveal that global forests have experienced a significant decline in resilience since the early 2000s, but the trends were spatially heterogeneous (Forzieri et al., 2022; Smith et al., 2022). It’s shown that (1) tropical, temperate, and arid forests have experienced the significant decreases in resilience, presumably blamed on increased water scarcity and climate variability, and (2) boreal forests are differently characterized with an overall upward trend in resilience, perhaps benefiting from warming and CO2 fertilization (Forzieri et al., 2022). Moreover, previous research has explored the possible factors contributing to the regional variations in forest resilience. Boulton et al. (2022) stated that the resilience of the Amazon rainforest was deteriorating faster in areas with less rainfall and closer to human activity. Fang and Zhang (2019) illustrated that tree resilience to drought in the Tibetan Plateau was linked to moisture availability, diurnal temperature range, and growth consistency. Higher moisture has great effects on recovery as regional humidity increases in arid boreal forests (Ibáñez et al., 2019).
Numerous studies focus on the resilience of tropical rainforests due to their importance in providing ecosystem services and complexity in responding to climate change (Cole et al., 2014; Verbesselt et al., 2016). In contrast, subtropical forests are suffering the highest rates of disturbance globally due to the practice of intensive forestry (Hansen et al., 2013), whereas how they are evolving in response to climate change is little known. The knowledge gap regarding the lack of spatial patterns and its mechanism in promoting resilience in subtropical forests remains to be filled.
China has 208 million hectares of forest, of which the southern forests account for about 44.7% (Zhao et al., 2015). The vast hills and mountains of southern China have a warm and humid climate, providing superior natural conditions for forest growth. The subtropical forests in southern China are a crucial component of the carbon sink in the East Asian monsoon region (Yu et al., 2014). Unfortunately, with the intensification of global warming, the forests in southern China are increasingly endangered by numerous disturbances. Since the 21st century, the southern region of China has suffered several consecutive climatic extremes, including the 2008 winter storm, the 2010 spring drought, the 2013 heat waves (Zhang et al., 2012; Huang et al., 2013; Pei et al., 2013), and the recent 2022 heat waves. Experimental evidence of increased extreme weather is raising concerns about variability in the resilience of the evergreen forests in southern China; further assessment of the resilience of these forests is still required to fully comprehend the response of ecosystems in China to climate change.
Here, we estimate the resilience from a time series of satellite-based vegetation index data to investigate the spatial pattern of subtropical evergreen forest resilience over the past two decades in southern China. The objectives of this study are to (1) quantify the resilience and its trend in subtropical evergreen forests, and (2) reveal the key drivers of forest resilience. The kernel normalized difference vegetation index (kNDVI), which has recently been suggested as a reliable substitute for ecosystem productivity (Camps-Valls et al., 2021), is used here as an appropriate metric to represent ecosystem function. Specifically, we computed the AC1 as a resilience indicator from satellite-based kNDVI data for the 2001–2020 period at 0.05° spatial resolution, and developed random forest regression models to identify the interplay of environmental drivers that affect the ability of ecosystems to recover from disturbances.
2. Materials and methods
2.1. Study area
Southern China (97°31′–122°57′E, 18°10′–34°14′N) includes the enormous region bordered by the Qinling–Huaihe Line to the north and the Qinghai-Tibet Plateau to the west (Figure 1). The topography of the region varies greatly from east to west, with plateau and basins dominating in the west and plains and hills widespread in the east. The major climate type in the region is subtropical monsoon climate, which is warm and humid. The average annual temperature here is 17.3°C and the average annual precipitation is 1,480 mm during the years 2001–2020. Southern China has a large vegetation cover of around 2.3 million km2, 46.1% of which is evergreen forests, including evergreen needleleaf forest (ENF, 26.5%), evergreen broadleaf forest (EBF, 15.8%), and mixed forest (MF, 3.9%) (Wu et al., 2014). The study area is usually accompanied by sufficient rainfall and high temperatures, but seasonal and even extreme drought conditions can occur occasionally.
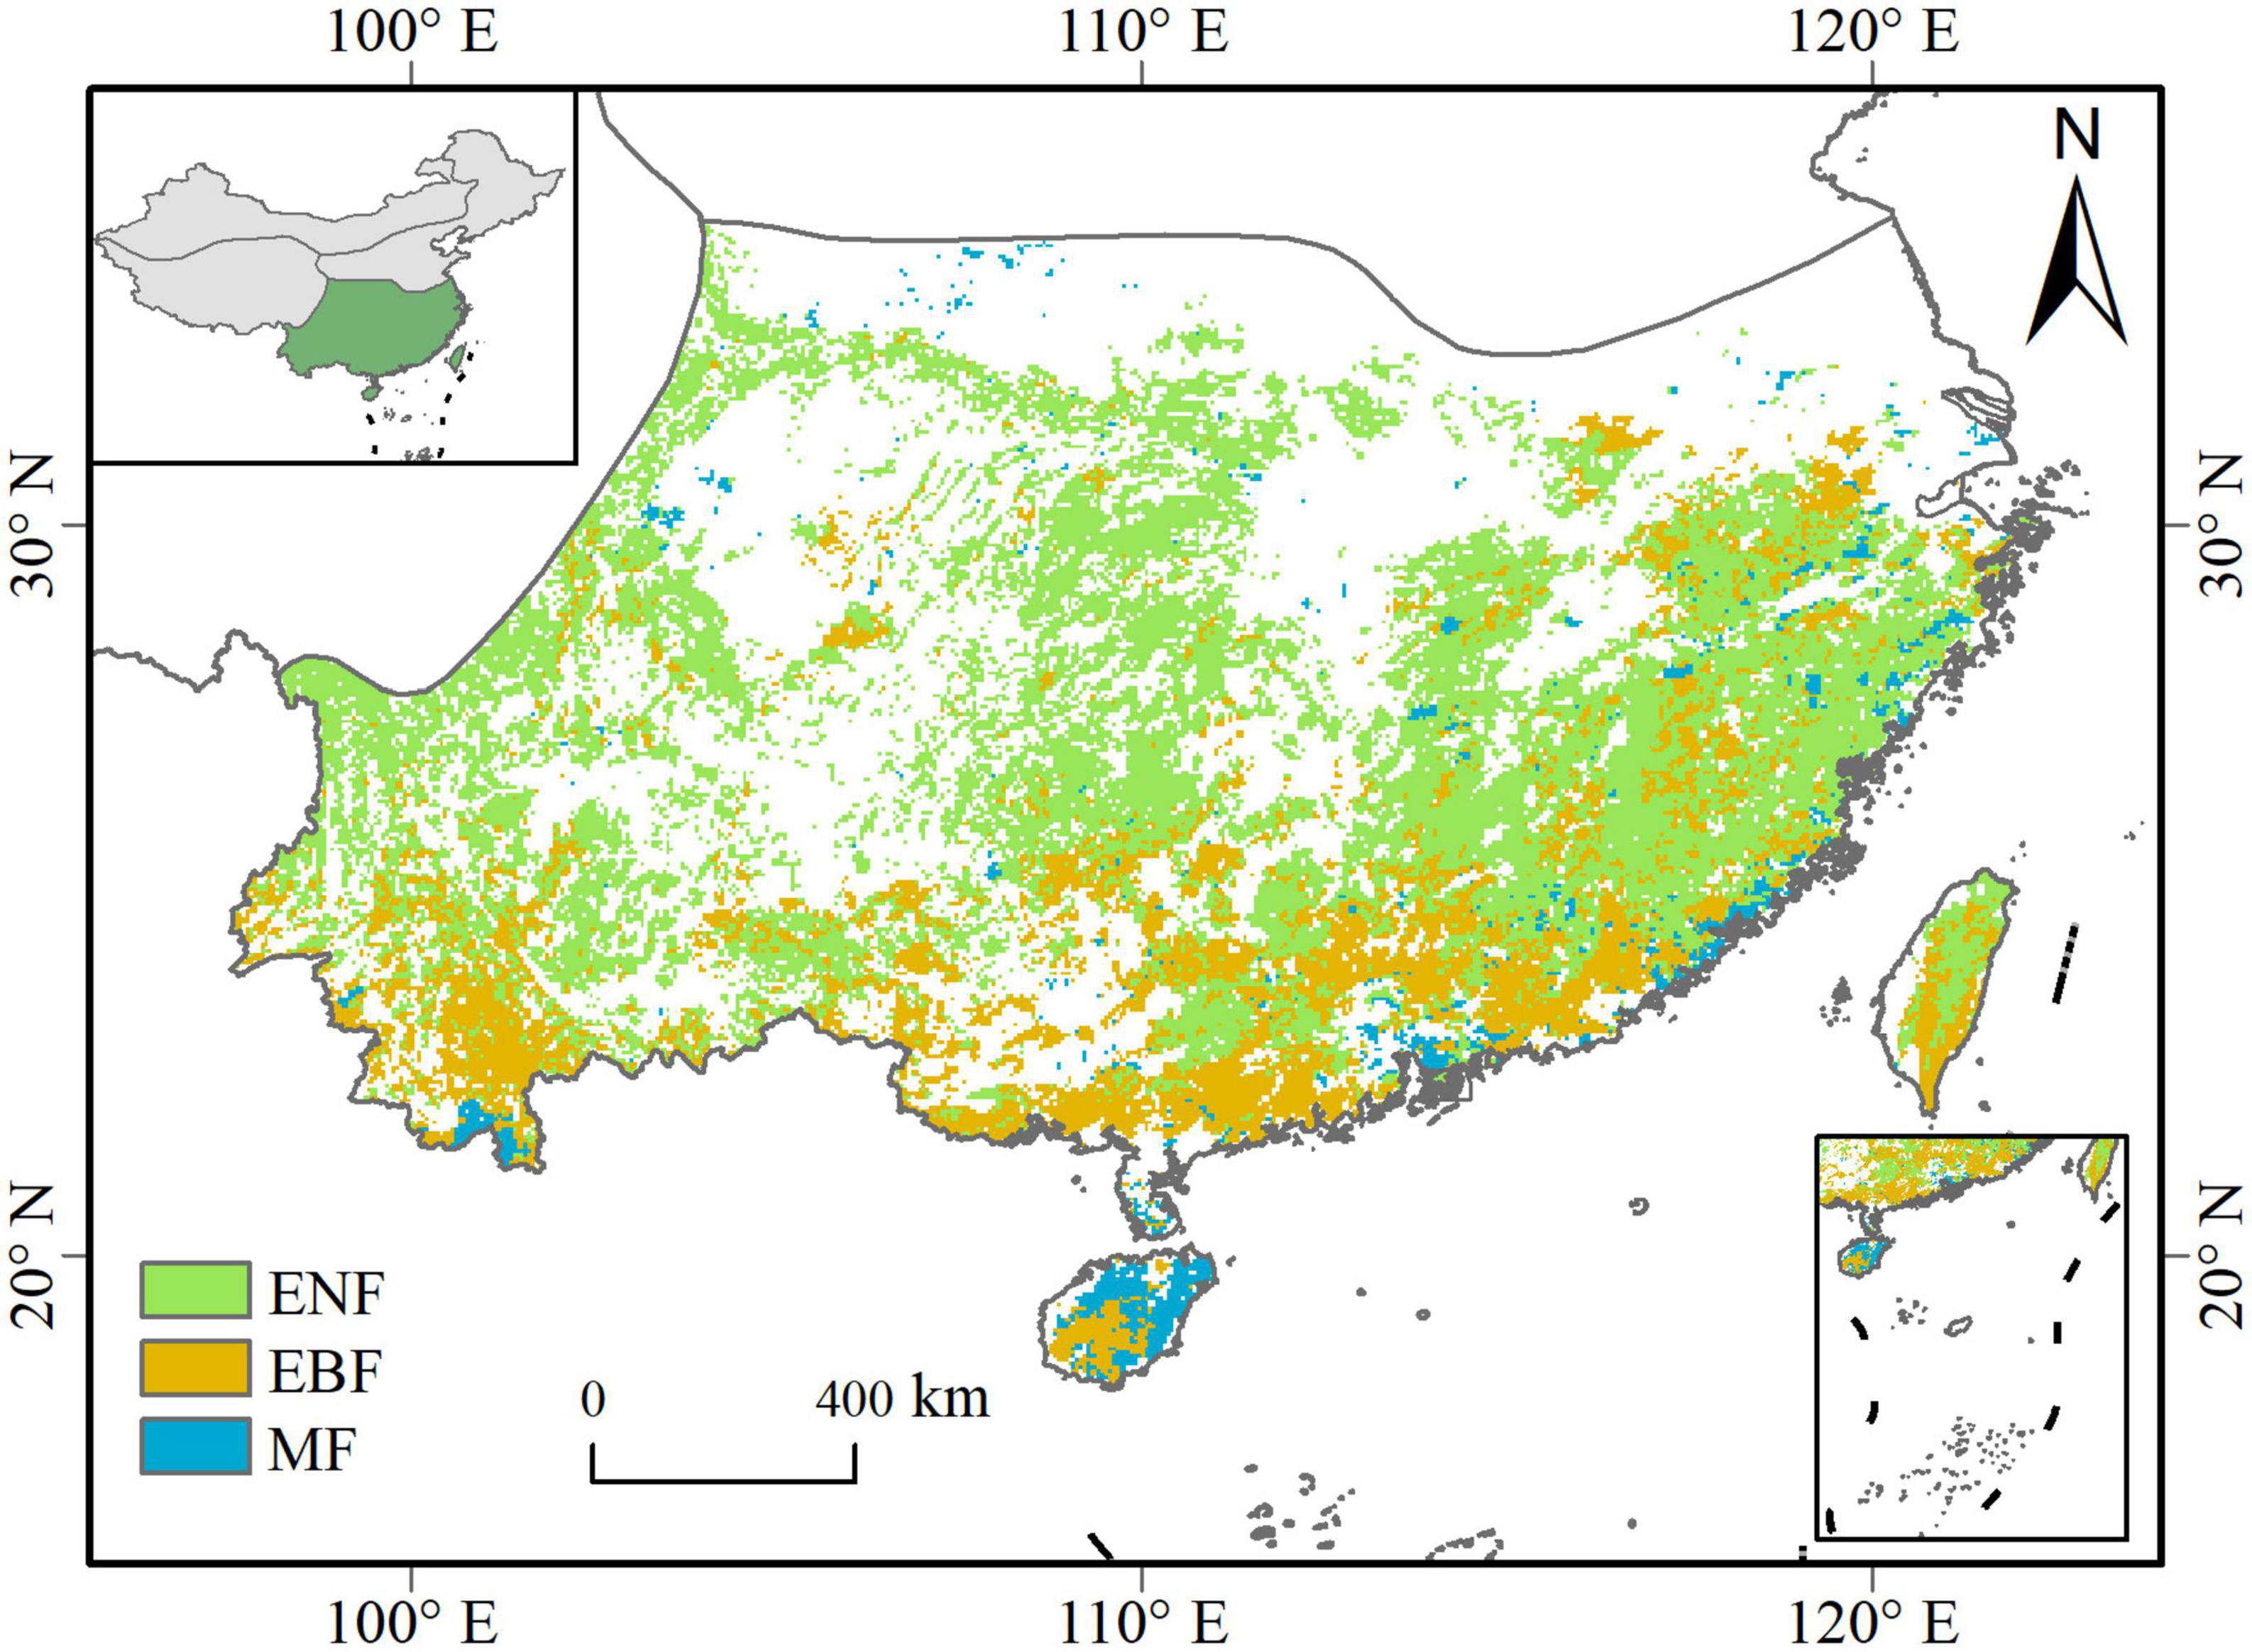
Figure 1. Distribution of evergreen forests in Southern China. ENF, evergreen needleleaf forests; EBF, evergreen broadleaf forests; MF, mixed forests.
2.2. Datasets
We collected satellite kNDVI, forest age, and meteorological data from various sources. All input data were resampled to 0.05° of spatial resolution and a monthly time scale, and masked by the evergreen forest cover extracted from the land cover map of China.
2.2.1. kNDVI data
The kNDVI is a newly developed nonlinear generalization of the well-known normalized difference vegetation index (NDVI) by using the kernel method, which exhibits consistently strong correlations with ecosystem productivity (Camps-Valls et al., 2021). kNDVI can be calculated using the following computational equation:
Here, kNDVI was used as a functional indicator to detect state changes in forest ecosystems (Hu et al., 2022). The monthly MODIS NDVI product (MOD13C2; Collection 6) at 0.05° spatial resolution from 2001 to 2020 was obtained from the online Data Pool at the USGS Land Processes Distributed Active Archive Centre (LPDAAC).1 The data quality assessment product (QA-data) of the MOD13C2 product provides pixel-by-pixel information on the cloud conditions and overall data usefulness. We retained cloud-free pixels with good and marginal overall quality.
2.2.2. Forest age
The forest stand age data used in this study was obtained from a map of China’s forest stand age with a spatial resolution of 1 km, which was estimated from the remotely sensed forest height in 2005 using the relationship between tree height and forest age from forest inventory data (Zhang C. et al., 2014). The map illustrates that the mean forest age across China was 43 years in 2005. Young and middle-aged forests occupy the majority of forests in current China. The map also demonstrates a great spatial heterogeneity in China’s forest age, with young forests in south and east and old forests in southwest, northwest, and northeast. The forest age across our study area is 36.9 ± 24.8 years. The forest age map was resampled to a 0.5° × 0.5° spatial resolution to match the satellite data.
2.2.3. Meteorological data
The gridded meteorological data, including air temperature, precipitation, solar radiation, and vapor pressure deficit during 2001–2020, were retrieved from the interpolation using the ANUSPLIN software (Hutchinson, 1995) based on 836 meteorological station data from the National Meteorological Information Centre of the China Meteorological Administration (Wang et al., 2017). The gridded meteorological data has 1 km of spatial resolution and an 8-day time step. The station observation data include daily average, maximum, and minimum air temperatures (Ta, Tmin, and Tmax in °C), daily total precipitation (Pre in mm), relative humidity (RH in %), and sunshine hour (SH in h). The daily total solar radiation (SR in W m–2) was acquired from the interpolated sunshine hour data through the use of the solar radiation model developed by Bonan (1989). Vapor pressure deficit (VPD, kPa) was quantified as a function of temperature and relative humidity (Murray, 1966). All meteorological data were interpolated to daily scales using the spline method, and then aggregated into monthly averages or totals (Pre), and spatially resampled to the 0.5° × 0.5° resolution.
2.2.4. Land cover
The land cover data were derived from ChinaCover2010,2 a land cover map of China in 2010. The ChinaCover2010 dataset was produced on the basis of Chinese domestic HJ 1A/1B satellite and in situ data, and classified by an object-oriented method (Wu et al., 2014). The spatial resolution of ChinaCover2010 is 30 m, and the classification accuracy reaches 85% (Zhang L. et al., 2014). The dataset classifies Chinese land surface into 38 types, including evergreen needleleaf forests (ENF), evergreen broadleaf forests (EBF), and mixed forests (MF). The evergreen forest cover was extracted from the land cover map, which was also resampled to 0.05° spatial resolution using the majority method.
2.3. Resilience indicator of forest ecosystems
We estimated the resilience of forest ecosystems using lag-one autocorrelation (AC1) (Dakos et al., 2015; Verbesselt et al., 2016). The AC1 was computed on the detrended and deseasoned kNDVI time series for each forest pixel. The kNDVI data were detrended and deseasoned through seasonal trend decomposition by loess (STL) (Cleveland et al., 1990; Smith et al., 2022). We used a period of 12 (1 year on monthly scale) and an adaptive loess filter to decompose the full-year signal. Following the rules of thumb originally proposed by Cleveland et al. (1990), we set 23 (1 month less than 2 years) and 13 (1 month more than 1 year) as the values for the trend smoother and the low-pass filter, respectively. Thus, the residual time-series term was detrended and deseasoned from the original kNDVI data, and used for the further AC1 calculation. The AC1 computation on the whole kNDVI residual time series (2001–2020) was referred to as long-term AC1. To detect the temporal dynamics of the forest resilience, we also computed AC1 on a monthly scale over 5-year rolling windows over the 2001–2020 period, which was referred to as AC1 time series.
To support the resilience revealed by the kNDVI-based AC1, we applied an empirical method proposed by Smith et al. (2022) to estimate the recovery rate and compared it with the theoretical AC1. Firstly, we applied a 9-month moving window over the residual time series of kNDVI data and calculated the mean difference between the preceding and rest halves of the moving window. We then used a Savitzky–Golay filter (Savitzky and Golay, 1964) to smooth the aforementioned time series for the purpose of eliminating high-frequency noise. Next, values above the 99th percentile were distinguished and the subsequent time spans were labeled as disturbance periods. For each detected disturbance period, we used a 4-month constraint to locate local minima of the residual time series as the starting point of recovery. Finally, we fitted an exponential function to the 5-year time series after the starting point to compute the exponent r, which is regarded as the empirical recovery rate. Subsequently, we performed a comparative analysis between the empirical r and the theoretical one computed via rAC1 = log(AC1).
2.4. Trends analysis of the forest resilience
Mann–Kendall (MK) trend test with Sen’s slope estimator was used in this study to analyze the temporal trend of evergreen forest resilience in China over the last two decades. The MK test is a non-parametric model on the basis of the rank system proposed by Mann (1945) and Kendall (1975). For the time series X1, X2,…, Xn, the MK statistic (S) can be computed as:
where n represents the number of observations, Xi and Xj are the successive information estimation on occasion i and j. sgn represents the sign function given by:
Thus, standardized test statistic (Z) can be computed with variance var(S) by utilizing the following equations:
The determined Z values follow the normal distribution and is utilized as a measure of trend significance. Given a significance level of α, the null hypothesis of no trend was rejected when |Z| ≥ Z1–α/2, indicating a significant trend of the series. Otherwise, the null hypothesis was accepted at the significance level of α. We here set the significant level α = 0.05 and thus Z1–α/2 = 1.96.
The magnitude of the trend in the data time series was determined using Sen’s estimator (Sen, 1968). The Sen’s estimator is simple to compute, robust to outliers, and requires limited priori information about measurement errors (Fernandes and Leblanc, 2005). The slope of data can be calculated as follows:
where β denotes the trend degree, which is used to determine the rise (positive β values) and fall (negative β values) of the time series trend.
To verify the rationality and robustness of the trend analysis, we also applied the univariate stationary first-order Gaussian autoregressive (AR) method, which could avoid the issue that the MK method may not fully account for the temporal autocorrelation (Ives et al., 2021). We fit the time series using the model:
where εi(t) is a univariate stationary first-order Gaussian autoregressive process with mean zero for each separate time series, and the vector of εi(t) (t = 1, 2, …, T) has a multivariate Gaussian distribution [details in Ives et al. (2021)]. This regression model with lag-1 autoregressive error terms for every time series is fitted by Restricted Maximum Likelihood (REML). The AR method was conducted using the remotePARTS package in RStudio.
2.5. Random forest regression analysis of forest resilience
In order to quantify the environmental factors modulating the forest resilience, we applied random forest (RF) regression analysis to explore the relationship between AC1 and explanatory variables. The RF analysis was applied not only for the spatial pattern of the entire long-term AC1, but also for the time series data in each grid cell. The environmental explanatory variables contain forest properties (forest age and annual averaged kNDVI) and climatic variables (temperature, precipitation, solar radiation, and VPD). The climatic variables were expressed as averages and extremes shown in Table 1. All climatic variables were computed annually and then averaged over time as background climate. Maximum and minimum temperatures were collected on a daily scale and integrated for the study period. Maximum precipitation was calculated from the monthly total precipitation, while maximum VPD was the maximum value for the period. These four factors were regarded as extreme climate. Thus, a set of 10 predictor variables representing the forest attribute, background climate, and extreme climate were considered here (Table 1). All environmental variables were calculated for the same period as the long-term AC1 and AC1 time series, respectively, for subsequent spatial and time series analysis.
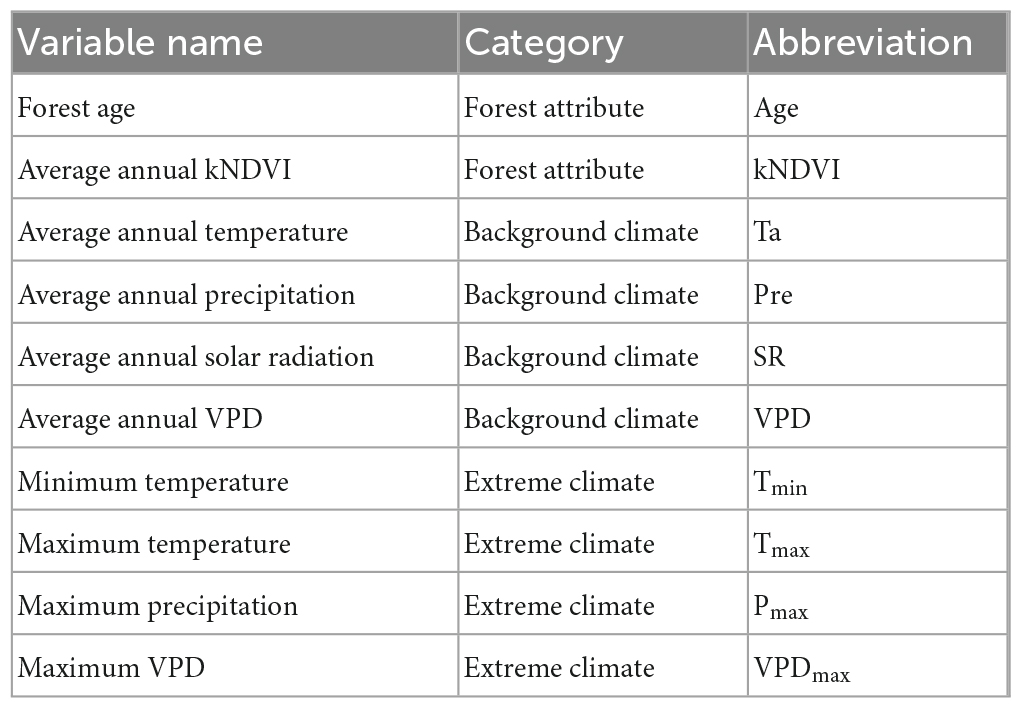
Table 1. Environmental explanatory variables used in the forest resilience model.
The existence of multicollinearity among environmental variables produces inconsistent model outputs and reduces the prediction accuracy of the models (Midi and Bagheri, 2010). Therefore, we used variance inflation factor (VIF) in this study to detect the multicollinearity among the ten environmental variables and select the least correlated variables before building the regression models. The VIF analysis was conducted, respectively, for the spatial pattern of the environmental variables and the time series of the variables in each grid cell. Several VIF thresholds, i.e., 10, 5, or 3.3, are recommended for selection of variables (Hair et al., 2009; Kock and Lynn, 2012). Given the magnitude of the sample sizes, we fixed the VIF threshold at 3.3 for the spatial grid analysis and at 10 for the time series analysis. We iteratively eliminated the variable with the largest VIF, until the VIFs of all remaining variables were less than the threshold values.
The RF regression models were then developed to identify the emergent relationships between AC1 and the selected forest and climate metrics. We divided the dataset randomly into two subsets to develop the RF model: one training subset with 75% of records used for model calibration, and one test subset with the remaining 25% of records used for model validation. The key parameters used in the RF model implemented here, including the number of regression trees in the forest, the maximum depth of the tree, the number of features considered at each split and so on, were identified using the method of RandomizedSearchCV algorithm (details in Supplementary Table 1) from Python Scikit-learn package (Pedregosa et al., 2011). The model performances were assessed on the basis of coefficient of determination (R2), root mean squared error (rMSE), and percentage bias (PBIAS).
Variable importance ranking was synchronously calculated in the RF regression model and used to quantify how individual environmental factors influence the forest resilience (i.e., AC1). The variable importance was quantified by the increase in mean square error of predictions (%IncMSE) caused by scrambling the values of a variable. Larger error before and after permutation indicates that the variable is more important in the forest and contributes more to predictive accuracy than the others (Breiman, 2001). And we explored the AC1 across gradients of influential vegetation and climate features using partial dependence plots, which show the dependence between the response variable and a set of explanatory variables. Partial dependency plots evaluate the impact of each individual driver by holding the impacts of all the other potential drivers constant (Geng et al., 2021). Furthermore, we also used partial correlation analysis to confirm the robustness of the analysis.
3. Results
3.1. Spatial variation of forest resilience in southern China
We explored the long-term lag-one autocorrelation (AC1) at pixel level from the kNDVI time series (2001–2020) for the subtropical evergreen forests in China. Results demonstrate that the evergreen forests exhibit considerable spatial variability in long-term AC1 (Figure 2A). The long-term AC1 increases with decreasing latitude (Figure 2B), indicating that the resilience of the subtropical evergreen forest may be reduced at lower latitudes. Low-resilience forests are mainly located in the Yunnan-Guizhou plateau, Hainan Island, and the coastal hilly regions. AC1 increases with mean annual temperature under a given precipitation while decreasing with total annual precipitation under a given temperature (Figure 2C). Low resilience (high values in AC1) is observed for temperatures above 18°C and precipitation levels below 1,600 mm. Moreover, higher temperatures (above 24°C) lead to low resilience despite adequate precipitation.
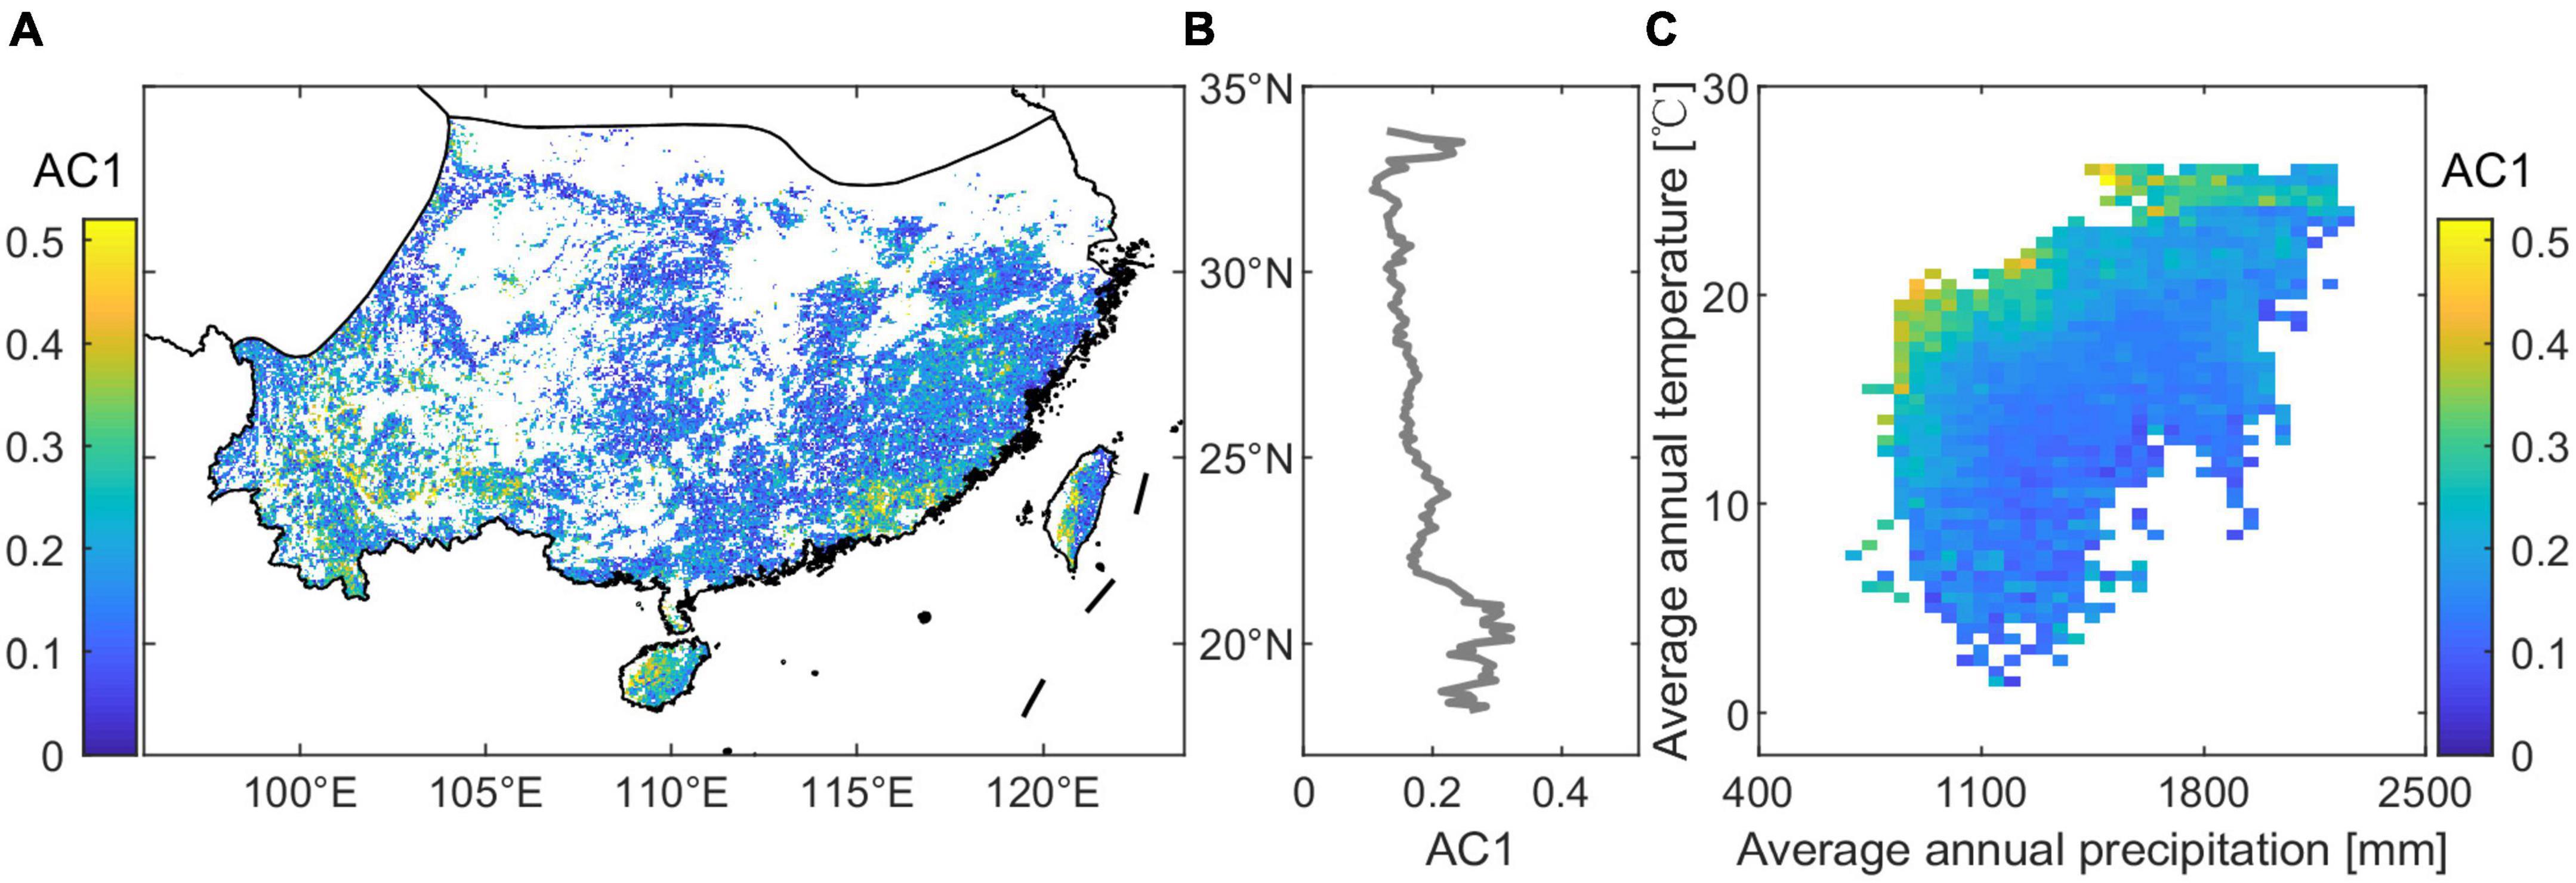
Figure 2. Spatial variation in the resilience of subtropical evergreen forests in China. (A) Spatial map of long-term lag-one autocorrelation (AC1) computed from kNDVI data for the whole 2001–2020 period. (B) Long-term AC1 with latitude. (C) Long-term AC1 binned as a function of precipitation and temperature.
We tested the indication of the kNDVI-based AC1 for the subtropical evergreen forests in China based on an empirical method of detecting disturbances and estimating recovery rates proposed by Smith et al. (2022). The comparison of theoretical and empirical estimates of the recovery rate reveals broad spatial consistency between the theoretical rAC1 and the empirical r for areas where the recovery rate can be estimated empirically (Figures 3A, C). The theoretical AC1 and the empirical recovery rate support the theoretically expected exponential relationships (Figure 3B, R2 = 0.91 for the exponential fit). Moreover, the correspondence between theoretical and empirical estimates remains good even if different R2 thresholds for the exponential fit to the recovering time series after external disturbances are considered (Figure 3D, R2 ≥ 0.84 for the exponential fit).
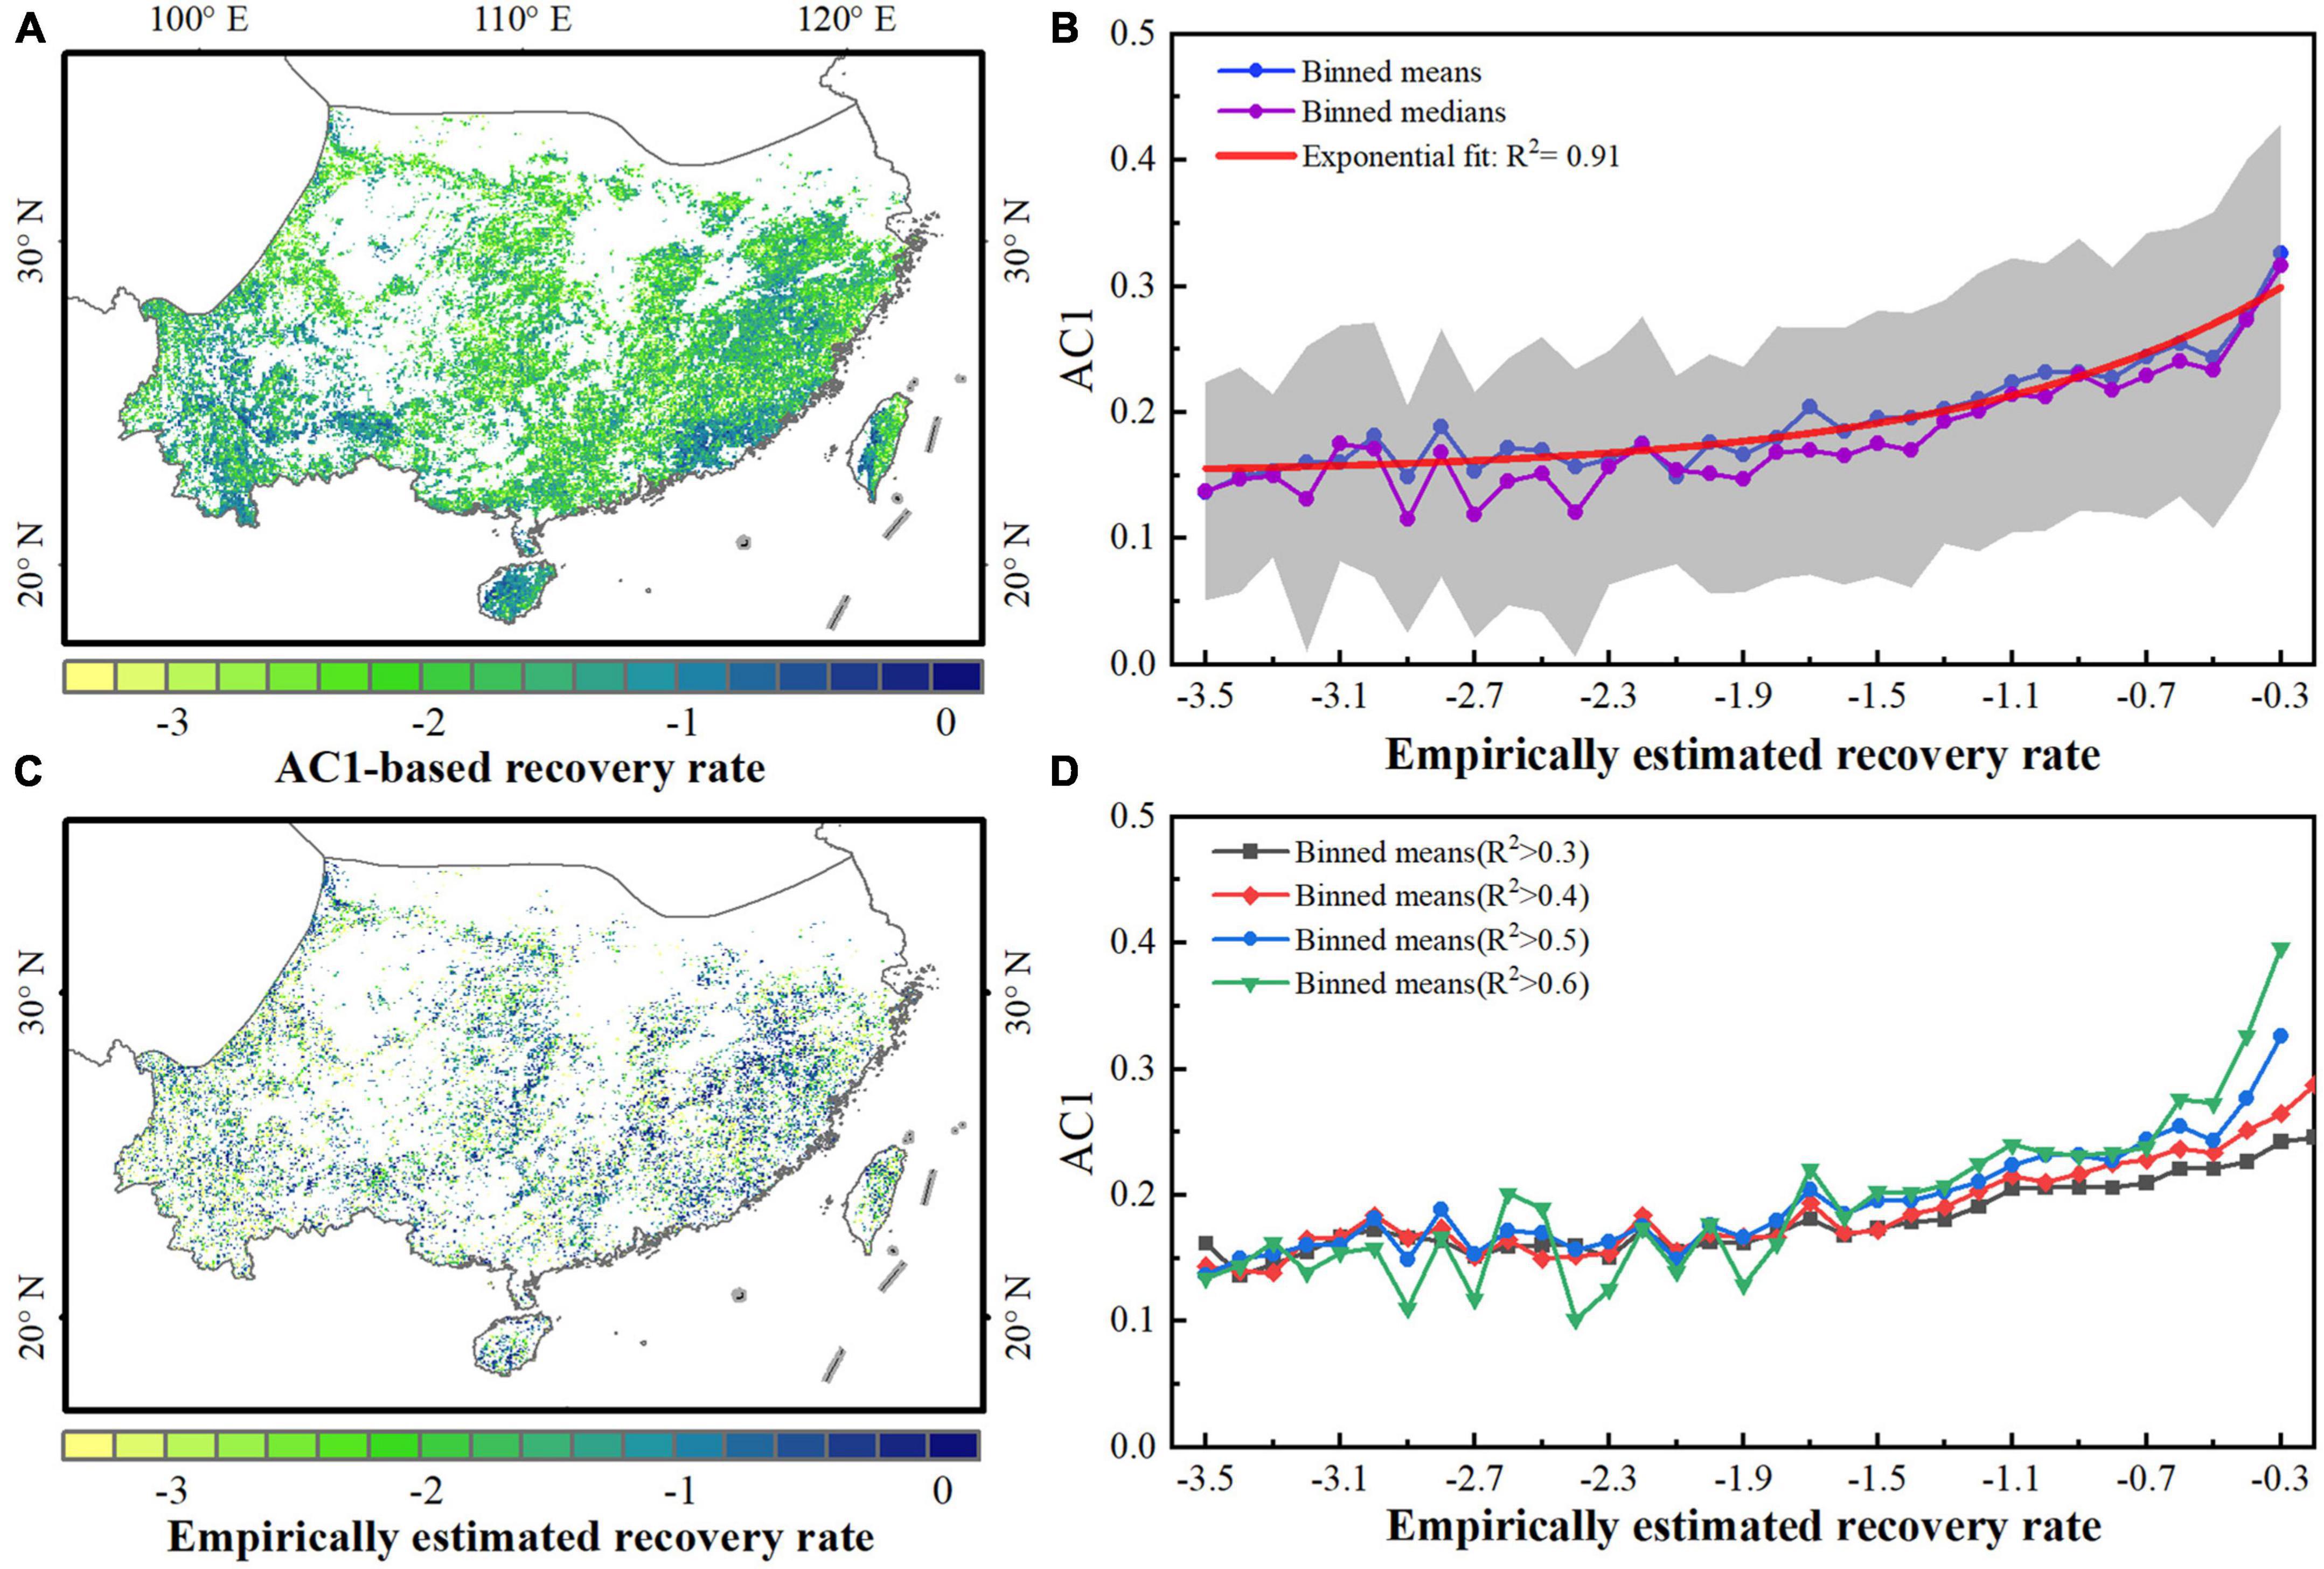
Figure 3. Comparison between theoretical resilience (AC1) metrics and empirical recovery rates based on satellite kNDVI data. (A) Theoretical estimate of the recovery rate computed from the AC1 at each grid. (B) Empirical estimate of the recovery rate (for well-determined exponential fits, R2 > 0.2). (C) Relationship between AC1 and empirical recovery rates from exponential fits with R2 > 0.5. (D) Binned means of AC1 as a function of the empirically estimated recovery rate under different R2 thresholds.
3.2. Driving forces of the spatial variability in forest resilience
A random forest (RF) regression model was developed to identify the relationships between long-term AC1 and the selected forest and climatic metrics. Age, kNDVI, SR, VPD, Tmin, Tmax, Pmax, and VPDmax were selected as predictor variables, while Ta and Pre were eliminated due to exceeding the VIF threshold (Supplementary Table 2). The variations in AC1 were well reproduced by the RF model with the predictor variables as input (Supplementary Figure 1). Results of RF analysis show that the spatial variability in long-term AC1 of the evergreen forests in southern China is largely explained by local environmental conditions (R2 = 0.70, rMSE = 0.0004, PBIAS = 0.034, Figure 4A). The RF regression analysis shows that the most influential predictor of the spatial variability in the evergreen forest resilience is solar radiation (SR), with %incMSE = 20.7 ± 1.8 %. Vapor pressure deficit (VPD, %incMSE = 13.8 ± 0.2 %) and minimum temperature (Tmin, %incMSE = 13.3 ± 1.2 %) are also important to the forest resilience. SR, VPD, and Tmin are the major driving forces behind the resilience of subtropical evergreen forests in China among the climatic and biotic factors, accounting for roughly half of the variability in the forest resilience (Figure 4B). The remaining variables are of secondary importance to the forest resilience. The findings of the partial correlation analysis similarly show that SR has the highest partial correlation with the long-term AC1, followed by Ta and Tmin (Supplementary Figure 2). Ta was excluded from the VIF variable selection due to its high correlation with VPD (Pearson r = 0.79, p < 0.001, Supplementary Figure 3).
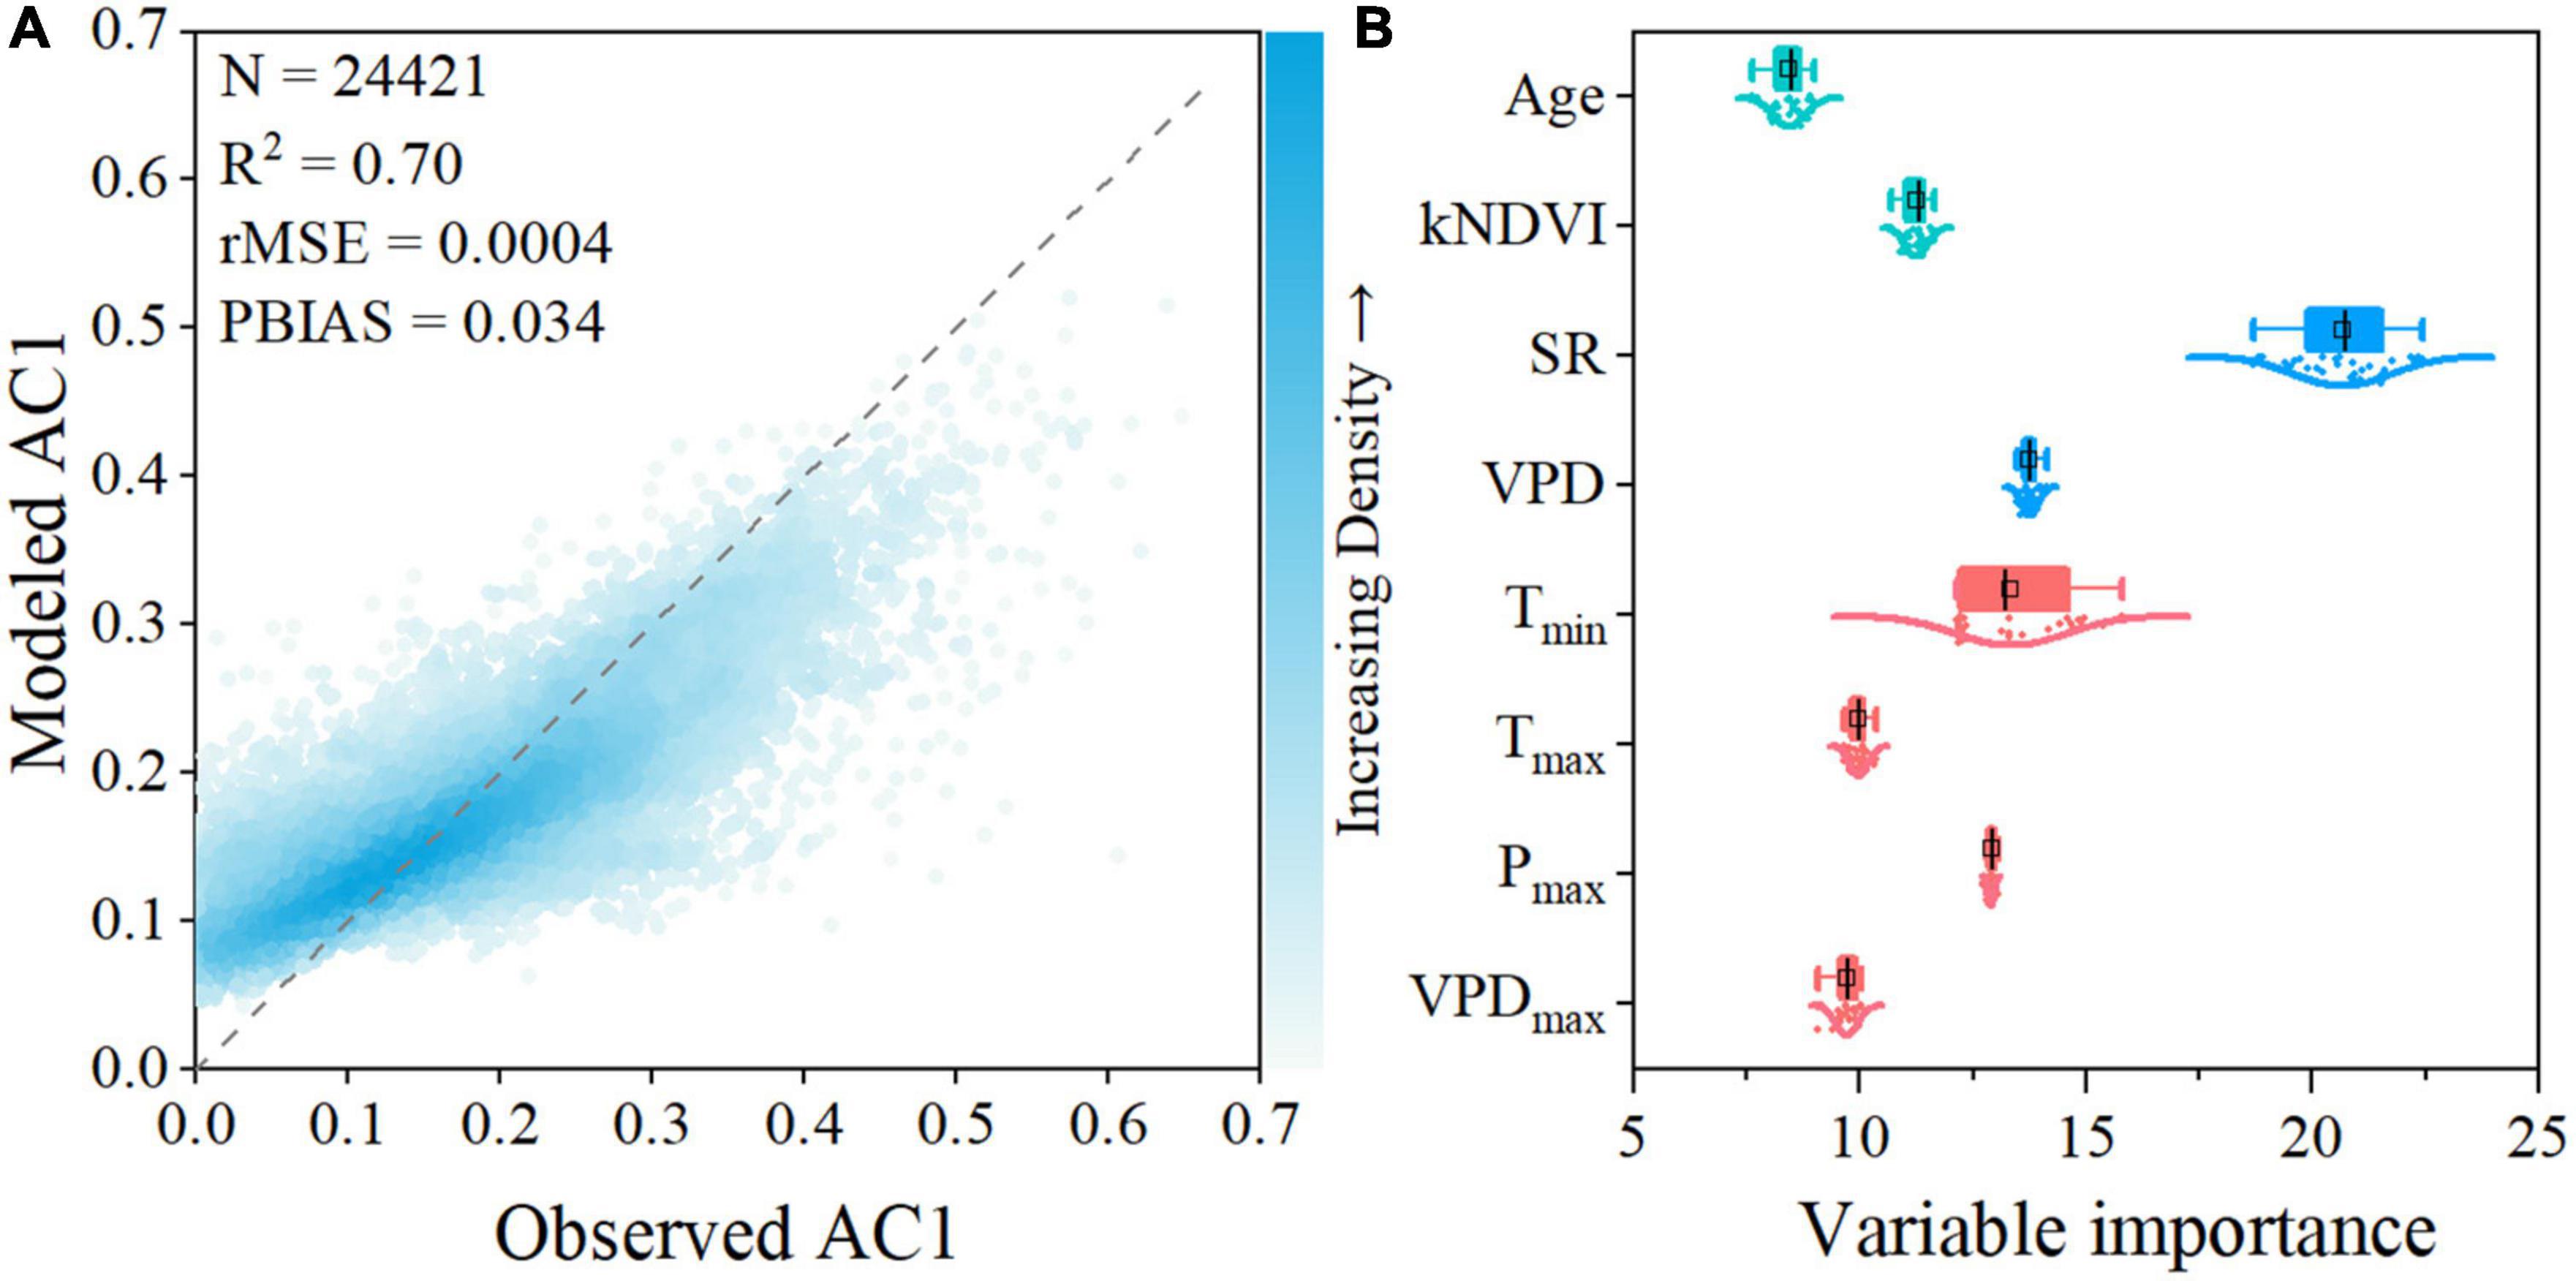
Figure 4. Model performance and variable importance of the selected variables for explaining the spatial long-term AC1 using a random forest regression model. (A) Comparison between measured AC1 and modeled AC1. (B) Variable importance of the predictor variables within the RF regression model. Variable importance is quantified by the increase in mean square error (%IncMSE).
The partial dependence plots (Figure 5) show that the long-term AC1 increased with SR, VPD, and Tmin, indicating that the forest resilience decreased with the increases in these variables. Low SR (<150 W m–2) leads to high resilience (low AC1) of evergreen forests, while the value of AC1 remains high (low resilience) when SR > 180 W m–2 (Figure 5A). AC1 increases (resilience decreases) as the VPD value rises, and the rate of increase is gradually accelerated (Figure 5B). The forest resilience remains constantly low with Tmin less than −15°C, then sharply increases until Tmin reaches −10°C, and finally stays high (Figure 5C). Overall, areas with less radiation stress, adequate water availability, and less warming are more likely to have higher forest resilience when taking the magnitude of the effects of these dominant drivers into account.
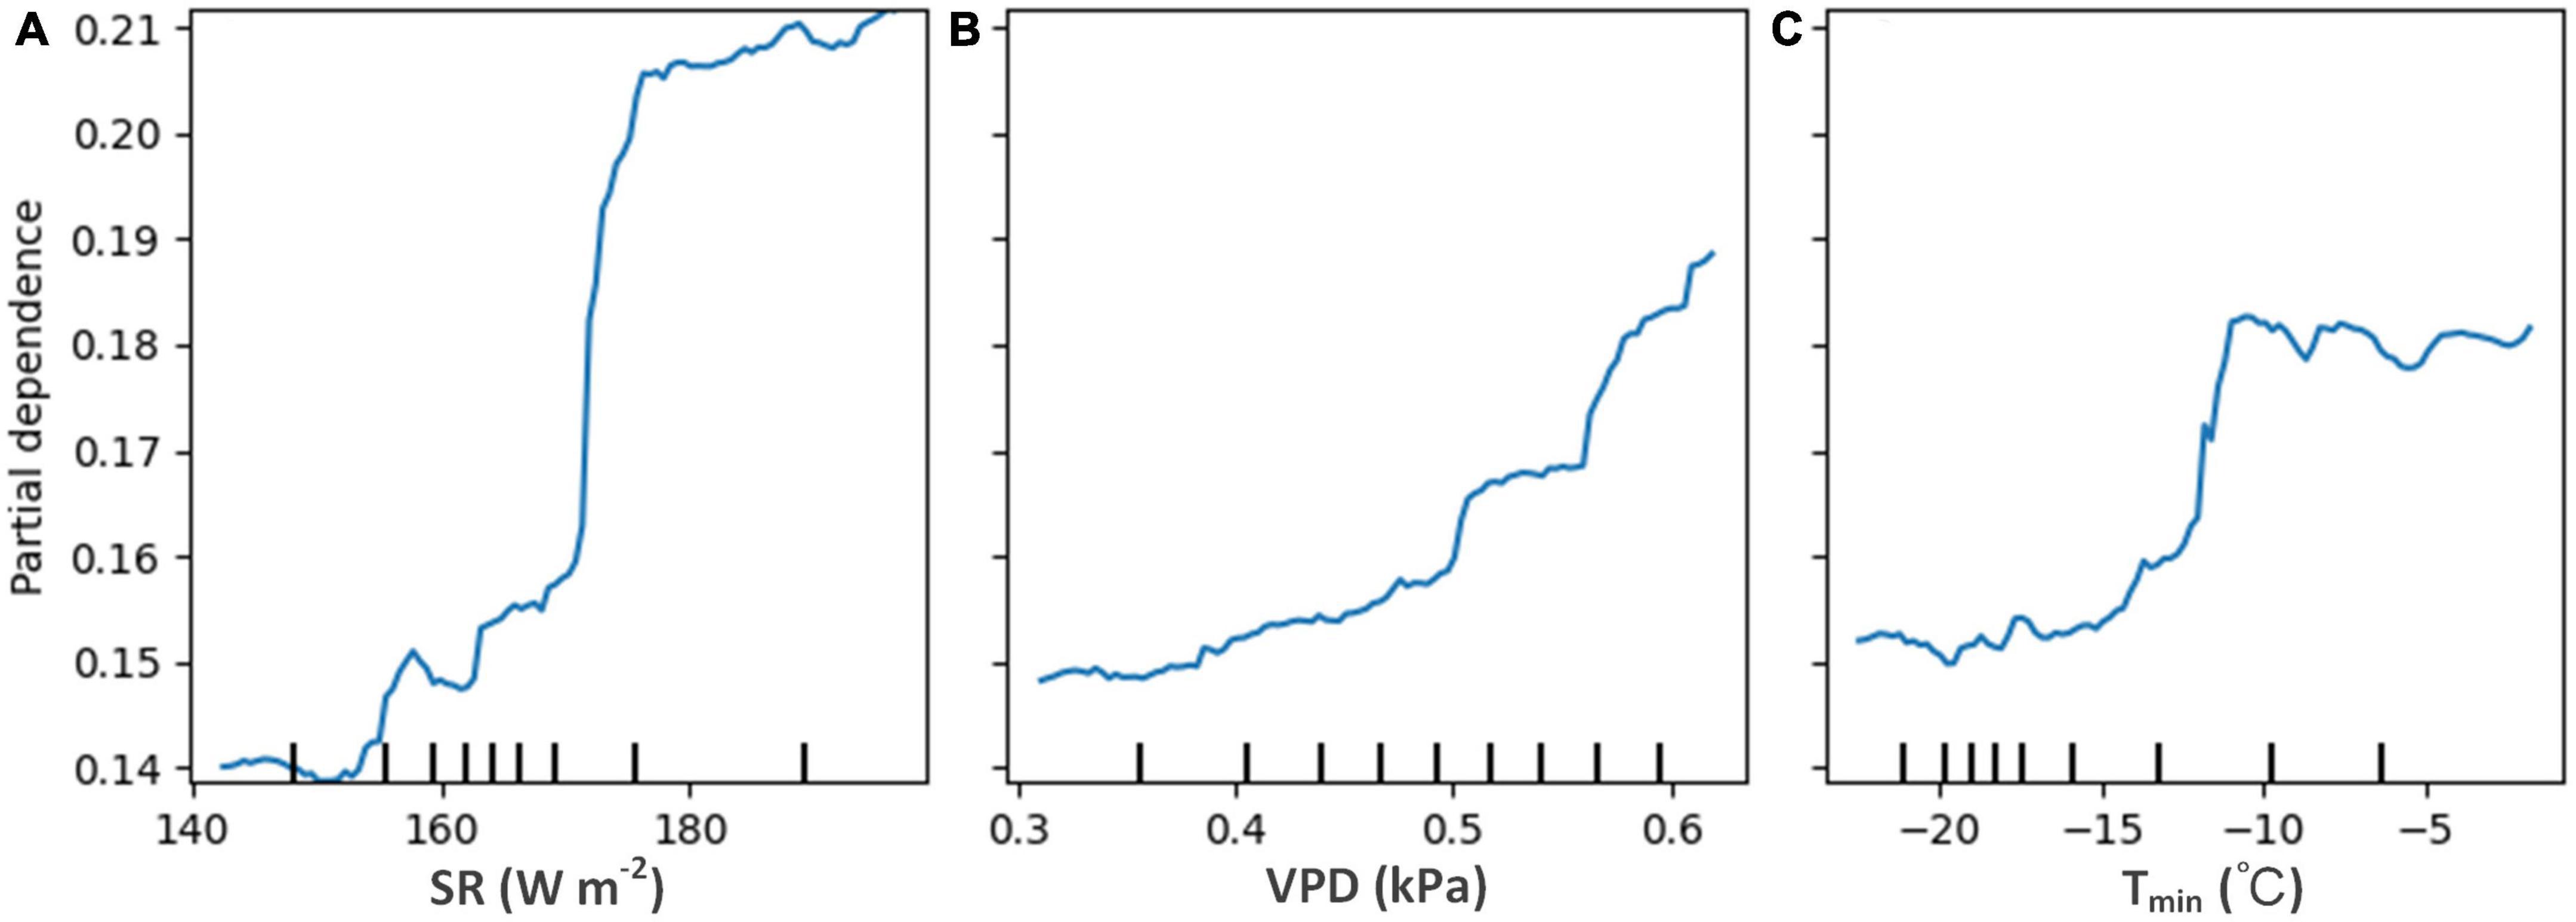
Figure 5. Partial dependence plots for the three most influential variables in the model for long-term AC1. (A) For solar radiation (SR), (B) for vapor pressure deficit (VPD), and (C) for minimum temperature (Tmin).
3.3. Temporal trends of forest resilience and their dominant factors
Figure 6 depicts the temporal trend of the forest resilience for the entire subtropical evergreen forests and in each grid cell using the MK trend test. For the entire study period, the AC1 significantly increased (β > 0, |Z| > Z1–α/2) when considering the subtropical evergreen forests as a whole, indicating a declining trend in its forest resilience (Figure 6A). Besides, the trend distribution of all forest grid cells also shows that the increasing trend of AC1 dominates (Figure 6A). The AR method shows the spatial consistency of the trend in the majority of grid cells with the results of the MK method (Supplementary Figure 4), revealing a decreasing resilience in subtropical evergreen forests in China since the 2000s through the upward trend of AC1. But the trends of AC1 differ across plant functional types (PFT) and time periods (Figures 6A, C–E; Table 2). Over the last two decades, there was a significant decreasing trend in forest resilience for ENF, but an insignificant increasing trend for EBF, and even a significant increasing trend for MF. As for different time periods, all three forest types showed a significant increase in resilience in 2005–2010 and 2015–2020, but a decrease in resilience in 2010–2014 (significant in all but MF). Thus, although the resilience of subtropical evergreen forests in China has shown an overall decreasing trend in the past 20 years, the resilience has been gradually rising in recent years.
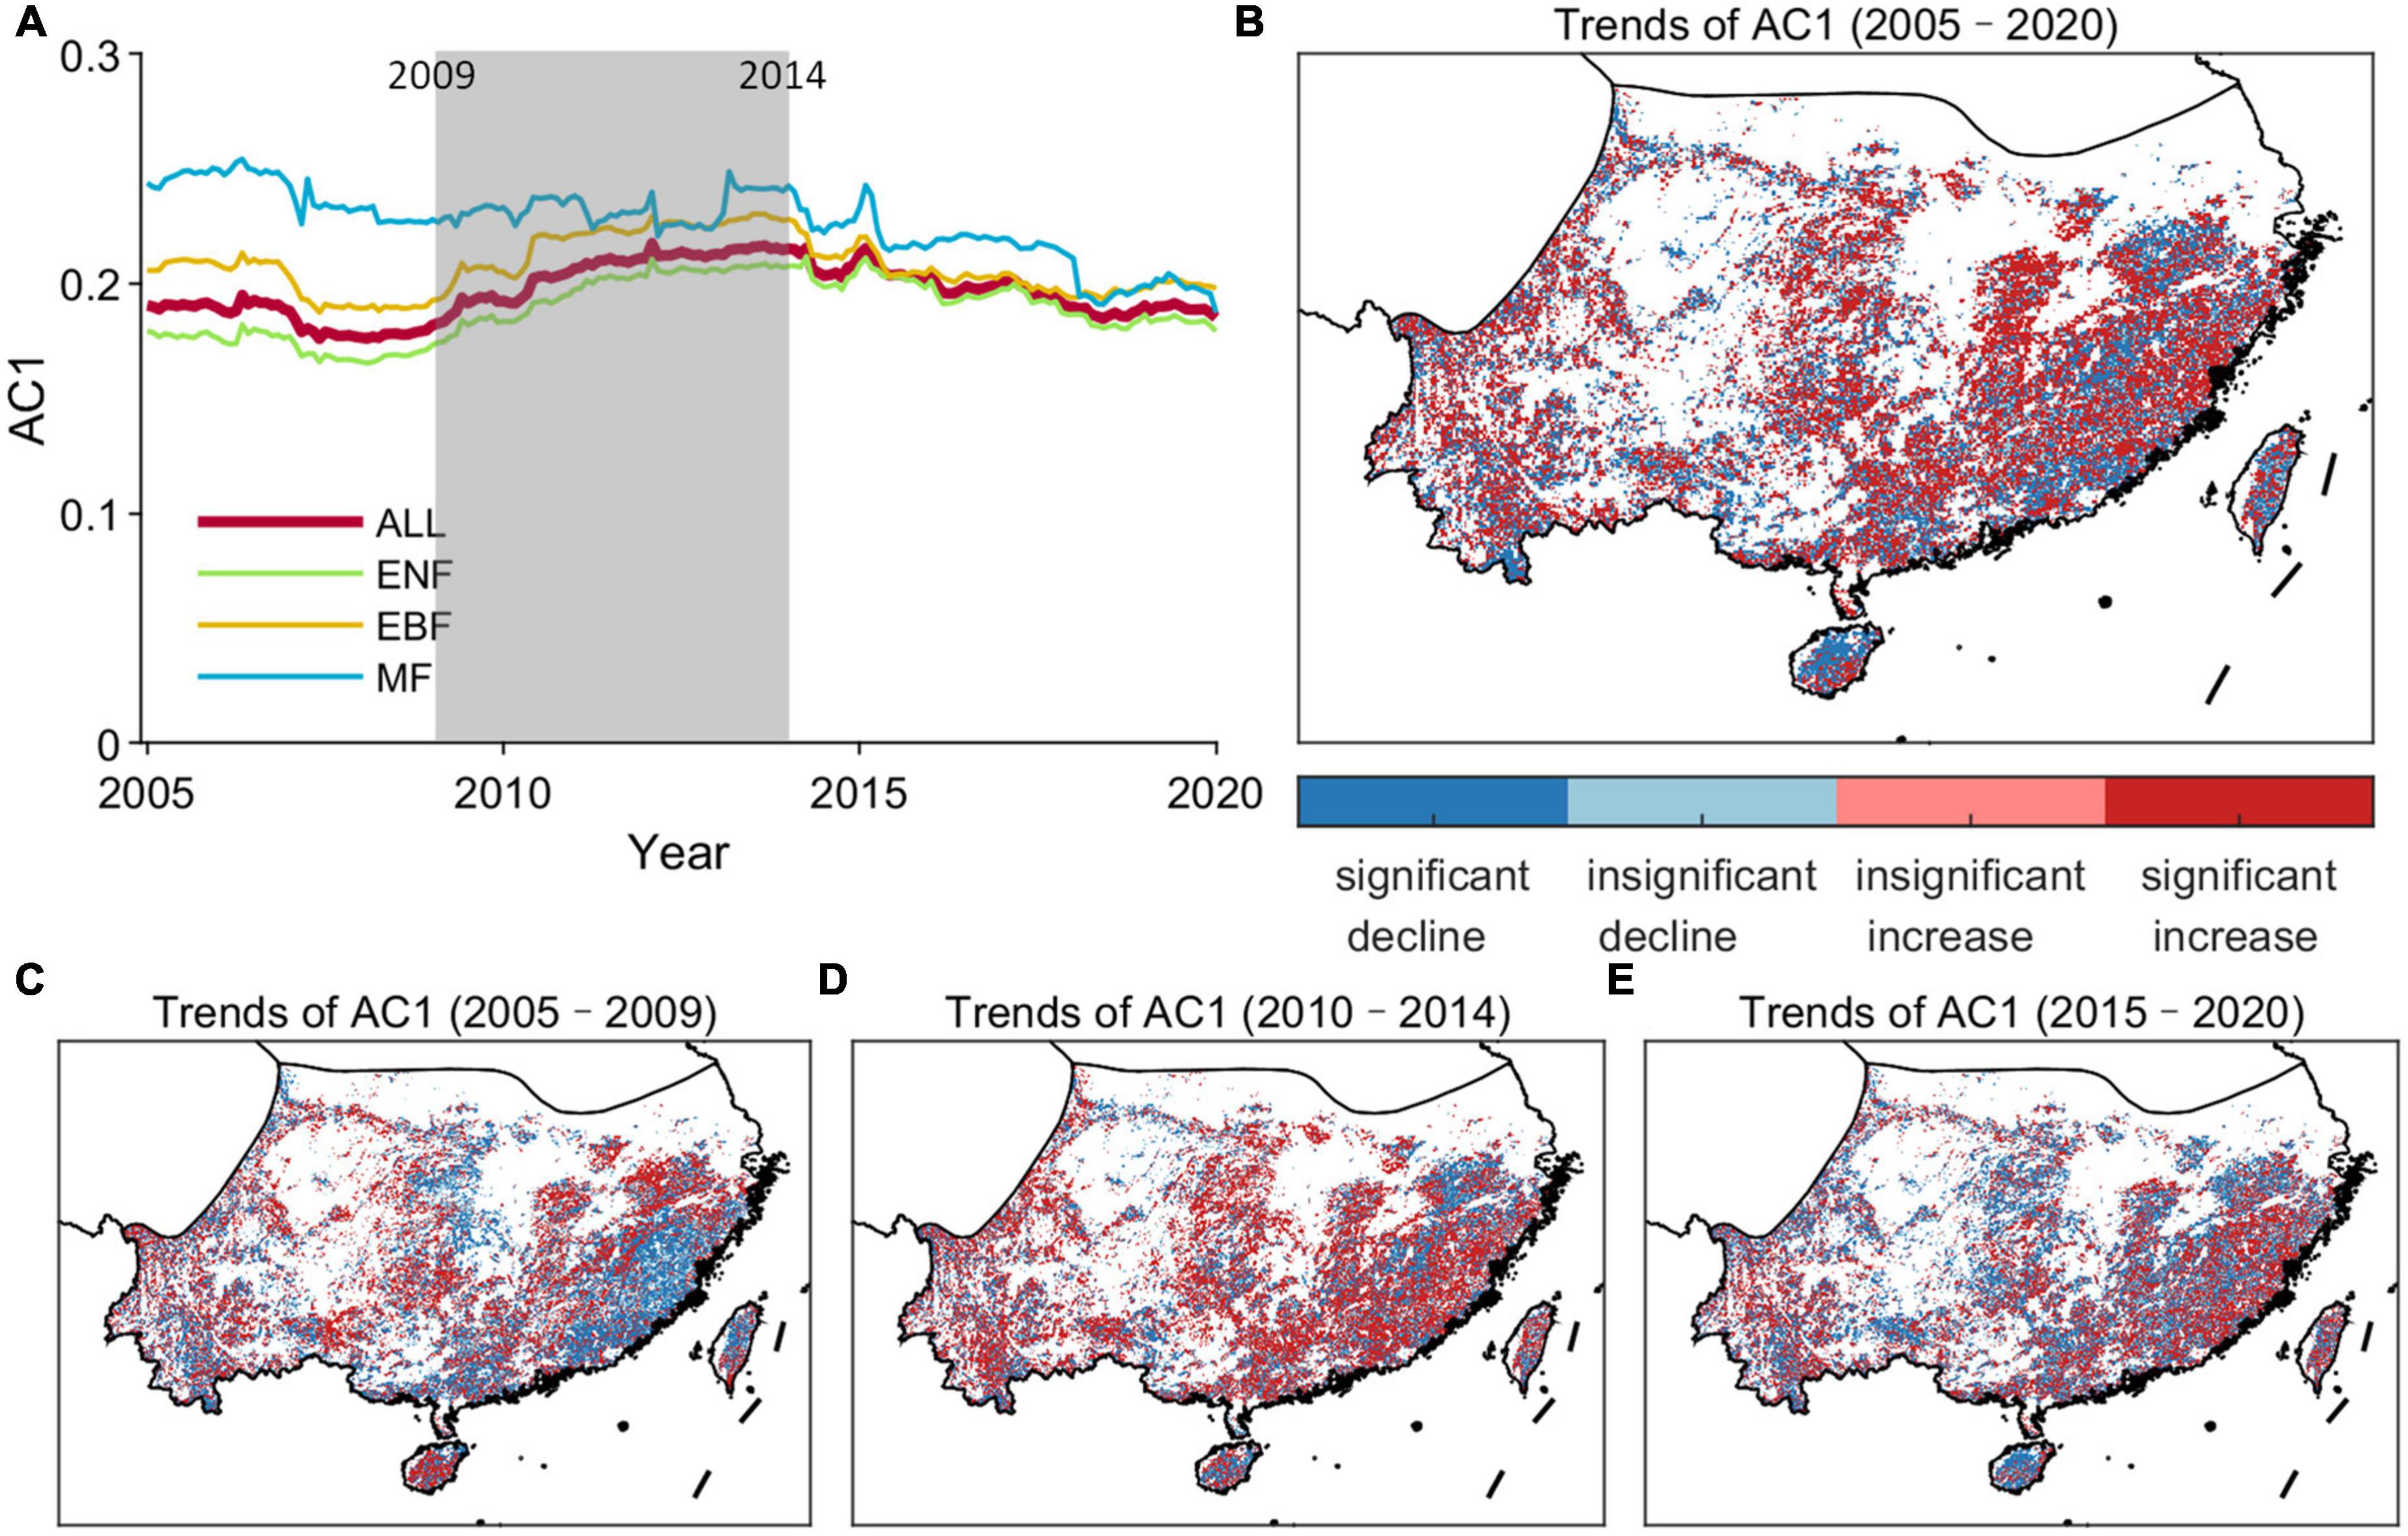
Figure 6. Temporal trends of the resilience of subtropical evergreen forests in China. (A) Temporal changes in AC1 computed in a 5-year moving window over 2001–2020 kNDVI time series for the subtropical evergreen forests. (B) Spatial map of the temporal trends in AC1 time series during 2005–2020. (C) Spatial map of the temporal trends in AC1 time series during 2005–2009. (D) Spatial map of the temporal trends in AC1 time series during 2010–2014. (E) Spatial map of the temporal trends in AC1 time series during 2015–2020. “ALL” means the entire subtropical evergreen forests.
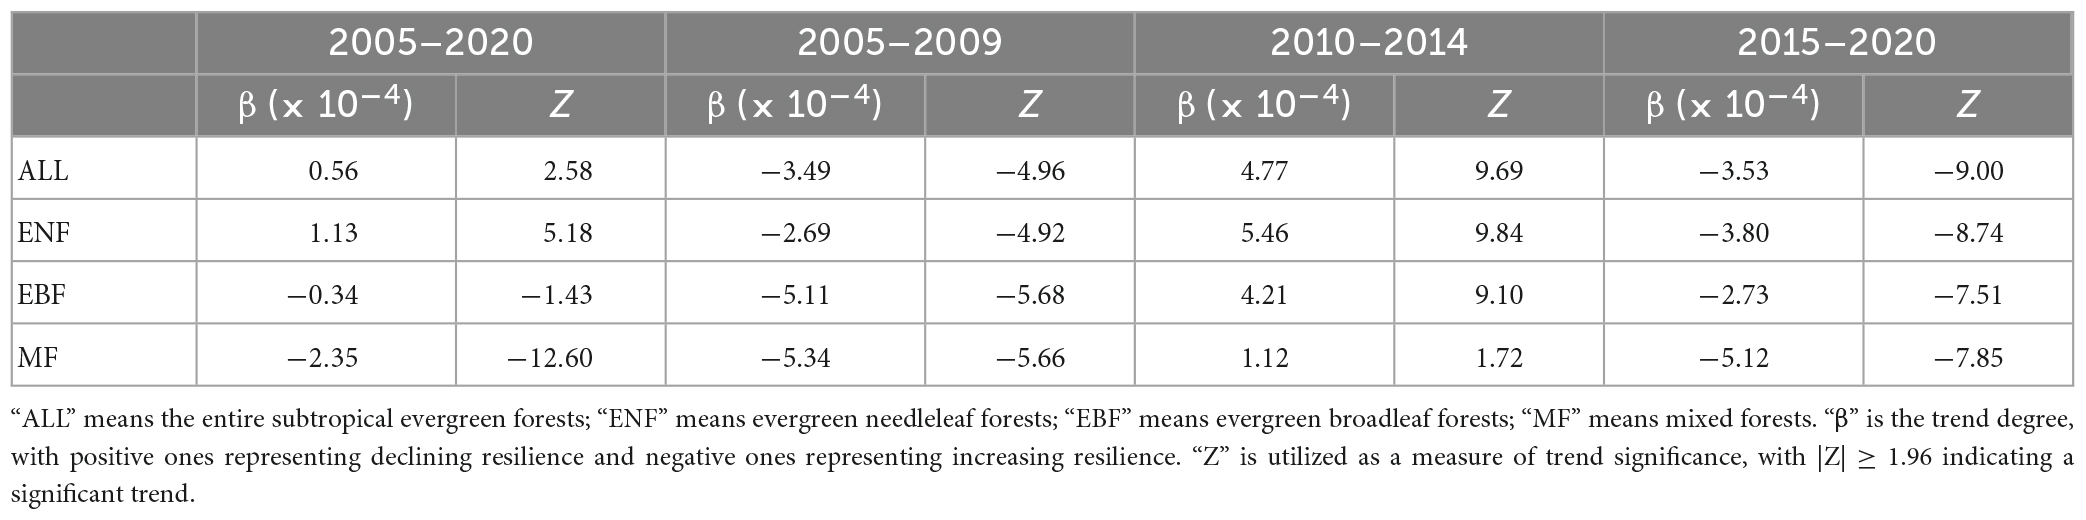
Table 2. Temporal trends of forest resilience for different time periods and plant functional types.
We then assessed the dominant driving forces for the temporal variability in forest resilience by applying the VIF analysis and RF regression analysis with the AC1 time series in each grid cell. We found that the temporal variation of AC1 in these evergreen forest grid cells was not driven by one or two uniform variables. However, the most dominant driving variables are temperatures, including average and minimum temperatures (Ta and Tmin) (Figure 7A). The grid cells with Ta as the most important variable occupy 15.8% of all forest grid cells, and the grid cells with Tmin occupy 13.2% of all grid cells. VPD and Pre followed with a cover percentage of 11.5 and 10.8%, respectively. The cover percentages of the other variables are all less than 10%. We also assessed the cover percentages of the most influential variables for different PFTs (Figure 7B). Ta is still the most important variable with the highest percentages for ENF, EBF, and MF. Tmin is the second important variable for ENF and EBF, while forest age influences the trends of resilience in MF more than Tmin (Figure 7B).
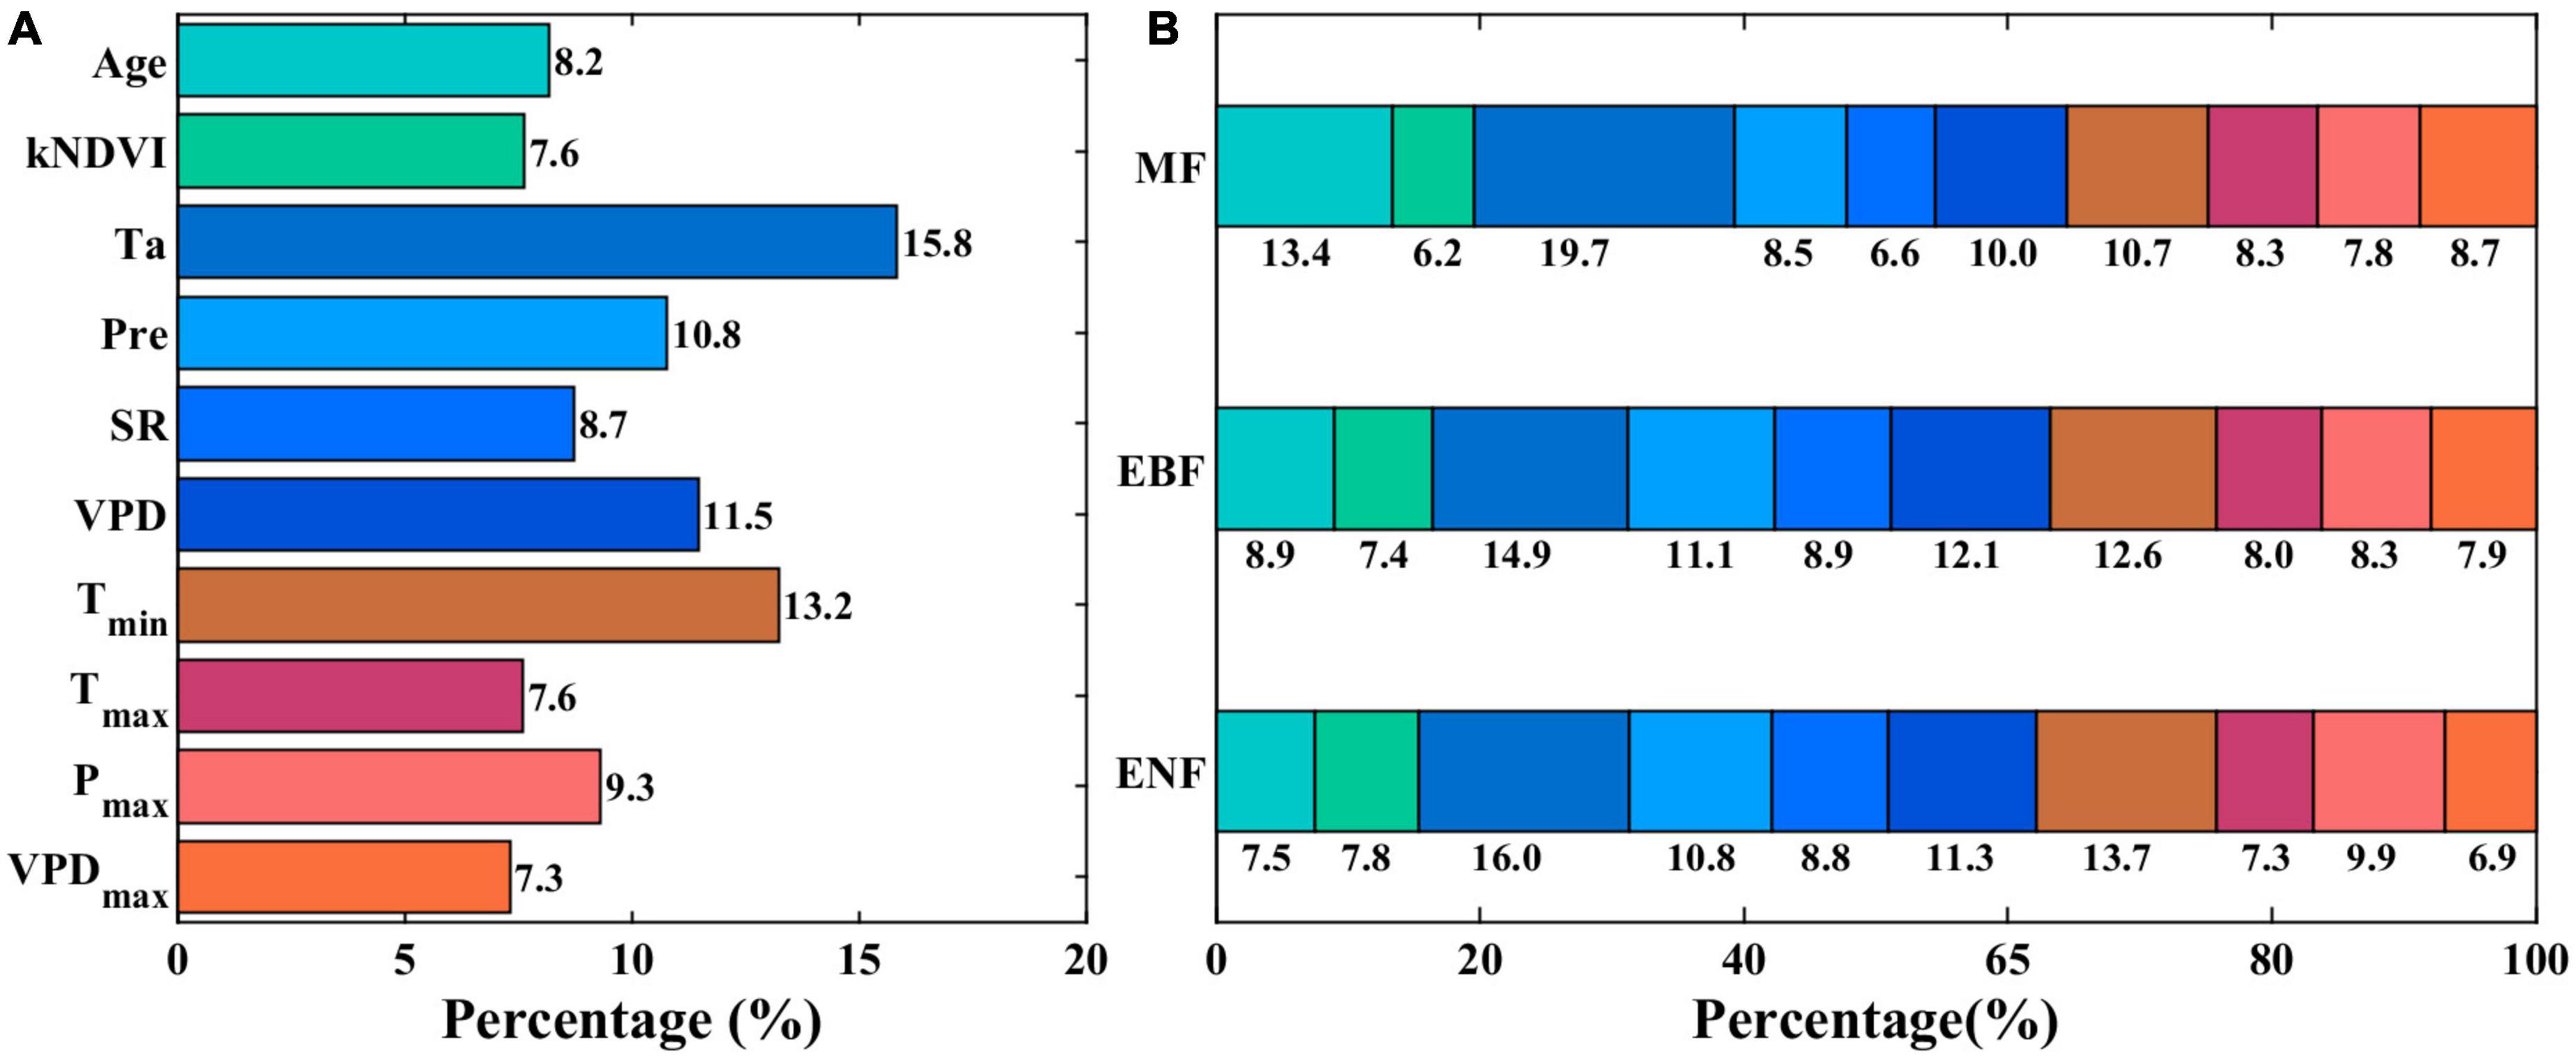
Figure 7. Variable importance of selected environmental variables for explaining the AC1 time series in each grid of subtropical evergreen forests in China. (A) Cover percentages of different most influential environmental variables. (B) Cover percentages of the most influential variables across the plant functional types.
4. Discussion
4.1. Indication of AC1 to forest resilience
The previous studies on ecosystem resilience mostly quantified the recovery time or the extent of ecosystem loss after a single special disturbance, such as drought (Longo et al., 2018; Huang and Xia, 2019), heat wave (Tatarinov et al., 2016; Guha et al., 2018), and wildfire (Stevens-Rumann et al., 2018; Hart et al., 2019). For example, Huang and Xia (2019) define resilience to drought as the rate of EVI recovering to its pre-drought level; Hart et al. (2019) defines resilience to wildfire as the probability of the forest state recovering to its original state after a stand-replacing wildfire. But this definition is only applicable if strong external disturbances occur to natural vegetation systems (Smith et al., 2022). The resilience of natural ecosystems is hardly quantified in the above ways due to the scarcity of strong external disturbances. The temporal autocorrelation from long-term satellite vegetation datasets, namely the kNDVI-based AC1 in this study, breaks the limitation of the absence of strong disturbances and can be leveraged to evaluate broader spatial patterns of forest resilience.
Besides, ecosystem resilience metrics are typically computed by ecosystem state variables (such as biomass and species abundance), which are difficult to directly connect to ecosystem processes described by rates (Hu et al., 2022). Spectral indices are convenient proxies for canopy structure and leaf biochemical features, and consequently to track the dynamics of vegetation photosynthetic activity [i.e., gross primary production (GPP)]. But the celebrated NDVI has well-known issues with nonlinearities and saturation effects at high vegetation productivity (Huete et al., 1997). A new index called NIRv, calculated by multiplying NDVI with NIR, is not a dimensionless quantity (or actual index) despite its good performance in relation to GPP (Wang et al., 2023). kNDVI shows good characteristics like boundedness, low error propagation, and less sensitivity to orbital drifts (Wang et al., 2021, 2023), and is therefore a more appropriate proxy for GPP than NDVI and NIRv. Thus, we used kNDVI as an indicator of ecosystem function to compute the lag-one autocorrelation (AC1) from its time series as a measure of forest resilience.
The indication of kNDVI-based AC1 to the evergreen forest resilience has been supported by the empirical recovery rate proposed by Smith et al. (2022) in an intuitive way and on a per-point basis (Figure 3). The empirical recovery rate was computed by delineating the large disturbances using the 99% percentile method and then curve-fitting the subsequent time series of recovering ecosystem state. It might be more realistic because it clearly detected disturbances. We found that the empirical recovery rate from external disturbances was more sparsely distributed than the AC1-based recovery rate (Figures 3A, C). Not all forest areas have undergone rapid and drastic changes during the period; thus, vegetation resilience in these areas is impossible to be directly quantified through recovery from an external disturbance (Smith et al., 2022). In contrast, AC1-based recovery rate can be obtained under a broader range of conditions. In areas where the recovery rate can be estimated empirically from large disturbances, the empirical recovery rate shows broad spatial consistency with the theoretically computed rAC1 and binned means or medians of AC1 can be well-fitted as a function of the empirical recovery rate. Thus, the AC1 from the kNDVI data reveals the forest resilience of the subtropical evergreen forests.
4.2. Drivers of the evergreen forest resilience
Some hypotheses on abiotic and biotic factors that can influence resilience have been tested with numerous spatial and temporal datasets. Consistent with our study, climate is a key abiotic factor hypothesized to affect ecosystem resilience (Willis et al., 2018). We found that solar radiation is the dominant driver influencing the spatial pattern of forest resilience in the subtropical evergreen forests of China (Figures 4B, 5A), which is in line with the results in Forzieri et al. (2022). Higher solar radiation leads to less resilient forests, which explains the decreasing forest resilience with decreasing latitude (Figure 2B). It’s well-founded that elevated temperatures and water limitations are systematically associated with worldwide cases of massive tree mortality (Ibáñez et al., 2019). Our analysis shows that temperature rather than precipitation has a clear influence on both the spatial variability and temporal trend in the resilience of subtropical evergreen forests in China (Figures 4B, 7B). The findings here imply that resilience of the subtropical evergreen forest may be declined at higher daily minimum temperature (Tmin), which may be explained by the decelerating growth rates with higher Tmin in forest trees (Feeley et al., 2007). We also found that water limitation (high VPD) slows down the forests’ capacity to recover after disturbances (Figure 5B). Poorter et al. (2016) also reported that the recovery of above-ground biomass increased with water availability (higher precipitation and lower water deficit) in neotropical dry forests. Under water-deficit conditions, trees close their stomata, reduce photosynthesis, and consume stored carbohydrates to maintain metabolism, hindering growth and recovery of trees. Besides, rising temperatures may amplify the impacts of water deficit on tree mortality, then on forest resilience (Adams et al., 2009).
In addition, a suite of biotic factors needs to be considered. In this study, we assumed forest age and the average annual forest photosynthetic activity as possible biotic factors influencing forest resilience. Although they are of secondary importance in the spatiotemporal variations in forest resilience, high values of AC1 (low resilience) typically occur at locations characterized by high long-term average kNDVI and forest age (Supplementary Figure 2). This suggests that high productivity does not mean high resilience, but rather the opposite. Nonproductive forests may be more resilient to disturbances, because their previous states are more easily attained. Older forests may provide more various stem diameter sizes and thus, more complex structure than younger forests (Jeffries et al., 2006), making it more difficult to recover to the previous states. It’s also reported that increases in plant flammability and wind damage vulnerability with forest age promote reduced resilience to climate variability (Oliver and Larson, 1996; Kitzberger et al., 2012).
Other abiotic factors such as soil attributes and number of disturbances are also proven to be influential to the forest resilience. High soil fertility has a positive influence on biomass recovery, and soils with low clay content have higher resilience (Oliveras and Malhi, 2016; Poorter et al., 2016). A system experiences more disturbances recovers faster, perhaps because the vegetation is gradually dominated by species with fast response and adaptation abilities to disturbance (Cole et al., 2014; Willis et al., 2018). Another biotic factor that has been widely considered but not in this study is biodiversity (Hodgson et al., 2015). Ecosystems with greater biodiversity will be more resilient to disturbances, but this is not always the case. African regions with the highest plant species richness exhibit the greatest sensitivity to environmental disturbances (Liu et al., 2022). Our study focuses more on the characteristics of vegetation and meteorology, which reproduce the spatial and temporal variation of resilience well despite ignoring the above factors. In the future, these factors need to be studied for better identifying the underlying mechanisms of the tempo-spatial variations in resilience of subtropical evergreen forests in China.
5. Conclusion
In this study, we estimated the temporal autocorrelation (AC1) from a time series of the satellite kNDVI dataset to investigate the spatial pattern and temporal variability of evergreen forest resilience over the past two decades in southern China. The major conclusions are drawn as follows:
(1) The computed long-term AC1 depicts considerable spatial variability in the resilience of the subtropical evergreen forests in China, with low resilience occurring in low-latitude areas such as the Yunnan-Guizhou plateau, Hainan Island, and the coastal hilly regions.
(2) The spatial variability in the forest resilience can be re-established with RF model by forest and climatic variables, and is largely affected by SR, VPD, and Tmin. Higher forest resilience is more likely to be found in locations with less radiation stress, adequate water availability, and less warming.
(3) The forest resilience has shown a declining trend over the past two decades but has increased in the recent decade. Temperature changes, including average and minimum temperatures, dominate the temporal trends in the resilience of subtropical evergreen forests in China.
From the findings of this study, we suggest more attention should be paid to the subtropical evergreen forests to deal with the warming climate in times of rapid global change.
Data availability statement
The original contributions presented in this study are included in the article/Supplementary material, further inquiries can be directed to the corresponding authors.
Author contributions
JC, SW, and HS contributed to the conception and design of the study. JC and BC performed the statistical analysis. JW collected and processed the data. JC and SW wrote the first draft of the manuscript. CZ and KZ wrote sections of the manuscript. All authors discussed the results, contributed to the revisions, and approved the submitted version.
Funding
This work was financially supported by the National Natural Science Foundation of China (grant numbers: 41871342 and 42101479), the Strategic Priority Research Program of the Chinese Academy of Sciences (grant number: XDA23100202), and the China Postdoctoral Science Foundation (grant number: 2020M680654).
Conflict of interest
The authors declare that the research was conducted in the absence of any commercial or financial relationships that could be construed as a potential conflict of interest.
Publisher’s note
All claims expressed in this article are solely those of the authors and do not necessarily represent those of their affiliated organizations, or those of the publisher, the editors and the reviewers. Any product that may be evaluated in this article, or claim that may be made by its manufacturer, is not guaranteed or endorsed by the publisher.
Supplementary material
The Supplementary Material for this article can be found online at: https://www.frontiersin.org/articles/10.3389/ffgc.2023.1166481/full#supplementary-material
Footnotes
References
Abis, B., and Brovkin, V. (2017). Environmental conditions for alternative tree-cover states in high latitudes. Biogeosciences 14, 511–527. doi: 10.5194/bg-14-511-2017
Adams, H. D., Guardiola-Claramonte, M., Barron-Gafford, G. A., Villegas, J. C., Breshears, D. D., Zou, C. B., et al. (2009). Temperature sensitivity of drought-induced tree mortality portends increased regional die-off under global-change-type drought. Proc. Natl. Acad. Sci. U.S.A. 106, 7063–7066. doi: 10.1073/pnas.0901438106
Bai, J., Shi, H., Yu, Q., Xie, Z., Li, L., Luo, G., et al. (2019). Satellite-observed vegetation stability in response to changes in climate and total water storage in Central Asia. Sci. Total Environ. 659, 862–871. doi: 10.1016/j.scitotenv.2018.12.418
Bonan, G. B. (1989). A computer model of the solar radiation, soil moisture, and soil thermal regimes in boreal forests. Ecol. Modell. 45, 275–306. doi: 10.1016/0304-3800(89)90076-8
Boulton, C. A., Lenton, T. M., and Boers, N. (2022). Pronounced loss of Amazon rainforest resilience since the early 2000s. Nat. Clim. Change 12, 271–278. doi: 10.1038/s41558-022-01287-8
Camps-Valls, G., Campos-Taberner, M., Moreno-Martínez, Á, Walther, S., Duveiller, G., Cescatti, A., et al. (2021). A unified vegetation index for quantifying the terrestrial biosphere. Sci. Adv. 7:eabc7447. doi: 10.1126/sciadv.abc7447
Cleveland, R. B., Cleveland, W. S., McRae, J. E., and Terpenning, I. (1990). STL: A seasonal-trend decomposition. J. Off. Stat. 6, 3–73.
Cole, L. E., Bhagwat, S. A., and Willis, K. J. (2014). Recovery and resilience of tropical forests after disturbance. Nat. Commun. 5, 1–7. doi: 10.1038/ncomms4906
Dakos, V., Carpenter, S. R., van Nes, E. H., and Scheffer, M. (2015). Resilience indicators: Prospects and limitations for early warnings of regime shifts. Philos. Trans. R. Soc. B Biol. Sci. 370:20130263. doi: 10.1098/rstb.2013.0263
Dakos, V., Van Nes, E. H., d’Odorico, P., and Scheffer, M. (2012). Robustness of variance and autocorrelation as indicators of critical slowing down. Ecology 93, 264–271. doi: 10.1890/11-0889.1
Fang, O., and Zhang, Q. B. (2019). Tree resilience to drought increases in the Tibetan Plateau. Glob. Change Biol. 25, 245–253. doi: 10.1111/gcb.14470
Feeley, K. J., Joseph Wright, S., Nur Supardi, M., Kassim, A. R., and Davies, S. J. (2007). Decelerating growth in tropical forest trees. Ecol. Lett. 10, 461–469. doi: 10.1111/j.1461-0248.2007.01033.x
Fernandes, R., and Leblanc, S. G. (2005). Parametric (modified least squares) and non-parametric (Theil–Sen) linear regressions for predicting biophysical parameters in the presence of measurement errors. Remote Sens. Environ. 95, 303–316. doi: 10.1016/j.rse.2005.01.005
Forzieri, G., Dakos, V., McDowell, N. G., Ramdane, A., and Cescatti, A. (2022). Emerging signals of declining forest resilience under climate change. Nature 608, 534–539. doi: 10.1038/s41586-022-04959-9
Friedlingstein, P., Jones, M. W., O’Sullivan, M., Andrew, R. M., Bakker, D. C., Hauck, J., et al. (2022). Global carbon budget 2021. Earth Syst. Sci. Data 14, 1917–2005. doi: 10.5194/essd-14-1917-2022
Geng, S., Yang, L., Sun, Z., Wang, Z., Qian, J., Jiang, C., et al. (2021). Spatiotemporal patterns and driving forces of remotely sensed urban agglomeration heat islands in South China. Sci. Total Environ. 800:149499. doi: 10.1016/j.scitotenv.2021.149499
Guha, A., Han, J., Cummings, C., McLennan, D. A., and Warren, J. M. (2018). Differential ecophysiological responses and resilience to heat wave events in four co-occurring temperate tree species. Environ. Res. Lett. 13:065008. doi: 10.1088/1748-9326/aabcd8
Hair, J. F., Black, W. C., Babin, B. J., and Anderson, R. E. (2009). Multivariate data analysis, Vol. 24. Upper Saddle River, NJ: Macmillan, 899.
Hansen, M. C., Potapov, P. V., Moore, R., Hancher, M., Turubanova, S. A., Tyukavina, A., et al. (2013). High-resolution global maps of 21st-century forest cover change. Science 342, 850–853. doi: 10.1126/science.1244693
Hart, S. J., Henkelman, J., McLoughlin, P. D., Nielsen, S. E., Truchon-Savard, A., and Johnstone, J. F. (2019). Examining forest resilience to changing fire frequency in a fire-prone region of boreal forest. Glob. Change Biol. 25, 869–884. doi: 10.1111/gcb.14550
Hodgson, D., McDonald, J. L., and Hosken, D. J. (2015). What do you mean, ‘resilient’? Trends Ecol. Evol. 30, 503–506. doi: 10.1016/j.tree.2015.06.010
Holling, C. S. (1973). Resilience and stability of ecological systems. Annu. Rev. Ecol. Evol. Syst. 4, 1–23. doi: 10.1146/annurev.es.04.110173.000245
Hu, Z., Dakos, V., and Rietkerk, M. (2022). Using functional indicators to detect state changes in terrestrial ecosystems. Trends Ecol. Evol. 37, 1036–1045. doi: 10.1016/j.tree.2022.07.011
Huang, K., and Xia, J. (2019). High ecosystem stability of evergreen broadleaf forests under severe droughts. Glob. Change Biol. 25, 3494–3503. doi: 10.1111/gcb.14748
Huang, K., Wang, S., Zhou, L., Wang, H., Liu, Y., and Yang, F. (2013). Effects of drought and ice rain on potential productivity of a subtropical coniferous plantation from 2003 to 2010 based on eddy covariance flux observation. Environ. Res. Lett. 8:035021. doi: 10.1088/1748-9326/8/3/035021
Hubau, W., Lewis, S. L., Phillips, O. L., Affum-Baffoe, K., Beeckman, H., Cuní-Sanchez, A., et al. (2020). Asynchronous carbon sink saturation in African and Amazonian tropical forests. Nature 579, 80–87. doi: 10.1038/s41586-020-2035-0
Huete, A. R., Liu, H., and van Leeuwen, W. J. (1997). “The use of vegetation indices in forested regions: Issues of linearity and saturation,” in Proceedings of the IGARSS’97. 1997 IEEE international geoscience and remote sensing symposium proceedings. Remote sensing-a scientific vision for sustainable development, Vol. 4 (Piscataway, NJ: IEEE), 1966–1968.
Hutchinson, M. F. (1995). Interpolating mean rainfall using thin plate smoothing splines. Int. J. Geogr. Inf. Sci. 9, 385–403. doi: 10.1080/02693799508902045
Ibáñez, I., Acharya, K., Juno, E., Karounos, C., Lee, B. R., McCollum, C., et al. (2019). Forest resilience under global environmental change: Do we have the information we need? A systematic review. PLoS One 14:e0222207. doi: 10.1371/journal.pone.0222207
Ives, A. R., Zhu, L., Wang, F., Zhu, J., Morrow, C. J., and Radeloff, V. C. (2021). Statistical inference for trends in spatiotemporal data. Remote Sens. Environ. 266:112678. doi: 10.1016/j.rse.2021.112678
Jeffries, J. M., Marquis, R. J., and Forkner, R. E. (2006). Forest age influences oak insect herbivore community structure, richness, and density. Ecol. Appl. 16, 901–912. doi: 10.1890/1051-0761(2006)016[0901:FAIOIH]2.0.CO;2
Kitzberger, T., Aráoz, E., Gowda, J. H., Mermoz, M., and Morales, J. M. (2012). Decreases in fire spread probability with forest age promotes alternative community states, reduced resilience to climate variability and large fire regime shifts. Ecosystems 15, 97–112. doi: 10.1007/s10021-011-9494-y
Kock, N., and Lynn, G. (2012). Lateral collinearity and misleading results in variance-based SEM: An illustration and recommendations. J. Assoc. Inf. Sci. Technol. 13, 546–580. doi: 10.17705/1jais.00302
Lewis, S. L., Wheeler, C. E., Mitchard, E. T., and Koch, A. (2019). Restoring natural forests is the best way to remove atmospheric carbon. Nature 568, 25–28. doi: 10.1038/d41586-019-01026-8
Liu, D., Wang, T., Peñuelas, J., and Piao, S. (2022). Drought resistance enhanced by tree species diversity in global forests. Nat. Geosci. 15, 800–804. doi: 10.1038/s41561-022-01026-w
Liu, Y., Kumar, M., Katul, G. G., and Porporato, A. (2019). Reduced resilience as an early warning signal of forest mortality. Nat. Clim. Change 9, 880–885. doi: 10.1038/s41558-019-0583-9
Longo, M., Knox, R. G., Levine, N. M., Alves, L. F., Bonal, D., Camargo, P. B., et al. (2018). Ecosystem heterogeneity and diversity mitigate Amazon forest resilience to frequent extreme droughts. New Phytol. 219, 914–931. doi: 10.1111/nph.15185
Lovejoy, T. E., and Nobre, C. (2018). Amazon tipping point. Sci. Adv. 4:eaat2340. doi: 10.1126/sciadv.aat2340
Mann, H. B. (1945). Nonparametric tests against trend. Econometrica 13, 245–259. doi: 10.2307/1907187
Midi, H., and Bagheri, A. (2010). “Robust multicollinearity diagnostic measure in collinear data set,” in Proceedings of the 4th international conference on applied mathematics, simulation, modeling (Stevens Point, WI: World Scientific and Engineering Academy and Society (WSEAS)), 138–142.
Oliver, C. D., and Larson, B. C. (1996). Forest stand dynamics: Updated edition. Hoboken, NJ: John Wiley and sons.
Oliveras, I., and Malhi, Y. (2016). Many shades of green: The dynamic tropical forest–savannah transition zones. Philos. Trans. R. Soc. B Biol. Sci. 371:20150308. doi: 10.1098/rstb.2015.0308
Pan, Y., Birdsey, R. A., Fang, J., Houghton, R., Kauppi, P. E., Kurz, W. A., et al. (2011). A large and persistent carbon sink in the world’s forests. Science 333, 988–993. doi: 10.1126/science.1201609
Pedregosa, F., Varoquaux, G., Gramfort, A., Michel, V., Thirion, B., Grisel, O., et al. (2011). Scikit-learn: Machine learning in Python. J. Mach. Learn. Technol. 12, 2825–2830.
Pei, F., Li, X., Liu, X., and Lao, C. (2013). Assessing the impacts of droughts on net primary productivity in China. J. Environ. Manage. 114, 362–371. doi: 10.1016/j.jenvman.2012.10.031
Poorter, L., Bongers, F., Aide, T. M., Almeyda Zambrano, A. M., Balvanera, P., Becknell, J. M., et al. (2016). Biomass resilience of Neotropical secondary forests. Nature 530, 211–214. doi: 10.1038/nature16512
Savitzky, A., and Golay, M. J. (1964). Smoothing and differentiation of data by simplified least squares procedures. Anal. Chem. 36, 1627–1639. doi: 10.1021/ac60214a047
Scheffer, M., Bascompte, J., Brock, W. A., Brovkin, V., Carpenter, S. R., Dakos, V., et al. (2009). Early-warning signals for critical transitions. Nature 461, 53–59. doi: 10.1038/nature08227
Seidl, R., Thom, D., Kautz, M., Martin-Benito, D., Peltoniemi, M., Vacchiano, G., et al. (2017). Forest disturbances under climate change. Nat. Clim. Change 7, 395–402. doi: 10.1038/nclimate3303
Sen, P. K. (1968). Estimates of the regression coefficient based on Kendall’s tau. J. Am. Stat. Assoc. 63, 1379–1389. doi: 10.1080/01621459.1968.10480934
Smith, T., Traxl, D., and Boers, N. (2022). Empirical evidence for recent global shifts in vegetation resilience. Nat. Clim. Change 12, 477–484. doi: 10.1038/s41558-022-01352-2
Stevens-Rumann, C. S., Kemp, K. B., Higuera, P. E., Harvey, B. J., Rother, M. T., Donato, D. C., et al. (2018). Evidence for declining forest resilience to wildfires under climate change. Ecol. Lett. 21, 243–252. doi: 10.1111/ele.12889
Tatarinov, F., Rotenberg, E., Maseyk, K., Ogée, J., Klein, T., and Yakir, D. (2016). Resilience to seasonal heat wave episodes in a Mediterranean pine forest. New Phytol. 210, 485–496. doi: 10.1111/nph.13791
Verbesselt, J., Umlauf, N., Hirota, M., Holmgren, M., Van Nes, E. H., Herold, M., et al. (2016). Remotely sensed resilience of tropical forests. Nat. Clim. Change 6, 1028–1031. doi: 10.1038/nclimate3108
Wang, J., Wang, J., Ye, H., Liu, Y., and He, H. (2017). An interpolated temperature and precipitation dataset at 1-km grid resolution in China (2000–2012). China Sci. Data 2, 88–95.
Wang, Q., Moreno-Martínez, Á, Muñoz-Marí, J., Campos-Taberner, M., and Camps-Valls, G. (2023). Estimation of vegetation traits with kernel NDVI. ISPRS J. Photogramm. Remote Sens. 195, 408–417. doi: 10.1016/j.isprsjprs.2022.12.019
Wang, S., Zhang, Y., Ju, W., Chen, J. M., Cescatti, A., Sardans, J., et al. (2021). Response to comments on “recent global decline of CO2 fertilization effects on vegetation photosynthesis”. Science 373:eabg7484. doi: 10.1126/science.abg7484
Willis, K. J., Jeffers, E. S., and Tovar, C. (2018). What makes a terrestrial ecosystem resilient? Science 359, 988–989. doi: 10.1126/science.aar5439
Wu, B., Yuan, Q., Yan, C., Wang, Z., Yu, X., Li, A., et al. (2014). Land cover changes of china from 2000 to 2010. Quat. Res. 34, 723–731.
Yi, C., and Jackson, N. (2021). A review of measuring ecosystem resilience to disturbance. Environ. Res. Lett. 16:053008. doi: 10.1088/1748-9326/abdf09
Yu, G., Chen, Z., Piao, S., Peng, C., Ciais, P., Wang, Q., et al. (2014). High carbon dioxide uptake by subtropical forest ecosystems in the East Asian monsoon region. Proc. Natl. Acad. Sci. U.S.A. 111, 4910–4915. doi: 10.1073/pnas.1317065111
Zhang, C., Ju, W., Chen, J. M., Li, D., Wang, X., Fan, W., et al. (2014). Mapping forest stand age in China using remotely sensed forest height and observation data. J. Geophys. Res. Biogeosci 119, 1163–1179. doi: 10.1002/2013JG002515
Zhang, L., Li, X., Yuan, Q., and Liu, Y. (2014). Object-based approach to national land cover mapping using HJ satellite imagery. J. Appl. Remote Sens. 8:083686. doi: 10.1117/1.JRS.8.083686
Zhang, L., Xiao, J., Li, J., Wang, K., Lei, L., and Guo, H. (2012). The 2010 spring drought reduced primary productivity in southwestern China. Environ. Res. Lett. 7:045706. doi: 10.1088/1748-9326/7/4/045706
Keywords: resilience, evergreen forests, kNDVI, spatiotemporal variability, random forest analysis
Citation: Chen J, Wang S, Shi H, Chen B, Wang J, Zheng C and Zhu K (2023) Radiation and temperature dominate the spatiotemporal variability in resilience of subtropical evergreen forests in China. Front. For. Glob. Change 6:1166481. doi: 10.3389/ffgc.2023.1166481
Received: 15 February 2023; Accepted: 30 March 2023;
Published: 17 April 2023.
Edited by:
Jess K. Zimmerman, University of Puerto Rico, Puerto RicoReviewed by:
Przemyslaw Zelazowski, University of Warsaw, PolandSebastian Martinuzzi, University of Wisconsin-Madison, United States
Copyright © 2023 Chen, Wang, Shi, Chen, Wang, Zheng and Zhu. This is an open-access article distributed under the terms of the Creative Commons Attribution License (CC BY). The use, distribution or reproduction in other forums is permitted, provided the original author(s) and the copyright owner(s) are credited and that the original publication in this journal is cited, in accordance with accepted academic practice. No use, distribution or reproduction is permitted which does not comply with these terms.
*Correspondence: Shaoqiang Wang, c3F3YW5nQGlnc25yci5hYy5jbg==; Hao Shi, aGFvc2hpQHJjZWVzLmFjLmNu