 Fabien Delapierre
 Patrick Fonti
 Heike Lischke
 Christine Moos
- 1Faculty of Geosciences and Environment, University of Lausanne, Lausanne, Switzerland
- 2Dendrosciences, Forest Dynamics, Swiss Federal Institute for Forest, Snow and Landscape Research WSL, Birmensdorf, Switzerland
- 3Dynamic Macroecology, Land Change Science, Swiss Federal Institute for Forest, Snow and Landscape Research WSL, Birmensdorf, Switzerland
- 4Bern University of Applied Sciences, School for Agricultural, Forest and Food Sciences (BFH-HAFL), Zollikofen, Switzerland
Dendrometers recording stem diameter variations (SDV) at high-resolution are useful to assess trees' water relation since water reserves are stored in the elastic tissue of the bark. These tissues typically shrink during the day as they release water when evaporative demand is high and swell during the night as they are replenished when evaporative demand is low, generating the typical SDV profile known as the diel SDV cycle. However, similar SDV cycles have been observed on dead trees due to the hygroscopic shrinking and swelling of the dead bark tissues. In order to remove this hygroscopic effect of the bark, dendrometers are applied as close as possible to the living bark tissues by removing the outer dead layer, however with questionable success. In this study, we used SDV time series from 40 point dendrometers applied on dead-bark-removed mature trees to assess and quantify the remaining hygroscopic effect on individual trees. To do so, we checked SDV behavior in the cold season and explored the relation between the diel SDV cycle and changes in relative humidity (RH). Our results showed that (a) the hygroscopic effect in SDV can be well-detected based on the amplitude of the diel SDV cycle (diel SDVampl) and the correlation between SDV and RH during both the cold and the warm season; (b) the level of the hygroscopic effect varies strongly among individuals; (c) diel SDVampl is proportional to both changes in RH and transpiration so that the hygroscopic effect on the diel SDV cycle can be quantified using a linear model where (diel SDVampl) is a function of RH changes and transpiration. These results allow the use of the model to correct the amplitude of the diel SDV cycles and suggest that this method can be applied to other ecological relevant water-related SDV variables such as tree water deficit.
1. Introduction
Automatic dendrometers have been widely used to assess trees' water balance (Zweifel et al., 2005; Deslauriers et al., 2007; Corell et al., 2014; Mencuccini et al., 2017; Barraclough et al., 2020; Epron et al., 2021). Due to their ability to measure stem diameter variations (SDV) at micrometer resolution and at sub-hourly frequency, dendrometers not only monitor stem radial growth variations but also capture subtle water-related size variation originating from reversible shrinkage and swelling of dead and living tissue underneath the dendrometer rod (e.g., De Swaef et al., 2015).
The underlying mechanisms of those subtle variations are intimately related to trees' water use and storage and thus the trees' water status (Klepper et al., 1971). Specifically, when canopy water loss overcomes soil water absorption, the intensifying negative water potential calls water from the stem elastic tissues (Zweifel and Häsler, 2000), which lose turgor and shrink (King G. et al., 2013). On the opposite, water refills the elastic tissues when the conditions are inverted.
This mechanism has been used to explain the daily shrinkage and swelling observed in summer, known as the diel SDV cycle (Zweifel et al., 2001; Gall et al., 2002) and to quantify trees' water deficit (TWD) as observed during extended drought periods (Zweifel et al., 2005; Oberhuber et al., 2015; Brinkmann et al., 2016; Barraclough et al., 2020). Consequently, SDV have often been used to model radial water movements in trees (Hölttä et al., 2006; Mencuccini et al., 2013, 2017; Chan et al., 2016), to assess trees' physiological drought (e.g., Mart́ınez-Sancho et al., 2022), and to compare the impact of recent heat waves across species and space (e.g., Salomón et al., 2022).
However, these SDV-based models have been challenged by observations showing that SDV are not only related to tree-internal water use but also to the hygroscopic properties of the dead tissues of the outer phloem and bark (Lövdahl and Odin, 1992; Herzog et al., 1995; Gall et al., 2002). Even a few millimeters of dead bark in Scots pine (Pinus sylvestris) evoked important hygroscopic responses (Oberhuber et al., 2020) to relative humidity (RH) that differs in relation with total bark bulk density and porosity (Ilek et al., 2021). Hygroscopic responses have also been observed on the phloem of Norway spruce (Picea abies), probably due to the presence of dead cells in the non-conductive phloem (Gall et al., 2002). Thus, to minimize this bias, dendrometers are usually placed on the stem after removing the dead bark (Zweifel and Häsler, 2000; Turcotte et al., 2011; Oberhuber et al., 2014; Jiang et al., 2015), however with differing impact depending on: the removal success (Oberhuber et al., 2020); the species; bark, phloem and wood anatomical structure (Gall et al., 2002); and the growth rate (Zweifel et al., 2014). Moreover, as the inner structure of the bark and the proportion of living and dead bark will change over the course of a tree's life, the hygroscopic effect might vary along with age in the same individual (Krogell et al., 2012).
These considerations may pose a real challenge to the use of SDV-based models and are often not fully addressed in ecophysiological studies. The assessment of potential hygroscopic effects is especially important for big datasets in which each tree is susceptible to express different levels of hygroscopic responses. In this study we aim to provide an analytical approach to quantify and remove the impact of bark hygroscopicity on the diel SDV cycle, at the level of individual trees. The study is based on trees of both Picea abies and Larix decidua that have been equipped with automatic point dendrometers. We achieved this in two steps. First, we assessed the extent of hygroscopicity within the dataset by comparing SDV and relative humidity at different time scales and for different seasons. Hygroscopicity detection was based on the following assumptions: (1) During the cold season, when transpiration is reduced or inactive and water-related SDV are minimal, important SDV and SDV-RH correlation are signs of hygroscopicity; (2) The SDV-RH correlation coefficient is strongly associated with hygroscopicity (Oberhuber et al., 2020). Therefore a high variance for this coefficient must reflect different levels of hygroscopicity; (3) The amplitudes of the diel SDV cycles are also associated with hygroscopicity (Oberhuber et al., 2020). Therefore, they must be correlated to the SDV-RH correlation coefficient and a high variance for this variable must also reflect different levels of hygroscopicity.
Secondly, we developed a simple model to quantify the hygroscopic effect. This model was based on the hypothesis that diel SDV amplitudes (SDVAmpl) are proportional to transpiration and hygroscopicity, where the latter is in turn proportional to a change in RH. We therefore fitted a linear model for each tree, expressing diel SDVAmpl as a linear combination of transpiration and diel RH amplitudes. We used the latter term as a measure of the hygroscopic effect, allowing us to apply a correction to SDVAmpl.
2. Materials and methods
2.1. Study site
SDV were measured at the Lötschental tree-growth monitoring transect (Moser et al., 2010; King G. et al., 2013; King G. M. et al., 2013), which consists of 8 sites dispersed along two elevational transects of 900 meters (Figure 1) located in the Lötschental valley, Switzerland. An additional site is located just outside the valley at a lower altitude. At each site, four trees (sometimes 6) of both P. abies and L. decidua are equipped with point dendrometers. The Lötschental valley is a temperate alpine forest with a mean annual temperature of 5.7°C and a mean annual precipitation of 825 mm (King G. et al., 2013).
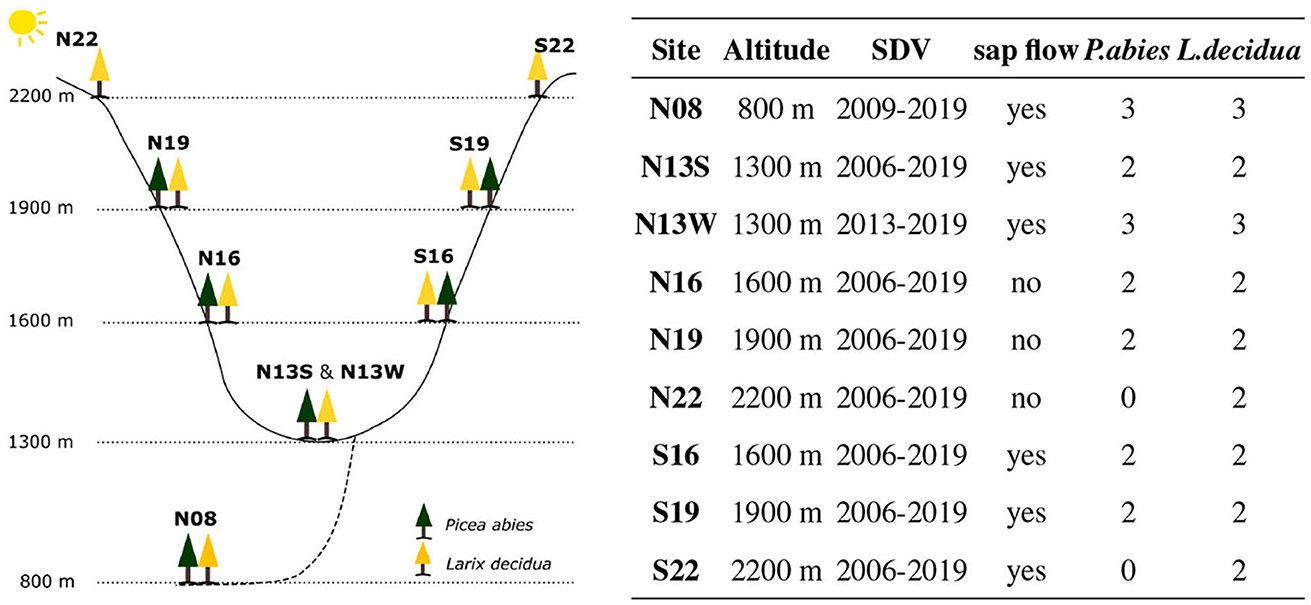
Figure 1. The sites and their placement on the Lötschental tree growth monitoring transect. Note that N08 and N13W were installed later.
2.2. Data collection and processing
SDV were obtained using high-resolution point dendrometers (Radius dendrometer, DR series, Ecomatik, Germany) mounted at about 1.5 m stem height after bark removal and with a measurement frequency of 15 min from the end of 2006 to 2019 (except for trees at two sites which were instrumented in 2008 and 2013). Trees were also equipped with a Granier's Thermal Dissipation Probe (TDP) providing readings at a 15 min rate from 2012 to 2019 from April to November, with the exception of the trees at N22, N19, and N16 (Figure 1). Additionally, each site was equipped to monitor important microclimatic variables as stem temperature (with a Onset Tibit logger located in proximity to the dendrometer, 15' frequency, 2012–2019), air temperature and relative humidity (with a Hobo T-RH logger located beneath the canopy, 15', 2008–2019), as well as soil temperature and soil matrix potential (with Decagon MPS sensor located at a depth of 10 cm in the soil, 60', 2006–2019). The analyses of this study were performed using air temperature measurements. The few gaps in the time series were filled using the stem temperature measurements when available, as they consistently showed almost identical values. The SDV time series were cleaned by removing obvious outliers and abrupt changes linked to dendrometer readjustment on the stem (see Krogell et al., 2012) whereas TDP time-series were processed using the TREX R package (Peters et al., 2021) to obtain sapflux density according to the “predawn” method (see Peters et al., 2018). Before performing further analyses, all the timeseries including the environmental variables were quality checked.
2.3. Data analysis
2.3.1. Hygroscopicity detection in winter
Hygroscopic detection in winter was performed by analyzing the correlation between SDV and RH outside of freeze-thaw cycles. Freeze-thaw cycles are characterized by a very abrupt contraction during the freezing of the apoplastic water and decontraction upon thawing, masking any relation between SDV and RH (Figure 2). They were detected using both temperature and time thresholds. The temperature thresholds relates to the temperature where freezing and thawing are susceptible to occur. They were set at −5 and 0°C, which corresponds to the freezing and thawing temperature of apoplastic water, respectively (Zweifel and Häsler, 2000; King G. et al., 2013). The time threshold relates to the time necessary for both freezing and thawing to occur under their respective conditions. A time threshold of 12 h was used for both freezing and thawing in order to capture only the most significant freeze-thaw events.
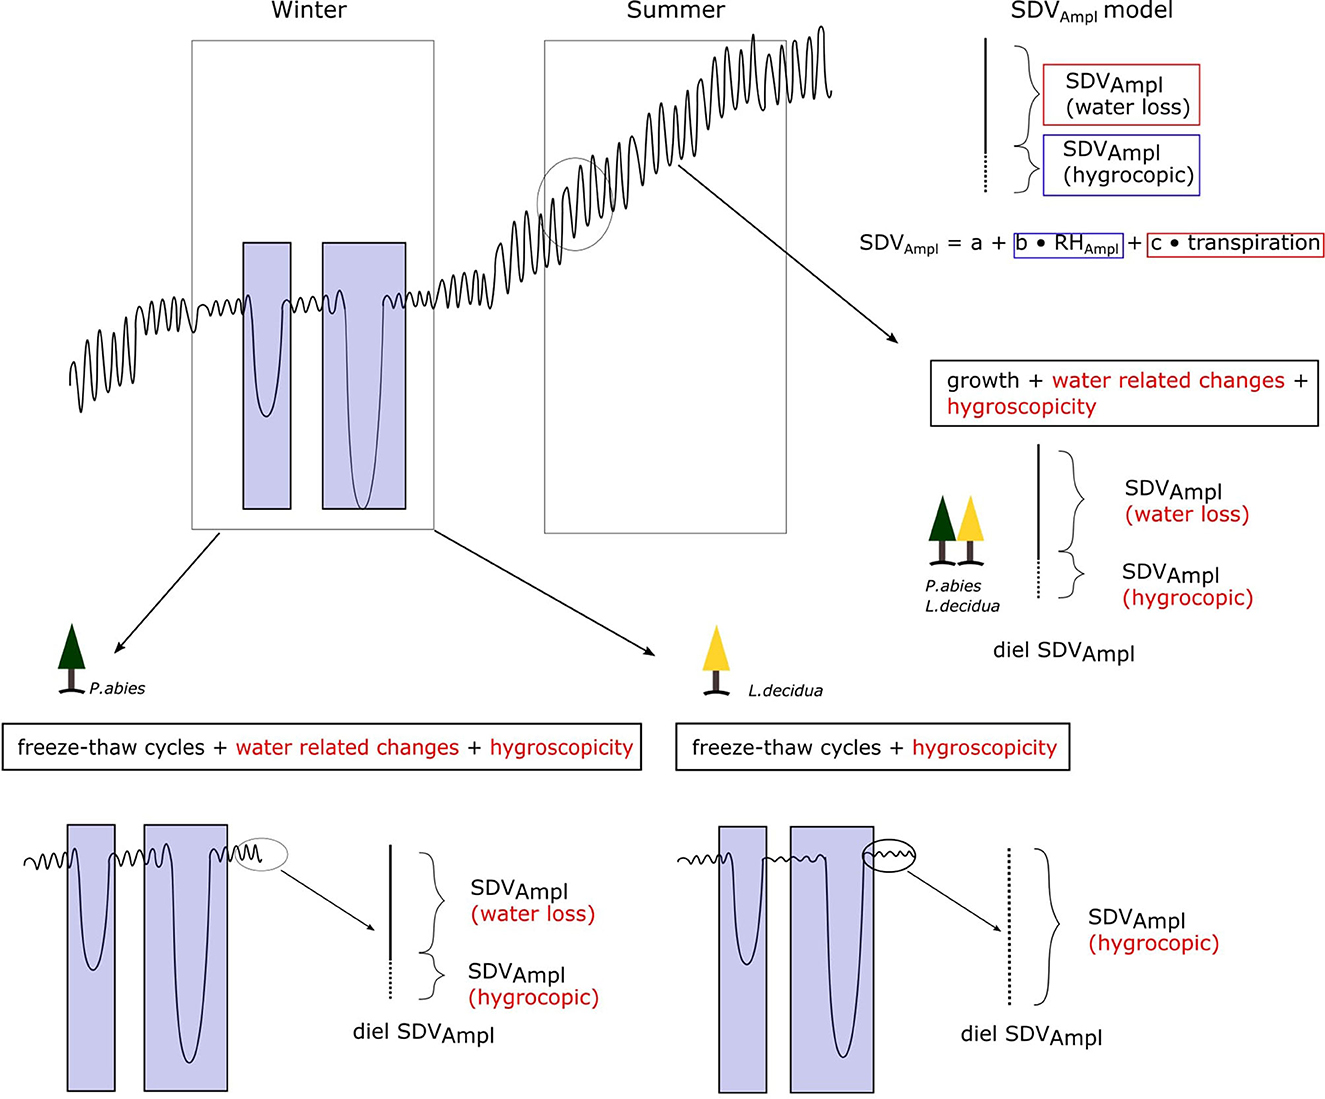
Figure 2. Conceptual representation of SDV with its drivers for a whole year. The text in the black boxes indicates the factors driving SDV for each season. The factors in red are those influencing the diel SDV amplitudes. Blue boxes indicates freeze-thaw cycles. Note that the cold season is expected to be different between the two species as L. decidua has lost its needle and water related SDV are expected to be null. During that time, outside of freeze-thaw cycles, SDV (and therefore the diel SDV cycle) are expected to be solely driven by hygroscopicity. The diel SDV amplitudes model is shown on the top right panel.
Then, the RH and SDV curves were compared during the cold season, between November and June. We first compared the general trend of both SDV and RH during the whole season and then selected a freeze-thaw free period to perform a correlation between RH and SDV. The correlation between RH and SDV was then calculated for the freeze-thaw free period using detrended SDV (to account for the potential interference of cellular growth). Longer term trends for both RH and SDV were derived using Fast Fourier Transform (FFT) (R package itsmr, Weigt, 2022), and by applying a low pass filter, cutting the frequencies above a given threshold. The thresholds were set to 0.9% for the whole cold season and 5% for the rest of the analysis. SDV detrending was performed using the R package pracma (Borchers, 2022) by subtracting the linear trend computed based on the least-squared fit. The SDV-RH correlation was finally determined as the maximum value of a cross correlation analysis with a maximum interval of 12 h in order to account for the lagging nature between SDV and RH.
2.3.2. Hygroscopicity detection in summer and diel amplitudes
To further assess the extent of hygroscopicity in the data set, we analyzed the relation between SDV and RH during the warm season (June, July, and August). We used both the SDV-RH correlation coefficient and the ratio of the amplitudes of the diel cycles (SDVAmpl : RHAmpl) as proxies of hygroscopicity (Figure 3). The SDV-RH correlation coefficient was determined as the maximum correlation coefficient of a cross correlation within a time window of 72 h, in order to account for potential lagging effects between the two time series. The diel amplitudes were extracted from SDV or RH time series as the difference between the maximum and the minimum daily values. To do that, daily peaks and valleys were identified. The highest peak (maximum) was then compared to the lowest valley (minimum). In the diel SDV cycle, the maximum occurs first (usually in the early morning) and the minimum occurs later (usually in the evening). In order to avoid measuring amplitudes in days where the diel cycle is not properly defined, we discarded amplitudes not respecting this order.
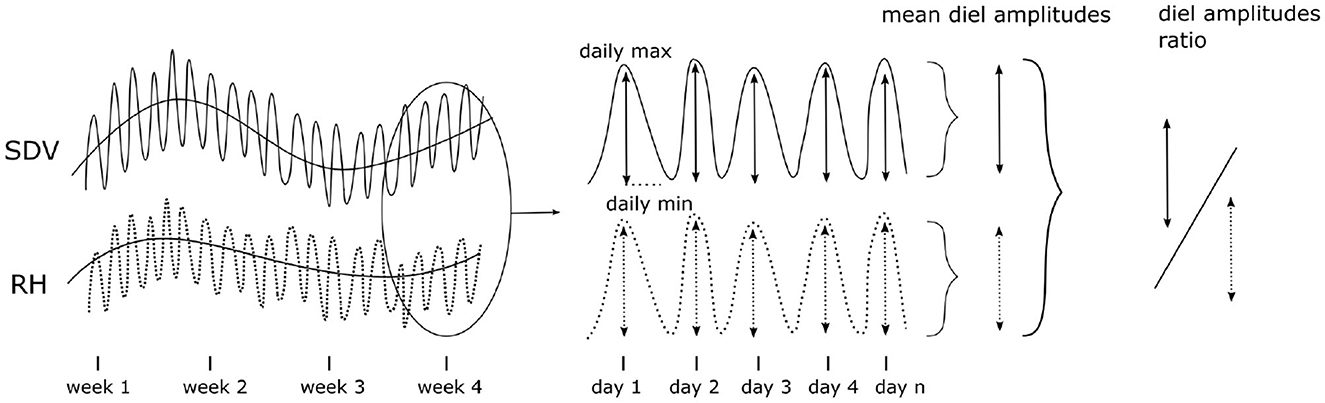
Figure 3. Hygroscopicity affects SDV and can be detected at different time scales, ranging from a long term coupling of SDV and RH to the diel SDV cycle. In this study, we used both long term SDV-RH correlations and the ratio between the diel cycles amplitudes as proxies of hygroscopicity based on the hypothesis that a high variance for these two variables must reflect different levels of hygroscopicity.
We also compared the ratio SDVAmpl : RHAmpl to tree diameter and annual growth to test if the quantity of newly formed and/or older tissues has an impact on the diel SDV cycle.
2.3.3. SDV amplitudes modeling
To derive the portion of SDVAmpl that is under the influence of the hygroscopic effect, we fitted linear models for each tree, where SDVAmpl is expressed as function of RHAmpl as well as transpiration (Table 1). These models are based on the assumption that the hygroscopic effect is proportional to RHAmpl.
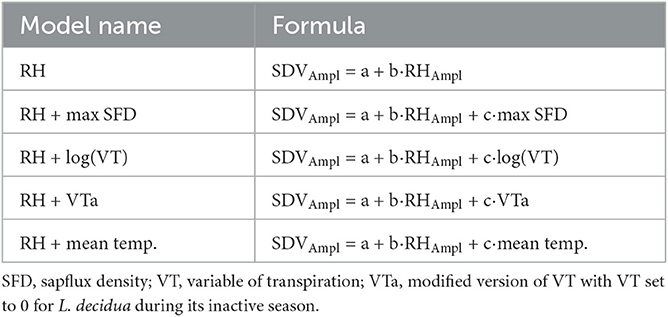
Table 1. The different models fitted to the SDVAmpl of the individual trees.
Transpiration was estimated using three different variables: diel maximum sapflux density (max SFD), the diel mean temperature, and the variable of transpiration (VT). Max SFD is the daily max value of SFD. The diel mean temperature is the mean temperature between the highest point (peak) and the lowest point (valley) of the SDV diel cycle. VT is an integrated variable including both daily solar radiation Rs and VPD and has been used as a proxy for transpiration (Kakubari and Hoskawa, 1992; Du et al., 2011). It was calculated on a daily basis using the daily mean VPD (dVPD) and the equation :
Daily solar radiations were modeled using the Annandale model which is derived from the Hargreaves and Samani model and corrected for altitude (Annandale et al., 2002) :
With Ra being the extraterrestrial radiation; Tmin and Tmax, the maximum and minimum daily air temperature; Z, the average altitude above sea level; Amod, an empirical argument set to 0.263 (Suwarno and Rohana, 2017).
We also used a modified version of VT, VTa, where VT was set to 0 for L. decidua during its inactive period (see below), in order to account for the needle loss.
Since L. decidua's transpiration is severely limited in winter due to needle loss, we determined the transpiration active and inactive season of L. decidua trees. We used both phenological observations in situ and sap flow data to set the time span of the inactive period. Specifically, it is bordered by two phenological observations : a 100% yellowing of needles at its start and the first observation of budbreak at its end. These phenological observations were adjusted with sapflow data when available to ensure that transpiration is effectively shut down between the two events.
In the study, the inactive season is also referred to P. abies for the sole purpose of comparing SDV between the two species during that specific time period. Therefore, it does not relate to any phenological and/or physiological change in P. abies.
The linear models were created using all the data points available for each tree (with a minimum of 150 data points). Both the normality and homoscedasticity of the residuals were tested for each tree. Some slight deviations were observed, but were judged as acceptable.
2.3.4. SDV correction
The linear models were finally used to apply a correction to the mean SDVAmpl. The hygroscopic effect to any given change in relative humidity (ΔRH) is calculated using the hygroscopic component of the SDV modeling equation : ΔRH and the relative humidity slope (b) (Figure 2):
In the case of mean SDVAmpl (see Figure 2) :
Corrections were applied to the mean SDVAmpl of each tree in the data set, using all the data points available for each (all years combined).
3. Results
3.1. SDV behavior in winter
In general, the relationship between stem diameter variations (SDV) and relative humidity (RH) is strongly variable among trees. This is exemplary shown for two L. decidua trees in Figure 4. The first tree (Figure 4A) shows a pattern of important SDV in winter along with a strong SDV-RH relation, resulting in a high correlation coefficient in short and long term (Figures 4A, B). The correlation is still important from march to mid-April, when the soil temperature at 10 cm was slightly below 0° C (indicated by the gray boxes) (Figures 4B, C). Ten days rolling correlation profile shows a high overall SDV-RH correlation with only a slight decrease from summer to winter. The second tree (Figure 4B) does not show important SDV in winter outside of the frost-thaw events, with a maximum range of about 100 μm between March and May (compared to 400 μm for the previous tree; Figures 4A, B). The correlation between SDV and RH in late winter/early spring (March to mid-April) is low (Figures 4B, C), even though soil temperature never reached sub-zero temperature. Yearly rolling correlation shows an overall smaller SDV-RH correlation, characterized by a sharper decrease from summer to winter (Figure 4C).
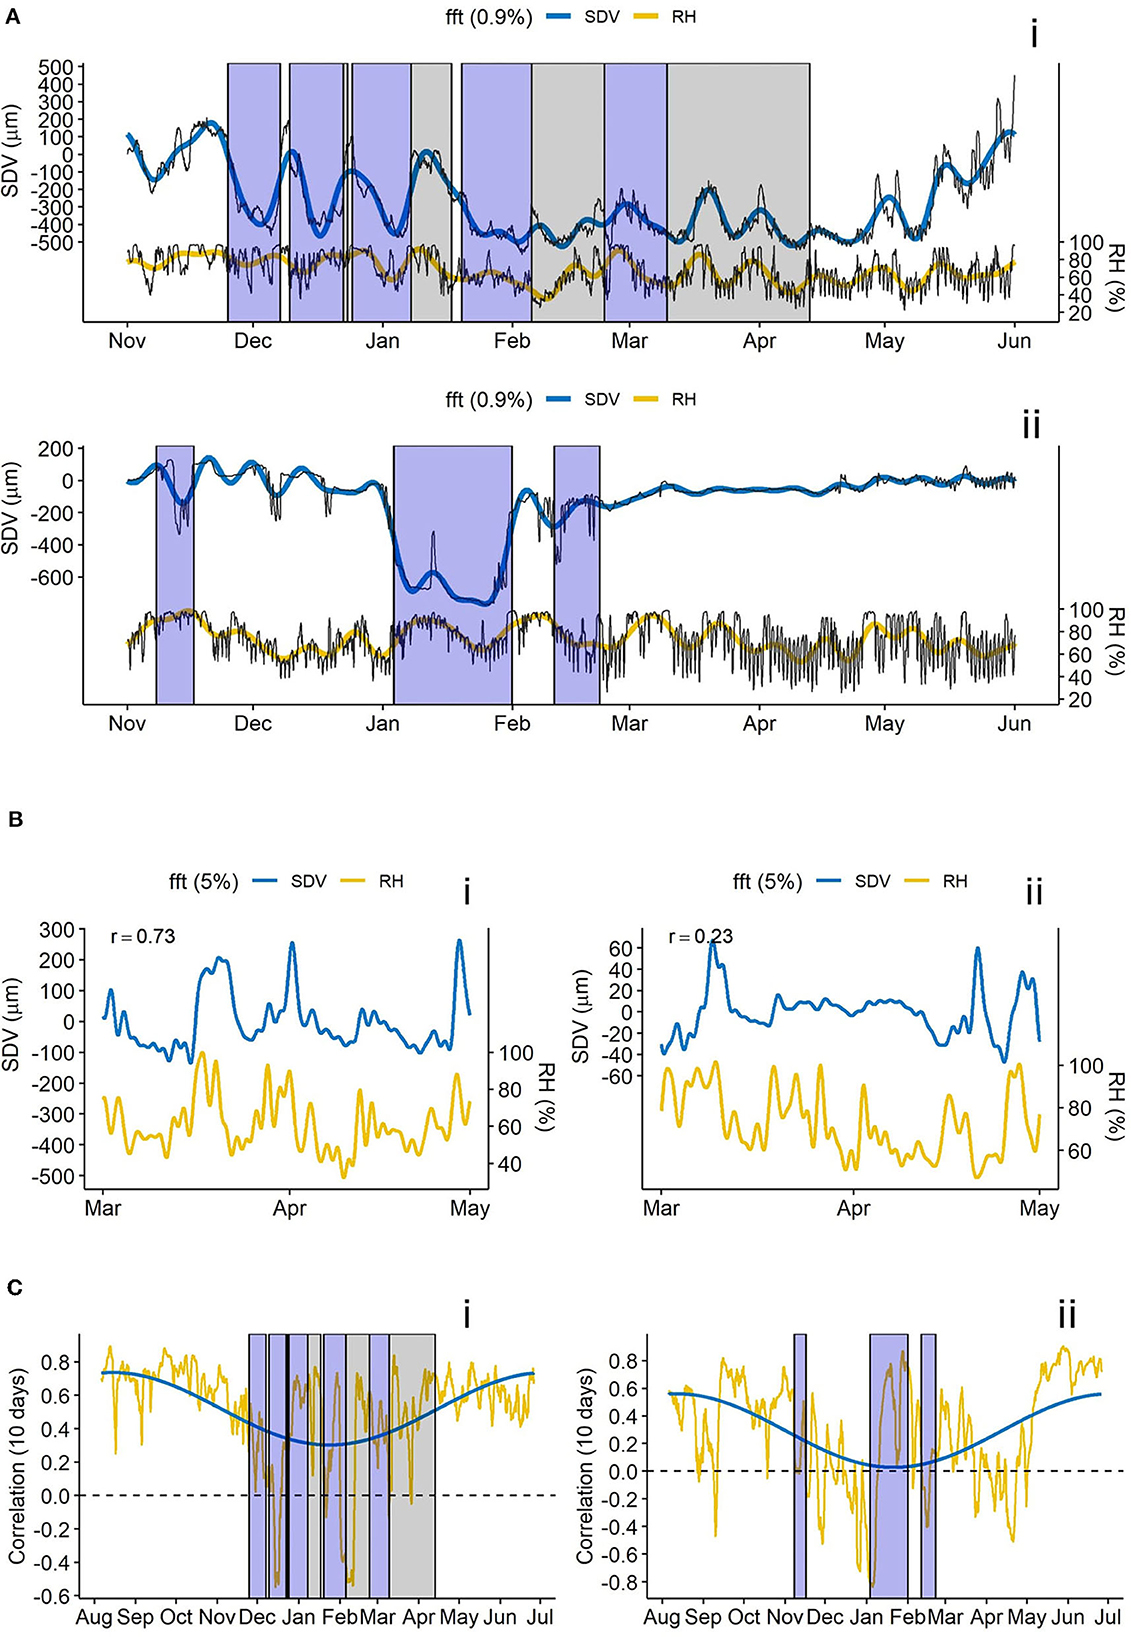
Figure 4. SDV - RH relations of the trees N16Ad_L2p (i = L. decidua, in 2010 - 2011) and N13Bd_L2p (ii = L. decidua in 2016–2017). (A) SDV and relative humidity with long term trend (fft, low pass filter of 0.9%). Blue boxes indicate freeze-thaw events, gray boxes indicate negative soil temperatures. (B) Detrended SDV fft and relative humidity fft (low pass filter of 5%). (C) 10 days rolling correlation for a year between SDV and relative humidity. Blue line shows the long term trend of the correlation (fft, low pass filter of 0.5%).
3.2. Diel SDV amplitudes and correlation
Mean diel SDV amplitudes (mean SDVAmpl) ranged between 50 and 200 μm in the data set (Figure 5A). The SDV-RH correlation coeffcients showed a clearly increasing trend with increasing mean SDVAmpl (Figure 5A). Furthermore, we found a clear linear relation between the ratio mean SDVAmpl : mean RHAmpl and SDV-RH correlation (Figure 5B). Mean SDVAmpl were not related to morphological variables like tree diameter (DBH) and/or annual growth (Figures 5C, D).
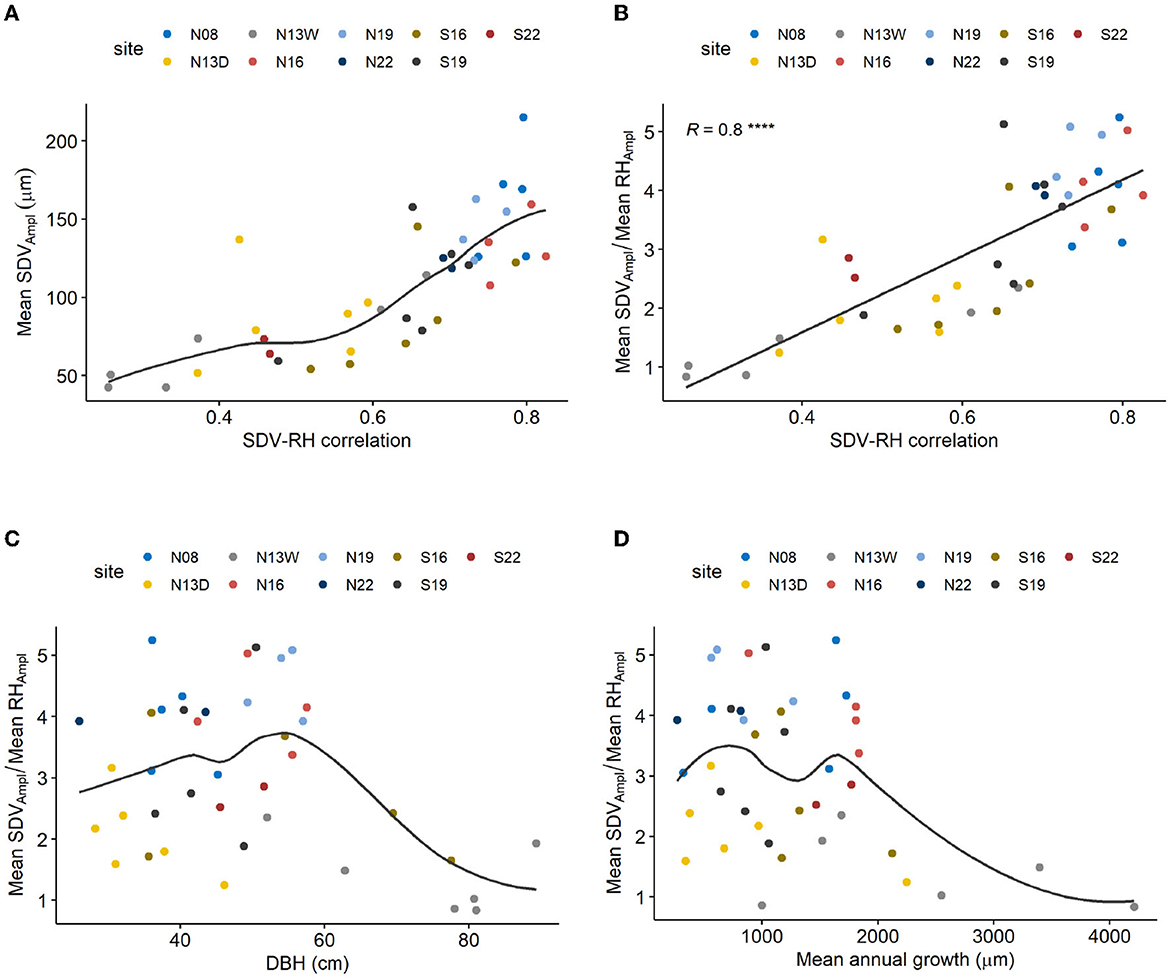
Figure 5. (A) Relation between mean SDV amplitude and SDV-RH correlation. Line shows Loess regression. (B) Relation between the ratio mean diel SDVAmpl : diel RHAmpl and SDV-RH correlation. Line shows linear regression (****P < 0.0001). (C) Relation between mean SDV amplitude and tree diameter (DBH). Line shows Loess regression. (D) Relation between mean SDV amplitude and mean annual growth. Line shows Loess regression. Mean diel SDVAmpl. SDV-RH correlation were calculated for the summer months (June to August).
3.3. Diel SDV amplitude modeling and hygroscopic effect
Overall, there is a clear relation between SDVAmpl and RHAmpl, but with significant differences in terms of season, species and altitude.For L. decidua, the inactivation of transpiration has a clear effect on the correlation between SDVAmpl and RHAmpl (Figures 6A, B). By adding transpiration variables, the linear models for SDVAmpl as function of RHAmpl could be distinctly improved (Figure 7). VT and diel mean temperature resulted in highest R2-values. The difference between high and low altitude trees in the RH model was drastically reduced by adding VT or diel mean temperature to the model.
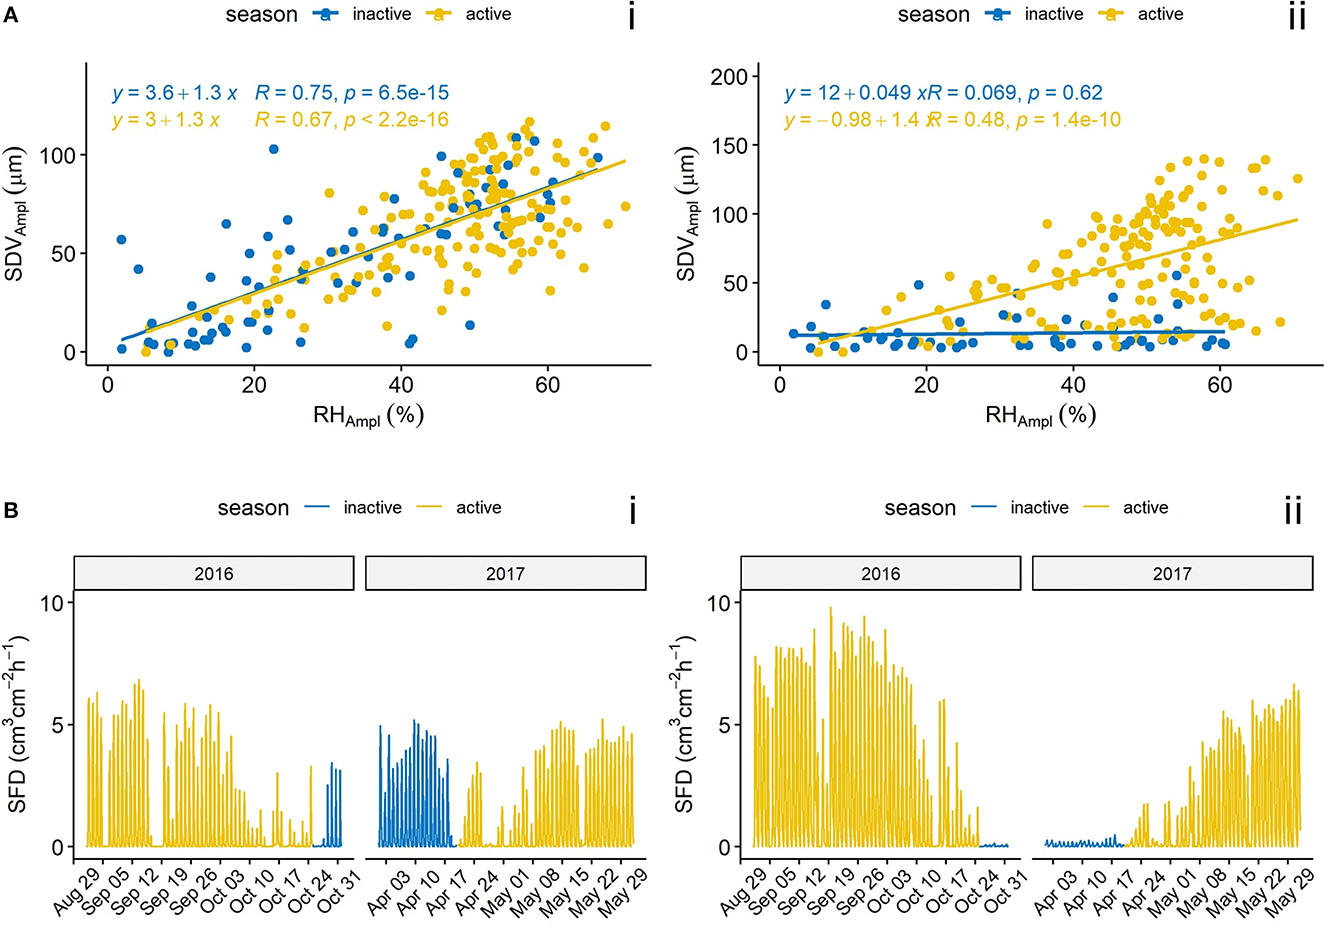
Figure 6. (A) Relation between the SDVAmpl and RHAmpl for the trees N13Wd_S2p (i, P. abies) and N13Wd_L2p (ii, L. decidua) during the winter of 2016–2017. (B) Sapflux density for the corresponding seasons. The inactive season was defined as the time period during which L. decidua is not transpiring (see section 2.3.3). R indicates Pearson correlation coefficient.
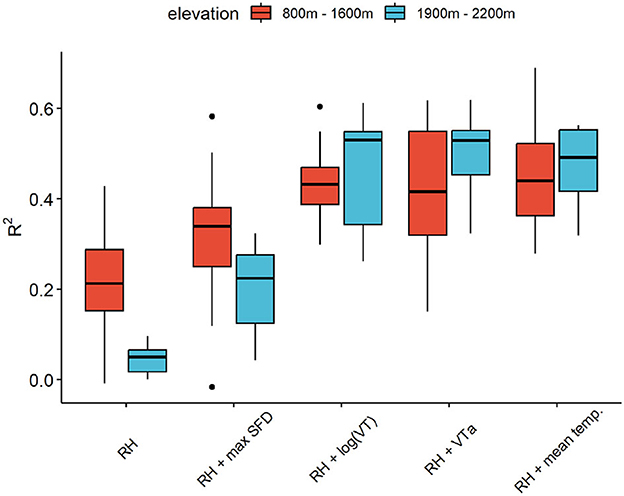
Figure 7. R2 of the different linear models for SDVAmpl (see Table 1) for high (red) and low (blue) altitude trees.
The residuals of the models tend to exhibit seasonal trends, with a dominance of positive values in summer and negative values in winter (Supplementary Figure 2). This tendency was especially pronounced for L. decidua in the RH model. Transpiration variables, except for log(VT), were able to reduce both the temporal and the inter-specific differences. Overall, both VTa and diel mean temperature models showed the best performance. Their b coefficients are shown in Supplementary Table 1 (Supplementary material) and tend to be very similar.
3.4. Mean diel SDV amplitudes correction
Applying the hygroscopic correction clearly reduced the mean SDVAmpl and its variance among trees, similarly for both species (Figures 8A, B). The modeled hygroscopic effect shows a linear relation with the SDVAmpl - RHAmpl ratio (Figure 9).
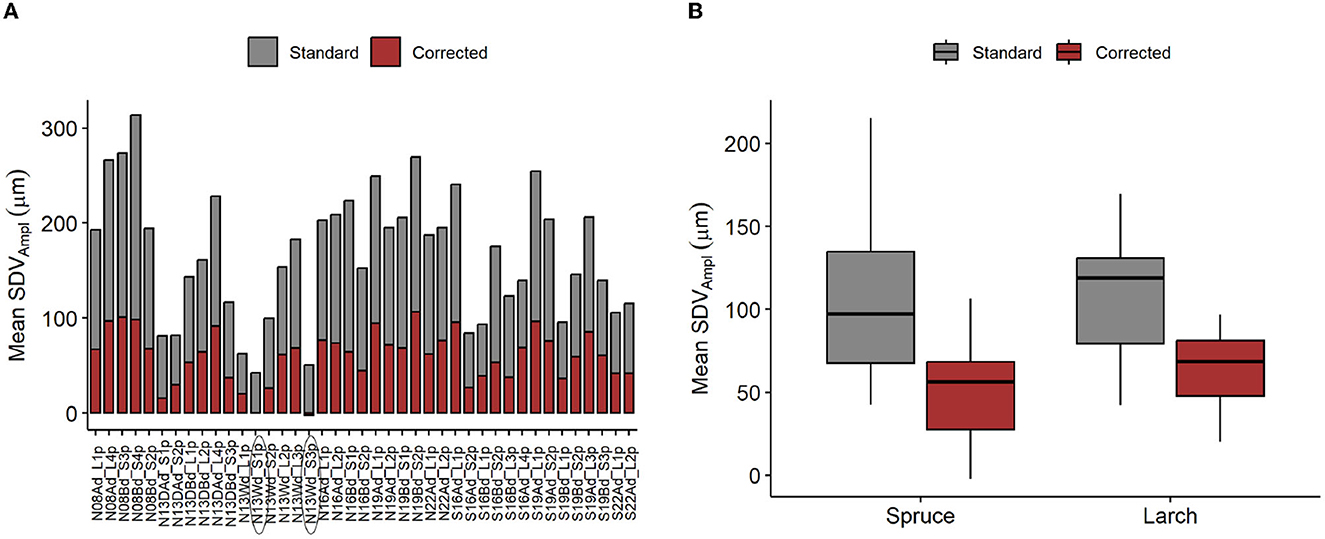
Figure 8. Applied correction of SDV amplitudes. (A) Mean SDVAmpl for individual tree, with and without correction. (B) Distribution of the mean SDVAmpl. Mean SDVAmpl are corrected by removing the hygroscopic effect, modeled using the mean diel RHAmpl and the RH + mean temp. model (Table 1). Problematic individuals are encircled.
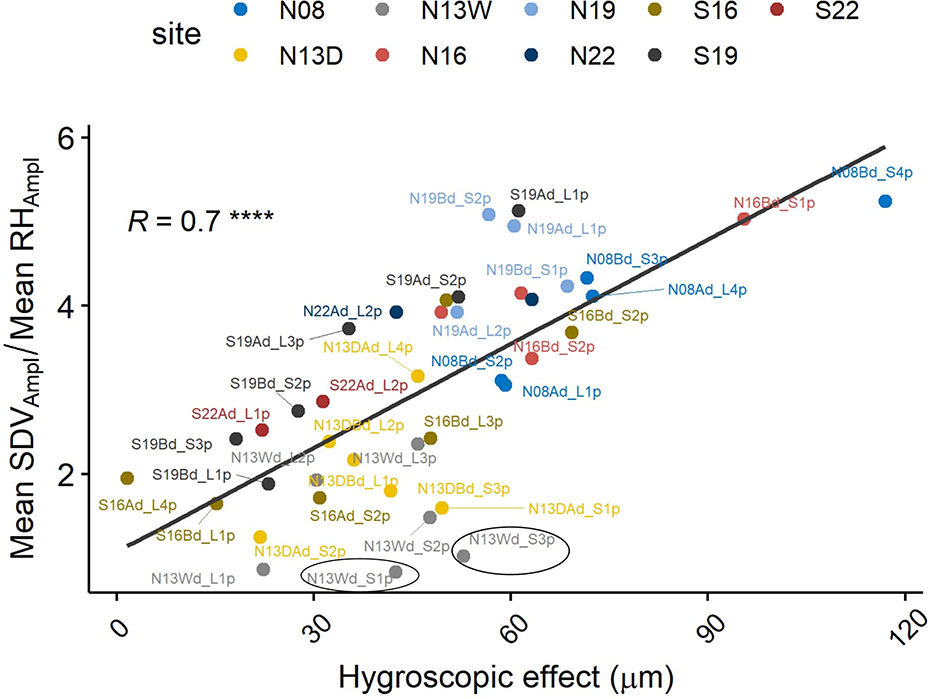
Figure 9. Mean SDVAmpl/mean RHAmpl ratio in relation to the modeled hygroscopic effect (****P < 0.0001). Problematic individuals are encircled.
4. Discussion
4.1. SDV in winter and hygroscopicity
Winter proves to be an interesting season to diagnose hygroscopicity, because water related SDV are reduced (Lyu et al., 2020). In L. decidua's case, at high altitudes, water related changes should be close to zero because stomatal transpiration does not occur, and water uptake is also severely reduced upon negative soil temperature (Mayr et al., 2012; Lv et al., 2013). Despite having limited access to sapflux data in winter, they were clear signs of total inactivation of sapflux at the time of needle loss, supporting that no transpiration occurs in winter (Figure 6B). Moreover, sapflux inactivation in winter has been reported with closely related species (Urban et al., 2019).
In this context, SDV should only be shaped by the frost-thaw cycles and hygroscopic related changes. Important SDV during winter, outside the frost-thaw periods is therefore a sign of hygroscopicity. The first L. decidua presented in this study exhibited such a behavior (Figure 4A). Therefore, we concluded that hygroscopic effects are an important contributor of SDV for this tree.
Oppositely, the second L. decidua follows a SDV pattern that is closer to what is expected in winter, without hygroscopic effect (Figure 4A). To be noted that the soil temperature never reached subfreezing temperatures, indicating that water uptake might not have been impaired and therefore water related SDV might have been more important than for the previous tree. We therefore concluded that hygroscopic effects are not an important contributor of SDV for this tree.
These two trees are located at both end of the spectrum of SDV behavior in winter at the Lötschental transect. They illustrate well the high variability of hygroscopic effects we may encounter in a big dataset. In the context of this study, many trees are exhibiting signs of hygroscopicity. We suggest therefore that assessing SDV behavior in winter might be a good way to detect hygroscopicity related SDV.
4.2. Diel SDV amplitudes and hygroscopicity
The correlation coefficient between SDV and relative humidity is a good indicator of hygroscopicity (Lövdahl and Odin, 1992; Oberhuber et al., 2020). In summer, apart from hygroscopicity, SDV express a certain degree of correlation with RH, because relative humidity is associated with the vapor pressure deficit, which is an important driver of transpiration (Zweifel et al., 2005; Lyu et al., 2020) (Figure 6). But this correlation is expected to be lower than when induced by hygroscopicity. This is made apparent in our results by comparing yearly correlation profiles of trees (Figure 4C). Therefore high and consistent correlations between SDV and RH obtained are signs of strong hygroscopic effects. Our results indicate that the ratio SDVAmpl : RHampl is a good proxy for the SDV-RH correlation and therefore hygroscopicity (Figure 5A). It is interesting to note that the ratio SDVAmpl : RHampl are not related to either DBH or annual growth. If water related SDV are induced by the contraction/expansion of the elastic tissues of the living bark in response to its water content (Zweifel et al., 2000), one could expect a relation with these variables. Moreover, the variance of the ratio SDVAmpl : RHampl is similar for both species. Altogether, It suggests that most of the variance of the mean SDVAmpl between individuals is influenced by the hygroscopic effect and not by water related SDV. This is on par with previous results that showed that the hygroscopic effect can be much more important than and therefore mask water related SDV (Lövdahl and Odin, 1992; Oberhuber et al., 2020). The different levels of the hygroscopic effect are, in turn, probably related to differences in the extent of dead bark removal, prior to dendrometer installation.
We suggest that comparing SDVAmpl is valuable diagnostic tool in regards to hygroscopicity. Very high variations in SDVAmpl among individuals are likely to be caused by the hygroscopic effect and should be addressed in studies using large data sets.
4.3. Relative humidity and transpiration influences on diel SDV
The comparison between SDVAmpl and RHAmpl indicates that transpiration is an important contributor of SDV. Indeed, under the hypothesis that the diel SDV cycle is shaped by relative humidity changes only (Gall et al., 2002), we would not observe the seasonal pattern for L. decidua that is concomitant with the activation/inactivation of transpiration (Figure 6A). This result is in agreement with the phloem water capacitance model, stating that SDV are driven by the dehydration of the living bark tissues to cover the evaporative demand of the tree (Zweifel et al., 2001).
It indicates that both relative humidity and transpiration are contributors of SDV in our dataset. As the transpiration variables and RHAmpl are independent (Supplementary Figure 1C), we suggest that the relation between RHAmpl and SDVAmpl at the point of no transpiration is equivalent to the hygroscopic effect. Following this hypothesis, the linear regression between diel SDV and diel RH amplitudes for L. decidua during the inactive season is a close approximation of the hygroscopic effect because no transpiration is detected during that time and therefore no water related SDV are occurring.
4.4. Plausability of the model
It is evident that a simple linear relationship between SDVAmpl and RHAmpl is not a sufficiently good estimation of the hygroscopic effect, as SDVAmpl are also driven by transpiration. This is also apparent in the seasonal distribution of the residuals of the linear regression between SDVAmpl and RHAmpl (Supplementary Figure 2). This model is underestimating the summer amplitudes, when transpiration is high, and overestimating the winter amplitudes when transpiration is low. This effect is noticeably stronger for L. decidua, because this species expresses a greater seasonal difference in transpiration levels. During the inactive season of L. decidua the situation is different because no transpiration is detected, and water related SDV are therefore expected to be null. In that time period, the relation between SDVAmpl and RHAmpl must account for the hygroscopic effect only. Following this idea, the hygroscopic effect can be quantified for L. decidua during its inactive season. However, the prevalence of freeze-thaw cycles and the lack of data points makes it difficult in practice, resulting in very poor R2. Moreover, this approach would not work for P. abies since for this evergreen species transpiration occurs throughout the year. The purpose of adding a transpiration variable to the model was to ensure that the coefficient b RHAmpl would be representative of the hygroscopic effect. The whole plausibility of the model relies on the fact that the underlying effect of transpiration on SDVAmpl is successfully taken into account in the model. There are indications that this is the case. Firstly, the seasonal distribution of the residuals of the model and the differences among species are drastically reduced (Supplementary Figure 2). Secondly, the difference in R2 between low and high altitudes sites has been drastically reduced or removed by adding transpiration to the models (Figure 7). The difference in R2 is likely related to the fact that the range of transpiration values is larger at higher altitudes (with longer periods of total absence of transpiration). The added variance is not explained by the RH only model. Therefore, reducing these differences is an indication that the transpiration has been successfully taken into account. Thirdly, the corrected mean SDVAmpl shows a noticeable lower variance than the non-corrected version (Figure 8B). We postulated that hygroscopic effects are an important contributor to summer oscillation variance between trees. The decrease in variance points therefore to a reduction of the hygroscopic effect. Together, these are good indications that the model is plausible and can be used for both species to derive the hygroscopic effect.
4.5. Model performance and intended usage
Of all the linear models, both VTa and mean temp. seem to perform better than max SFD (Figure 7). This result is surprising as SFD is a more direct measure of transpiration. The transpiration data set, however, presented noticeable imprecisions, but no cleaning was performed in this study. Both, the VTa and the mean. temp based model presented very similar coefficients for the intercept and the relative humidity slope for many trees, but we chose to keep the mean temp. model based on slightly better performance.
In this model, the seasonal differences of the distribution of the residuals are reduced but not completely evened out, meaning that some temporal correlation remains (Supplementary Figure 2). Residuals in winter tend not only to be on the negative side but also to express less variation, causing heteroscedasticity, noticeable between the lower values of the winter oscillations and the typical higher summer oscillations residuals. In this context, heteroscedasticity means that summer oscillations are given more weight in the model. We consider that this does not represent an important issue as the diel SDV amplitudes are more robustly coupled with the diel RH amplitudes in summer. Depending on the relative number of winter data points included in the model, there can also be a slight deviation to the normality of the residuals, especially at the highest and lowest values.
This seasonal imbalance may be due to the effect of several phenomenons. Firstly, it is possible variation in water availability are affecting diel SDVAmpl. In summer, especially during droughts, water uptake would be reduced, inducing higher SDVAmpl for the same amount of transpiration. Secondly, carbon related processes such as leaf photosynthetic activity can affect the amplitude of the phloem water capacitance response (Steppe et al., 2015). Thirdly, the hygroscopic response is slightly temperature dependent (Lövdahl and Odin, 1992). The impact of relative humidity changes on SDV in winter might therefore be slightly smaller compared to summer. All these effects combined are negatively impacting the usability of the model. A few notable imprecisions are present. Firstly the intercept of the linear model should be theoretically around 0, but many trees deviate from that (Supplementary Figure 1 and Supplementary Table 1). Secondly, the model seems to be more limited for a few trees. For instance, the corrected mean SDVAmpl of some individuals are close to zero, or even slightly negative (encircled individuals, Figure 8A). This would make sense if the trees were dead and water related changes would be null. In these cases, it is apparent that the correction is over-evaluated. However, the clear linear relationship between the hygroscopic correction and the ratio SDVAmpl : RHampl is an indication that the correction applied is proportional to the level of hygroscopicity (Figure 9). It indicates that the modeled correction is generally pointing to the right direction despite having individual deviations. If that is the case, one might want to use a correction based on the linear regression expressed in Figure 8B. To establish this approach, we would need more data, preferably from other sites, to test whether there is indeed a universal linear relation between the ratio SDVAmpl : RHampl and hygroscopicity. Experiments could also be done to test this hypothesis. One approach would be to control the amount of bark removal prior to dendrometers installation and test how the dead bark thickness affects the ratio SDVAmpl: RHampl.
Despite the potential issues and imperfections of the models, this approach is, to our knowledge, the first to tackle the issue of hygroscopicity. We suggest that it can be used to quantify the hygroscopic effect of notable water related SDV variables like TWD. TWD is calculated from the contraction of the stem in summer in response to water deficit (Zweifel et al., 2005). It is defined as the amplitude of the SDV contraction after removing the cellular growth. However SDV decrease over long period in summer are often concomitant with decrease in relative humidity due to the more arid conditions provoking the drought. Therefore it is not clear whether the contraction of the stem is linked with water depletion or the hygroscopic effect, if the latter is indeed present in the data. Our models could be used to derive the fraction of the contraction under the influence of the hygroscopic effect, by taking the RHAmpl at the beginning and the end of the SDV decrease on which TWD is derived (Figure 10). Such a correction could help to standardize TWD and allow for a more accurate comparison between individuals.
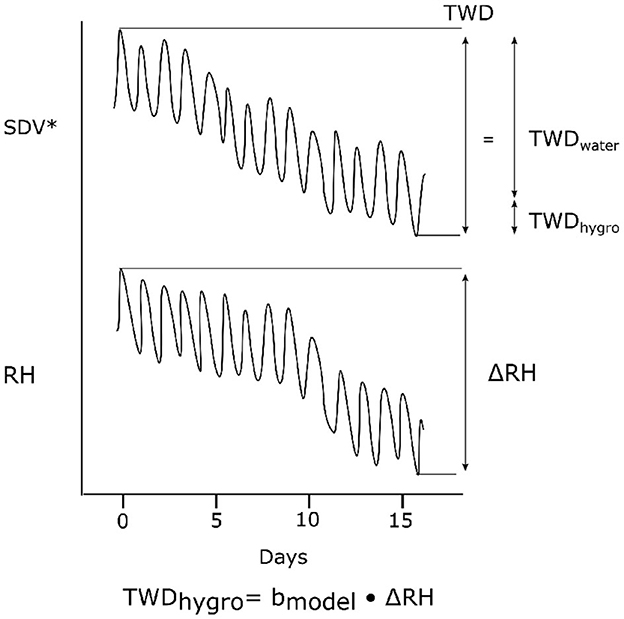
Figure 10. Suggestion of correction for TWD. TWD's amplitude is driven both by net water losses (TWDwater) and hygroscopicity (TWDhygro). TWDhygro can be calculated using the model. SDV* are growth-detrended SDV.
5. Conclusion
The hygroscopic response of the bark can alter the interpretation of SDV in terms of water related changes and studies often consider it to be null with the practice of dead bark removal. In our study, the trees exhibited different levels of hygroscopic response. In winter, except for freeze-thaw events, SDV are mainly shaped by the hygroscopic response of the bark, as water-related changes are minimal. The amplitude of the diel SDV cycle is influenced by transpiration, in agreement with the phloem capacitance hypothesis, and also by relative humidity. The contribution of relative humidity on SDV corresponds to the hygroscopic effect and can be quantified by a simple linear model where diel SDV amplitudes is the response variable and both RH amplitudes and transpiration are the predictors. This kind of model can then be used to calculate the hygroscopic response for a given change in relative humidity. We suggest this model for correcting SDV derived variables used to assess the water balance of a tree.
Data availability statement
The raw data supporting the conclusions of this article will be made available by the authors, without undue reservation.
Author contributions
FD: data analysis and modeling, conceptualization, data visualization, and writing—original draft. PF: conceptualization, methodology, data provision, and writing—review and editing. HL: conceptualization, methodology, and writing—review and editing. CM: supervision, conceptualization, methodology, and writing—review and editing. All authors contributed to the article and approved the submitted version.
Funding
Open access funding by Swiss Federal Institute for Forest, Snow and Landscape Research (WSL). Data collection was funded by the Swiss National Science Foundation projects INTEGRAL (nr, 111859) and LOTFOR (nr, 150205).
Acknowledgments
We thank Christophe Randin (University of Lausanne) for his input in the early phase of the study.
Conflict of interest
The authors declare that the research was conducted in the absence of any commercial or financial relationships that could be construed as a potential conflict of interest.
Publisher's note
All claims expressed in this article are solely those of the authors and do not necessarily represent those of their affiliated organizations, or those of the publisher, the editors and the reviewers. Any product that may be evaluated in this article, or claim that may be made by its manufacturer, is not guaranteed or endorsed by the publisher.
Supplementary material
The Supplementary Material for this article can be found online at: https://www.frontiersin.org/articles/10.3389/ffgc.2023.1167542/full#supplementary-material
References
Annandale, J., Jovanovic, N., Benade, N., and Allen, R. (2002). Software for missing data error analysis of Penman-Monteith reference evapotranspiration. Irrigat. Sci. 21, 57–67. doi: 10.1007/s002710100047
Barraclough, A. D., Cusens, J., Zweifel, R., and Leuzinger, S. (2020). Environmental drivers of stem radius change and heterogeneity of stem radial water storage in the mangrove Avicennia marina (Forssk.) Vierh. Agric. Forest Meteorol. 280, 107764. doi: 10.1016/j.agrformet.2019.107764
Borchers, H. (2022). pracma: Practical Numerical Math Functions. R package version 2.4.2. Available online at: https://CRAN.R-project.org/package=pracma
Brinkmann, N., Eugster, W., Zweifel, R., Buchmann, N., and Kahmen, A. (2016). Temperate tree species show identical response in tree water deficit but different sensitivities in sap flow to summer soil drying. Tree Physiol. 36, 1508–1519. doi: 10.1093/treephys/tpw062
Chan, T., Hölttä, T., Berninger, F., Mäkinen, H., Nöjd, P., Mencuccini, M., et al. (2016). Separating water-potential induced swelling and shrinking from measured radial stem variations reveals a cambial growth and osmotic concentration signal. Plant Cell Environ. 39, 233–244. doi: 10.1111/pce.12541
Corell, M., Girón, I., Galindo, A., Torrecillas, A., Torres-Sánchez, R., Pérez-Pastor, A., et al. (2014). Using band dendrometers in irrigation scheduling. Agric. Water Manage. 142, 29–37. doi: 10.1016/j.agwat.2014.04.005
De Swaef, T., De Schepper, V., Vandegehuchte, M. W., and Steppe, K. (2015). Stem diameter variations as a versatile research tool in ecophysiology. Tree Physiol. 35, 1047–1061. doi: 10.1093/treephys/tpv080
Deslauriers, A., Rossi, S., and Anfodillo, T. (2007). Dendrometer and intra-annual tree growth: what kind of information can be inferred? Dendrochronologia 25, 113–124. doi: 10.1016/j.dendro.2007.05.003
Du, S., Wang, Y.-L., Kume, T., Zhang, J.-G., Otsuki, K., Yamanaka, N., et al. (2011). Sapflow characteristics and climatic responses in three forest species in the semiarid Loess Plateau region of China. Agric. Forest Meteorol. 151, 1–10. doi: 10.1016/j.agrformet.2010.08.011
Epron, D., Kamakura, M., Azuma, W., Dannoura, M., and Kosugi, Y. (2021). Diurnal variations in the thickness of the inner bark of tree trunks in relation to xylem water potential and phloem turgor. Plant Environ. Interact. 2, 112–124. doi: 10.1002/pei3.10045
Gall, R., Landolt, W., Schleppi, P., Michellod, V., and Bucher, J. B. (2002). Water content and bark thickness of Norway spruce (Picea abies) stems: phloem water capacitance and xylem sap flow. Tree Physiol. 22, 613–623. doi: 10.1093/treephys/22.9.613
Herzog, K. M., Häsler, R., and Thum, R. (1995). Diurnal changes in the radius of a subalpine Norway spruce stem: Their relation to the sap flow and their use to estimate transpiration. Trees 10, 94–101.
Hölttä, T., Vesala, T., Sevanto, S., Perämäki, M., and Nikinmaa, E. (2006). Modeling xylem and phloem water flows in trees according to cohesion theory and Münch hypothesis. Trees 20, 67–78. doi: 10.1007/s00468-005-0014-6
Ilek, A., Siegert, C. M., and Wade, A. (2021). Hygroscopic contributions to bark water storage and controls exerted by internal bark structure over water vapor absorption. Trees 35, 831–843. doi: 10.1007/s00468-021-02084-0
Jiang, Y., Wang, B.-Q., Dong, M.-Y., Huang, Y.-M., Wang, M.-C., and Wang, B. (2015). Response of daily stem radial growth of Platycladus orientalis to environmental factors in a semi-arid area of North China. Trees 29, 87–96. doi: 10.1007/s00468-014-1089-8
Kakubari, Y., and Hoskawa, K. (1992). Estimation of stand transpiration of a beech forest based on an eco-physiological computer simulation model and superporometer. J. Jpn. Forest. Soc. 74, 263–272.
King, G., Fonti, P., Nievergelt, D., Büntgen, U., and Frank, D. (2013). Climatic drivers of hourly to yearly tree radius variations along a 6°C natural warming gradient. Agric. Forest Meteorol. 168, 36–46. doi: 10.1016/j.agrformet.2012.08.002
King, G. M., Gugerli, F., Fonti, P., and Frank, D. C. (2013). Tree growth response along an elevational gradient: climate or genetics? Oecologia 173, 1587–1600. doi: 10.1007/s00442-013-2696-6
Klepper, B., Browning, V. D., and Taylor, H. M. (1971). Stem diameter in relation to plant water status. Plant Physiol. 48, 683–685.
Krogell, J., Holmbom, B., Pranovich, A., Hemming, J., and Willför, S. (2012). Extraction and chemical characterization of Norway spruce inner and outer bark. Nordic Pulp Pap. Res. J. 27, 6–17. doi: 10.3183/npprj-2012-27-01-p006-017
Lövdahl, L., and Odin, H. (1992). Diurnal changes in the stem diameter of Norway spruce in relation to relative humidity and air temperature. Trees 6, 245–251.
Lv, G., Hu, W., Kang, Y., Liu, B., Li, L., and Song, J. (2013). Root water uptake model considering soil temperature. J. Hydrol. Eng. 18, 394–400. doi: 10.1061/(ASCE)HE.1943-5584.0000642
Lyu, J., He, Q.-Y., Yang, J., Chen, Q.-W., Cheng, R.-R., Yan, M.-J., et al. (2020). Sap flow characteristics in growing and non-growing seasons in three tree species in the semiarid Loess Plateau region of China. Trees 34, 943–955. doi: 10.1007/s00468-020-01972-1
Martínez-Sancho, E., Treydte, K., Lehmann, M. M., Rigling, A., and Fonti, P. (2022). Drought impacts on tree carbon sequestration and water use–evidence from intra-annual tree-ring characteristics. N. Phytol. 236, 58–70. doi: 10.1111/nph.18224
Mayr, S., Schmid, P., and Beikircher, B. (2012). “Plant water relations in alpine winter,” in Plants in Alpine Regions, ed C. Lütz (Vienna: Springer), 153–162.
Mencuccini, M., Hölttä, T., Sevanto, S., and Nikinmaa, E. (2013). Concurrent measurements of change in the bark and xylem diameters of trees reveal a phloem-generated turgor signal. N. Phytol. 198, 1143–1154. doi: 10.1111/nph.12224
Mencuccini, M., Salmon, Y., Mitchell, P., Hölttä, T., Choat, B., Meir, P., et al. (2017). An empirical method that separates irreversible stem radial growth from bark water content changes in trees: theory and case studies. Plant Cell Environ. 40, 290–303. doi: 10.1111/pce.12863
Moser, L., Fonti, P., Büntgen, U., Esper, J., Luterbacher, J., Franzen, J., et al. (2010). Timing and duration of European larch growing season along altitudinal gradients in the Swiss Alps. Tree Physiol. 30, 225–233. doi: 10.1093/treephys/tpp108
Oberhuber, W., Gruber, A., Kofler, W., and Swidrak, I. (2014). Radial stem growth in response to microclimate and soil moisture in a drought-prone mixed coniferous forest at an inner Alpine site. Eur. J. Forest Res. 133, 467–479. doi: 10.1007/s10342-013-0777-z
Oberhuber, W., Kofler, W., Schuster, R., and Wieser, G. (2015). Environmental effects on stem water deficit in co-occurring conifers exposed to soil dryness. Int. J. Biometeorol. 59, 417–426. doi: 10.1007/s00484-014-0853-1
Oberhuber, W., Sehrt, M., and Kitz, F. (2020). Hygroscopic properties of thin dead outer bark layers strongly influence stem diameter variations on short and long time scales in Scots pine (Pinus sylvestris L.). Agric. Forest Meteorol. 290, 108026. doi: 10.1016/j.agrformet.2020.108026
Peters, R. L., Fonti, P., Frank, D. C., Poyatos, R., Pappas, C., Kahmen, A., et al. (2018). Quantification of uncertainties in conifer sap flow measured with the thermal dissipation method. N. Phytol. 219, 1283–1299. doi: 10.1111/nph.15241
Peters, R. L., Pappas, C., Hurley, A. G., Poyatos, R., Flo, V., Zweifel, R., et al. (2021). Assimilate, process and analyse thermal dissipation sap flow data using the TREX r package. Methods Ecol. Evol. 12, 342–350. doi: 10.1111/2041-210X.13524
Salomón, R. L., Peters, R. L., Zweifel, R., Sass-Klaassen, U. G., Stegehuis, A. I., Smiljanic, M., et al. (2022). The 2018 european heatwave led to stem dehydration but not to consistent growth reductions in forests. Nat. Commun. 13, 1–11. doi: 10.1038/s41467-021-27579-9
Steppe, K., Sterck, F., and Deslauriers, A. (2015). Diel growth dynamics in tree stems: linking anatomy and ecophysiology. Trends Plant Sci. 20, 335–343. doi: 10.1016/j.tplants.2015.03.015
Suwarno, S., and Rohana, R. (2017). Comparison model hargreaves, annandale and new model for estimation of solar radiation in Perlis, Malaysia. Indonesian J. Electric. Eng. Comput. Sci. 6, 286. doi: 10.11591/ijeecs.v6.i2.pp286-293
Turcotte, A., Rossi, S., Deslauriers, A., Krause, C., and Morin, H. (2011). Dynamics of depletion and replenishment of water storage in stem and roots of black spruce measured by dendrometers. Front. Plant Sci. 2, 21. doi: 10.3389/fpls.2011.00021
Urban, J., Rubtsov, A. V., Urban, A. V., Shashkin, A. V., and Benkova, V. E. (2019). Canopy transpiration of a Larix sibirica and Pinus sylvestris forest in central siberia. Agric. Forest Meteorol. 271, 64–72. doi: 10.1016/j.agrformet.2019.02.038
Weigt, G. (2022). itsmr: Time Series Analysis Using the Innovations Algorithm. R package, version 1.09. Available online at: https://CRAN.R-project.org/package=itsmr
Zweifel, R., Drew, D. M., Schweingruber, F., and Downes, G. M. (2014). Xylem as the main origin of stem radius changes in Eucalyptus. Funct. Plant Biol. 41, 520–534. doi: 10.1071/FP13240
Zweifel, R., and Häsler, R. (2000). Frost-induced reversible shrinkage of bark of mature subalpine conifers. Agric. Forest Meteorol. 102, 213–222. doi: 10.1016/S0168-1923(00)00135-0
Zweifel, R., Item, H., and Häsler, R. (2000). Stem radius changes and their relation to stored water in stems of young Norway spruce trees. Trees 15, 50–57. doi: 10.1007/s004680000072
Zweifel, R., Item, H., and Hasler, R. (2001). Link between diurnal stem radius changes and tree water relations. Tree Physiol. 21, 869–877. doi: 10.1093/treephys/21.12-13.869
Keywords: hygroscopic effect, stem diameter variations, Larix decidua, Picea abies, dendrometer, diel SDV cycles
Citation: Delapierre F, Fonti P, Lischke H and Moos C (2023) A method to quantify and account for the hygroscopic effect in stem diameter variations. Front. For. Glob. Change 6:1167542. doi: 10.3389/ffgc.2023.1167542
Received: 16 February 2023; Accepted: 25 May 2023;
Published: 15 June 2023.
Edited by:
Duncan Smith, University of Wisconsin-Madison, United StatesReviewed by:
Maxime Cailleret, Institut National de recherche pour l'agriculture, l'alimentation et l'environnement (INRAE), FranceShalini Oogathoo, Université du Québec à Montréal, Canada
Copyright © 2023 Delapierre, Fonti, Lischke and Moos. This is an open-access article distributed under the terms of the Creative Commons Attribution License (CC BY). The use, distribution or reproduction in other forums is permitted, provided the original author(s) and the copyright owner(s) are credited and that the original publication in this journal is cited, in accordance with accepted academic practice. No use, distribution or reproduction is permitted which does not comply with these terms.
*Correspondence: Patrick Fonti, cGF0cmljay5mb250aUB3c2wuY2g=