 Siuling Cinco-Castro1*
 Jorge Herrera-Silveira1,2,3
 Jorge Luis Montero Muñoz1
 Hector Hernández-Nuñez1Claudia Teutli Hernández2,4
- 1Department of Marine Resources, Center for Research and Advanced Studies of the National Polytechnic Institute (CINVESTAV-Merida Unit), Yucatan, Mexico
- 2Programa Mexicano del Carbono A.C., Texcoco, Estado de México, Mexico
- 3National Coastal Resilience Laboratory, Sisal, Mexico
- 4Escuela Nacional de Estudios Superiores Unidad Mérida, Yucatan, México
Mangroves are coastal ecosystems recognized by their capacity to store organic carbon, even more so than tropical and temperate forests. Therefore, they contribute to the local adaptation and mitigation of climate change. Mangroves have different characteristics that origin mangrove ecological types. There are few studies on mangroves in karstic environments, where there is spatial heterogeneity associated with topography-hydroperiod-nutrient interactions. To estimate the total carbon stock in mangroves and determine whether carbon storage differs according to the mangrove ecological type in a natural protected area in the karstic region of the Yucatan Peninsula (northern Ria Celestun Biosphere Reserve), a study was conducted following the recommendations of the IPCC Good Practice Supplement for wetlands and standardized methods used in mangroves studies around the world. According to the results, mangroves associated with springs, called “petenes” or hammock mangroves, showed higher total ecosystem carbon stock (683.7 Mg C ha–1) than fringe, basin, and dwarf mangrove ecological types (429, 385, and 214 Mg C ha–1, respectively). Above- and below-ground carbon stock was different between mangrove ecological types. Carbon stock variation was related to environmental hydrology variables (flooding level, interstitial water salinity, and redox potential). According to the δ13C analysis from the surface soil, carbon accumulated in mangrove sediments in a karstic scenario is mainly autochthonous and predominantly originates from mangrove leaves. Carbon stock in mangroves in the northern Ria Celestun Biosphere Reserve was 9.7 Tg C, of which 40.7% comes from dwarf mangroves due to their extension. These results could be used as a tool for developing specific management actions at regional or local scales for mangrove restoration and conservation.
1. Introduction
Coastal ecosystems are in the confluence zone between terrestrial and marine environments, essential to human communities for the variety of ecosystem services (ES) they provide (Costanza et al., 1997; Daily, 1997; Millennium Ecosystem Assessment [MEA], 2005). Mangroves have specific adaptations to tolerate salinity, periodic flooding, and changing sediment characteristics (Lewis, 1995). Derived from these characteristics, mangroves are habitats for commercially important species, provide protection against storms and hurricanes, improve water quality, regulate greenhouse gas, and are a tourism and cultural attraction (Marois and Mitsch, 2015; Menéndez et al., 2020; Rijal et al., 2020; Zu Ermgassen et al., 2020; Maza et al., 2021).
For regulatory ESs, mangroves significantly influence various processes, including those related to gas dynamics, mainly carbon dioxide (CO2). Mangroves have the capacity to sequester and store organic carbon at high concentrations. They are forests with a greater storage capacity in the form of organic carbon above and belowground, achieving up to 856 Mg C ha–1 (Kauffman et al., 2020), which is twice that of tropical forests (400 Mg C ha–1) and four times more than that of temperate forests (220 Mg C ha–1) (Taillardat et al., 2018). According to global evaluations, mangrove carbon storage varies considering environmental and geomorphic settings and exists a data scarcity for carbonate settings (Breithaupt and Steinmuller, 2022; Taillardat, 2022). Based on this, it is important to generate data at the local level to support global carbon estimates related to stock, fluxes, and sequestration rates; this would allow to increase in the number of studies and samples and improve the statistical power to detect differences for all sedimentary and geomorphic settings (Breithaupt and Steinmuller, 2022).
In other matters, mangrove loss is a situation of global concern; however, it has reduced from 2% to < 0.4% per year in the last century (Friess et al., 2019). In fact, in recent years, the mangrove loss rate is 0.13% yearly, and it is caused by anthropogenic factors mainly, as land-use change, joined to natural factors, such as storms and hurricanes impacts (Goldberg et al., 2020). Mangrove loss changes the ecosystem’s functional role from sinks to emitters of carbon (Lovelock et al., 2011; Adame et al., 2015).
The importance of mangroves forests in the mitigation of greenhouse gas emissions has driven the valuation of carbon storage in mangroves under different conditions and scenarios, mainly in regions where the water supply derives from surface runoff as rivers (Rahman et al., 2015; Bhomia et al., 2016; Kauffman et al., 2016; Njana et al., 2018). Forecasts of aboveground and belowground carbon in mangroves based on climate and geomorphological characteristics show high variability and uncertainty in their predictions (Herrera-Silveira et al., 2016; Twilley et al., 2019). This uncertainty on a global scale is related to the lack of data for some regions, such as those influenced by groundwater discharge in karstic geomorphologic environmental scenarios (Herrera-Silveira et al., 2020; Twilley et al., 2019) and variations in the influence of local characteristics, such as the hydrology, resources, and stressors (Sherman et al., 2003; Twilley and Rivera-Monroy, 2005). In this regard, generating knowledge of karstic mangroves is important due to the limited number of karstic mangroves samples in global analysis causing an overestimation of carbon stock in carbonated settings when models are used (Rovai et al., 2018).
Mangroves have differences in hydrology, resources, and stressors that influence carbon stock sources. These differences have implications for the management of mangroves and the carbon dynamic. Thus, knowing how changes in mangrove characteristics at the local level permit making the best decisions for the conservation and restoration of mangroves.
Mexico is the fourth country with the largest extension of mangroves in the world with 905,086 ha; 60% of Mexican mangroves are in the Yucatan Peninsula region (CONABIO, 2021) and the specific setting favors the development of different mangrove ecological types (fringe, basin, dwarf, and hammock) (Lugo and Snedaker, 1974).
For this reason, we assessed the total ecosystem carbon stock in the mangrove ecological types located in a karstic region and its relationship with vegetation, water, and soil variables. The hypothesis consists of different mangrove ecological types defined by characteristics such as hydrology, soils, and forest structure should have different aboveground, belowground, and total carbon stocks. Information derived from mangrove carbon stocks permits us to estimate greenhouse gas mitigation, considering avoided emissions for mangrove conservation and contributing to compliance with national and international agreements related to confronting climate change.
2. Study area
The study area was the northern portion of the protected natural area of the Ria Celestun Biosphere Reserve (RCBR), located northwest of the Yucatan Peninsula. The RCBR polygon occupies an area of 81,482 ha, and the northern area occupies 42,338 ha. Celestun has a coastal lagoon of the same name, which is 22.5 km long and 1.25 km wide, with an average depth of 1.2 m (Acosta-Lugo et al., 2010; Supplementary Figure A). The topography is relatively flat with a slope of <1%, except for some dunes on the sandy bar. The geology is tertiary limestone with a significant infiltration potential; therefore, there are no surface water bodies (Batllori-Sampedro, 1995). The soils are shallow and have limestone-karst characteristics (SEMARNAT, 2000). The climate is predominantly semi-arid, with rain in the summer (average annual rainfall of 767 mm). Celestun Lagoon presents a spatial and temporal salinity gradient, given by its interaction with the sea and freshwater groundwater discharge as springs (Herrera-Silveira, 1994; SEMARNAT, 2000).
The RCBR presents various coastal environments, including dunes, mangroves, petenes, low rainforests, floodplains, aquatic vegetation, and low deciduous rainforests. The main mangrove species were Rhizophora mangle, Laguncularia racemosa, and Avicennia germinans. Within the RCBR, natural resources are used either for self-consumption or indirectly through fishing, salt extraction, and ecotourism projects. The identified threats include loss of mangrove areas, submerged aquatic vegetation, siltation, and eutrophication of the lagoon; however, the area is thought to be in good condition, where the main impacted areas are around urban zones (SEMARNAT, 2000; RAMSAR, 2004; Herrera-Silveira, 2006).
3. Materials and methods
3.1. Image classification
Image analysis was carried out using an image to obtain the mangrove extent in the study area. A Landsat 8 OLI image from 21 to 45 scenes from 01 March 2020, with a 30 m resolution, was downloaded from the USGS Earth Explorer. The DOS method was applied for atmospheric correction (Wicaksono and Hafizt, 2018) which transforms the digital values to reflectance, assuming reflectance from dark objects includes atmospheric scattering (Cinco-Castro et al., 2022).
A preliminary visual analysis was performed using a “false color” composition (Villajos, 2006). Five mangrove classes were observed (fringe, basin, dwarf, disperse dwarf, and “petén”). In addition, dune vegetation and no-vegetation zones were identified. For this classification, fringe mangroves border the Celestun’s lagoon. Basin mangroves are located just behind fringe mangroves in sites where the terrain topography is low, “petén” mangroves occur as vegetation islands mainly with a circular shape; and dwarf mangroves are smaller mangroves.
For each class, polygonal “training sites” were defined using false color composition and study site knowledge. Supervised classification was performed using the maximum-likelihood algorithm (Villajos, 2006; Macedo-Cruz et al., 2010) and the Kappa index (range 0 to 1) and error matrix were obtained to indicate classification accuracy based on classification and reference data differences.
Additionally, the files with polygons for mangrove coverage were downloaded from INEGI (2016), CONAFOR (2018), and CONABIO (2021). The extension of each for the delimited study area was estimated using QGIS 3.22.16.
3.2. Fieldwork and sampling processing
Based on the distribution of the mangrove ecological types in Celestun, 12 sites were selected around the lagoon (Figure 1). Three sites were selected for each mangrove forest type. At each site, one transect was performed, following the methodology and recommendations of Kauffman and Donato (2012). For each transect, data collection was carried out at six plots of 0.0025 ha in dwarf mangroves and 0.01 ha in plots in fringe, basin, and “petén” mangroves (N = 72).
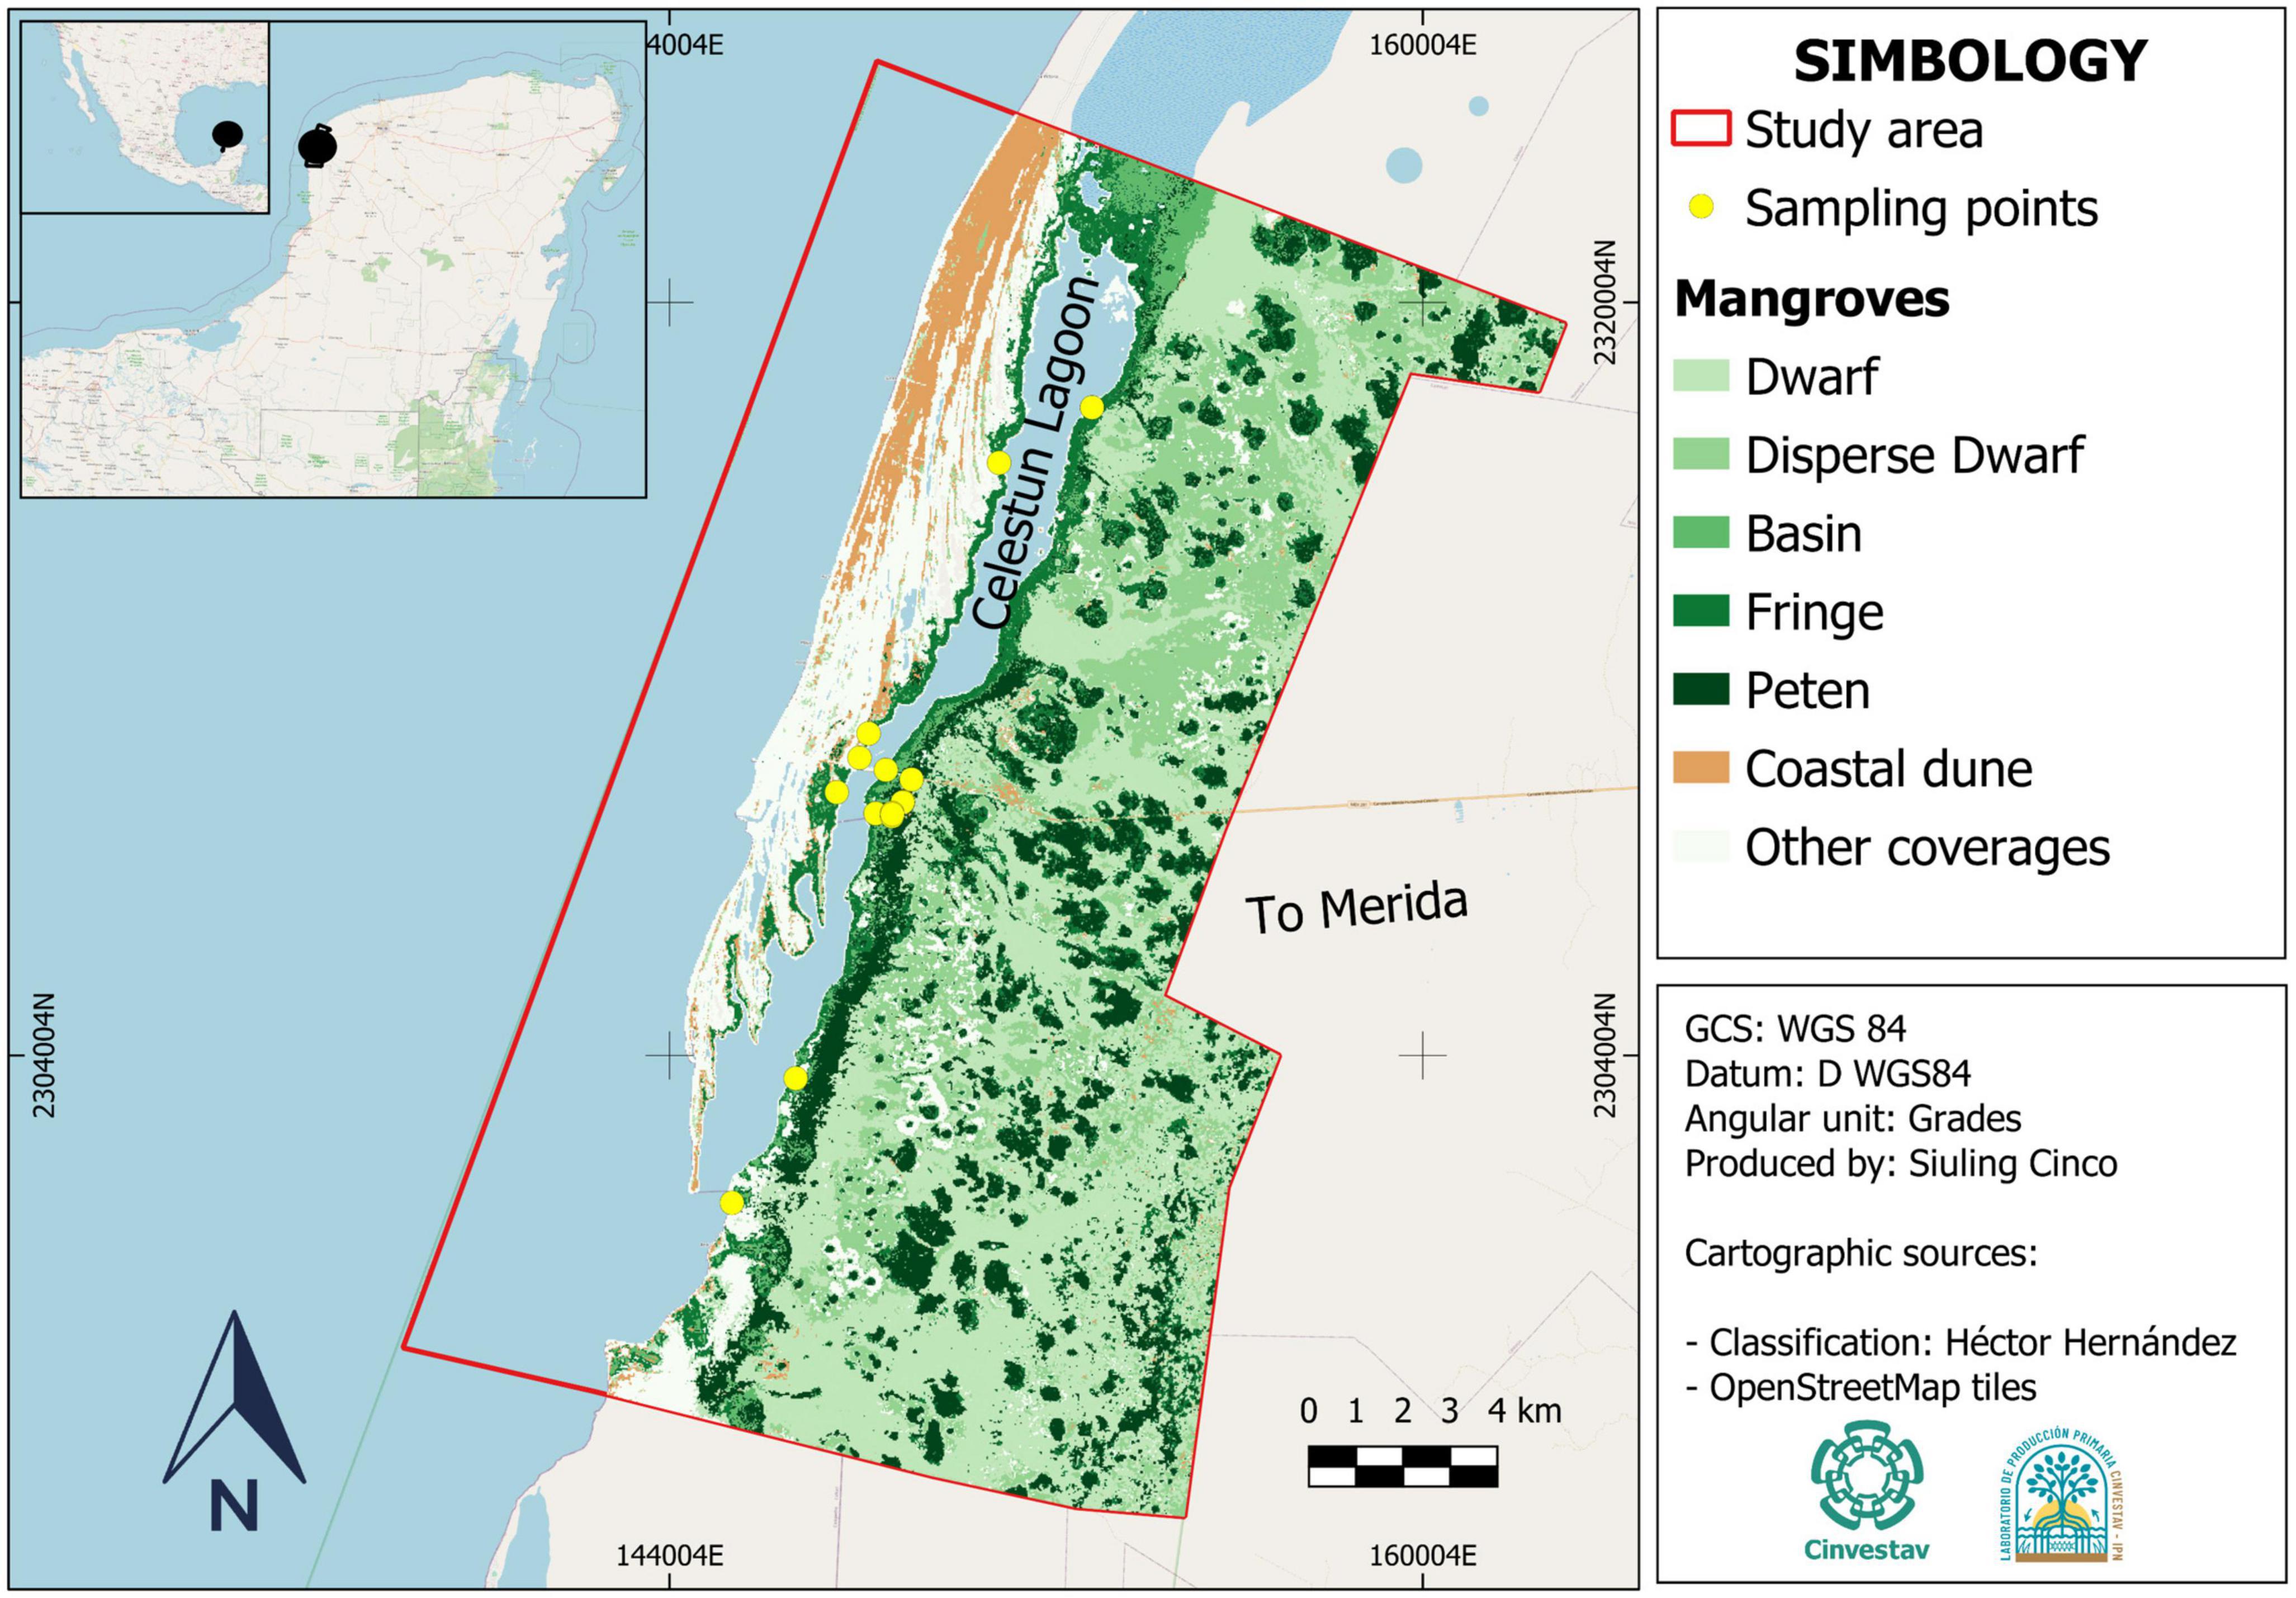
Figure 1. Mangrove ecological types derived from image classification and sampling points north of Ria Celestun Biosphere Reserve, Yucatan.
3.2.1. Aboveground carbon
3.2.1.1. Trees
In each plot, species, height, and diameter at breast height (DBH) data were recorded at 1.3 m for trees with a DBH greater than 2.5 cm because, in Mexico, the frequency of trees with a DBH from 2.5 to 5 cm is high (Rodríguez-Zúñiga et al., 2018). For dwarf mangroves and mangroves with a DBH of less than 2.5 cm, the DBH of the main trunk and canopy coverage (length, width, and height) were recorded according to the guidelines of Ross et al. (2001). The average basal area, height, and density were estimated based on mangrove type. Based on the structural and site characteristics, allometric equations (Smith and Whelan, 2006) were used to calculate the biomass in kilograms (Supplementary Table A). Biomass in megagrams (Mg) was converted to carbon (Mg C) using a conversion factor of 0.46, considering that approximately 46–50% of tree biomass corresponds to carbon (IPCC, 2003; Kauffman and Donato, 2012).
3.2.1.2. Litter
Considering that organic soils have a significant quantity of decomposed plant remains accumulated in an anaerobic manner due to wetland characteristics, such as the flood level, flood time, and flood frequency (Mitsch and Gosselink, 2007), it is important to understand the litter accumulated on the forest floor, which influences the carbon stock. The contents of 50 × 50 cm quadrants were collected, including stems, leaves, fruits, and seeds, to measure the aboveground component of the downed material. This material was dried at 70°C for 36 h and weighed to obtain the biomass (kg). These values were converted to carbon using a conversion factor of 0.45 (Bouillon et al., 2008; Kauffman and Donato, 2012).
3.2.1.3. Dead and downed wood (DDW)
Dead and downed wood were registered using the line intersect technique described by Kauffman and Donato (2012). In this technique, wood pieces of different sizes were measured along the transect using perpendicular lines. The lengths of the perpendicular lines represented the different wood diameters. Carbon was calculated using the quadratic diameter and wood density of pieces in the line of the transect.
3.2.2. Belowground carbon
3.2.2.1. Fine roots
For the live belowground carbon component, fine root samples were collected using a nucleator of known volume (10 cm in diameter and 35 cm in length cylinder). The collected roots were washed, separated from the sediment, and divided into three classes: 1 (0–2 mm), 2 (2–5 mm), and 3 (5–20 mm). Subsequently, they were dried in an oven at 70°C for 36 h to obtain a constant dry weight (Castañeda-Moya et al., 2011). The registered dry weight corresponded to the biomass (kg). Carbon conversion was performed using a factor of 0.36 (Kauffman and Donato, 2012).
3.2.2.2. Soil
Two sediment samples were collected from each plot using a 100 cm deep core. Samples were divided into intervals of 0–15, 15–30, 30–50, 50–100, and >100 cm (Kauffman and Donato, 2012). In the laboratory, the sediments were dried at 70°C for 72 h to obtain dry weight. The bulk density and organic matter content (%) were determined (Kauffman and Donato, 2012). Organic C was determined from the difference between total C and inorganic C. Total C was obtained through an autoanalyzer, based on the complete oxidation of the sample and its conversion to a gas mixture. Inorganic C was determined by ignition (LOI = Loss on ignition), where organic matter was burned from the sample in a muffle for 5 h at 550°C (Dean, 1974; Holme and McIntyre, 1984). The dry weight was considered before and after the burning, finally obtaining the ash percentage that remained.
3.2.3. Physicochemical characteristics
In each plot, three interstitial water samples were obtained at a depth of 30 cm using a syringe and acrylic tubes adapted for this purpose. Subsequently, physicochemical data were recorded in situ, as described below.
3.2.3.1. Salinity (PSU)
This reading was done with an Atago refractometer.
3.2.3.2. Temperature, pH, and redox potential
These variables were measured using an Ultrameter II™ 6PFCE device by Myron L Company. Sensors were calibrated using the NIST traceable Standard Solution and delivered an accuracy of ± 1% of reading.
3.2.3.3. Flood level
In each plot, at random points and using a 1 m graduated ruler, three measurements in centimeters of the water level were taken from the ground to its surface.
3.3. Isotopic analysis
Stable isotope analysis (δ13C and δ15N) was performed to determine the organic carbon sources in mangrove sediments. Twenty-three samples at a depth of 10 cm in the surface sediment cores were obtained to determine the isotopic composition of mangrove sediment around Celestun Lagoon. Samples were dried, weighed, ground to a fine powder using an agate mortar, and sieved through a 1 mm mesh. Samples were acidified, dried, and capsulated using 10% acid (HCl) for analysis. Stable isotope signatures (δ13C and δ15N) were determined at the Stable Isotope Analysis Laboratory (UNAM) using a continuous-flow gas isotope ratio mass spectrometer (Delta V Plus). The procedure was performed in duplicate with an instrumental precision of 0.2%. The δ13C and δ15N signals (%) were calculated using ratios of 13C:12C and 15N:14N (heavy and light isotopes, respectively). As input to the Stable Isotope Mixing Model of the autochthonous and allochthonous carbon sources, our values for mangrove sediments and leaves in the mangrove ecological types and values generated by Cota-Lucero and Herrera-Silveira (2021) for marine sediments, seagrasses, and other terrestrial wetlands have been used. To run the Bayesian mixing model the simmr package (Parnell, 2021) was used for the R software version 4.2.1.
3.4. Carbon estimates
The total ecosystem carbon stock was obtained by the addition of each of the components analyzed in megagrams of carbon per hectare (Mg C ha–1):
Values for carbon stock are represented by mean and minimum-maximum values of the confidence interval at 95% (CI95%).
Estimates of ecosystem carbon in Celestun were obtained from the average carbon storage (C) of each ecological type of mangrove and its corresponding area (A), calculated after image classification (Kauffman and Donato, 2012):
The uncertainty associated with the estimates corresponded to the propagated error among all the compartments (Kauffman and Donato, 2012). The final values of the carbon content in the ecosystem were expressed in teragrams (Tg C).
For the emissions derived from mangrove losses, the C content was converted to equivalent carbon dioxide (CO2e) by multiplying the reserve of C (total and by type of mangrove) by 3.67, corresponding to the molecular ratio between CO2 and C (Kauffman and Donato, 2012) because CO2 is the most common gas derived from C; the inventories and emissions are reported in units of CO2e. Additionally, emissions for the area were calculated using the average carbon storage and extent of degraded mangroves in the reserve polygon considering the oxidation of organic carbon in the first meter in soil deep when mangroves are loss (Howard et al., 2014; IPCC, 2014). In addition to this, 10-year potential emissions were estimated considering the loss of mangroves and their stocks and the IPCC (2014) emission factor for drained soils (TIER 1).
For context in terms of the emissions mitigated by mangrove conservation and those emitted into the atmosphere due to their loss at local level, estimates were made using a conversion factor of 3.74 Mg CO2e corresponding to the per capita emissions per year of hydrocarbon consumption estimated for Mexico (INECC-SEMARNAT, 2018).
3.5. Data analysis
3.5.1. ANOVA
To determine the differences between aboveground, belowground and total carbon stocks in the mangrove ecological types a Shapiro–Wilks normality test (modified) was performed. To fulfilling this assumption, an analysis of variance (ANOVA) of one factor was applied using InfoStat software.
3.5.2. Bootstrap confidence intervals
Non-parametric confidence intervals (at 95%) using the adjusted boot percentile (BCa) method (Davison and Hinkley, 1997) were used to make estimates of the aboveground, belowground, and total ecosystem carbon stock of mangrove ecological types. Calculations were made using the boot.ic function from the boot package (Canty and Ripley, 2022) for R version 4.2.1.
3.5.3. Ordination
A Euclidian triangular matrix was calculated using standardized variables of aboveground, belowground and total ecosystem carbon stock. This matrix was ordinated using principal coordinate analysis (PCoA) (Gower, 1966). The PCoA method can be used with all the descriptors (Legendre and Legendre, 2012). PCoA analysis was performed using the cmdscale function in the R Statistical Software (v4.1.2; R Core Team, 2022). Finally, to fit environmental vectors (physical-chemical parameters) and factors (mangrove ecological types) in the PCoA, the envfit function was used. The variables with the highest explained deviation (%) were represented in the PCoA using the ordisurf function. This function is a GAM (General Additive Model) that fits a smooth response surface. Both functions belong to the vegan library (v2. 6-2; Oksanen et al., 2020).
4. Results
4.1. Mangrove ecological types
The estimated mangrove area in this study was 22,263 ha (Figure 1). Celestun mangroves were classified according to their structural characteristics into fringe, basin, dwarf, and “petén” (Table 1). The spatial distribution of mangroves in Celestun indicates that fringe mangroves occupy 2,735 ha, mainly border the lagoon. Basin mangroves have a extent of 811 ha, and grows where the terrain topography is low, which permits water entrance; owing to high evaporation, high salinity was registered (Table 2). Dwarf mangrove has an average height of 1.5 m and show a greater extent in the study area (14,706 ha, considering dwarf and disperse dwarf mangrove). “Petén” mangrove has a vigorous vegetation reaching approximately 13 m high but occupies only 4,011 ha. These mangroves are associated with other types of wetlands, such as tulares, popales, and blanquizales (Figure 1). The largest trees, considering their basal area (Table 1), are the “petén” mangroves while the smallest is the dwarf mangrove. Regarding the density of trees, dwarf mangroves reach >20,000 individuals per hectare, whereas fringe mangroves reach only 1,232 trees.
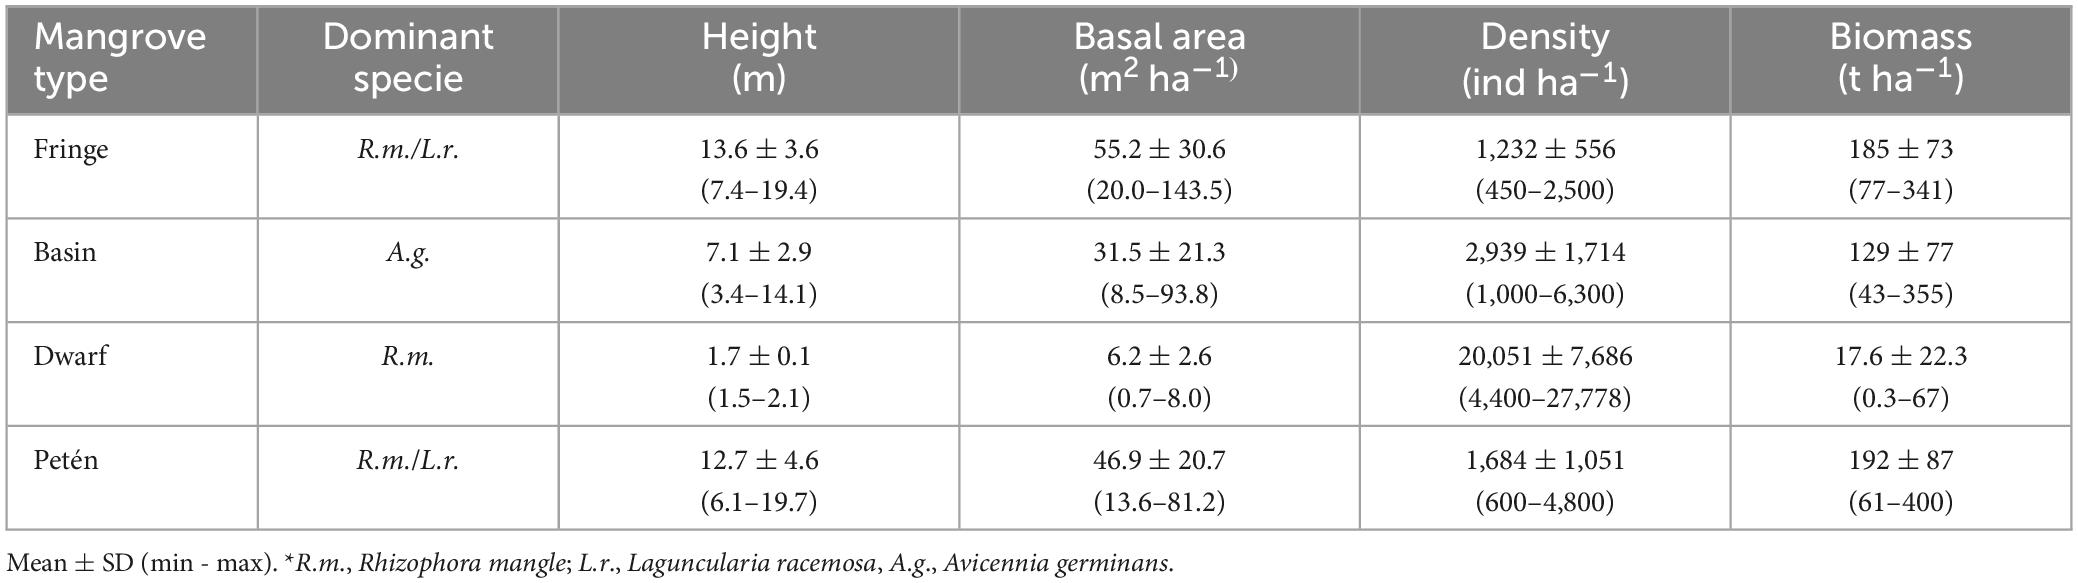
Table 1. Structural characteristics of the ecological types of Celestun mangroves.
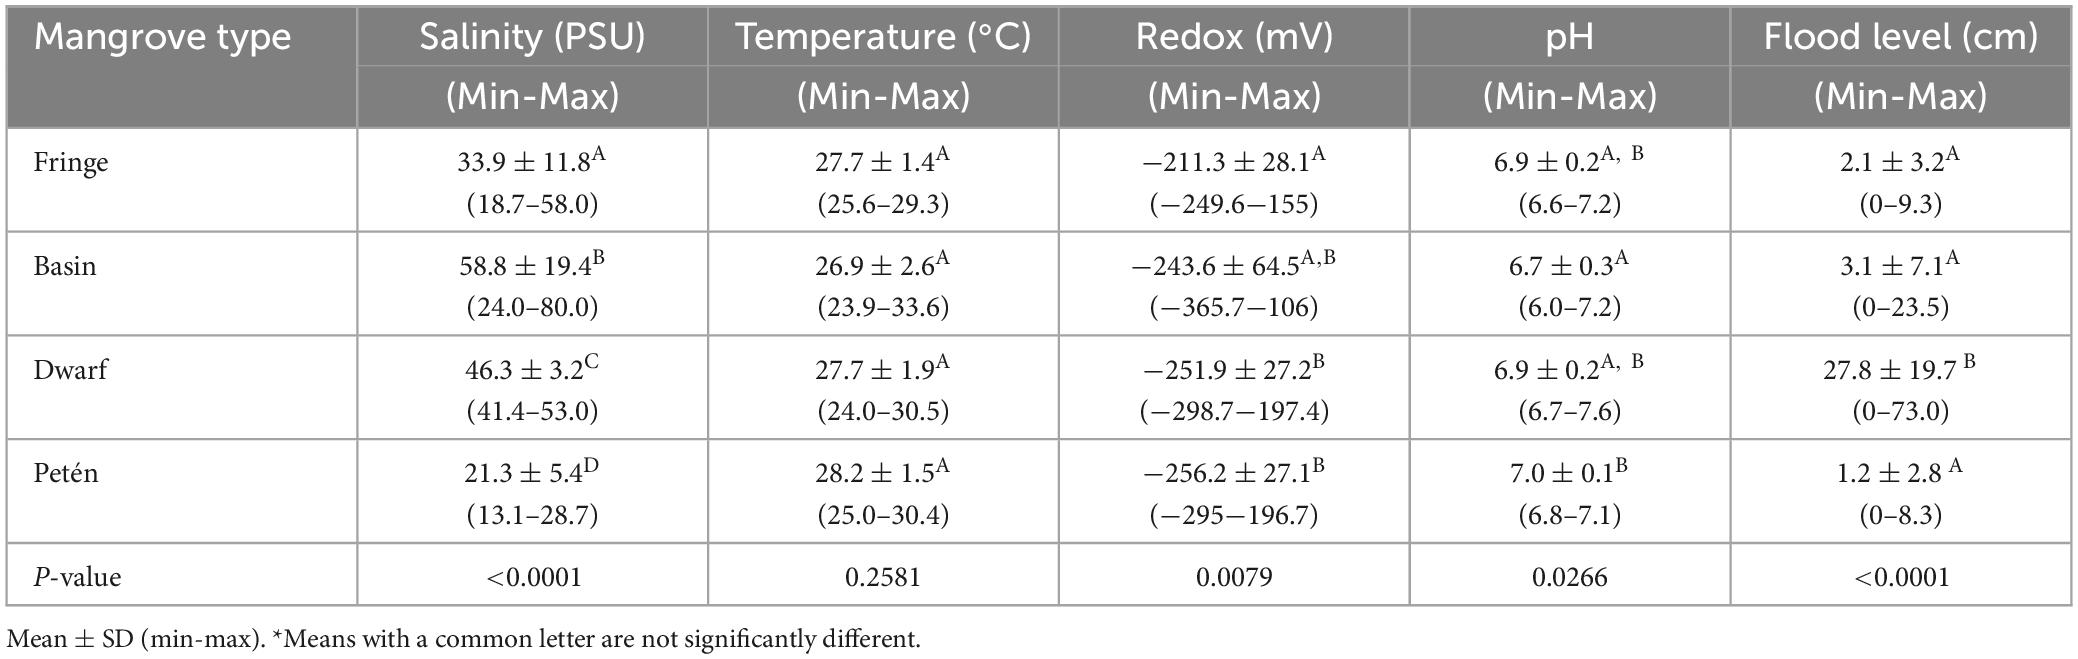
Table 2. Physicochemical characteristics of the interstitial water of the Celestun mangroves.
4.2. C stock by mangrove ecological type
The mean total ecosystem carbon stock in Celestun was 434.6 [CI95% = 387.7–490.9] Mg C ha–1, of which the aboveground component represents 15.9%, mainly tree biomass (88.9%, 61.6 ± 44 Mg C ha–1), whereas necromass represents 5.8% of the aboveground carbon stock. Although transects in dwarf and “petén” mangroves do not present death and down wood, this component represents 4.2% of total ecosystem carbon stock, with 3.7 ± 1.7 and 2.1 ± 0.5 Mg C ha–1 in fringe and basin mangroves, respectively. The belowground stock represented 84.1% of the total carbon, mainly represented by the soil stock (97%, 354.5 ± 186 Mg C ha–1).
According to the mangrove ecological type, the “petén” mangrove has the high-value aboveground C stock [92.4 (CI95% = 74.8–113.9) Mg C ha–1] respect to dwarf mangroves have the low-value [16.4 (CI95% = 10.8–25.4) Mg C ha–1] [F(3,0.05) = 7.80, p = 0.0002]. The high-value in belowground C stock was also found in “petén” mangroves [591.3 (CI95% = 511.4–724.7) Mg C ha–1], followed by fringe mangroves [342.5 (CI95% = 321.4–363.3) Mg C ha–1]. Dwarf mangroves have the low-value in carbon stock in the belowground component [182.0 (CI95% = 130.7–207.6) Mg C ha–1] (Figure 2), portraying the existing differences in the belowground stock among different mangrove ecological types [F(3,0.05) = 27.82, p < 0.0001]. Table 3 lists the carbon stock distribution along the soil profile, showing that the highest carbon storage was in the “petén” mangrove [F(3,0.05) = 20.04, p < 0.0001]. When soil profile is considered, in mangrove ecological types 50–100 cm and >100 cm profiles are different to top profiles [F(4,0.05) = 86.12, p < 0.0001]. According to the mean total ecosystem carbon stock (above + belowground) exist differences between mangrove ecological types [F(3,0.05) = 38.94, p < 0.0001]. “Petén” mangrove had the high-value [683.7 (CI95% = 610.6–803.9) Mg C ha–1] while the dwarf mangrove had the small carbon stock [214 (CI95% = 136.5–224.4) Mg C ha–1] (Figure 2).
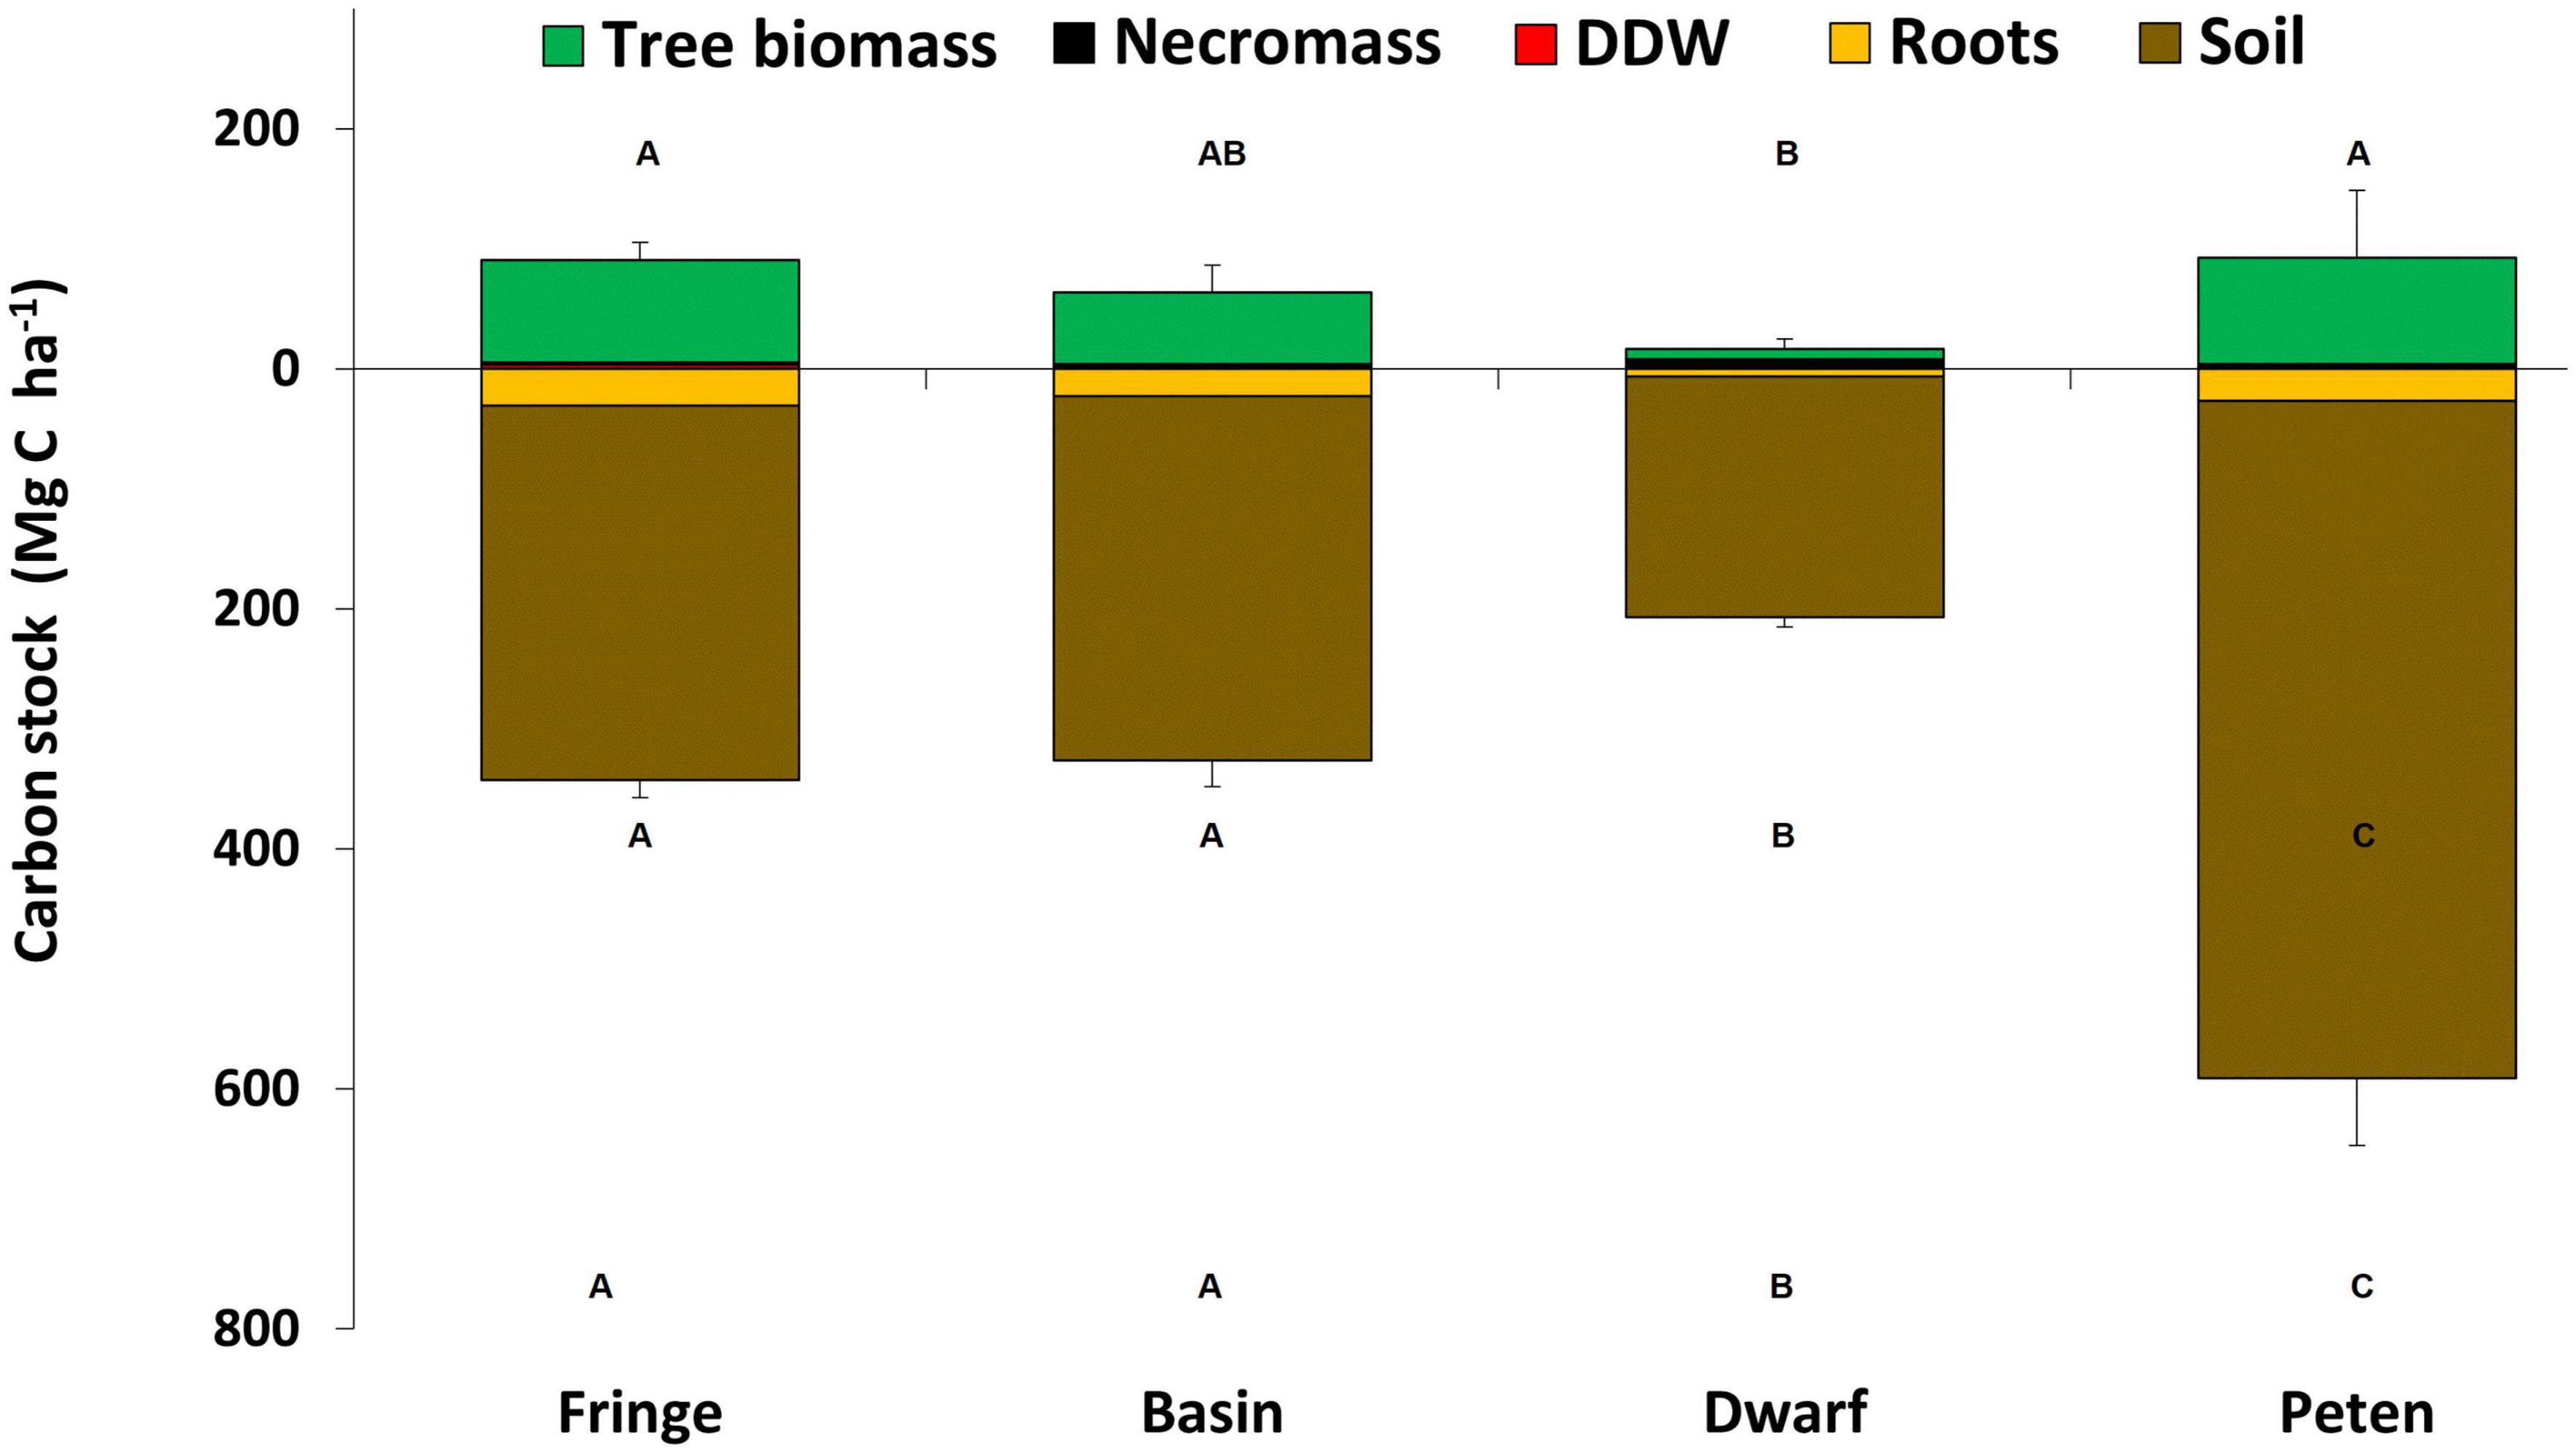
Figure 2. Total carbon stock by mangrove ecological type in Celestun, Yucatan. Components for aboveground carbon (live trees, death and downed wood, and necromass) and belowground (roots and sediments) are included. Error bars are propagated error among all compartments. Aboveground, belowground and total carbon stock values with a common letter are not significantly different (p > 0.05).
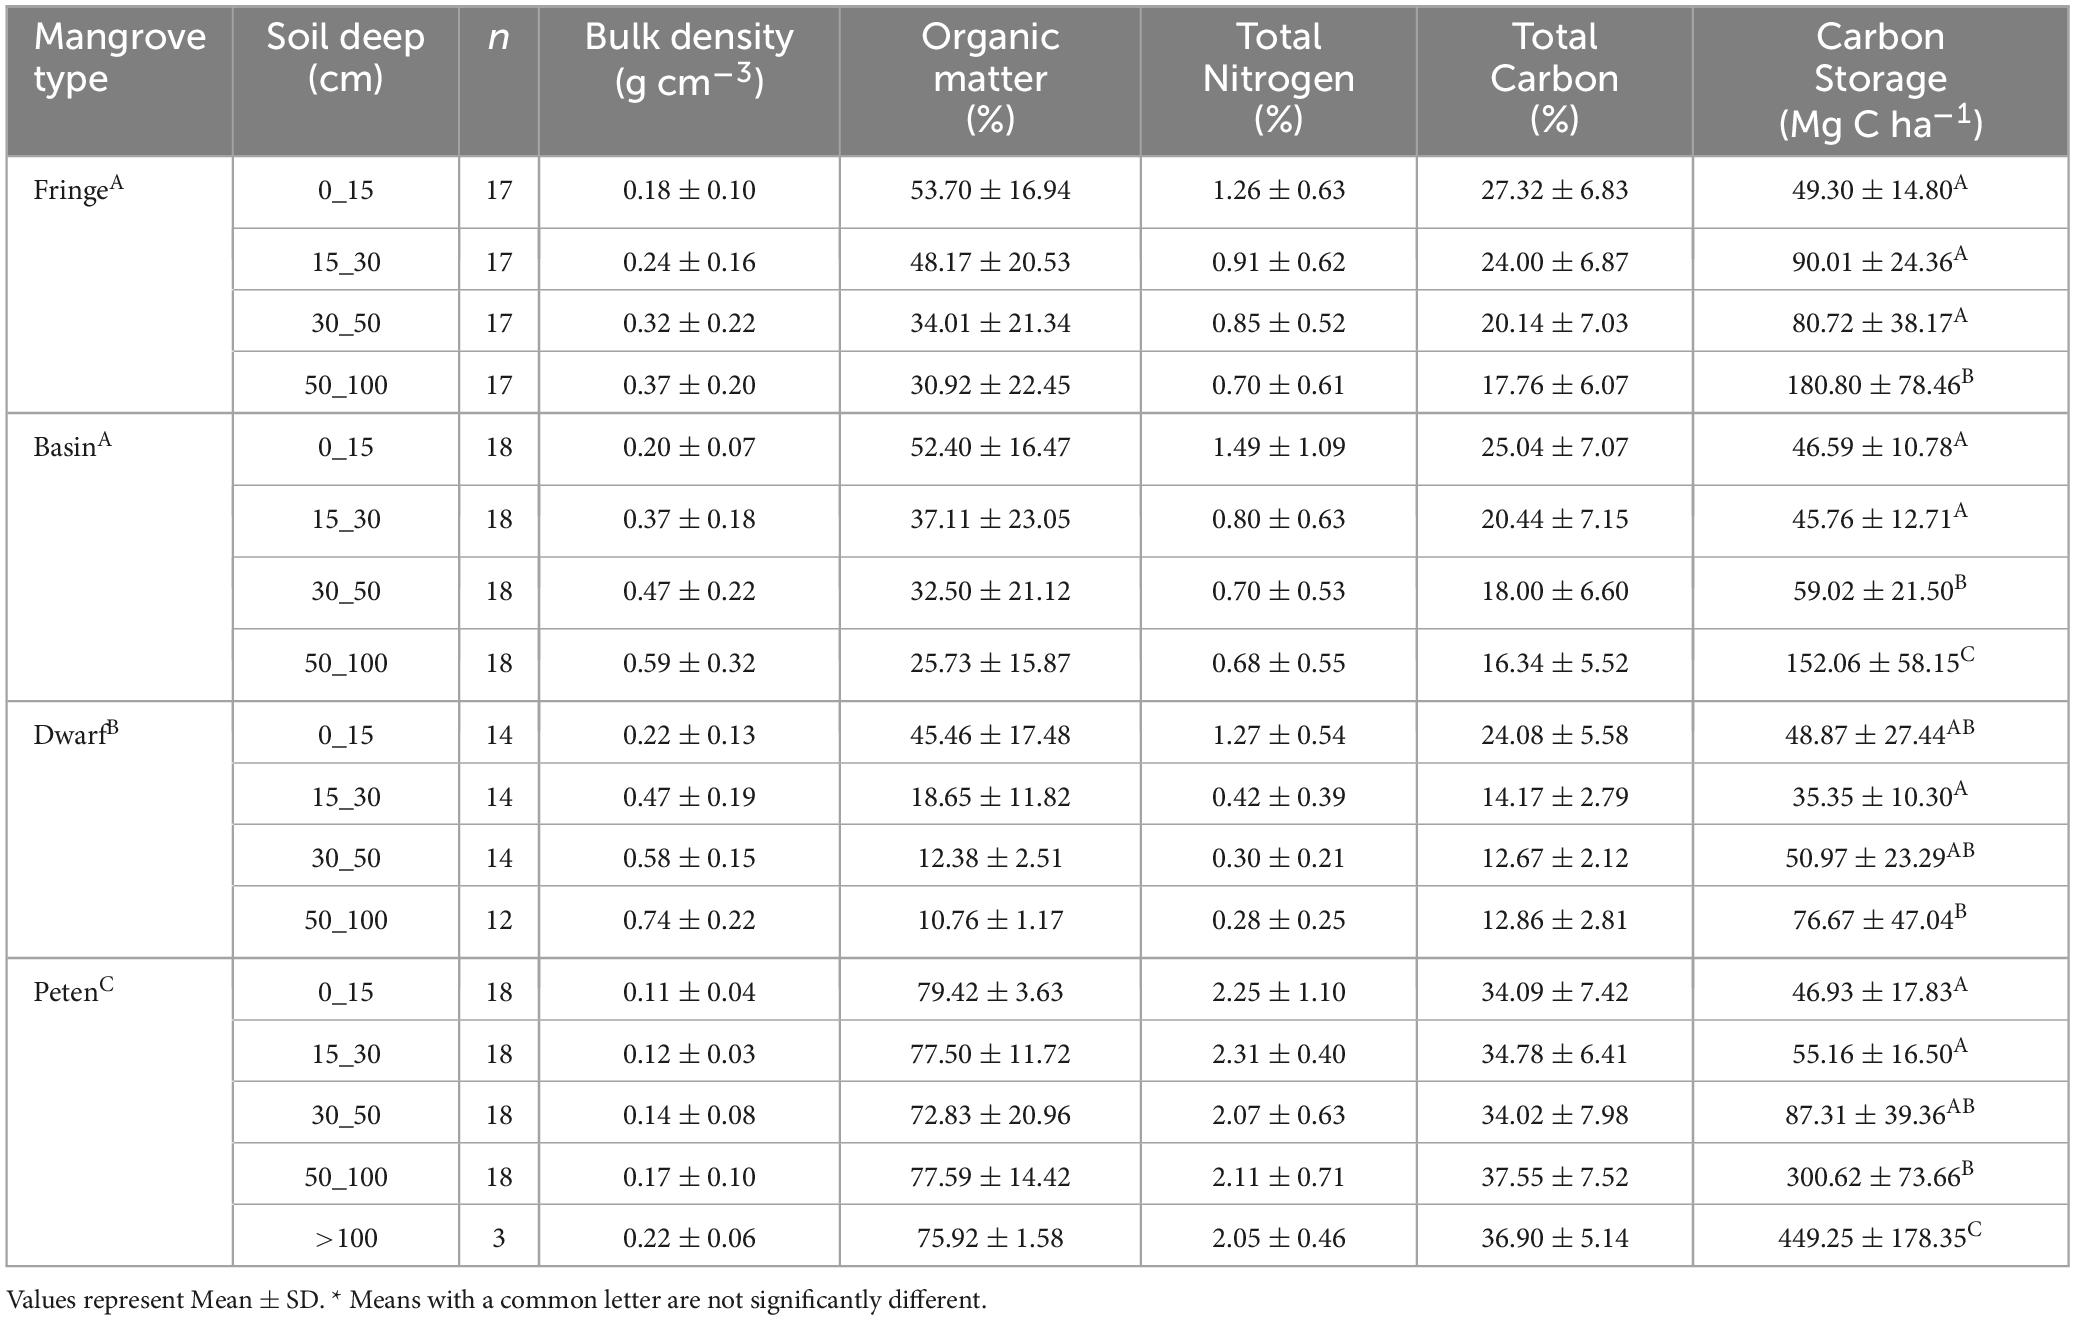
Table 3. Soil characteristics (bulk density, organic matter content, total nitrogen and carbon and carbon storage by depth in mangroves ecological types, Celestun.
4.3. Environment control to carbon stock
Interstitial water variables (salinity, temperature, pH, and redox potential) in mangroves of Celestun present variability. Salinity and flood level show significative differences among the ecological types (Table 2). Basin and dwarf mangroves had higher salinity; but the most acidic conditions were found in the basin mangroves, and dwarf mangroves a high value in mean flooding level (27.8 ± 19.7 cm) in relation to the other mangrove ecological types (Table 2). As for the soil characteristics, as the deep increases, the bulk density also increases and organic matter decreases (Table 3).
The relationship between Euclidian triangular matrix of carbon values was related with independent variables of water characteristics and expressed through determination coefficients (R2) obtaining the following results: flood level (55.7%), salinity of interstitial water (40.2%) (Supplementary Figures C, D), and redox potential (31.9%) (Supplementary Table B). In each ecological type of mangrove, high variability in the composition of aboveground and belowground carbon stock was observed. Despite this, the observed difference between the ecological types of mangroves was 53.98%. The “petén” mangrove presented the greatest internal variation, but also the greatest amount of total carbon, with low estimated salinity values (20 PSU) (Figure 3 and Supplementary Figure C).
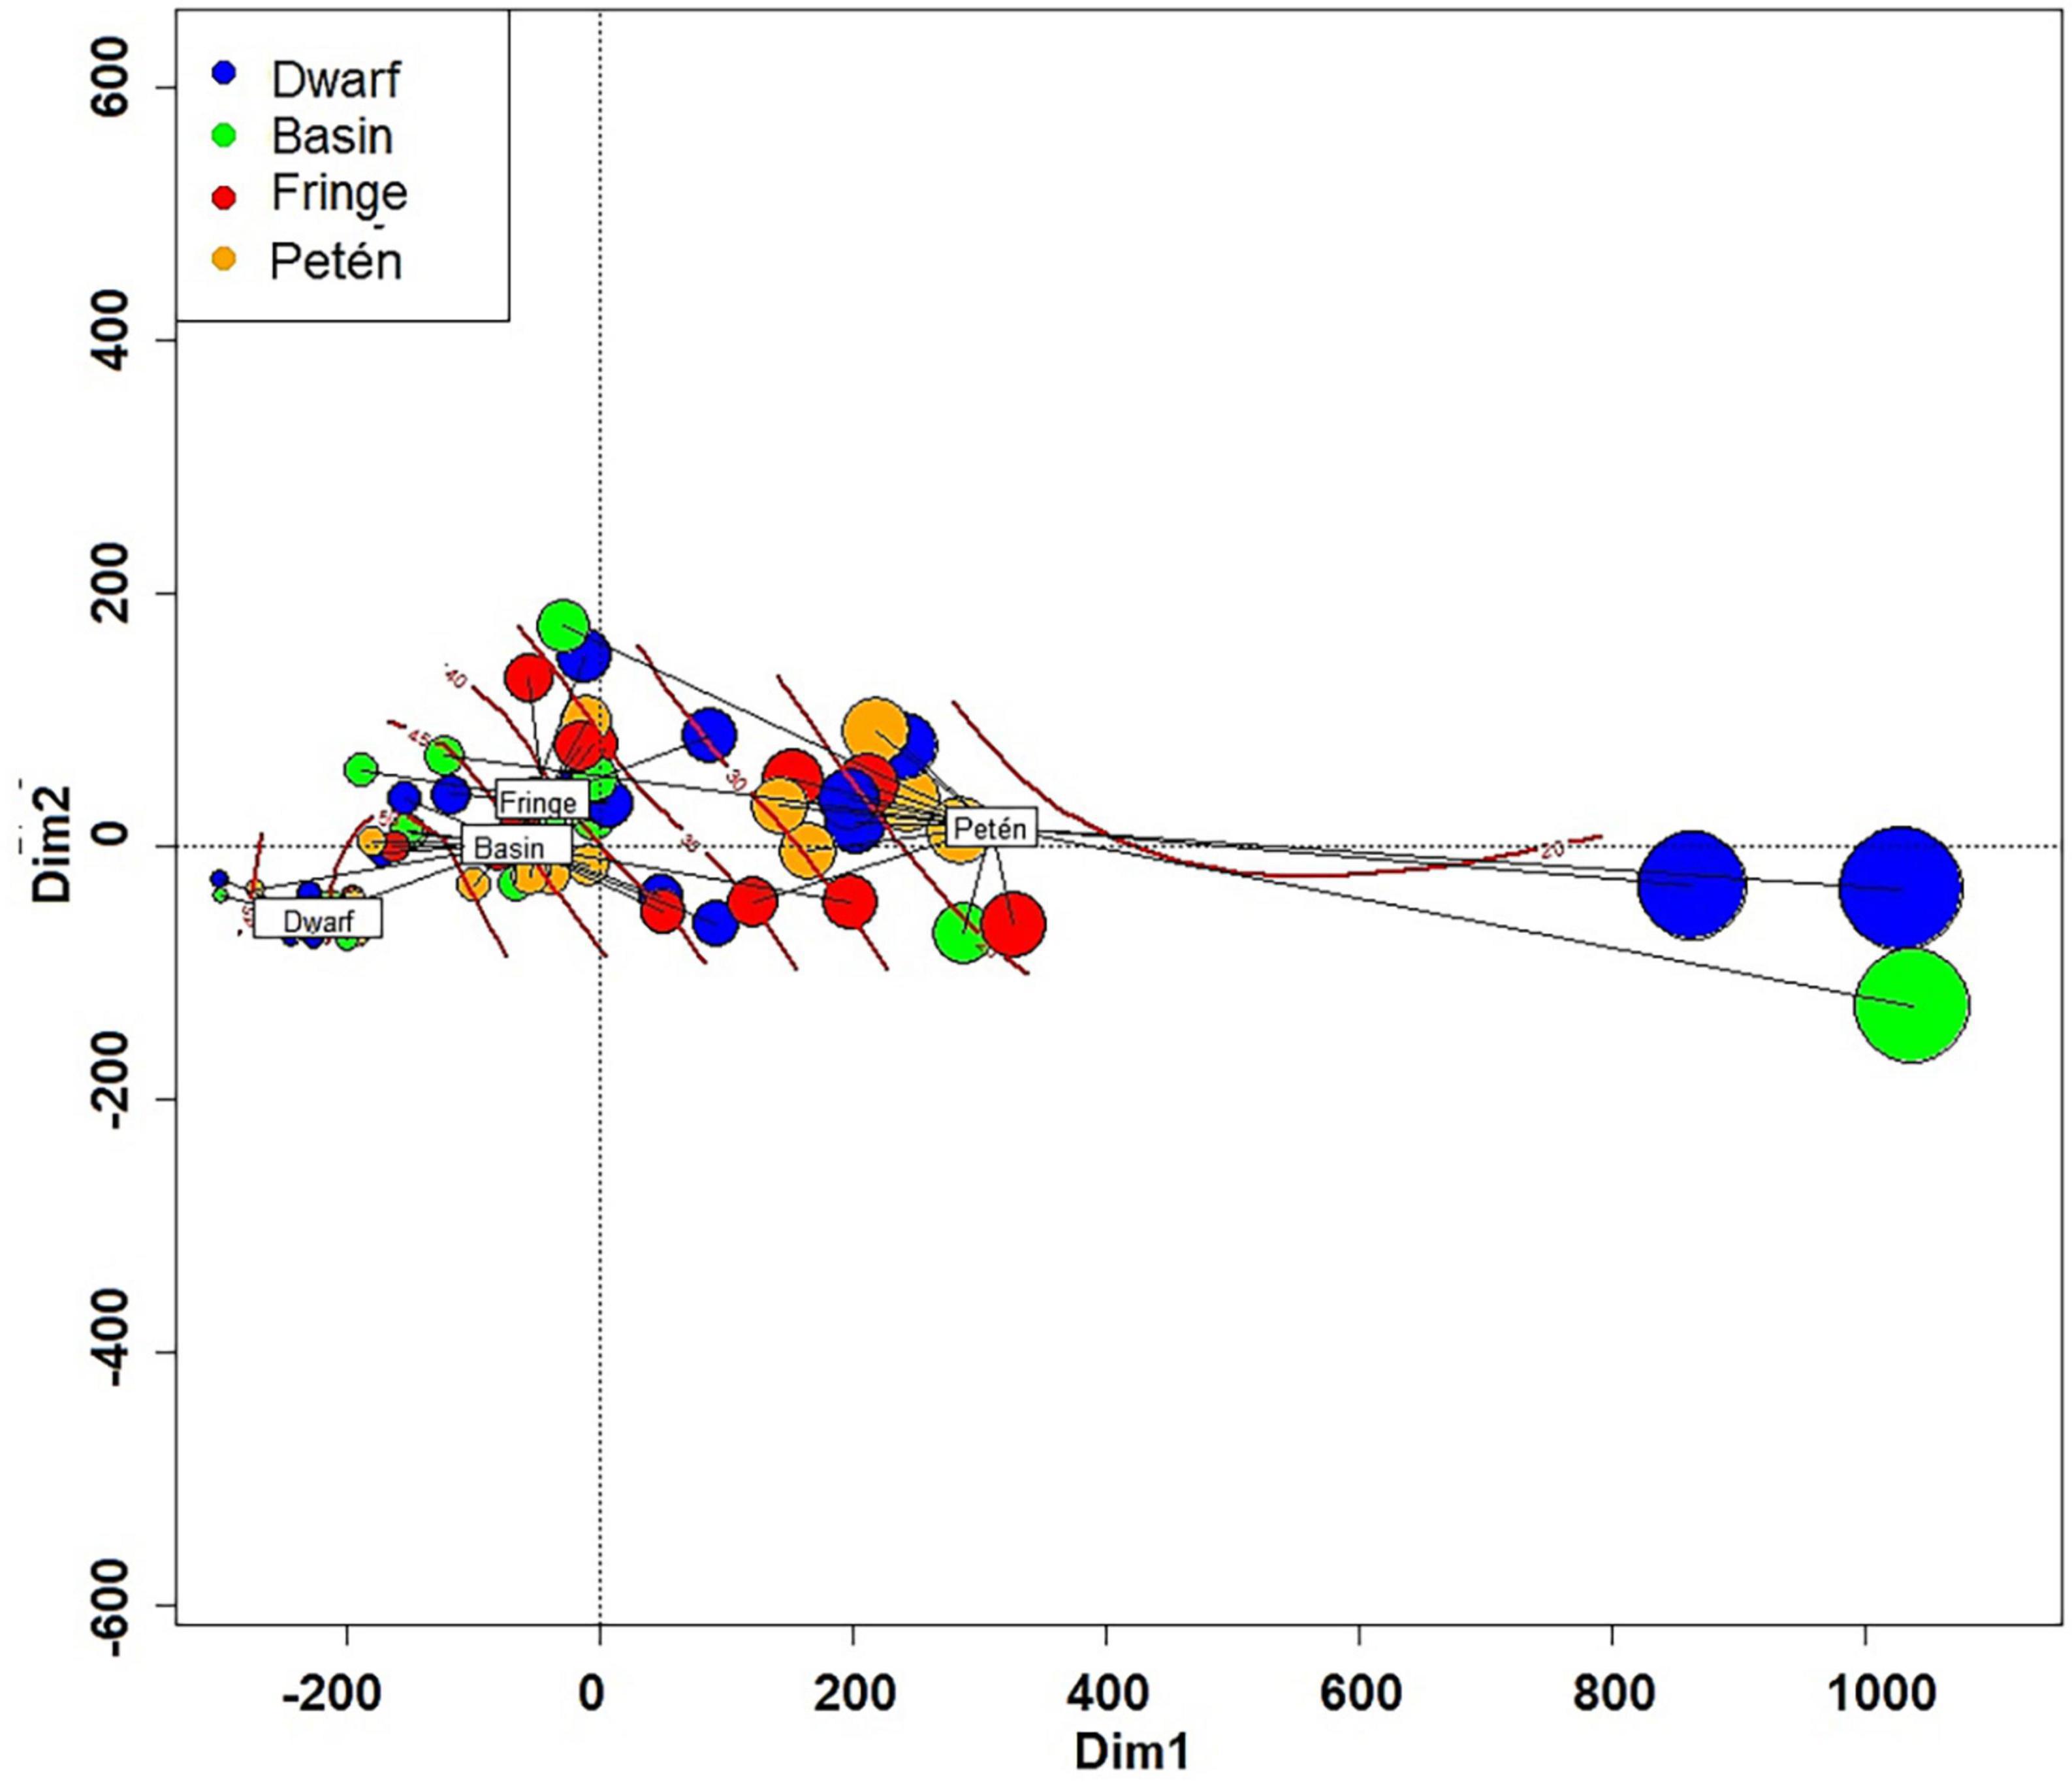
Figure 3. Principal Components Analysis (PCoA) of the mangrove characteristics of Celestun. The red line shows the no linear fit of salinity. The size of the circles is proportional to the amount of total carbon.
4.4. Carbon sources
Surface sediment isotopic analysis showed high values in variability in δ13C in the dwarf mangroves relative to the other ecological types (Supplementary Table C). Figure 4 shows the observed proportion of the contribution from different carbon sources and confidence intervals shows estimated values at 95% for the expected ratio for each contribution in allochthonous and autochthonous carbon. Accumulated organic carbon in soils in Celestun’s mangroves was autochthonous, given by CI95% = 3.7–91.5% for mangrove leaves. Leaf mangrove contribution was higher in the “petén” mangroves (Supplementary Figures B–D). In contrast, “petén” mangroves had a higher δ15N ratio than other ecological types. This enrichment can be related to freshwater discharge from springs associated with this mangrove type.
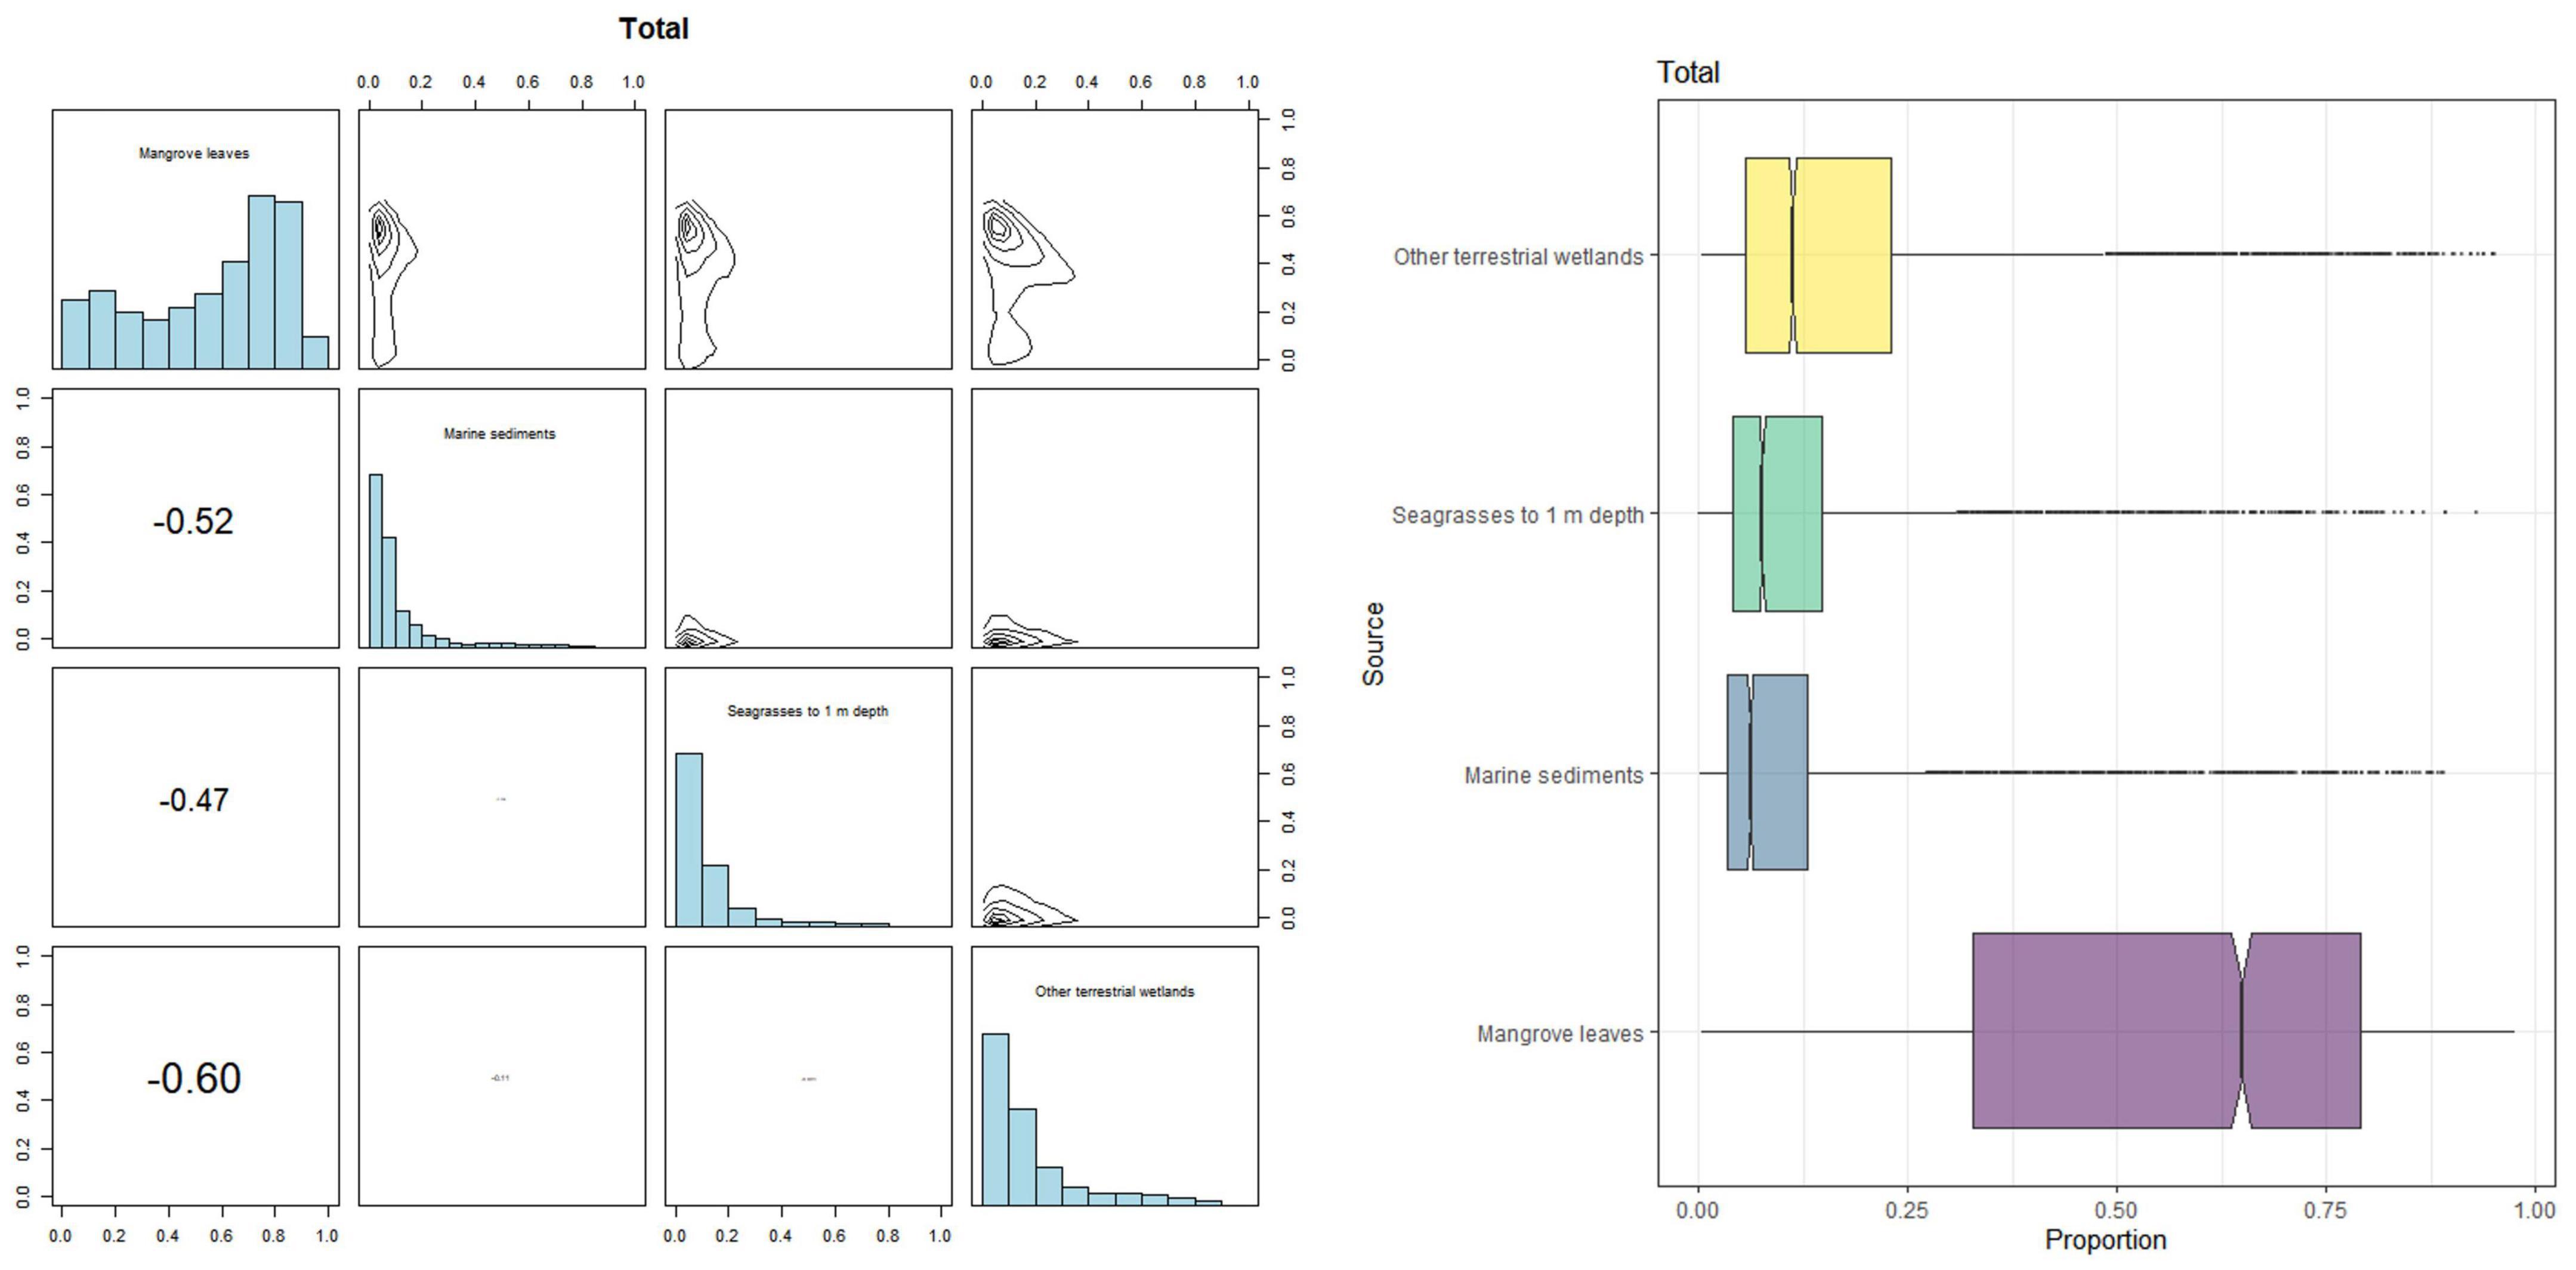
Figure 4. Contribution of different sources to the accumulated carbon organic in mangrove sediments in Celestun calculated using Bayesian mixing models. Matrix plot for mangrove sediments shows the probability distributions of each source, and box plots show the proportional contribution of each source to mangrove sediments. Lines inside boxes represent median values.
4.5. Total carbon stock
Considering that the average C stock in Celestun is 434.6 [CI95% = 387.7–490.9] Mg C ha–1 and the mangrove extent in the north portion of the protected area is 22,263.3 ha, the estimate for ecosystem carbon is 9.7 [CI95% = 8.6–10.9] Tg C. Although the dwarf mangrove has a low average C storage compared to the other mangroves, 40.7% of the C stored in this area is in this ecologic type due to its extension. In contrast, the mangrove basin had the lowest contribution to the ecosystem service of C stock (4.4%) (Table 4 and Figure 5). Considering the variability in official mangrove extension for the same area, the carbon stock was 8.1 Tg C in 18,716 ha for CONABIO, 8.8 Tg C in 20,197 ha for CONAFOR, and 7.9 Tg C in 18,382 ha for INEGI (Supplementary Figure E).
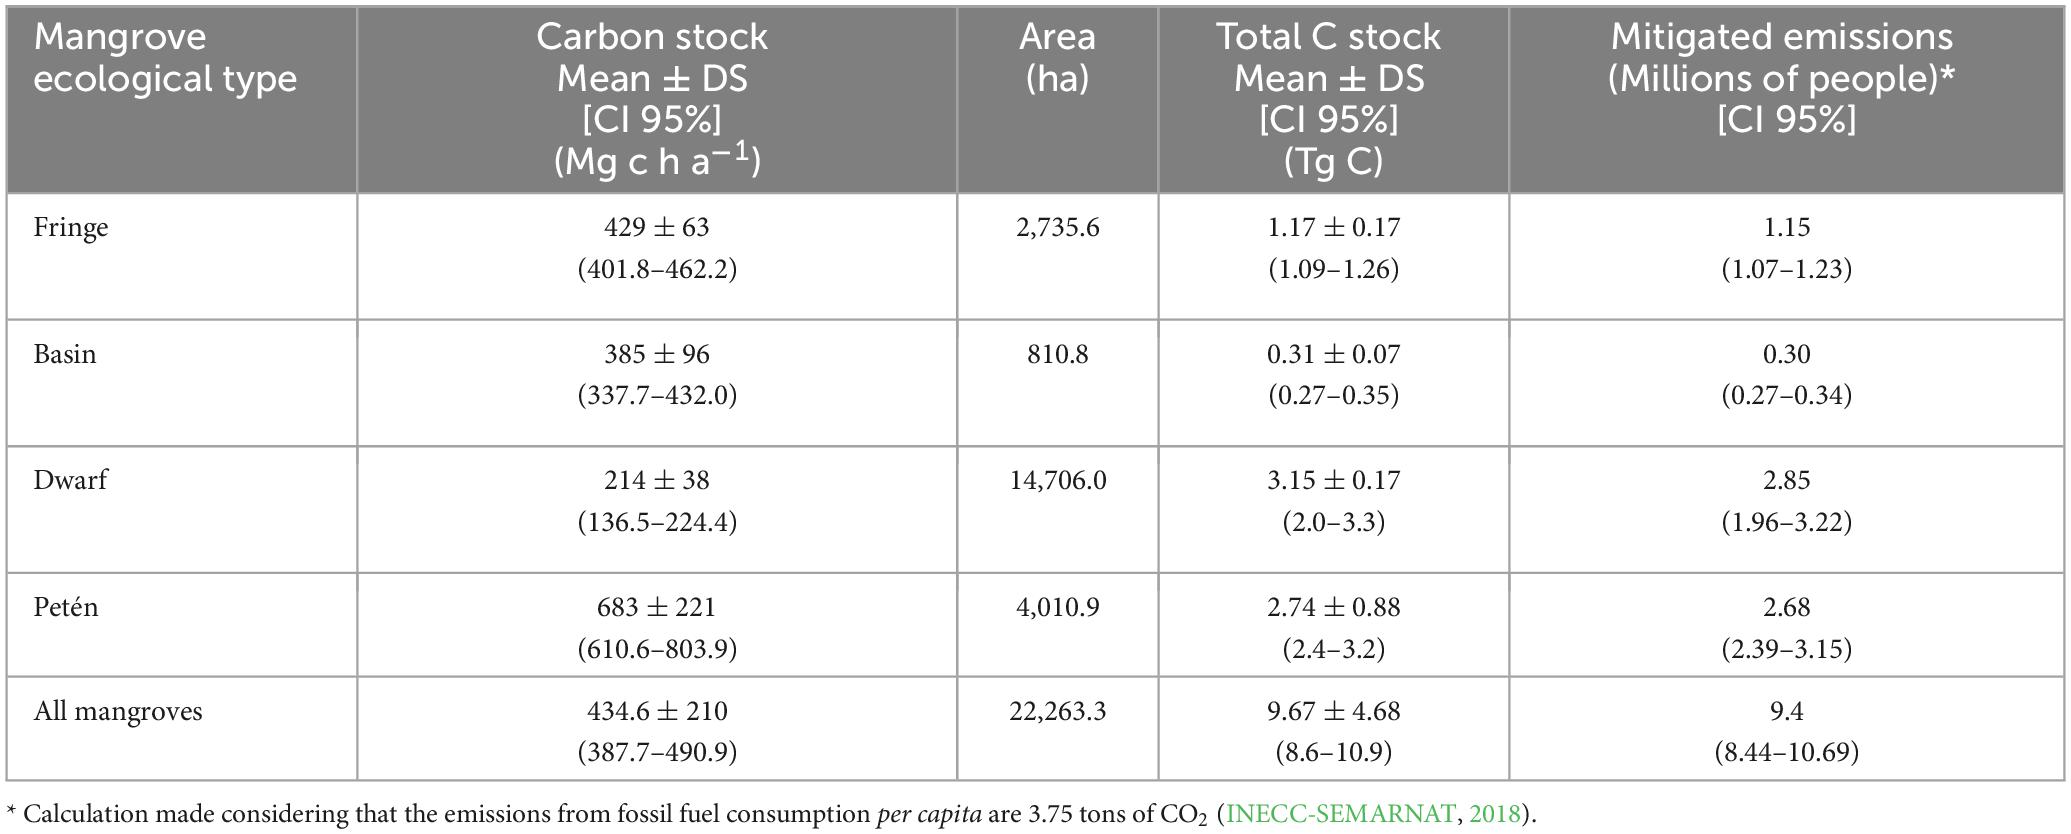
Table 4. Total carbon stock (Tg C) by ecological type in Celestun mangroves.
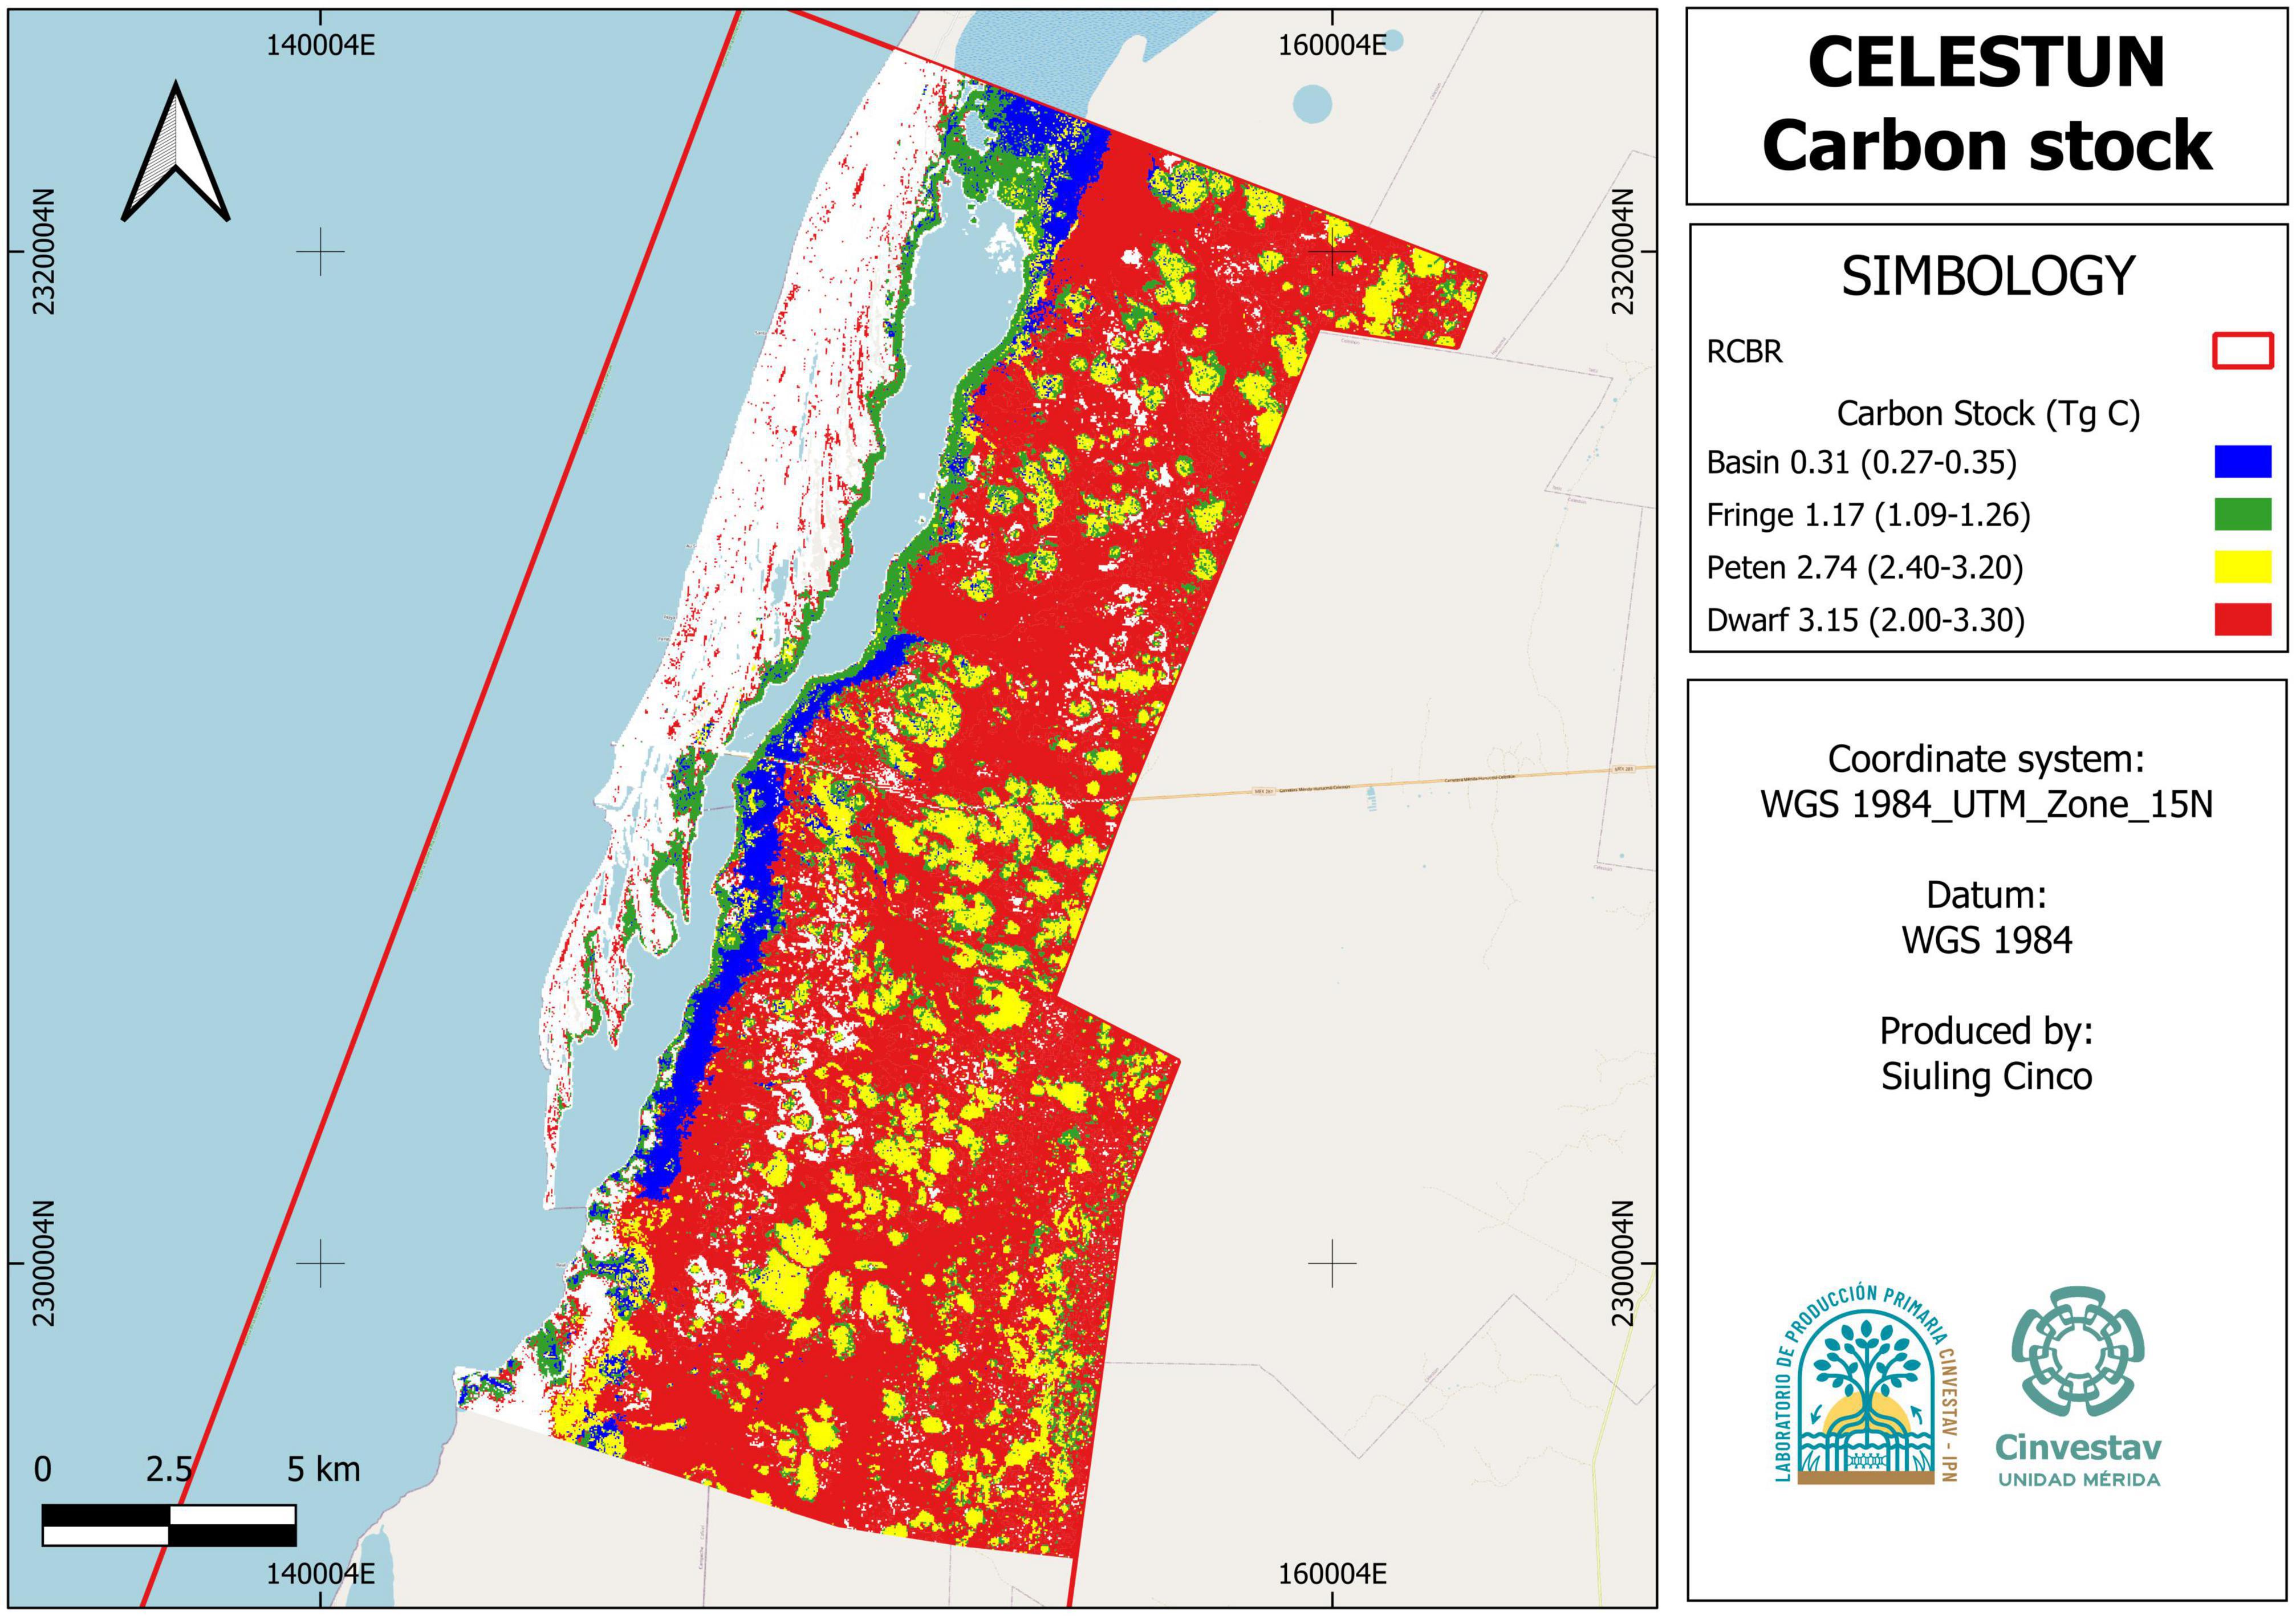
Figure 5. Spatial distribution of carbon stocks in Celestun mangroves.
4.6. Carbon emissions
The mangrove carbon stock in Celestun north represents 35.5 Mt CO2e, contributing to emissions offsets for more than 9.4 million people using fossil fuels per year in Mexico (Table 4). However, considering the official mangrove extension, the emission offsets are 29.8 Mt CO2e = 7.1 million people for CONABIO, 32.2 Mt CO2e = 7.6 million people for CONAFOR, and 29.3 Mt CO2e = 6.9 million people for INEGI. Considering that the mangrove deforestation rate in Celestun is approximately 12.14 ha year–1, the avoided emissions for mangrove conservation are 18,953 t CO2e annually. Thus, mangrove conservation in Celestun north is equivalent to mitigating the emissions generated by around 5,054 people who use fossil fuels in 1 year. Additionally, considering that conditions of mangrove deforestation rate (12.14 ha year–1) and the IPCC emission factor (7.9 t C ha year–1), mangrove loss in Celestun has a 10-year potential emissions of 3,500 t CO2e.
5. Discussion
The mean of the total ecosystem carbon stock in Celestun [434.6 (CI95% = 387.7–490.9) Mg C ha–1]. The mangrove carbon storage capacity is influenced by regional (climate, geology, sea level, hydrodynamics, coastal development, and meteorological phenomena) and local (microtopography and hydrology) factors (Fromard et al., 1998; Twilley, 1998; Jerath, 2012; Herrera-Silveira et al., 2014). According to our results, interstitial salinity and flood level are some of the main controllers of mangrove characteristics and carbon stocks because, at high concentrations, they act as a stressor for mangrove vegetation development (Cintrón, 1982). Salinity has been inversely related to survival rates, height, average growth rates, and the average total area of leaves (Kodikara et al., 2018) and influences the roots production in karstic environments (Medina-Calderón et al., 2021); therefore, we found an inverse relationship between this variable and carbon stocks (Figure 3). For example, in basin mangroves, salinity is high (Table 2), and tree growth and carbon stock are limited (Supplementary Figure C).
“Petenes” are a vegetation type formed by islands around a source of freshwater input (spring), which is rich in nitrates (Herrera-Silveira et al., 2014); therefore, the mangrove trees in these plant formations are in a medium of low water stress and nutrient richness, which favors the observed vegetation structure (Table 1). This was reflected in the higher carbon storage (Figure 2). These high stocks are also associated with the fact that, as they are the object of constant groundwater inputs, they remain flooded longer, which is evident when the redox potential is analyzed, i.e., it is more negative in “petén” mangroves (Table 2). The prolonged flood time favors the low decomposition of organic matter, which is incomplete and favors accumulation (Collins and Kuehl, 2000; Chmura et al., 2003; Hernández, 2010), suggesting that this hydrological variable controls the high potential carbon sequestration, indicating an autochthonous origin.
According to Bouillon et al. (2009), carbon in mangroves has two crucial components: forest biomass, which serves as a short-term reservoir (aboveground carbon), and carbon stored in soils (belowground carbon), which is a long-term reservoir. In this study, “petén” mangroves had an advantage over the other mangrove ecological types because they stored the most carbon in both components.
Fringe mangroves represent the second high value in carbon stock, followed by basin and dwarf mangroves. This behavior has also been observed in global and national carbon analysis (Estrada and Soares, 2017; Adame et al., 2018), in which storage and carbon sequestration vary according to the mangrove ecological types in a riverine environmental scenario, highlighting the importance of the hydroperiod and the characteristics of sediment at the local level in the variability of these stocks. In Celestun, mangroves are growing in a karstic geomorphology and semi-arid climate; these scenarios could suggest low carbon stocks. However, these differences are due to the hydrology of the zone (Twilley and Rivera-Monroy, 2005).
Dwarf mangroves have a low accumulation of aerial biomass; although they have low total carbon, they represent a vital carbon stock (Caamal-Sosa et al., 2012; Adame et al., 2013; Gutiérrez-Mendoza and Herrera-Silveira, 2015). Carbon storage in dwarf mangroves could be due to the predominantly karstic conditions, where phosphorus shortage limits the absorption of nutrients, whose availability is low in the absence of external contributions. In addition, the high salinity at some sites acts as a stressor, which prevents trees from reaching heights greater than 3 m, thus limiting the productivity of the ecosystem (Lovelock et al., 2011; Adame et al., 2012). However, the dwarf mangroves carbon stock is of great importance, given their large extent in the Yucatan Peninsula.
In this sense, in addition to its role in mitigating climate change by storing GHGs, physical characteristics, such as low heights and a high branch density provide the dwarf mangrove with advantages such as a better resistance to storms, floods, and changes in the tide (Zhang et al., 2012). This ecological stability could favor the accumulation of carbon in mangrove soils over time.
Mean C stock for mangroves in Celestun is less than estimated by Alongi (2020) and Kauffman et al. (2020) for mangroves across five continents (856 and 738.9 Mg C ha–1, respectively). Regionally, the mean C stock in Celestun is near to that reported for mangroves that also develop in the karst environments of the Yucatan Peninsula [663 ± 176 Mg C ha–1 (Adame et al., 2013) and 428 ± 201 Mg C ha–1 (Herrera-Silveira et al., 2017)]. These studies classified mangroves by height, which corresponds to the ecological types addressed in this study, highlighting that tallest mangroves have high values in carbon stock in above and belowground compartments (Supplementary Table D).
The mangroves carbon stock in the karstic ecosystem of Celestun responds to the hydrological dynamics associated with topography. The tidal range is relatively low (30–40 cm; Servicio Mareográfico Nacional [National Mareographic Service], 2019), causing a low flow/reflux of nutrients (Camacho-Rico and Herrera-Silveira, 2015), as well as an almost flat topography (SEMARNAT, 2000) in the zone. Therefore, the export of carbon produced in the same ecosystem should be low, remaining at the site and accumulating at different rates, mainly related to the flooding time in each mangrove type. This accumulation rate increases when more inland areas are characterized by different vegetation types (Moreno-Casasola et al., 2017). This information is reflected in the PCoA results, where the flood level explains the highest percentage (55.7%) of the variation in the total ecosystem carbon stocks through mangrove ecological types (Figure 3). In addition, this analysis has been shown to influence the physicochemical characteristics of water, mainly those related to the oxidation/reduction conditions (Mitsch and Gosselink, 2007; Niedermeier and Robinson, 2007).
Due to the differences between characteristics such as hydrology, resources, and stressors between mangroves influence by surface freshwater through rivers and those with groundwater discharge, stored carbon sources should be different (Rovai et al., 2018; Twilley et al., 2019; Kauffman et al., 2020; Taillardat, 2022). We must understand carbon and other nutrient sources, such as nitrogen, that accumulate in mangrove soils through stable isotope analyses (Gonneea et al., 2004). Carbon isotopes are used to know the energy transfer in ecosystems considering that organic material in sediments usually contains more carbon than the atmosphere and plant biomass; however, there is enrichment due to biological processes that yield 13C proportions similar to dominant vegetation (Peterson and Fry, 1987). Stable nitrogen isotopes permit the identification of whether organic matter sources are mainly related to anthropogenic activities (Ranjan et al., 2011; Hatje et al., 2020).
Knowing the sources of organic material accumulated in mangrove sediments allows us to use this information for management programs. The stable carbon isotope values for mangroves in this study ranged from –27.92 to –23.01%. These values have a wide range compared with the mangrove sediments evaluated, e.g., approximately –26% (Hatje et al., 2020), but they are consistent with the results of Mancera-Pineda et al. (2009), who also evaluated the isotopic composition of mangrove leaves. The difference in carbon isotopes in the sediments is related to the great diversity of mangroves in Celestun. Our analysis of the carbon sources determined that “petén” mangroves had the highest contribution of leaves to the carbon sediment (Supplementary Figure B). In “petén” mangroves, this hypothesis is supported by low interstitial salinities that favors high productivity; the leaves produced are accumulated and decomposed in situ, becoming part of the carbon soil due to the time of flooding in this mangrove. This indicates that the flooding time could be an important variable for organic carbon accumulation in mangrove ecosystems. These should be considered for management strategies as restoration programs if the objective is to accumulate as much carbon as possible as part of the carbon market advancement.
In contrast, the stable nitrogen isotope, 15N, is used to differentiate sources of nitrogen pollution in freshwaters, particularly those derived from human activities (Matiatos et al., 2021). The 15N values in mangrove forests are <1% (McKee et al., 2002), but the range in this study was 4.06–7.59%, values higher than those reported for Brazilian mangroves (Hatje et al., 2020). High values were obtained in the “petén” mangroves because sinkholes are their water source. These waters derive from inland areas that arrive at the mangroves in the coastal zone as groundwater, transporting nitrogen derived from municipal sewage, animal waste, and industrial and atmospheric sources. This 15N enrichment directly affects the ecosystem and contributes to global warming because mangroves may increase N2O fluxes to the atmosphere (Reis et al., 2017).
Autochthonous sediment sources characterize mangroves in the karstic scenario of Celestun, which indicates that accumulated carbon on surface sediments is produced “in situ,” most of which originate from mangrove leaves. The carbon source distinguishes them from other geomorphological scenarios in which carbon originates and accumulates in a different manner (Adame and Fry, 2016). An important aspect to highlight is the need for studies focused on identifying carbon routes in the ecosystem, which are essential for an understanding of the stocks and fluxes of this element and the ESs it represents. However, we must also consider that the stable isotope results reveal the sources of carbon accumulated in mangrove ecosystems. This information is key to designing suitable management strategies with a local approach if the source is autochthonous, or with a regional approach if the source is allocated considering the ecosystem’s connectivity. Most efforts to mitigate the effects of climate change have been focused on tropical and temperate forests. However, marine and coastal ecosystems can play important roles and contribute significantly considering that mangrove coverage loss and negative changes in its vegetation structure have reduced its carbon sequestration capacity. Additionally, in the absence of vegetation cover, the carbon stored in soils is released into the atmosphere, changing their functional role as net sinks to net emitters of greenhouse gases (Lovelock et al., 2011; Adame et al., 2015). In this sense, global emissions from mangrove loss are projected to reach 2,391 Tg CO2e by 2,100 (Adame et al., 2021). However, mangroves in the Celestun north area have a total organic carbon stock of 35.5 Tg CO2e, if the forest is conserved this carbon can remain stored. This value represents around 30% of the carbon pool in 67,263 ha of mangroves in the Sian Ka’an Biosphere Reserve (105.7 Tg CO2e; Herrera-Silveira et al., 2017). In terms of mitigation, this implies a significant contribution; however, under the current conditions of an accelerated loss of coastal ecosystems, mainly due to land use changes, it can represent a severe risk (Reis et al., 2017). The loss of Celestun mangroves adds to the atmosphere’s significant emissions, considering a conservative scenario in which 25% of the carbon is stored in the ecosystem (Pendleton et al., 2012).
The differences among official extensions of mangroves in the Celestun north area demonstrate that by underestimating the mangrove areas in the reserve, the emissions offset by the ecosystem are also underestimated. The same happens with the emissions estimates derived from mangrove loss. This shows that it is important to have activity data and emission factors at the local level to reduce the uncertainty of the estimates.
The Celestun mangrove forest provides valuable ecosystem services, such as aboveground and belowground carbon storage. This service makes mangroves ideal candidates for a part of the payment scheme for blue carbon ESs, also contemplating other services they provide (Lau, 2012), depending on the forest structure and function of each of the mangrove ecological types identified.
Hydrological, topographic, and physicochemical characteristics determine the mangrove type and sustain ecosystem dynamics. A change in topography or hydrology can change the condition of a mangrove. When a mangrove is degraded, we must consider restoration in the dynamics of carbon storage (Teutli-Hernández and Herrera-Silveira, 2016; Pech-Cárdenas and Herrera-Silveira, 2017). Carbon capture accelerates in the early stages of recovery (Zenteno-Díaz et al., 2016; Us-Balam et al., 2018), providing a service that can address voluntary carbon markets.
6. Conclusion
The distribution of the different mangrove ecological types is mainly due to patterns related to the hydrology and topography of the site; therefore, at Celestun, the mangroves of the dwarf type are the most extensive (14,706 ha).
The mean total ecosystem C stock in the Celestun mangroves is 434.6 [CI95% = 387.7–490.9] Mg C ha–1. Carbon stocks vary according to mangrove characteristics, with “petén” mangroves having the highest aboveground and belowground stocks.
The most significant variables that explain the differences in carbon storage in the different mangrove ecological types of Celestun are related to hydrology (salinity, flood level, and flooding time). Flooding time must be investigated, as well as the climatic seasons and their influence on the hydrological dynamics and physicochemical characteristics of the water.
Carbon dynamic acknowledgment support decisions related to the conservation and restoration of coastal ecosystems. However, emissions for mangrove deforestation and degradation are underestimated, but even with these numbers, mangrove conservation is urgent considering that the information currently generated highlights the importance of local data in regional and global carbon evaluations that consider spatial and temporal variations in mangrove structure, carbon and ecosystem services that provides.
Data availability statement
The original contributions presented in this study are included in the article/Supplementary material, further inquiries can be directed to the corresponding author.
Author contributions
SC-C carried out fieldwork, analyzed data, prepared figures and/or tables, and authored and reviewed drafts of the manuscript. JM performed the statistical analyses, created figures, and reviewed drafts of the manuscript. HH-N handled and analyzed the satellite images. JH-S authored and reviewed drafts of the article and approved the final draft. CTH contributed with the idea of the project that generated a part of the data and carried out fieldwork. All authors contributed to the article and approved the submitted version.
Conflict of interest
The authors declare that the research was conducted in the absence of any commercial or financial relationships that could be construed as a potential conflict of interest.
Publisher’s note
All claims expressed in this article are solely those of the authors and do not necessarily represent those of their affiliated organizations, or those of the publisher, the editors and the reviewers. Any product that may be evaluated in this article, or claim that may be made by its manufacturer, is not guaranteed or endorsed by the publisher.
Supplementary material
The Supplementary Material for this article can be found online at: https://www.frontiersin.org/articles/10.3389/ffgc.2023.1181542/full#supplementary-material
References
Acosta-Lugo, E., Alonzo-Parra, D., Andrade-Hernández, M., Castillo-Tzab, D., Chablé- Santo, J., Durán, R., et al. (2010). Plan de conservación de la Eco-región petenes-celestún-palmar. Campeche: Universidad Autónoma de Campeche, 184.
Adame, M. F., and Fry, B. (2016). Source and stability of soil carbon in mangrove and freshwater wetlands of the Mexican Pacific coast. Wetlands Ecol. Manage. 24, 129–137. doi: 10.1007/s11273-015-9475-6
Adame, M. F., Brown, C. J., Bejarano, M., Herrera-Silveira, J. A., Ezcurra, P., Kauffman, J. B., et al. (2018). The undervalued contribution of mangrove protection in Mexico to carbon emission targets. Conserv. Lett. 11:e12445. doi: 10.1111/conl.12445
Adame, M. F., Connolly, R. M., Turschwell, M. P., Lovelock, C. E., Fatoyinbo, T., Lagomasino, D., et al. (2021). Future carbon emissions from global mangrove forest loss. Glob. Chang. Biol. 2021, 2856–2866. doi: 10.1111/gcb.15571
Adame, M. F., Kauffman, J. B., Medina, I., Gamboa, J. N., Torres, O., Caamal, J. P., et al. (2013). Carbon stocks of tropical coastal wetlands within the karstic landscape of the Mexican Caribbean. PLoS One 8:e56569. doi: 10.1371/journal.pone.0056569
Adame, M. F., Santini, N. S., Tovilla, C., Vázquez-Lule, A., Castro, L., and Guevara, M. (2015). Carbon stocks and soil sequestration rates of tropical riverine wetlands. Biogeosciences 12, 3805–3818. doi: 10.5194/bg-12-3805-2015
Adame, M. F., Zaldívar-Jimenez, A., Teutli, C., Caamal, J. P., Andueza, M. T., López-Adame, H., et al. (2012). Drivers of mangrove litterfall within a karstic region affected by frequent hurricanes. Biotropica 45, 147–154. doi: 10.1111/btp.12000
Alongi, D. M. (2020). Global significance of mangrove blue carbon in climate change mitigation. Science 2020:67. doi: 10.3390/sci2030067
Batllori-Sampedro, E. (1995). “Problemática ambiental generada por el desarrollo costero de Yucatán,” in Procesos territoriales de Yucatán, ed. G. M. Peraza (Mérida: Editorial Universidad Autónoma de Yucatán).
Bhomia, R. K., Kauffman, J. B., and McFadden, T. N. (2016). Ecosystem carbon stocks of mangrove forests along the Pacific and Caribbean coasts of Honduras. Wetlands Ecol. Manage. 24:187. doi: 10.1007/s11273-016-9483-1
Bouillon, S., Borges, A. V., Castañeda-Moya, E., Diele, K., Dittmar, T., Duke, N. C., et al. (2008). Mangrove production and carbon sinks: A revision of global budget estimates. Global Biogeochem. Cycles 22:GB2013. doi: 10.1029/2007GB003052
Bouillon, S., Rivera-Monroy, V. H., Twilley, R. R., and Kairo, J. G. (2009). “Mangroves,” in The management of natural coastal carbon sinks, Vol. 53, eds D. Laffoley and G. Grimsditch (Gland: IUCN), 13–22.
Breithaupt, J. L., and Steinmuller, H. E. (2022). Refining the global estimate of mangrove carbon burial rates using sedimentary and geomorphic settings. Geophys. Res. Lett. 1:e2022GL100177. doi: 10.1029/2022GL100177
Caamal-Sosa, J. P., Zaldívar, A., Adame-Vivanco, F., Teutli, C., Andueza, M. T., Pérez, R., et al. (2012). “Almacenes de carbono en diferentes tipos ecológicos de manglares en un escenario cárstico,” in Estado Actual del conocimiento del ciclo del carbono y sus interacciones en México: Síntesis a 2011, eds F. Paz and R. Cuevas (Mexico: Autonomous University of the State of Mexico), 887.
Camacho-Rico, A., and Herrera-Silveira, J. (2015). “Dinámica de hojarasca y variación espacio temporal de carbono en un escenario cárstico como laguna de Celestun, Yucatán,” in Estado actual del conocimiento del ciclo del carbono y sus interacciones en México: Síntesis a 2014, eds F. Paz and J. Wong (México: Programa Mexicano del Carbono), 642.
Castañeda-Moya, E., Twilley, R. R., Rivera-Monroy, V. H., Marx, B. D., Coronado-Molina, C., and Ewe, M. L. S. (2011). Patterns of root dynamics in mangrove forests along environmental gradients in the Florida, Coastal Everglades, USA. For Peer Review. Baton Rouge, LA: Department of Oceanography and Coastal Sciences, School of the Coast and Environment, Louisiana State University.
Chmura, G. L., Anisfeld, S. C., Cahoon, D. R., and Lynch, J. C. (2003). Global carbon sequestration in tidal, saline wetland soils. Global Biogeochem. Cycles 17:1111. doi: 10.1029/2002GB001917
Cinco-Castro, S., Herrera-Silveira, J. A., and Comín, F. (2022). Sedimentation as a support ecosystem service in different ecological types of mangroves. Front. For. Glob. Change 5:733820. doi: 10.3389/ffgc.2022.733820
Cintrón, G. (1982). “Mangrove forests: Ecology and response to natural and man induced stressors,” in Poster at the Coral reefs, seagrass beds and mangroves: Their interaction in the coastal zones of the Caribbean. Working paper UNESCO/W.I.L.F.D.U./IOCARIBE, (St. Croix).
Collins, M. E., and Kuehl, R. J. (2000). “Organic matter accumulation and organic soils,” in Wetland soils: Genesis, hydrology, landscapes and classification, eds J. L. Richardson and M. J. Vepraskas (Boca Raton, FL: Lewis Publishers), 137–162. doi: 10.1201/9781420026238.ch6
CONABIO (2021). Distribución de los manglares en México en 2020, escala 1:50,000. México: Comisión Nacional para el Conocimiento y Uso de la Biodiversidad.
CONAFOR, (2018). Apoyos de restauración de manglar por el programa de compensación ambiental shape. Available online at: https://www.conafor.gob.mx/apoyos/index.php/inicio/app_apoyos#/detalle/2020/87 (accessed May 4, 2021).
Costanza, R., d’Arge, R., de Groot, R., Farber, S., Grasso, M., Hannon, B., et al. (1997). The value of the world’s ecosystem services and natural capital. Nature 387, 253–260. doi: 10.1038/387253a0
Cota-Lucero, T., and Herrera-Silveira, J. A. (2021). Seagrass contribution to blue carbon in a shallow karstic coastal area of the Gulf of Mexico. PeerJ 9:e12109. doi: 10.7717/peerj.12109
Daily, G. (1997). “Introduction: What Are Ecosystem Services?,” in Nature’s services: Societal dependence on natural ecosystems, ed. G. Daily (Washington, DC: Island Press).
Davison, A. C., and Hinkley, D. V. (1997). Bootstrap methods and their application, volume 1. Cambridge: Cambridge University Press.
Dean, W. E. (1974). Determination of carbonate and organic matter in calcareous sediments and sedimentary rocks by loss on ignition; comparison with other methods. J. Sediment. Res. 44, 242–248.
Estrada, G. C., and Soares, M. L. (2017). Global patterns of aboveground carbon stock and sequestration in mangroves. Anais Acad. Brasil. Ciências 89, 973–989. doi: 10.1590/0001-3765201720160357
Friess, D. A., Rogers, K., Lovelock, C. E., Krauss, K. W., Hamilton, S. E., Lee, S. Y., et al. (2019). The state of the world’s mangrove forests: Past, present, and future. Annu. Rev. Environ. Resourc. 44, 16.1–16.27. doi: 10.1146/annurev-environ-101718-033302
Fromard, F., Puig, H., Mougin, E., Marty, G., Betoulle, J. L., and Cadamuro, L. (1998). Structure, aboveground biomass and dynamics of mangrove ecosystems: New data from French Guiana. Oecologia 115, 39–53. doi: 10.1007/s004420050489
Goldberg, L., Lagomasino, D., Thomas, N., and Fatoyinbo, T. (2020). Global declines in human-driven mangrove loss. Global Change Biol. 2020, 5844–5855. doi: 10.1111/gcb.15275
Gonneea, M. E., Paytan, A., and Herrera-Silveira, J. (2004). Tracing organic matter sources and carbon burial in mangrove sediments over the past 160 years. Estuar. Coast. Shelf Sci. 61, 211–227. doi: 10.1016/j.ecss.2004.04.015
Gower, J. C. (1966). Some distance properties of latent root and vector methods used in multivariate analysis. Biometrika 53, 325–338. doi: 10.1093/biomet/53.3-4.325
Gutiérrez-Mendoza, J., and Herrera-Silveira, J. (2015). “Almacenes de carbono en manglares de tipo chaparro en un escenario cárstico,” in Estado actual del conocimiento del ciclo del carbono y sus interacciones en México: Síntesis a 2014, eds F. Paz and J. Wong (México: Programa Mexicano del Carbono), 639.
Hatje, V., Masqué, P., Patire, V. F., Dórea, A., and Barros, F. (2020). Blue carbon stocks, accumulation rates, and associated spatial variability in Brazilian mangroves. Limnol. Oceanogr. 66, 321–334. doi: 10.1002/lno.11607
Hernández, M. E. (2010). Suelos de humedales como sumideros de carbono y fuentes de metano. Terra Latinoam. 28, 139–147.
Herrera-Silveira, J. A. (1994). Spatial heterogeneity and seasonal patterns in a tropical coastal lagoon. J. Coast. Res. 10, 738–746.
Herrera-Silveira, J. A. (2006). Lagunas costeras de Yucatán (SE, México): Investigación, diagnóstico y manejo. Ecotropicos 19, 94–108.
Herrera-Silveira, J. A., Camacho, R. A., Pech, E., Pech, M., Ramírez, J., and Teutli, C. (2016). Dinámica del carbono (almacenes y flujos) en manglares de México. Terra Latinoam. 34, 61–72.
Herrera-Silveira, J. A., Camacho-Rico, A., Cinco-Castro, S., Caamal-Sosa, J., Mendoza-Martínez, J. E., and Borges-Miss, A. (2017). Producto 3: Evaluación de carbono azul en sitios piloto. Servicios de consultoría para la realización de un estudio para la identificación, caracterización y evaluación del balance entre las emisiones de GEIs y las zonas de captura y almacenamiento de carbono en zonas de ecosistemas costero/marinos del Pacífico, Golfo de México y la Península de Yucatán (Carbono azul). México: Programa Mexicano del Carbono.
Herrera-Silveira, J. A., Pech-Cardenas, M. A., Morales-Ojeda, S. M., Cinco-Castro, S., Camacho-Rico, A., Caamal Sosa, J. P., et al. (2020). Blue carbon of Mexico, carbon stocks and fluxes: A systematic review. PeerJ 8:e8790. doi: 10.7717/peerj.8790
Herrera-Silveira, J. A., Teutli-Hernández, C., Zaldívar-Jiménez, A., Pérez-Ceballos, R., Cortés-Balán, O., Osorio-Moreno, I., et al. (2014). Programa regional para la caracterización y el monitoreo de ecosistemas de manglar del Golfo de México y Caribe Mexicano: Península de Yucatán. Informe final SNIB-CONABIO, proyecto No. FN009. México: Centro de Investigación y de Estudios Avanzados-Mérida.
Holme, N. A., and McIntyre, A.D. (eds.) (1984). Methods for the study of marine benthos, 2nd Edn. Oxford: Blackwell Scientific Publications, 41–64.
Howard, J., Hoyt, S., Isensee, K., Telszewski, M., and Pidgeon, E. (eds.) (2014). Coastal blue carbon: Methods for assessing carbon stocks and emissions factors in mangroves, tidal salt marshes, and seagrasses. Arlington, VA: Conservation International, Intergovernmental Oceanographic Commission of UNESCO, International Union for Conservation of Nature.w
INECC-SEMARNAT (2018). Inventario nacional de emisiones de gases de efecto invernadero 1990-2015. México: INECC-SEMARNAT.wwwww
INEGI (2016). Uso de suelo y vegetación, escala 1:250,000, serie VI (continuo nacional), escala 1:250,000. México: Instituto Nacional de Estadística y Geografía.
IPCC (2003). 2013 Supplement to the 2006 IPCC guidelines for national greenhouse gas inventories: Wetlands, eds J. Penman, M. Gytarsky, T. Hiraishi, T. Krug, D. Kruger, R. Pipatti, et al. (Switzerland: IPPC).
IPCC (2014). Good practice guidance for land use, land-use change and forestry, eds J. Penman, M. Gytarsky, T. Hiraishi, T. Krug, D. Kruger, R. Pipatti, et al. (Switzerland: IPCC).
Jerath, M. (2012). An economic analysis of carbon sequestration and storage service by mangrove forests in everglades National Park, Florida. 2012. FIU Electronic Theses and Dissertations. Miami, FL: Florida International University, 702.
Kauffman, J. B., Adame, M. F., Arifanti, V. B., Schile-Beers, L. M., Bernardino, A. F., Bhomia, R. K., et al. (2020). Total ecosystem carbon stocks of mangroves across broad global environmental and physical gradients. Ecol. Monogr. 90:1405. doi: 10.1002/ecm.1405
Kauffman, J. B., and Donato, D. C. (2012). Protocols for the measurement, monitoring and reporting of structure, biomass and carbon stocks in mangrove forests. Working Paper 86. Bogor: CIFOR.
Kauffman, J. B., Hernandez Trejo, H., Jesus Garcia, M. C., Heider, C., and Contreras, W. M. (2016). Carbon stocks of mangroves and losses arising from their conversion to cattle pastures in the Pantanos de Centla, Mexico. Wetlands Ecol. Manage. 24:203. doi: 10.1007/s11273-015-9453-z
Kodikara, A. S., Jayatissa, L. P., Huxham, M., Dahdouh-Guebas, F., and Koedam, N. (2018). The effects of salinity on growth and survival of mangrove seedlings changes with age. Acta Bot. Brasil. 32, 37–46. doi: 10.1590/0102-33062017abb0100
Lau, W. W. Y. (2012). Beyond carbon: Conceptualizing payments for ecosystem services in blue forests on carbon and other marine and coastal ecosystem services. Ocean Coast. Manag. 83, 5–14. doi: 10.1016/j.ocecoaman.2012.03.011
Legendre, P., and Legendre, L. (2012). Developments in environmental modelling, Vol. 24. Amsterdam: Elsevier, 4.
Lewis, W. M. (1995). Wetlands: Characteristics and boundaries. National Research Council (US). Committee on Characterization of Wetlands. Washington, DC: Academies Press.
Lovelock, C. E., Bennion, V., Grinham, A., and Cahoon, D. R. (2011). The role of surface and subsurface processes in keeping pace with sea level rise in intertidal wetlands of Moreton Bay, Queensland, Australia. Ecosystems 14, 745–757. doi: 10.1007/s10021-011-9443-9
Lugo, A. E., and Snedaker, S. C. (1974). The ecology of mangroves. Annu. Rev. Ecol. Syst. 5, 39–64. doi: 10.1146/annurev.es.05.110174.000351
Macedo-Cruz, A., Pajares-Martinsanz, G., and Santos-Peñas, M. (2010). Clasificación no supervisada con imágenes a color de cobertura terrestre. Agrociencia 44, 711–722.
Mancera-Pineda, J. E., Twilley, R. R., and Rivera-Monroy, V. H. (2009). Carbon (δ13C) and nitrogen (δ15N) isotopic discrimination in mangroves in Florida Coastal Everglades as a function of environmental stress. Contrib. Mar. Sci. 38, 109–129.
Marois, D. E., and Mitsch, W. J. (2015). Coastal protection from tsunamis and cyclones provided by mangrove wetlands–a review. Int. J. Biodivers. Sci. Ecosyst. Serv. Manag. 11, 71–83. doi: 10.1080/21513732.2014.997292
Matiatos, I., Wassenaar, L. I., Monteiro, L. R., Venkiteswaran, J. J., Gooddy, D. C., Boeckx, P., et al. (2021). Global patterns of nitrate isotope composition in rivers and adjacent aquifers reveal reactive nitrogen cascading. Commun. Earth Environ. 2:52. doi: 10.1038/s43247-021-00121-x
Maza, M., Lara, J. L., and Losada, I. J. (2021). Predicting the evolution of coastal protection service with mangrove forest age. Coast. Eng. 168:103922. doi: 10.1016/j.coastaleng.2021.103922
McKee, K. L., Feller, I. C., Popp, M., and Wanek, W. (2002). Mangrove isotopic (δ15N and δ13C) fractionation across a Nitrogen vs. Phosphorus limitation gradient. Ecology 83, 1065–1075.
Medina-Calderón, J. H., Mancera-Pineda, J. E., Castañeda-Moya, E., and Rivera-Monroy, V. H. (2021). Hydroperiod and salinity interactions control mangrove root dynamics in a karstic oceanic Island in the Caribbean Sea (San Andres, Colombia). Front. Mar. Sci. 7:598132. doi: 10.3389/fmars.2020.598132
Menéndez, P., Losada, I. J., Torres-Ortega, S., Narayan, S., and Beck, M. W. (2020). The global flood protection benefits of mangroves. Sci. Rep. 10:4044.
Millennium Ecosystem Assessment [MEA] (2005). Ecosystems and human well-being: Current state & trends. Washington, DC: Island Press.
Mitsch, W. J., and Gosselink, J. G. (2007). Wetlands, 4th Edn. New York, NY: John Wiley & Sons, Inc, 582. doi: 10.1016/j.ecoleng.2008.08.011
Moreno-Casasola, P., Hernández, M. E., and Campos, C. A. (2017). “Hydrology, soil carbon sequestration and water retention along a coastal wetland gradient in the Alvarado Lagoon System, Veracruz, Mexico,” in Coastal Resilience: Exploring the Many Challenges from Different Viewpoints. Journal of Coastal Research, Special Issue No. 77, eds M. L. Martinez, A. Taramelli, and R. Silva (Coconut Creek, FL), 104–115.
Niedermeier, A., and Robinson, J. S. (2007). Hydrological controls on soil redox dynamics in a peat-based, restored wetland. Geoderma 137, 318–326. doi: 10.1016/j.geoderma.2006.08.027
Njana, M. A., Eliakimu Zahabu, E., and Malimbwi, R. E. (2018). Carbon stocks and productivity of mangrove forests in Tanzania. Southern Forests 80, 217–232. doi: 10.2989/20702620.2017.1334314
Oksanen, J., Blanchet, F. G., Friendly, M., Kindt, R., Legendre, P., McGlinn, D., et al. (2020). vegan: Community Ecology Package. R package version 2.5-7. Available online at: https://CRAN.R-project.org/package=vegan (accessed Octember 11, 2022).
Parnell, A. (2021). simmr: A Stable Isotope Mixing Model_. R package version 0.4.5. Available online at: https://CRAN.R-project.org/package=simmr (accessed June 16, 2022).
Pech-Cárdenas, M., and Herrera-Silveira, J. A. (2017). “Almacenes de carbono orgánico aéreo en manglares sometidos a perturbaciones naturales,” in Estado Actual del conocimiento del ciclo del carbono y sus interacciones en México: Síntesis a 2017, eds F. Paz and J. Wong (México: Programa Mexicano del Carbono), 639.
Pendleton, L., Donato, D. C., Murray, B. C., Crooks, S., Jenkins, W. A., Sifleet, S., et al. (2012). Estimating global “Blue Carbon” emissions from conversion and degradation of vegetated coastal ecosystems. PLoS One 7:e43542. doi: 10.1371/journal.pone.0043542
Peterson, B., and Fry, B. (1987). Stable isotopes in ecosystem studies. Ann. Rev. Ecol. Syst. 18, 293–320. doi: 10.1146/annurev.es.18.110187.001453
R Core Team (2022). R: A language and environment for statistical computing. Vienna: R Foundation for Statistical Computing.
Rahman, M. M., Nabiul Islam, Khan, N. I., Fazlul Hoque, A. K., and Hamed, I. (2015). Carbon stock in the Sundarbans mangrove forest: Spatial variations in vegetation types and salinity zones. Wetlands Ecol. Manage. 23:269. doi: 10.1007/s11273-014-9379-x
RAMSAR (2004). Ramsar sites information service, reserva de la biósfera ría celestún. Available online at: https://rsis.ramsar.org/ris/1333?language=en (accessed July 25, 2023).
Ranjan, R. K., Routh, J., Ramanathan, A., and Klump, J. V. (2011). Elemental and stable isotope records of organic matter input and its fate in the Pichavaram mangrove–estuarine sediments (Tamil Nadu. India). Mar. Chem. 126, 163–172. doi: 10.1016/j.marchem.2011.05.005
Reis, C. R. G., Nardoto, G. B., and Oliveira, R. S. (2017). Global overview on nitrogen dynamics in mangroves and consequences of increasing nitrogen availability for these systems. Plant Soil 410:1. doi: 10.1007/s11104-016-3123-7
Rijal, S., Zainal, F. A., and Badollahi, M. Z. (2020). Potential of mangrove forests as a tourism attraction: Case study in ideal mangrove forest, Tarowang, Jeneponto, South Sulawesi. PUSAKA 2, 153–159. doi: 10.33649/pusaka.v2i2.59
Rodríguez-Zúñiga, M. T., Villeda Chávez, E., Vázquez-Lule, A. D., Bejarano, M., Cruz López, M. I., Olguín, M., et al. (2018). Métodos para la caracterización de los manglares mexicanos: Un enfoque espacial multiescala. Ciudad de México: Comisión Nacional para el Conocimiento y Uso de la Biodiversidad, 272.
Ross, M. S., Ruiz, P. L., Telesnicki, G. J., and Meeder, J. F. (2001). Estimating aboveground biomass and production in mangrove communities of Biscayne National Park, Florida (USA). Wetlands Ecol. Manag. 9, 27–37. doi: 10.1023/A:1008411103288
Rovai, A. S., Twilley, R. R., Castañeda-Moya, E., Riul, P., Cifuentes-Jara, M., Manrow-Villalobos, M., et al. (2018). Global controls on carbon storage in mangrove soils. Nat. Clim. Change 8, 534–538. doi: 10.1038/s41558-018-0162-5
SEMARNAT (2000). Programa de manejo reserva de la biosfera ría celestún. México: Comisión Nacional de Áreas Naturales Protegidas, DF, 191.
Servicio Mareográfico Nacional [National Mareographic Service] (2019). Universidad nacional autónoma de México. Mexico City: Instituto de Geofísica.
Sherman, R. E., Fahey, T. J., and Martinez, P. (2003). Spatial patterns of biomass and aboveground net primary productivity in a mangrove ecosystem in the Dominican Republic. Ecosystems 6, 384–398.
Smith, T. J., and Whelan, K. R. T. (2006). Development of allometric relations for three mangrove species in South Florida for use in the Greater Everglades Ecosystem restoration. Wetlands Ecol. Manage. 14, 409–419. doi: 10.1007/s11273-005-6243-z
Taillardat, P. (2022). Going local: How coastal environmental settings can help improve global mangrove carbon storage and flux estimates. Geophys. Res. Lett. 49:e2022GL101979. doi: 10.1029/2022GL101979
Taillardat, P., Friess, D. A., and Lupascu, M. (2018). Mangrove blue carbon strategies for climate change mitigation are most effective at the national scale. Biol. Lett. 14:20180251. doi: 10.1098/rsbl.2018.0251
Teutli-Hernández, C., and Herrera-Silveira, J. A. (2016). “Chapter 20: Estrategias de restauración de manglares de México: El caso de Yucatán,” in Experiencias mexicanas en la restauración de los ecosistemas. Primera edición, eds E. Ceccon and C. Martínez-Garza (México: Universidad Nacional Autónoma de México, Centro Regional de Investigaciones Multidisciplinarias; Universidad Autónoma del Estado de Morelos; Ciudad de México: Comisión Nacional para el Conocimiento y Uso de la Biodiversidad), 577.
Twilley, R. R. (1998). “Mangrove wetlands,” in Southern forested wetlands: Ecology and management, eds M. G. Messina and W. H. Conner (Boca Raton, FL: Lewis Publishers), 445–473.
Twilley, R. R., Rovai, A. S., and Riul, P. (2019). Coastal morphology explains global blue carbon distributions. Front. Ecol. Environ. 16:503–508. doi: 10.1002/fee.1937
Twilley, R., and Rivera-Monroy, V. (2005). Developing performance measures of mangrove wetlands using simulation models of hydrology, nutrient biogeochemistry, and community dynamics. J. Coast. Res. 40, 79–93.
Us-Balam, H. G., Herrera-Silveira, J. A., Teutli-Hernández, C., and Caamal-Sosa, J. P. (2018). “Almacén y captura de carbono aéreo por Rhizophora mangle y Avicennia germinans en una zona de restauración ecológica,” in Estado actual del conocimiento del ciclo del carbono y sus interacciones en México: Síntesis a 2018. Serie síntesis nacionales, eds F. Paz, A. Velázquez, and M. Rojo (México: Programa Mexicano del Carbono en colaboración con el Instituto Tecnológico de Sonora), 686.
Villajos, S. O. (2006). Teledetección fundamental. Madrid: Escuela Universitaria de Ingenieria Técnica Topográfica, Universidad Politécnica.
Wicaksono, P., and Hafizt, M. (2018). Dark target effectiveness for dark-object subtraction atmospheric correction method on mangrove aboveground carbon stock mapping. IET Image Process. 12, 582–587. doi: 10.1049/iet-ipr.2017.0295
Zenteno-Díaz, K., Teutli-Hernández, C., Herrera-Silveira, J. A., and Caamal-Sosa, J. P. (2016). “Captura de carbono en diferentes manglares restaurados de la Península de Yucatán,” in Estado Actual del conocimiento del ciclo del carbono y sus interacciones en México: Síntesis a 2016. Serie síntesis nacionales, eds F. Paz and R. Torres (México: Programa Mexicano del Carbono en colaboración con la Universidad Autónoma del Estado de Hidalgo), 732.
Zhang, K., Liu, H., Li, Y., Xu, H., Shen, J., Rhome, J., et al. (2012). The role of mangroves in attenuating storm surges. Estuar. Coast. Shelf Sci. 102–103, 11–23. doi: 10.1016/j.ecss.2012.02.021
Keywords: blue carbon, climate change, karstic environments, ecosystem services, mangrove types
Citation: Cinco-Castro S, Herrera-Silveira J, Montero Muñoz JL, Hernández-Nuñez H and Teutli Hernández C (2023) Carbon stock in different ecological types of mangroves in a karstic region (Yucatan, México): an opportunity to avoid site scale emissions. Front. For. Glob. Change 6:1181542. doi: 10.3389/ffgc.2023.1181542
Received: 07 March 2023; Accepted: 18 July 2023;
Published: 10 August 2023.
Edited by:
Taku Tsusaka, Ostrom, ThailandReviewed by:
Abhra Chanda, Jadavpur University, IndiaKangkuso Analuddin, Halu Oleo University, Indonesia
Aroloye Numbere, University of Port Harcourt, Nigeria
Copyright © 2023 Cinco-Castro, Herrera-Silveira, Montero Muñoz, Hernández-Nuñez and Teutli Hernández. This is an open-access article distributed under the terms of the Creative Commons Attribution License (CC BY). The use, distribution or reproduction in other forums is permitted, provided the original author(s) and the copyright owner(s) are credited and that the original publication in this journal is cited, in accordance with accepted academic practice. No use, distribution or reproduction is permitted which does not comply with these terms.
*Correspondence: Siuling Cinco-Castro, c2djaW5jb0Bob3RtYWlsLmNvbQ==