 Iereh Kim
 Myeongja Kwak
 Juyeong Kim
 Suyoung Woo
- Department of Environmental Horticulture, University of Seoul, Seoul, Republic of Korea
Because Pinus koraiensis and Chamaecyparis obtusa are key species for economic forest plantations in Korea, understanding their responses to elevated CO2 is critical for future forest planning. Using seedlings grown in a controlled phytotron environment, we examined gas exchange, chlorophyll fluorescence, photopigment contents and biomass under elevated CO2 conditions. Initially, both species showed no significant differences in net photosynthesis (Anet). P. koraiensis prioritized leaf structural development and showed CO2 induced stress, reflected in altered chlorophyll fluorescence, before showing enhanced photosynthesis following leaf maturation. C. obtusa initiated early biochemical adjustments, indicated by increased biochemical parameters of photosynthesis (maximum carboxylation rate, Vcmax; electron transport capacity, Jmax; and triose phosphate utilization, TPU), yet required more time for these changes to result in higher photosynthetic rates. By the mid-stage, both species under elevated CO2 surpassed ambient conditions in Anet, their ability to capitalize on elevated CO2. As seasonal dormancy begins, C. obtusa exhibited reduced physiological activity and a decline in photosynthetic rates. Notably, enhanced biochemical traits did not translate into increased biomass in either species, likely due to nutrient constraints or elevated respiratory costs. Meanwhile, P. koraiensis exhibited an overall increase in photosynthesis at later stages, mainly driven by developmental timing rather than CO2 itself. These findings underscore species-specific acclimation patterns and suggest that P. koraiensis may be more suited to benefit from future CO2 enrichment than C. obtusa, informing targeted strategies in climate-resilient forest management.
1 Introduction
The continued rise in atmospheric CO2 concentrations due to anthropogenic climate change presents substantial challenges to forest ecosystems and plantation forestry. Under the high-emission SSP5-8.5 scenario, CO2 levels are projected to surpass 550 ppm by 2050 and reach 900 ppm by 2100 (Intergovernmental Panel on Climate Change, 2021). Such increases are expected to have complex and species-specific effects on forest physiology, structure, and productivity (Petritan and Beloiu Schwenke, 2023). Therefore, forest management strategies must be adapted to projected CO2 conditions and associated ecological constraints.
Elevated CO2 generally enhances photosynthetic rates (Anet) and water use efficiency (WUE) in C3 plants (Creydt et al., 2019; Soba et al., 2020; Souza et al., 2019; Wahidah et al., 2017). However, these initial enhancements often diminish over time due to physiological acclimation (Byeon et al., 2021; Mendela et al., 2022). One of the major drivers of this decline is nutrient limitation, particularly nitrogen. Reductions in leaf nitrogen content under elevated CO2 are known to impair photosynthetic efficiency, limiting the sustainability of CO2 fertilization effects (Mendela et al., 2022). Mechanistically, elevated atmospheric CO2 concentrationsmay suppress nitrate uptake and assimilation pathways, thereby lowering nitrogen use efficiency and accelerating acclimation of the photosynthetic apparatus (Gojon et al., 2023). Elevated CO2 alters leaf phenology, induces photosynthetic downregulation, and causes nutrient dilution, all of which contribute to the decoupling of carbon assimilation from biomass production and complicate predictions of long-term forest growth. These responses are modulated by interactions with local conditions such as photoperiod, soil moisture, and temperature (Li et al., 2019; Inoue et al., 2020). As a result, the direction and magnitude of phenological shifts vary across species (Tang et al., 2023), introducing additional uncertainty into projections of forest productivity and carbon sequestration potential.
Such variability in physiological responses not only complicates ecological interpretation but also undermines the reliability of long-term forest modeling. To address this gap, species-specific datasets from CO2 enrichment experiments are essential. These empirical inputs inform dynamic global vegetation models (DGVMs) and silvicultural simulations by providing mechanistic parameters such as photosynthetic capacity, nutrient responsiveness, and phenological timing. Accurate calibration of such models is crucial for predicting species composition, carbon fluxes, and forest dynamics under future climate scenarios.
Despite extensive research on CO2 responses, most studies have focused on annual crops or broadleaf species (Brisebois and Major, 2024; Lee et al., 2020b; Yu et al., 2023). Large-scale CO2 enrichment experiments, such as FACE, have concentrated on economically important species in North America (Pinus taeda), Europe (Quercus robur), and Australia (Eucalyptus spp.) (Crous et al., 2021; Gardner et al., 2022; Rogers and Ellsworth, 2002). In contrast, few studies have investigated East Asian conifers, particularly those with distinct phenological strategies.
Pinus koraiensis (Korean pine) and Chamaecyparis obtusa (Japanese cypress) are two of the primary afforestation species recommended by the Korea Forest Service (2018). P. koraiensis is a slow-growing, cold-adapted species valued for its high-quality timber and ecological role in subalpine forests (Shin and Lee, 1990; Kim et al., 2020; Pang et al., 2011). C. obtusa, on the other hand, is a fast-growing species with ornamental and commercial value, thriving in milder climates (Ishii, 1991). Their phenological traits also differ: P. koraiensis exhibits synchronous leaf development, whereas C. obtusa follows a sequential pattern with extended leaf growth over the season (Ahn and Lim, 2022; Zhang et al., 2023). These contrasting phenological traits suggest species-specific responses to CO2 enrichment.
We hypothesize that P. koraiensis (Korean pine) and C. obtusa (Japanese cypress) will exhibit distinct physiological responses to elevated CO2 due to differences in their leaf development timing: synchronous leaf growth in P. koraiensis vs. sequential leaf growth patterns in C. obtusa. Specifically, P. koraiensis may experience a delayed realization of photosynthetic benefits due to the slower structural maturation of early leaves. In contrast, C. obtusa is expected to adapt more quickly through early biochemical responses, though these advantages may diminish as it enters dormancy during the late growth stage. This study aims to elucidate species-specific physiological adaptation mechanisms to elevated CO2 by analyzing the contrasting responses of P. koraiensis and C. obtusa. To achieve this, key physiological and biochemical parameters such as photosynthetic rate, chlorophyll fluorescence, photopigment content, and biomass were analyzed.This study is expected to provide valuable insights into species-specific physiological responses to elevated CO2, contributing to a deeper understanding of adaptation mechanisms in conifers with contrasting phenological traits. The findings will serve as a foundation for afforestation planning and carbon sequestration in response to future climate change scenarios.
2 Materials and methods
2.1 Experimental setup and environmental conditions
The experimental tree species were Korean pine (Pinus koraiensis Siebold & Zucc.) and Japanese cypress [Chamaecyparis obtusa (Siebold & Zucc.) Endl.]. The P. koraiensis seedlings were 5 years old (1-1-3, indicating 1 year in the seedbed, 1 year in the first transplant bed, and 3 years in the field), with an average height of 102.3 cm (±6.32) and a root collar diameter of 14.63 mm (±1.72). The C. obtusa seedlings were 3 years old (1-1-1, indicating 1 year in the seedbed, 1 year in the first transplant bed, and 1 year in the field), with an average height of 100.3 cm (±9.69) and a root collar diameter of 11.03 mm (±1.61). Both species were cultivated at a nursery in Gyeonggi Province, South Korea, prior to the experiment.
On April 5, 2024, the seedlings were transported to Seoul, South Korea, where they were transplanted into 8 L plastic pots. The potting medium used was a commercial forest soil mixture comprising cocopeat (24.8%), peat moss (25%), perlite (25%), and vermiculite (25%). On April 16, 2024, 10 seedlings per species were moved into separate phytotron chambers (1.5 × 1.5 × 2.0 m; Koito Industries, Yokohama, Japan), which were natural light-type units designed to control temperature, humidity, and CO2 levels, ensuring consistency throughout the experiment.
Environmental conditions were carefully regulated to meet experimental requirements. Temperature settings were adjusted based on seasonal variations: from April 26 to July 14, daytime (8:00–20:00) and nighttime (21:00–7:00) temperatures were maintained at 20°C and 15°C, respectively. From July 15 to August 10, the daytime and nighttime temperatures were raised to 25°C and 20°C, respectively, representing a 5°C increase. The relative humidity was maintained at 50–60% throughout the experiment, monitored using the phytotron control system and a HOBO MX2301A data logger (ONSET Computer Corporation, USA). Light intensity was measured using a quantum sensor (PQ-500, Apogee Instruments, Logan, UT, USA). Maximum light intensity, recorded between 12:00 and 14:00, reached ~1,500 μmol m−1 s−1 (PPFD).
The CO2 concentration in the phytotron chamber was monitored and regulated using an integrated CO2 control system (ZFU-DF23, Fuji, Tokyo, Japan) installed in the chamber control unit. High-purity CO2 gas (99.99%) was supplied from 47 L cylinders and delivered through PTFE tubing to the control system. The ZFU-DF23 maintained CO2 levels in real time using a mass flow controller (MFC). This closed-loop system minimized fluctuations, ensuring consistent 24-h control (Figure 1).
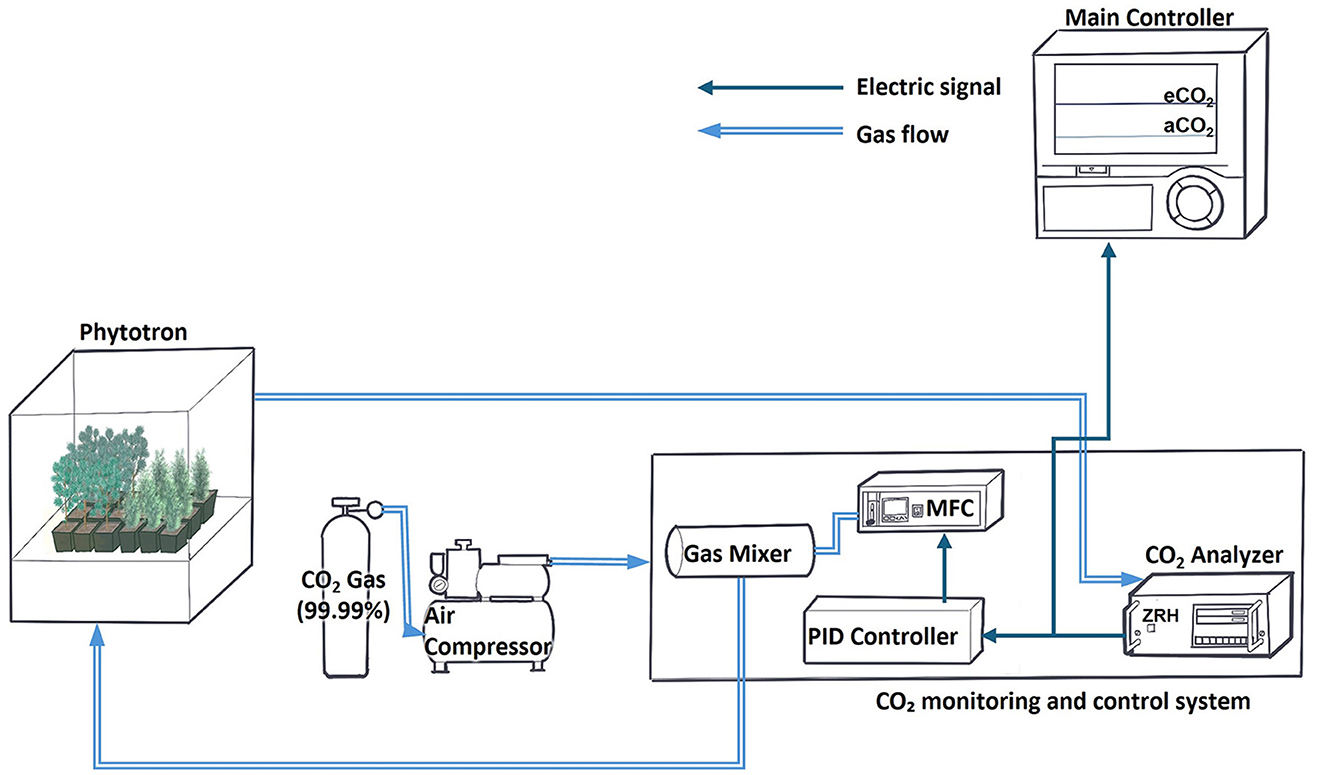
Figure 1. Schematic diagram of CO2 regulation inside the phytotron.
For the CO2 treatment, the ambient CO2 condition (aCO2) was set at 400 ppm as the control, while the elevated CO2 condition (eCO2) was applied as the treatment. During the baseline acclimation period (April 16–May 26), both chambers were maintained at 400 ppm CO2 for baseline acclimation. Starting in the 1st week of treatment (May 27), the eCO2 chamber was set to 550 ppm, while the aCO2 chamber remained at 400 ppm. From the 4th week of treatment (June 19), the CO2 concentration in the eCO2 chamber was elevated further to 900 ppm, while the aCO2 chamber continued to be maintained at 400 ppm. Daily, the chamber doors were opened for 10–20 min at 8:40 a.m. to allow ventilation.
Irrigation was performed weekly with 3 L of water per pot, corresponding to the field capacity of the soil, to provide sufficient moisture while avoiding waterlogging. Pots were randomized weekly within the chambers to minimize positional effects. No fertilizers or additional supplements were applied during the experimental period.
2.2 Gas exchange and leaf area normalization
Gas exchange measurements were conducted using a LI-6400XT Portable Photosynthesis System (LI-COR Biosciences, Lincoln, NE, USA). Net CO2 assimilation rate vs. intercellular CO2 concentration (A/Ci) response curves were generated by adapting the seedlings to a series of CO2 concentrations (0, 30, 80, 100, 400, 550, 900, and 1,200 μmol mol−1). The flow rate inside the leaf chamber, block temperature, chamber humidity, and photosynthetic photon flux density (PPFD) were maintained at 500 μmol s−1, 25°C, 50–60%, and 1,500 μmol m−2 s−1, respectively. Three time points were selected for measurements: during the 3rd week, 6th week, and 10th week of the experiment, between 08:00 and 13:30.
The A/Ci response curves were used to estimate key photosynthetic parameters, including the maximum carboxylation rate (Vcmax), maximum electron transport rate (Jmax), triose phosphate utilization (TPU), and carboxylation efficiency (CE). Vcmax, Jmax, and TPU were calculated using the biochemical model of photosynthesis described by Farquhar et al. (1980) and modified by Long and Bernacchi (2003). CE was determined following the method outlined by Tenhunen et al. (1984).
Additionally, at a CO2 concentration of 400 μmol mol−1, gas exchange parameters, including net assimilation rate (Anet), stomatal conductance (gs), transpiration rate (Tr), and water use efficiency (WUE), were measured following the methods of Kwak et al. (2011). All gas exchange measurements were conducted on needle pairs positioned 3 to 5 nodes below the shoot apex. Six time points were selected for measurements: initial, 1st week, 2nd week, 4th week, 5th week and 10th week of the experiment, between 08:00 and 13:30.
To normalize gas exchange parameters, leaf area was measured for both species after gas exchange measurements. For P. koraiensis, needle width was set at 1 mm based on typical dimensions, and individual needle lengths were measured. Total leaf area was calculated by multiplying the width by the measured lengths of all needles placed inside the chamber. For C. obtusa, leaves were excised and photographed on a white background with a size reference scale. Photoshop software (Adobe, San Jose, CA, USA) was used to calculate total leaf area.
The actual leaf area enclosed within the Li-6400XT chamber was measured and used to normalize all gas exchange parameters, ensuring that Vcmax, Jmax, TPU, CE, Anet, gs, Tr, and WUE were expressed on a per-leaf-area basis. This normalization allowed for accurate comparisons of physiological responses between species and treatments.
2.3 Photosynthetic pigments and chlorophyll fluorescence
The contents of Chl a (chlorophyll a), Chl b (chlorophyll b), Total Chl (total chlorophyll), and Car (carotenoid) were measured following the methods described by Arnon (1949) and Lichtenthaler and Buschmann (2001). Fresh leaves were harvested in the afternoon on the photosynthesis measurement days of the 3rd and 6th weeks. Samples were taken from the needle pairs located 3–5 below the shoot apex. 0.1 g of leaf samples were placed into 10 mL brown vials containing 10 mL of 80% (v/v) acetone. The samples were kept at 4°C for 2 weeks to extract pigments. Absorbance at wavelengths of 663 nm, 645 nm, and 470 nm was measured using a microplate reader (Synergy H1, BioTek, Winooski, VT, USA). The pigment contents were calculated using the following Equation 1.
Chlorophyll fluorescence was analyzed using a portable chlorophyll fluorescence meter (Pocket PEA, Hansatech Instruments Ltd., Norfolk, UK). Measurements were conducted between 2:00 p.m. and 3:00 p.m., immediately after photosynthesis measurements in the 3rd and 6th weeks, using needles located 3–5 below the shoot apex. Ten seedlings in each treatment group were selected for measurement, with leaves dark-adapted for 20 min using leaf clips. Chlorophyll fluorescence was induced by applying a saturating red-light pulse (627 nm) with an intensity of 3,500 μmol m−2 s−1 for 1 s. Fluorescence parameters, including the maximum quantum efficiency of PSII photochemistry (Fv/Fm), the performance index on an absorption basis (PIABS), absorption flux per reaction center (ABS/RC), dissipated energy flux per reaction center (DIo/RC), trapped energy flux per reaction center (TRo/RC), electron-transport flux per reaction center (ETo/RC), electron flux reducing end acceptors at PSI per reaction center (REo/RC), absorption flux per excited cross-section (ABS/CSo). dissipated energy flux per excited cross-section (DIo/CSo), trapped energy flux per excited cross-section (TRo/CSo), electron-transport flux per excited cross-section (ETo/CSo) and electron flux reducing end acceptors at PSI per excited cross-section (REo/CSo) were calculated using Pocket PEA software (PEA Plus V1.10, Hansatech Instruments Ltd., UK) based on the equations described by Strasser et al. (2004).
2.4 Biomass measurements
Relative increase in height and root collar diameter was derived from measurements of height and root collar diameter taken 1 week before the treatment began (May 20) and during the 7th week of the experiment (July 12). The initial measurement provided a baseline for growth comparisons, ensuring that any observed differences reflected the experimental conditions (Poorter and Navas, 2003). Plant height was measured from the soil surface to the tip of the tallest leaf using a folding ruler (No. 981012-12, Standardgraph, Stadtallendorf, Germany). Root collar diameter was measured just above the soil surface using a digital caliper (CD-15DC, Mitutoyo Corporation, Kawasaki, Japan). Relative increase in height and root collar diameter was calculated using the following formula Equation 2, where ln represented the natural logarithm:
Here, S1 and S2 represented the measured parameter (height or root collar diameter) at the initial (t1) and final (t2) time points (May 20 and July 12, respectively), and t2 – t1 = 53 days denoted the time interval in days (Hoffmann and Poorter, 2002).
Fresh and dry biomass were assessed on August 29, at the conclusion of the experiment. Five seedlings per treatment group were harvested and separated into leaves, branches, and roots. Fresh weight was recorded immediately after harvesting. The samples were then oven-dried at 85°C until reaching a constant weight to determine dry biomass. Leaf, branch, shoot, and root biomass were calculated, and the root-to-shoot ratio (R/S) was derived to assess biomass allocation between below ground and aboveground components.
2.5 Statistical analysis
Statistical analyses were performed using R software (version 4.4.1; R Core Team, Vienna, Austria). For all datasets, the assumption of variance homogeneity was assessed using Levene's test, and either independent t-tests or Welch's t-tests were applied accordingly.
Among chlorophyll fluorescence parameters, Fv/Fm and PIABS were analyzed using both appropriate t-tests (independent or Welch's) and two-way ANOVA to evaluate the effects of CO2 treatment and measurement time. Other fluorescence parameters (e.g., ABS/RC, DIo/RC, TRo/RC, ETo/RC, REo/RC, ABS/CSo, DIo/CSo, TRo/CSo, ETo/CSo, REo/CSo) were analyzed using only independent t-tests or Welch's t-tests, depending on variance homogeneity.
For physiological and biochemical parameters (e.g., Anet, gs Vcmax, Jmax, pigment content, etc.), both two-way ANOVA and appropriate t-tests were conducted to evaluate treatment effects. Biomass-related data (relative increase in height and root collar diameter, fresh and dry biomass, shoot/root ratio) were analyzed using independent t-tests or Welch's t-tests only.
Sample sizes varied by trait and species. Fluorescence data were collected from 10 seedlings per treatment. Gas exchange and enzyme parameters (e.g., Vcmax, Jmax) were measured on 4–5 replicates. Biomass traits were assessed from 5 individuals, and relative increase in height and root collar diameter was calculated using 6–9 replicates. Pigment concentrations were analyzed based on 17–20 samples per group. To enhance data reliability, sample sizes were progressively increased across experimental rounds, resulting in variation in the number of replicates per trait.
3 Results
3.1 Gas exchange responses: delayed vs. rapid acclimation
P. koraiensis showed minimal early response to eCO2, with no significant differences in Anet, gs, or Tr during the initial weeks. However, by the 5th week, all parameters increased significantly under eCO2 (p < 0.05 for Anet and gs; p < 0.01 for Tr), indicating a delayed photosynthetic response (Figures 2A–C). In contrast, WUE was initially higher under aCO2 at the 2nd week (p < 0.001), but became significantly higher under eCO2 by the 4th week (p < 0.01) (Figure 2D).
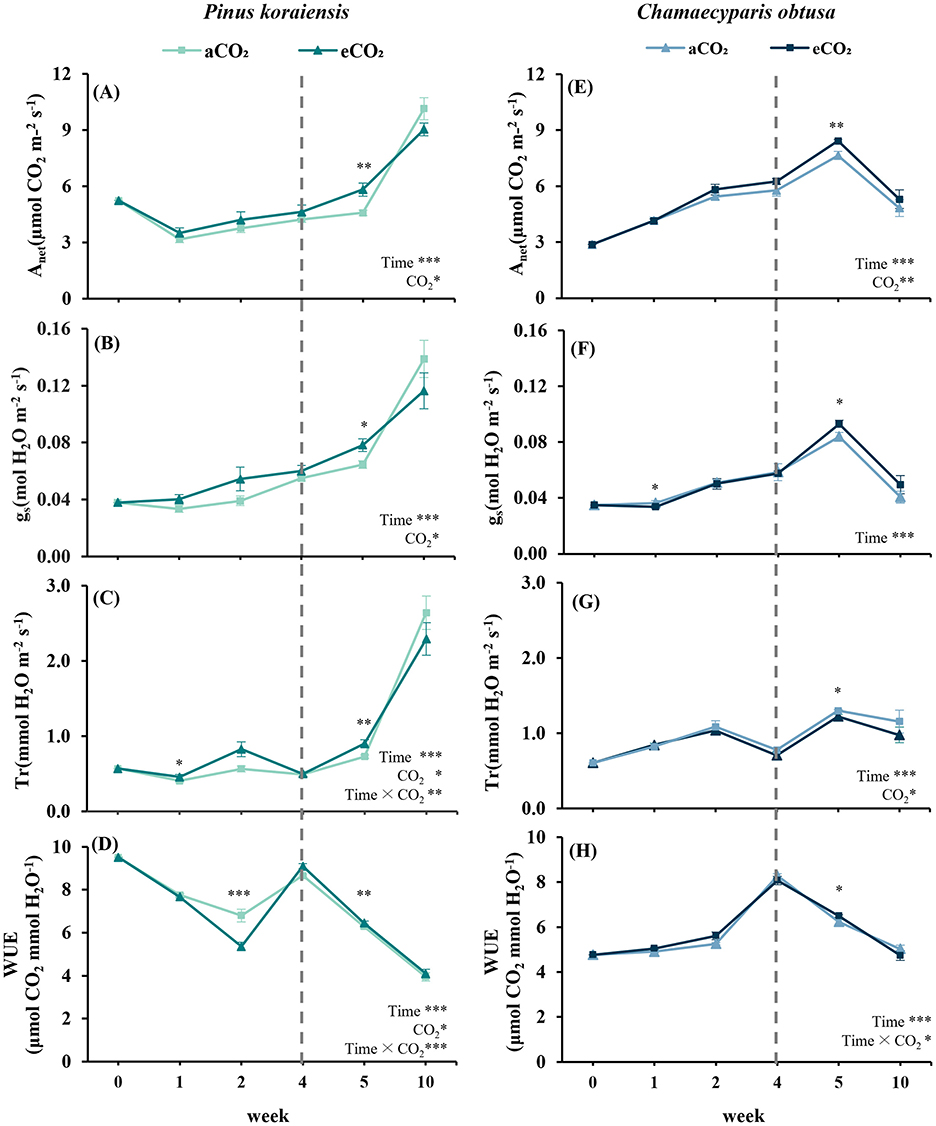
Figure 2. Gas exchange capacity of Pinus koraiensis (A–D) and Chamaecyparis obtusa (E–H) at different time points under CO2 concentration treatments (aCO2: 400 ppm, eCO2: Week 3: 550 ppm; Week 4–10: 900 ppm). (A, E) Net photosynthesis rate (Anet); (B, F) stomatal conductance (gs); (C, G) transpiration rate (Tr); (D, H) water use efficiency (WUE). A vertical dashed line indicates the point at which eCO2 levels increased from 550 to 900 ppm. Error bars indicate the standard error of the mean. Significant factors for each variable are indicated at the bottom right of each graph. “Time” represents the main effect of the measurement period, “C2” indicates the main effect of CO2, and the “×” symbol denotes the interaction between factors. The “*” symbol indicates a significant difference between the control (aCO2) and treatment (eCO2) groups (*p ≤ 0.05, **p ≤ 0.01, ***p ≤ 0.001).
In C. obtusa, Anet and gs were both significantly higher under eCO2 at the 5th week (p < 0.01 for Anet ; and p < 0.05 for gs), accompanied by a peak in WUE (p < 0.05). All gas exchange parameters declined by the 10th week, implying seasonal acclimation or physiological downregulation (Figures 2E–H). Meanwhile, Anet in P. koraiensis significantly increased under both conditions by the 10th week but showed no treatment difference, possibly reflecting late-stage structural maturation.
3.2 Biochemical activation and temporal modulation of photosynthetic machinery
P. koraiensis exhibited no treatment effect on Vcmax, Jmax, TPU, or CE across the entire experimental period, indicating limited biochemical responsiveness to elevated CO2. Nevertheless, a significant increase in all parameters emerged by the 10th week, regardless of CO2 condition, suggesting a strong temporal effect (p < 0.001), likely driven by internal developmental progression (Figures 3A–D). This pattern points to delayed activation of photosynthetic machinery rather than a direct stimulation by CO2 enrichment.
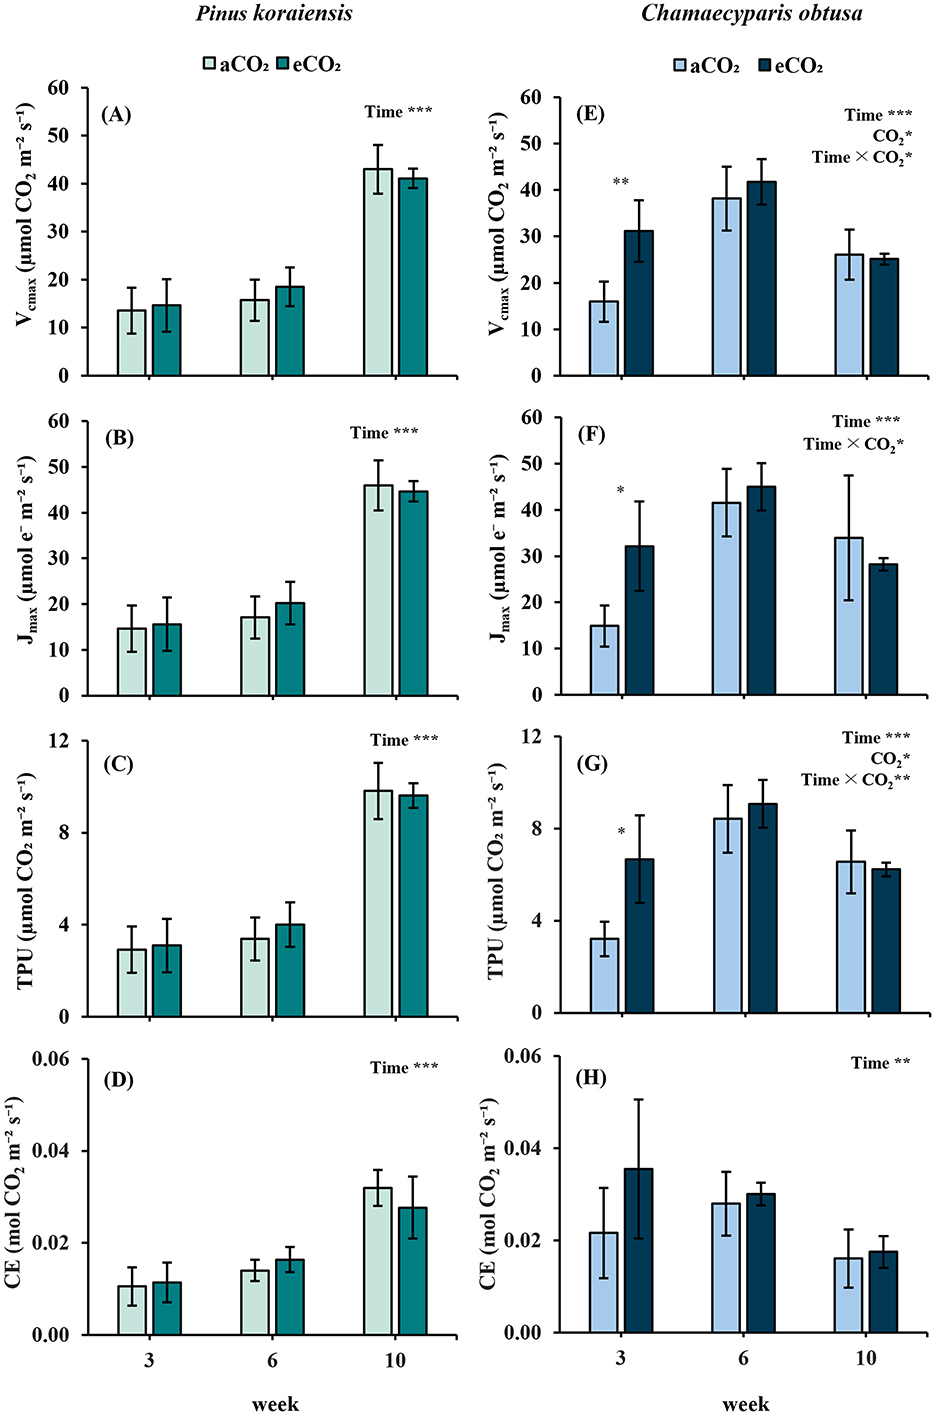
Figure 3. Photosynthetic enzyme activity and carbon assimilation parameters of Pinus koraiensis (A–D) and Chamaecyparis obtusa (E–H) under different CO2 concentrations (aCO2: 400 ppm; eCO2: 550 ppm at week 3, 900 ppm at weeks 6 and 10) across measurement periods. (A, E) Maximum carboxylation rate (Vcmax); (B, F) maximum electron transport rate (Jmax); (C, G) Triose phosphate utilization (TPU) rate; (D, H) Carbon use efficiency (CE). Error bars indicate the standard error of the mean. Significant factors for each variable are indicated at the top right of each graph. “Time” represents the main effect of the measurement period, “C2” indicates the main effect of CO2, and the “×” symbol denotes the interaction between factors. The “*” symbol indicates a significant difference between the control (aCO2) and treatment (eCO2) groups (*p ≤ 0.05, **p ≤ 0.01, ***p ≤ 0.001).
By contrast, C. obtusa responded more rapidly to elevated CO2, showing early upregulation of photosynthetic biochemical traits. At the 3rd week, Vcmax, Jmax and TPU were all significantly higher than in the control (p < 0.01, p < 0.05, and p < 0.01, respectively), reflecting a swift biochemical adjustment to the elevated environment (Figures 3E–G). However, this stimulation was transient. All parameters tended to peak at the 6th week and declined thereafter, implying a short-lived enhancement and potential early acclimation. CE did not show treatment differences, but exhibited significant temporal variation across sampling points (p < 0.01) (Figure 3H).
3.3 Chlorophyll fluorescence dynamics and species-specific sensitivities
P. koraiensis exhibited an initial reduction in PSII performance under eCO2, with significantly lower Fv/Fm and PIABS values observed at the 3rd week compared to the control (p < 0.01 for both). These results suggest early photochemical stress or delayed acclimation of PSII to the elevated CO2 environment. However, both parameters showed recovery by the 6th week regardless of treatment, indicating temporal stabilization of photochemical efficiency as leaf development progressed (Figures 4A, B).
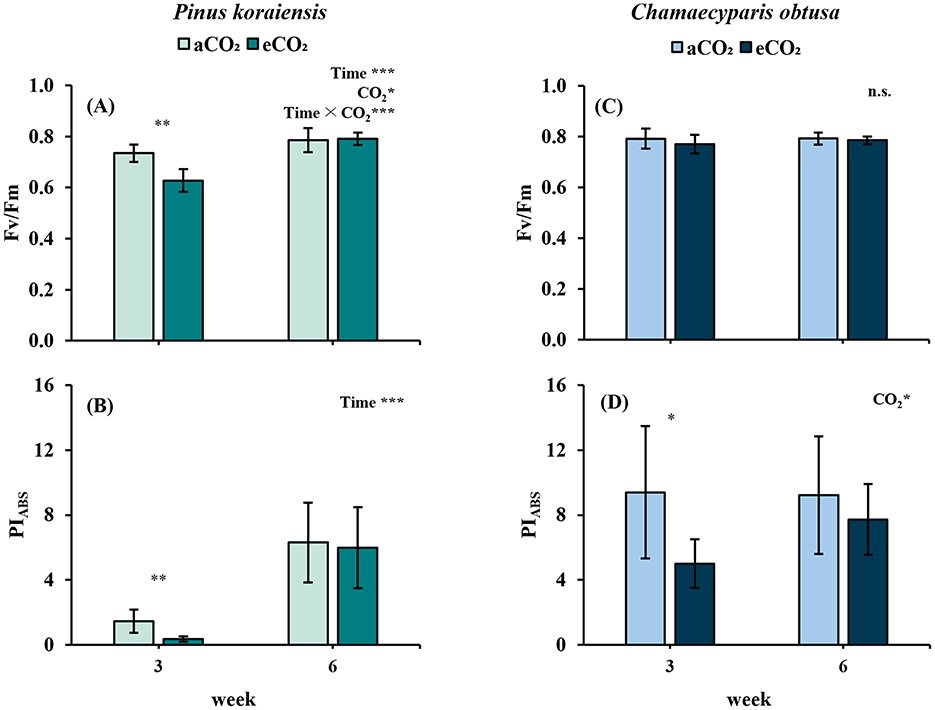
Figure 4. Changes in chlorophyll fluorescence parameters of Pinus koraiensis (A, B) and Chamaecyparis obtusa (C, D) under different CO2 concentrations (aCO2: 400 ppm; eCO2: 550 ppm at week 3, 900 ppm at week 6) across measurement periods. (A, C) Fv/Fm, maximum quantum efficiency of PSII; (B, D) PIABS, photosynthetic performance index. Error bars indicate the standard error of the mean. Significant factors for each variable are indicated at the top right of each graph. “Time” represents the main effect of the measurement period, “C2” indicates the main effect of CO2, and the “×” symbol denotes the interaction between factors. The “*” symbol indicates a significant difference between the control (aCO2) and treatment (eCO2) groups (*p ≤ 0.05, **p ≤ 0.01, ***p ≤ 0.001).
In contrast, C. obtusa maintained stable Fv/Fm values throughout the experimental period, with no significant treatment or temporal effects detected (Figure 4C). This stability suggests that PSII efficiency in C. obtusa was not strongly perturbed by elevated CO2. However, PIABS displayed a distinct pattern: it was significantly lower under eCO2 at the 3rd week (p < 0.01), followed by partial recovery by the 6th week, at which point no significant difference remained between treatments (Figure 4D). This transient reduction may indicate short-term stress responses rather than sustained suppression of PSII function.
Further fluorescence analyses revealed that P. koraiensis under eCO2 exhibited significantly higher values of ABS/RC, DIo/RC, and TRo/RC at the 3rd week (p < 0.01, p < 0.001, and p < 0.05, respectively), along with elevated ABS/CSo and DIo/CSo (p < 0.05 for both). In contrast, ETo/CSo was significantly lower under eCO2 (p < 0.01), suggesting that excess energy input was dissipated rather than used for electron transport (Figure 5). These patterns point to increased excitation pressure and non-photochemical quenching activity. Meanwhile, C. obtusa showed no significant differences across any of the fluorescence parameters, reinforcing its relatively stable photochemical profile under varying CO2 conditions.
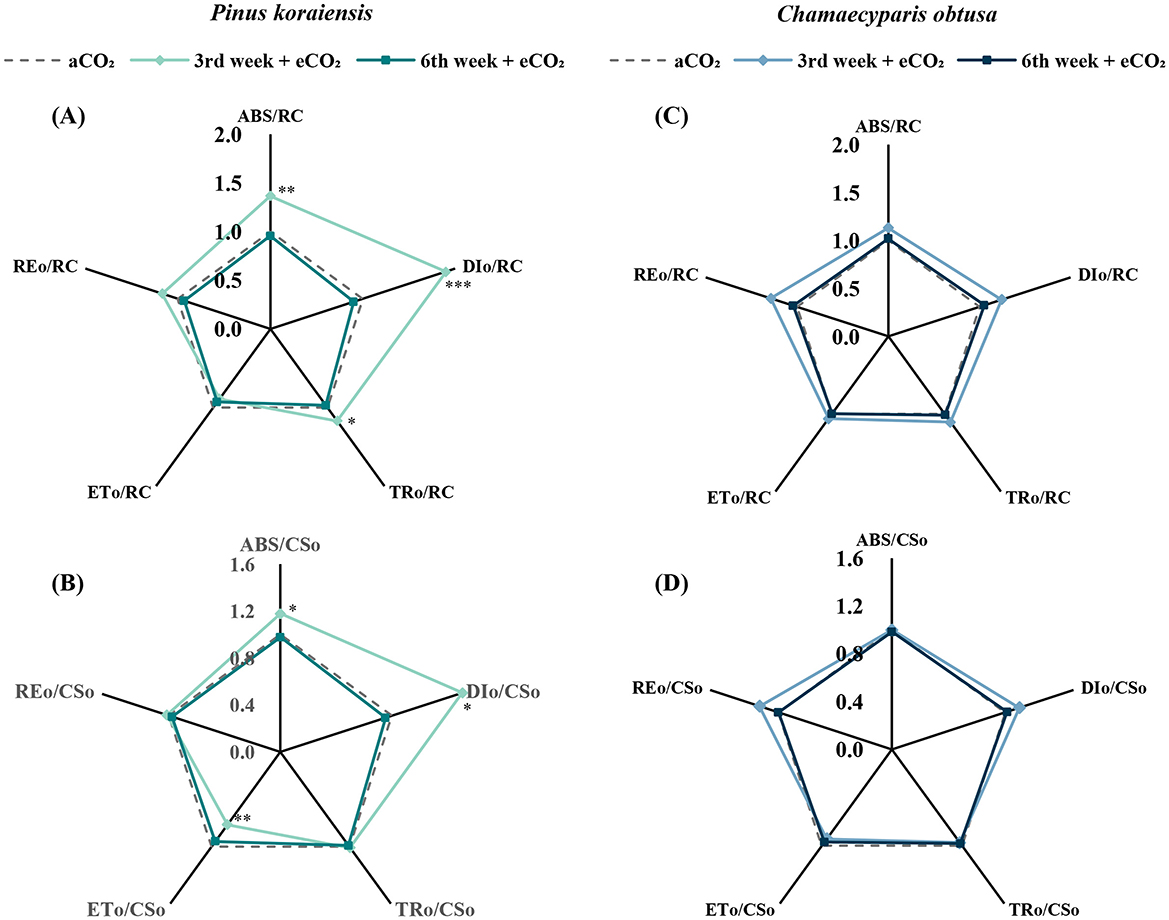
Figure 5. Radar plots showing the changes in chlorophyll fluorescence parameters of Pinus koraiensis (A, B) and Chamaecyparis obtusa (C, D) under different CO2 concentrations (aCO2: 400 ppm; eCO2: 550 ppm at week 3, 900 ppm at week 6) across measurement periods. (A, C) Fv/Fm, maximum quantum efficiency of PSII; (B, D) PIABS, photosynthetic performance index. Parameters include ABS/RC, DIo/RC, TRo/RC, ETo/RC, and REo/RC (A, C) and ABS/CSo, DIo/CSo, TRo/CSo, ETo/CSo, and REo/CSo (B, D). The “*” symbol indicates a significant difference between the control (aCO2) and treatment (eCO2) groups (*p ≤ 0.05, **p ≤ 0.01, ***p ≤ 0.001).
3.4 Photopigment dynamics reflecting temporal and species-specific CO2 responses
P. koraiensis exhibited pronounced changes in pigment composition in response to elevated CO2 conditions. Chl a content remained consistently higher in the treatment group at both time points, contributing to a significant increase in Total Chl by the 6th week. In contrast, Chl b did not differ between treatments but showed a temporal increase (p < 0.001), indicating ongoing pigment accumulation over time. Notably, Car levels spiked significantly under eCO2 at the 3rd week (p < 0.001), but declined thereafter, suggesting a short-term stress response that was not maintained through the experimental period. This pattern may reflect early photoprotective activation followed by physiological acclimation under elevated CO2 conditions (Figures 6A–D).
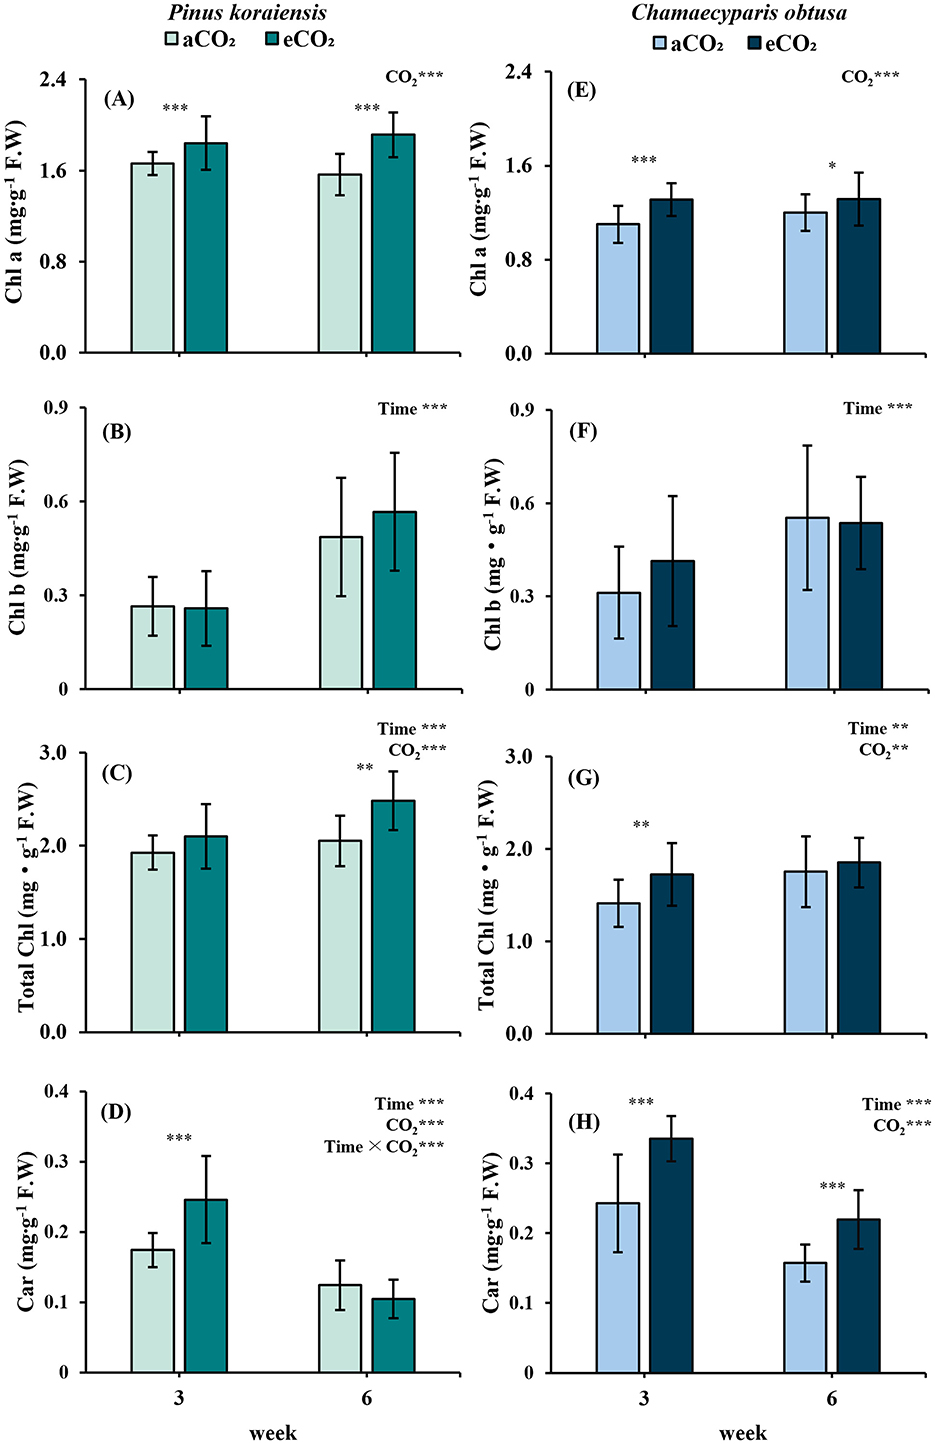
Figure 6. Changes in photopigment content of Pinus koraiensis (A–D) and Chamaecyparis obtusa (E–H) under different CO2 concentrations (aCO2: 400 ppm; eCO2: 550 ppm at week 3, 900 ppm at weeks 6 and 10). (A, E) Chlorophyll a (Chl a); (B, F) Chlorophyll b (Chl b); (C, G) Total Chlorophyll (Total Chl) (D, H) Carotenoids (Car). Error bars indicate the standard error of the mean. Significant factors for each variable are indicated at the top right of each graph. “Time” represents the main effect of the measurement period, “C2” indicates the main effect of CO2, and the “×” symbol denotes the interaction between factors. The “*” symbol indicates a significant difference between the control (aCO2) and treatment (eCO2) groups (*p ≤ 0.05, **p ≤ 0.01, ***p ≤ 0.001).
C. obtusa also exhibited pigment-related responses under elevated CO2. Chl a content was significantly higher in the eCO2 treatment at both the 3rd (p < 0.001) and 6th weeks (p < 0.05), indicating sustained stimulation during the early phase Similarly, Car content remained significantly elevated under eCO2 across both time points (p < 0.001), despite a slight decrease over time. These findings suggest that pigment composition in C. obtusa was responsive to CO2 enrichment during the early growth stages (Figures 6E–H).
3.5 Growth and biomass allocation patterns under eCO2
P. koraiensis exhibited no measurable growth or biomass response to elevated CO2. No significant treatment effects were detected in any component, including leaf, branch, shoot, and root dry weights. Total biomass also remained statistically unchanged between eCO2 and aCO2 groups. Similarly, relative increase in height and root collar diameter for height and root diameter, as well as the R/S, showed no differences, suggesting that elevated CO2 had limited influence on either allocation patterns or overall growth in this species (Supplementary Table S1).
In contrast, C. obtusa showed a notable suppression in growth rate under eCO2. Relative increase in height and root collar diameter for both height and root diameter were significantly lower compared to the control (p < 0.001), indicating that elevated CO2 hindered vertical and belowground extension. However, this did not translate into differences in biomass accumulation, as dry weight, fresh weight, and R/S values were comparable between treatments. This decoupling between relative increase in height and root collar diameter and biomass suggests compensatory allocation or stress-related growth modulation in C. obtusa under elevated CO2 conditions (Supplementary Table S1).
4 Discussion
Species-specific physiological responses to elevated CO2 are shaped not only by photosynthetic capacity, but also by species-specific traits such as the timing of leaf development, structural investment, and long-term carbon allocation strategies. In this study, P. koraiensis and C. obtusa exhibited distinct temporal patterns of adjustment under elevated CO2 (eCO2), despite showing similar photosynthetic rates during the mid-experimental period (5th week). This divergence highlights how species-specific leaf phenology and internal regulation mechanisms govern the dynamics of carbon assimilation and eventual biomass outcomes. P. koraiensis, with its synchronized leaf expansion and structural immaturity during early treatment stages, showed delayed photosynthetic responsiveness. In contrast, C. obtusa initiated rapid biochemical responses but later experienced growth suppression, likely due to respiratory costs and structural shifts. This discussion synthesizes these differential patterns and evaluates the underlying mechanisms that mediate the decoupling between photosynthetic enhancement and biomass accumulation under eCO2.
P. koraiensis exhibited a delayed photosynthetic response to elevated CO2, primarily due to the rapid structural expansion of needle leaves outpacing their physiological maturation. This species exhibits a synchronized pattern of leaf development, characterized by the simultaneous emergence and rapid elongation of multiple needle leaves, followed by gradual hardening over a relatively short period (Chang et al., 2020). During the early treatment phase (weeks 1–3), needle elongation was already ~85% complete by the 1st week and reached 97% by the 4th week, confirming rapid structural growth. However, at this developmental stage, key photosynthetic components such as chloroplasts and Rubisco were still immature, as typically observed in leaf ontogeny studies (Miyazawa and Terashima, 2001). Our data support this observation, as the measured values of Vcmax, Jmax (Figures 3A, B), and Total Chl content (Figure 6C) were significantly lower in the 3rd week compared to the later stage of the experiment, suggesting incomplete activation of photosynthetic enzymes and insufficient pigment accumulation. This functional immaturity likely explains the absence of significant differences in Anet between ambient and elevated CO2 treatments during these initial weeks (Figure 2A; Wang et al., 2020). Concurrently, chlorophyll fluorescence parameters at the 3rd week indicated internal photochemical imbalances under elevated CO2. Specifically, reduced electron transport efficiency (ETo/CSo) and increased energy dissipation (DIo/RC) (Figure 5) suggested inefficient utilization of absorbed light energy, resulting in non-photochemical heat dissipation (Freitas et al., 2016). Under eCO2 conditions, metabolic bottlenecks such as insufficient enzyme activation within the Calvin cycle may have restricted the consumption of NADPH and ATP. This could have led to elevated excitation pressure within PSII, thereby promoting non-photochemical quenching as a protective response (Ozaki et al., 2020; Zhang et al., 2016). This response likely reflects the reliance on non-photochemical energy dissipation pathways in immature leaves to manage excess absorbed light, as previously described in other conifer species (Li et al., 2015; Stefanov et al., 2022; Zhang et al., 2019). As a compensatory protective response, carotenoid content increased significantly under elevated CO2 (Figure 6B), enhancing antioxidant defense mechanisms to mitigate reactive oxygen species (ROS)-related oxidative stress (Foyer and Noctor, 2020; Havaux, 1998; Lee et al., 2020a; Sandmann, 2019)
P. koraiensis exhibited a significant increase in Anet under eCO2, but only at the 5th week. However, despite late-stage photosynthetic increases, biomass remained unaffected (Figures 2A, B; Supplementary Table S1). This indicates that while photosynthate production was temporarily enhanced, its conversion into structural growth was constrained. One possible explanation lies in the behavior of TPU, which reflects the sink-side capacity to process photosynthetic outputs. Despite the rise in Anet at the 5th week, TPU remained at a stable plateau and showed no significant difference between treatments (Figure 3C). This implies that the photosynthetic machinery (source) may have been active but functionally saturated, while the downstream utilization of assimilated carbon (sink) was limited, preventing effective biomass accumulation. Such a pattern is consistent with the concept proposed by Sharkey et al. (2007), where TPU stability serves as a diagnostic marker of sink-side limitations. Another possible constraint involves nitrogen dilution. Although leaf nitrogen content was not directly measured in this study, nutrient dilution under eCO2, as reported by Byeon et al. (2021), may reduce photosynthetic efficiency through nitrogen dilution, which in turn could constrain growth responses under eCO2. As a result, excess photosynthates may have been diverted toward non-structural carbonhydrate (NSC) pools, such as soluble sugar and starch, rather than contributing to structural biomass accumulation. Since NSCs contribute little to dry or fresh weight unless accompanied by cell division or tissue differentiation, this mechanism may explain the absence of biomass increase under elevated CO2 (Hartmann and Trumbore, 2016). Furthermore, the photosynthetic advantage observed at the 5th week gradually dissipated over time, and by the 10th week, Anet no longer differed between treatments. This may indicate acclimation or feedback inhibition, where prolonged CO2 exposure reduces photosynthetic responsiveness despite substrate availability (Kizildeniz et al., 2021). Taken together, these results suggest that while P. koraiensis possesses the physiological capacity to enhance photosynthesis under eCO2, its slow phenological development, potential sink limitations (as inferred from TPU stability), and possible constraints such as nutrient limitation or elevated respiratory costs may have prevented these gains from translating into short-term growth benefits. Long-term CO2 enrichment may eventually benefit this species, but under short-duration conditions such as those in this experiment, measurable growth enhancement may not be realized.
In contrast, C. obtusa exhibited rapid physiological activation under elevated CO2, showing significantly higher Vcmax, Jmax, and TPU values under eCO2 than under aCO2 by the 3rd week (Figures 3E–G). These early biochemical adjustments suggest that the photosynthetic apparatus was efficiently primed to promptly utilize elevated CO2 via enhanced Rubisco carboxylation and carbon assimilation (Zhu et al., 2012). Such responses are associated with the species' sequential leaf development pattern, where new scale leaves are added one by one in a stepwise fashion, resulting in staggered developmental stages within current-year foliage, potentially contributing to stable physiological function under elevated CO2 (Saitoh et al., 2010). This developmental pattern may have contributed to maintaining physiological stability under elevated CO2 conditions. However, despite early biochemical activation, a significant increase in net photosynthesis (Anet) was delayed until the 5th week under eCO2 conditions (Figure 2E). Initially reduced stomatal conductance indicated a conservative water-use strategy, but this pattern reversed by the 5th week, aligning stomatal activity more actively with photosynthetic demand (Field et al., 1995; Purcell et al., 2018). These findings indicate that while C. obtusa rapidly activated its biochemical machinery, actual photosynthetic gains were realized only after resolving initial limitations, reflecting a dynamic regulatory adjustment to elevated CO2 availability.
Although net photosynthesis was significantly enhanced under elevated CO2 by the 5th week, relative increase in height and root collar diameter for height and root collar diameter were significantly lower in the eCO2 group, indicating a physiological decoupling between carbon assimilation and growth (Supplementary Table S1). This mismatch likely results from constraints on growth despite earlier photosynthetic gains. Metabolic adjustments, particularly elevated respiratory costs, likely contributed significantly to the observed growth suppression. Previous studies on the same species (C. obtusa) under elevated CO2 have reported increased nighttime respiration rates and reduced specific leaf area (SLA), reflecting elevated metabolic demands and structural adjustments such as increased leaf thickness (Nagy et al., 1999, 2000). While photosynthetic capacity was enhanced, these physiological and structural changes suggest a reallocation of assimilated carbon toward maintenance rather than growth, thereby limiting biomass accumulation. Meanwhile, in the later stages of the experiment (10th week), C. obtusa exhibited marked declines in physiological activity across both CO2 treatments, with reductions in Anet, gs, and WUE, indicating a seasonal shift into dormancy. Collectively, these findings highlight species-specific physiological adjustments in C. obtusa under elevated CO2, where early photosynthetic activation did not lead to increased biomass accumulation, but rather accompanied shifts in carbon allocation, respiratory costs, and nutrient dynamics.
The contrasting responses of P. koraiensis and C. obtusa to elevated CO2 provide important practical implications for species selection in afforestation and forest management adapted to climate change. Although C. obtusa showed rapid physiological responsiveness, the absence of corresponding biomass accumulation under elevated CO2 suggests that further research and potential breeding for CO2 resilience may be necessary to effectively utilize this species for climate adaptation purposes. Conversely, the physiological response of P. koraiensis to elevated CO2 appeared to be transient, with no sustained biomass increase observed during the experimental period. Nevertheless, practitioners may consider P. koraiensis for regions characterized by high CO2 concentrations and extended growing seasons, which could allow sufficient time for this species to realize its physiological advantages. Integrating these species-specific insights into forestry and silvicultural planning may enhance the effectiveness of afforestation strategies and carbon sequestration efforts under future elevated CO2 scenarios.
5 Conclusion
This study revealed species-specific responses of P. koraiensis and C. obtusa to elevated CO2 conditions, highlighting the critical role of ontogenetic stages and leaf development patterns. In P. koraiensis, physiological activity during early growth stages was constrained by immature leaf development, leading to delayed enhancements in Anet and WUE. In contrast, C. obtusa exhibited rapid biochemical activation under elevated CO2, while this did not translate into enhanced biomass accumulation due to elevated respiratory costs and structural adjustments. These contrasting responses underscore the importance of considering species-specific traits when selecting tree species for future afforestation efforts under climate change.
Although C. obtusa responded quickly at the physiological level, its limited growth response suggests that breeding for CO2 resilience or alternative management strategies may be necessary. Meanwhile, P. koraiensis, exhibited a temporary increase in photosynthetic activity under elevated CO2 during the mid-experimental period, but this did not translate into sustained growth enhancement under short-term conditions. Given these short-term limitations, P. koraiensis may still realize its photosynthetic potential under elevated CO2 in regions with longer growing seasons, provided that sufficient time is allowed for physiological gains to translate into biomass accumulation. Incorporating such species-level insights into silvicultural planning can contribute to more adaptive and effective forest management and carbon sequestration strategies under rising atmospheric CO2 conditions.
Future studies should investigate the long-term physiological and structural responses of these species under elevated CO2, particularly focusing on source–sink dynamics, nutrient interactions, and whole-plant carbon allocation. Such efforts will enhance our understanding of species-specific trade-offs and support sustainable forest management in rapidly changing environments.
Data availability statement
The original contributions presented in the study are included in the article/Supplementary material, further inquiries can be directed to the corresponding author.
Author contributions
IK: Investigation, Writing – original draft, Visualization, Formal analysis, Data curation, Methodology, Writing – review & editing. MK: Project administration, Writing – review & editing, Methodology. JK: Visualization, Writing – original draft, Investigation. SW: Writing – review & editing, Funding acquisition, Conceptualization, Supervision.
Funding
The author(s) declare that financial support was received for the research and/or publication of this article. This work was carried out with the support of “Cooperative Research Program for Agriculture Science and Technology Development (Project No. RS-2023-00220456)” Rural Development Administration, Republic of Korea.
Conflict of interest
The authors declare that the research was conducted in the absence of any commercial or financial relationships that could be construed as a potential conflict of interest.
Generative AI statement
The author(s) declare that no Gen AI was used in the creation of this manuscript.
Publisher's note
All claims expressed in this article are solely those of the authors and do not necessarily represent those of their affiliated organizations, or those of the publisher, the editors and the reviewers. Any product that may be evaluated in this article, or claim that may be made by its manufacturer, is not guaranteed or endorsed by the publisher.
Supplementary material
The Supplementary Material for this article can be found online at: https://www.frontiersin.org/articles/10.3389/ffgc.2025.1623583/full#supplementary-material
References
Ahn, H. G., and Lim, C. H. (2022). Assessing habitat suitability for timber species in South Korea under SSP scenarios. Korean J. Environ. Biol. 40, 567–578. doi: 10.11626/KJEB.2022.40.4.567
Arnon, D. I. (1949). Copper enzymes in isolated chloroplasts. Polyphenoloxidase in Beta vulgaris. Plant Physiol. 24, 1–6. doi: 10.1104/pp.24.1.1
Brisebois, A., and Major, J. E. (2024). Effects of CO2 treatments on functional carbon efficiencies and growth of forest tree seedlings: a study of four early-successional deciduous species. Forests 15:193. doi: 10.3390/f15010193
Byeon, S., Song, W., Park, M., Kim, S., Kim, S., Lee, H., et al. (2021). Down-regulation of photosynthesis and its relationship with changes in leaf N allocation and N availability after long-term exposure to elevated CO2 concentration. J. Plant Physiol. 265:153489. doi: 10.1016/j.jplph.2021.153489
Chang, H., Han, S. H., An, J., Kim, H., Kim, S., and Son, Y. (2020). Responses of summer shoots and spring phenology of Pinus koraiensis seedlings to increased temperature and decreased precipitation. J. Plant Biol. 63, 473–483. doi: 10.1007/s12374-020-09268-0
Creydt, M., Vuralhan-Eckert, J., Fromm, J., and Fischer, M. (2019). Effects of elevated CO2 concentration on leaves and berries of black elder (Sambucus nigra) using UHPLC-ESI-QTOF-MS/MS and gas exchange measurements. J. Plant Physiol. 234–235, 71–79. doi: 10.1016/j.jplph.2019.01.005
Crous, K. Y., Campany, C., Lopez, R., Cano, F. J., and Ellsworth, D. S. (2021). Canopy position affects photosynthesis and anatomy in mature Eucalyptus trees in elevated CO2. Tree Physiol. 41, 206–222. doi: 10.1093/treephys/tpaa117
Farquhar, G. D., von Caemmerer, S., and Berry, J. A. (1980). A biochemical model of photosynthetic CO2 assimilation in leaves of C3 species. Planta 149, 78–90. doi: 10.1007/BF00386231
Field, C. B., Jackson, R. B., and Mooney, H. A. (1995). Stomatal responses to increased CO2: implications from the plant to the global scale. Plant Cell Environ. 18, 1214–1225. doi: 10.1111/j.1365-3040.1995.tb00630.x
Foyer, C. H., and Noctor, G. (2020). Redox homeostasis and signaling in a higher-CO2 world. Annu. Rev. Plant Biol. 71, 157–182. doi: 10.1146/annurev-arplant-050718-095955
Freitas, I. L. J., Rodrigues, W. P., Freitas, S. P., Freitas, J. A. A., Amim, R. T., Amaral, A. T., et al. (2016). Physiological aspects of corn plants related to mesotrione herbicide selectivity. Aust. J. Crop Sci. 10, 1158–1163. doi: 10.21475/ajcs.2016.10.08.p7787
Gardner, A., Ellsworth, D. S., Crous, K. Y., Pritchard, J., and MacKenzie, A. R. (2022). Is photosynthetic enhancement sustained through three years of elevated CO2 exposure in 175-year-old Quercus robur? Tree Physiol. 42, 130–144. doi: 10.1093/treephys/tpab090
Gojon, A., Cassan, O., Bach, L., Lejay, L., and Martin, A. (2023). The decline of plant mineral nutrition under rising CO2: physiological and molecular aspects of a bad deal. Trends Plant Sci. 28, 185–198. doi: 10.1016/j.tplants.2022.09.002
Hartmann, H., and Trumbore, S. (2016). Understanding the roles of nonstructural carbohydrates in forest trees–from what we can measure to what we want to know. New Phytol. 211, 386–403. doi: 10.1111/nph.13955
Havaux, M. (1998). Carotenoids as membrane stabilizers in chloroplasts. Trends Plant Sci. 3, 147–151. doi: 10.1016/S1360-1385(98)01200-X
Hoffmann, W. A., and Poorter, H. (2002). Avoiding bias in calculations of relative growth rate. Ann. Bot. 90, 37–42. doi: 10.1093/aob/mcf140
Inoue, S., Dang Q, L., Man, R., and Tedla, B. (2020). Photoperiod, [CO2] and soil moisture interactively affect phenology in trembling aspen: implications to climate change-induced migration. Enviro. Exp. Bot. 180:104269. doi: 10.1016/j.envexpbot.2020.104269
Intergovernmental Panel on Climate Change (2021). “Chapter 4: future global climate: scenario-based projections and near-term information,” in Climate Change 2021: The Physical Science Basis. Contribution of Working Group I to the Sixth Assessment Report of the Intergovernmental Panel on Climate Change(Cambridge University Press). Available online at: https://www.ipcc.ch/report/ar6/wg1/ (Accessed December 23, 2024).
Ishii, K. (1991). “Hinoki cypress (Chamaecyparis obtusa),” in Biotechnology in Agriculture and Forestry, Vol. 16, Trees II. ed. Y. P. S. Bajaj (Berlin: Springer-Verlag), 144–157. doi: 10.1007/978-3-662-13231-9_27
Kim, M., Ham, B. Y., Kraxner, F., Shvidenko, A., Schepaschenko, D., Krasovskii, A., et al. (2020). Species- and elevation-dependent productivity changes in East Asian temperate forests. Environ. Res. Lett. 15:034012. doi: 10.1088/1748-9326/ab71a2
Kizildeniz, T., Pascual, I., Irigoyen, J. J., and Morales, F. (2021). Future CO2, warming and water deficit impact white and red Tempranillo grapevine: photosynthetic acclimation to elevated CO2 and biomass allocation. Physiol. Plant 172, 1779–1794. doi: 10.1111/ppl.13388
Korea Forest Service (2018). Recommended Tree Species for Afforestation. Available online at: https://www.forest.go.kr/kfsweb/kfi/kfs/cms/cmsView.do?cmsId=FC_000781andmn=AR01_02_03 (Accessed December 23, 2024).
Kwak, M. J., Lee, S. H., and Woo, S. Y. (2011). Physiological and biochemical traits of different water and light intensities on cork oak (Quercus suber L.) seedlings. Afr. J. Biotechnol. 10, 15305–15319. doi: 10.5897/AJB11.2845
Lee, J. K., Woo, S. Y., Kwak, M. J., Park, S. H., Kim, H. D., Lim, Y. J., et al. (2020a). Effects of elevated temperature and ozone in Brassica juncea L.: growth, physiology, and ROS accumulation. Forests 11:68. doi: 10.3390/f11010068
Lee, Y. H., Sang, W. G., Baek, J. K., Kim, J. H., Shin, P., Seo, M. C., et al. (2020b). The effect of concurrent elevation in CO2 and temperature on the growth, photosynthesis, and yield of potato crops. PLoS ONE 15:e0241081. doi: 10.1371/journal.pone.0241081
Li, L., Lin, L., Li, X., and Lu, Y. (2015). Sensitivity of photosystem II activity in immature and mature leaves of desert sun plant Alhagi sparsifolia Shap. to light stress. Acta Physiol. Plant 37, 1–10. doi: 10.1007/s11738-015-1877-9
Li, L., Wang, X., and Manning, W. J. (2019). Effects of elevated CO2 on leaf senescence, leaf nitrogen resorption, and late-season photosynthesis in Tilia americana L. Front. Plant Sci. 10:1217. doi: 10.3389/fpls.2019.01217
Lichtenthaler, H. K., and Buschmann, C. (2001). Chlorophylls and carotenoids: measurement and characterization by UV-VIS spectroscopy. Curr. Protoc. Food Anal. Chem. 1, F4–F3. doi: 10.1002/0471142913.faf0403s01
Long, S. P., and Bernacchi, C. J. (2003). Gas exchange measurements, what can they tell us about the underlying limitations to photosynthesis? Procedures and sources of error. J. Exp. Bot. 54, 2393–2401. doi: 10.1093/jxb/erg262
Mendela, M., Tjelele, J. T., Madakadze, I. C., Mangwane, M., Samuels, I. M., Muller, F., et al. (2022). A global meta-analysis of woody plant responses to elevated CO2: implications on biomass, growth, leaf N content, photosynthesis and water relations. Ecol. Process. 11:52. doi: 10.1186/s13717-022-00397-7
Miyazawa, S. I., and Terashima, I. (2001). Slow development of leaf photosynthesis in an evergreen broad-leaved tree, Castanopsis sieboldii: relationships between leaf anatomical characteristics and photosynthetic rate. Plant Cell Environ. 24:279–291. doi: 10.1046/j.1365-3040.2001.00682.x
Nagy, M., Ogawa, K., and Hagihara, A. (1999). Effects of elevated CO2 concentration on the respiratory behavior of the branches of field-grown hinoki cypress (Chamaecyparis obtusa). J. For. Res. 4, 125–130. doi: 10.1007/BF02762236
Nagy, M., Ogawa, K., and Hagihara, A. (2000). Interactive effect of CO2 enrichment and temperature on the photosynthesis of field-grown hinoki cypress (Chamaecyparis obtusa) branches. Trees 14, 282–288. doi: 10.1007/PL00009769
Ozaki, H., Tokida, T., Nakamura, H., Sakai, H., Hasegawa, T., and Noguchi, K. (2020). Atmospheric CO2 concentration and N availability affect the balance of the two photosystems in mature leaves of rice plants grown at a free-air CO2 enrichment site. Front. Plant Sci. 11:786. doi: 10.3389/fpls.2020.00786
Pang, S. J., Park, J. S., Hwang, K. H., Jeong, G. Y., Park, M. J., and Lee, J. J. (2011). Bending strength of Korean softwood species for 120 × 180 mm structural members. J. Korean Wood Sci. Technol. 39, 444–450. doi: 10.5658/WOOD.2011.39.5.444
Petritan, M. A., and Beloiu Schwenke, M. (2023). Forest functioning under climate warming and future perspectives on forest disturbances. Forests 14:2302. doi: 10.3390/f14122302
Poorter, H., and Navas, M. L. (2003). Plant growth and competition at elevated CO2: on winners, losers and functional groups. N. Phytol. 157, 175–198. doi: 10.1046/j.1469-8137.2003.00680.x
Purcell, C., Batke, S. P., Yiotis, C., Caballero, R., Soh, W. K., Murray, M., et al. (2018). Increasing stomatal conductance in response to rising atmospheric CO2. Ann. Bot. 121, 1137–1149. doi: 10.1093/aob/mcx208
Rogers, A., and Ellsworth, D. S. (2002). Photosynthetic acclimation of Pinus taeda (loblolly pine) to long-term growth in elevated pCO2 (FACE). Plant Cell Environ. 25, 851–858. doi: 10.1046/j.1365-3040.2002.00868.x
Saitoh, T. M., Tamagawa, I., Muraoka, H., Lee, N. Y. M., Yashiro, Y., and Koizumi, H. (2010). Carbon dioxide exchange in a cool-temperate evergreen coniferous forest over complex topography in Japan during two years with contrasting climates. J. Plant Res. 123, 473–483. doi: 10.1007/s10265-009-0308-7
Sandmann, G. (2019). Antioxidant protection from UV- and light-stress related to carotenoid structures. Antioxidants 8:219. doi: 10.3390/antiox8070219
Sharkey, T. D., Bernacchi, C. J., Farquhar, G. D., and Singsaas, E. L. (2007). Fitting photosynthetic carbon dioxide response curves for C3 leaves. Plant Cell Environ. 30, 1035–1040. doi: 10.1111/j.1365-3040.2007.01710.x
Shin, J. H., and Lee, D. K. (1990). Growth phenology of various tree modules in Pinus koraiensis S. et Z. plantation. J. Korean For. Soc. 79, 431–434.
Soba, D., Shu, T., Runion, G. B., Prior, S. A., Fritschi, F. B., Aranjuelo, I., et al. (2020). Effects of elevated [CO2] on photosynthesis and seed yield parameters in two soybean genotypes with contrasting water use efficiency. Environ. Exp. Bot. 178:104154. doi: 10.1016/j.envexpbot.2020.104154
Souza, J. P., Melo, N. M. J., Halfeld, A. D., Vieira, K. I., and Rosa, B. L. (2019). Elevated atmospheric CO2 concentration improves water use efficiency and growth of a widespread Cerrado tree species even under soil water deficit. Acta Bot. Bras. 33, 425–436. doi: 10.1590/0102-33062018abb0272
Stefanov, M. A., Rashkov, G. D., and Apostolova, E. L. (2022). Assessment of the photosynthetic apparatus functions by chlorophyll fluorescence and P700 absorbance in C3 and C4 plants under physiological conditions and under salt stress. Int. J. Mol. Sci. 23:3768. doi: 10.3390/ijms23073768
Strasser, R. J., Tsimilli-Michael, M., and Srivastava, A. (2004). “Analysis of the chlorophyll a fluorescence transient,” in Chlorophyll a Fluorescence: A Signature of Photosynthesis. Advances in Photosynthesis and Respiration, Vol. 19, eds. G. C. Papageorgiou and Govindjee (Dordrecht: Springer), 321–362. doi: 10.1007/978-1-4020-3218-9_12
Tang, Y., Zhou, W., and Du, Y. (2023). Effects of temperature, precipitation, and CO2 on plant phenology in China: a circular regression approach. Forests 14:1844. doi: 10.3390/f14091844
Tenhunen, J. D., Lange, O. L., Gebel, J., Beyschlag, W., and Weber, J. A. (1984). Changes in photosynthetic capacity, carboxylation efficiency, and CO2 compensation point associated with midday stomatal closure and midday depression of net CO2 exchange of leaves of Quercus suber. Planta 162, 193–203. doi: 10.1007/BF00397440
Wahidah, N. L., Wan Ahmad, W. J., Nizam, M. S., and Che Mohd Zain, C. R. (2017). Effects of elevated atmospheric CO2 on photosynthesis, growth and biomass in Shorea platycarpa F. Heim (meranti paya). Sains Malaysiana 46, 1421–1428. doi: 10.17576/jsm-2017-4609-10
Wang, S., Li, Y., Ju, W., Chen, B., Chen, J., Croft, H., et al. (2020). Estimation of leaf photosynthetic capacity from leaf chlorophyll content and leaf age in a subtropical evergreen coniferous plantation. J. Geophys. Res. Biogeosci. 125:e2019JG005020. doi: 10.1029/2019JG005020
Yu, M., Sun, P., Huang, X., Zha, Z., Wang, X., Mantri, N., et al. (2023). Interacting effects of CO2, temperature, and nitrogen supply on photosynthetic, root growth, and nitrogen allocation of strawberry at the fruiting stage. Agronomy 13:1353. doi: 10.3390/agronomy13051353
Zhang, H., Zhong, H., Wang, J., Sui, X., and Xu, N. (2016). Adaptive changes in chlorophyll content and photosynthetic features to low light in Physocarpus amurensis Maxim and Physocarpus opulifolius ‘Diabolo'. Peer J. 4:e2125. doi: 10.7717/peerj.2125
Zhang, P., Liang, Y., Liu, B., Ma, T., and Wu, M. M. (2023). A coupled modelling framework for predicting tree species' altitudinal migration velocity in montane forest. Ecol. Modell. 484:110481. doi: 10.1016/j.ecolmodel.2023.110481
Zhang, S. B., Hao, Y. J., and Deng, Q. L. (2019). Photosynthetic induction is slower in young leaves than in mature leaves in a tropical invader, Chromolaena odorata. Photosynthetica 57, 1013–1020. doi: 10.32615/ps.2019.120
Zhu, C., Ziska, L., Zhu, J., Zeng, Q., Xie, Z., Tang, H., et al. (2012). The temporal and species dynamics of photosynthetic acclimation in flag leaves of rice (Oryza sativa) and wheat (Triticum aestivum) under elevated carbon dioxide. Physiol. Plant 145, 395–405. doi: 10.1111/j.1399-3054.2012.01581.x
Keywords: Pinus koraiensis, Chamaecyparis obtusa, chlorophyll fluorescence, elevated CO2, relative increase in height and root collar diamete, VCMAX, photosynthesis
Citation: Kim I, Kwak M, Kim J and Woo S (2025) Short-term physiological responses of Pinus koraiensis Siebold & Zucc. and Chamaecyparis obtusa (Siebold & Zucc.) Endl. seedlings to elevated CO2. Front. For. Glob. Change 8:1623583. doi: 10.3389/ffgc.2025.1623583
Received: 06 May 2025; Accepted: 07 July 2025;
Published: 30 July 2025.
Edited by:
Pedro Giovâni Da Silva, Federal University of Minas Gerais, BrazilReviewed by:
Hamada Ali, Sultan Qaboos University, OmanKetong Yang, Gansu Agricultural University, China
Jin-Feng Zhang, Qinghai Normal University, China
Copyright © 2025 Kim, Kwak, Kim and Woo. This is an open-access article distributed under the terms of the Creative Commons Attribution License (CC BY). The use, distribution or reproduction in other forums is permitted, provided the original author(s) and the copyright owner(s) are credited and that the original publication in this journal is cited, in accordance with accepted academic practice. No use, distribution or reproduction is permitted which does not comply with these terms.
*Correspondence: Suyoung Woo, d3N5QHVvcy5hYy5rcg==