Abstract
Oak (Quercus) diversity is a defining feature of North American forests, comprising over 75% of the region's vegetation. Oaks play a vital role in supporting numerous wildlife species by providing essential food and habitat resources, while also contributing to carbon storage, soil stabilization, and cultural and economic values. Arkansas, with its highly diverse biogeography, offers suitable conditions for a wide range of oak species, leading to the formation of varied vegetation communities. The purpose of this study is to assess the diversity (species richness) of the Quercus genus across the state of Arkansas using multi species niche modeling. Geographic coordinates of 5,987 herbarium records, representing 26 native Oak species, were compiled. We employed an ensemble species distribution modeling approach to predict suitable habitat areas for oak species and to identify hotspots. Our results showed that mean temperature of driest month, precipitation of warmest month, and mean diurnal range contributed > 80% the model prediction. The highest oak richness in Arkansas was found in Crowley's Ridge and Mississippi Valley Loess Plains, each supporting 20 Quercus species, followed by Arkansas River Valley and Ozark highlands with 18 species each. Considering growing concerns over oak forest decline due to anthropogenic and climate change, this study offers valuable insights for conservation, assessment, management strategies, and silviculture planning of oak species in the region.
Introduction
The genus Quercus (oaks) is one of the most ecologically dominant clades of woody angiosperms across the Northern Hemisphere (Nixon, 2006; Hipp et al., 2020). Oaks occupy diverse ecosystems, including temperate deciduous forests, subtropical savannahs, coastal plain mixed evergreen forests, montane forests, and mediterranean-type vegetation. They range from tall overstory trees in moist forests to shrubs in xeric or edaphically challenging environments (Rodà et al., 1999). In eastern North America, historical data indicate that oaks comprised 40–70% of total tree basal area, underscoring their structural and functional dominance as keystone species supporting diverse biota (Hanberry and Nowacki, 2016; Johnson et al., 2019; Nixon, 2006; Tantray et al., 2017; Guldin et al., 2006).
Arkansas harbors exceptional oak diversity due to its varied topography and climate, ranging from lowland swamps in the east and south to the rugged Ozark and Ouachita Mountains in the north and west. The state is home to 32 Quercus species, 31 of which are native (McWilliams et al., 2002; Heitzman, 2003; Subedi et al., 2024). Dominant upland species include Q. alba, Q. falcata, and Q. stellata, while bottomland forests support species such as Q. lyrata and Q. michauxii (Abrams, 1996). Conservation concern species such as Q. acerifolia (endangered, endemic to Arkansas highlands) and Q. arkansana (threatened, endemic to the southeastern U.S.) add to the ecological significance of the region (Subedi et al., 2023, 2024).
Climate change poses growing threats to Quercus diversity. Species with narrow climatic niches, such as Q. devia, Q, acerifolia, Q. arkansana, face steep losses of suitable habitat under future climate projections, whereas generalist species may show greater resilience (Ramírez-Preciado et al., 2019; Subedi et al., 2023, 2024; Ibáñez et al., 2008). Oak migration is constrained by poor seed dispersal and fragmented landscapes, limiting their ability to colonize new suitable areas (Davis and Shaw, 2001; Prasad et al., 2013; Kremer and Hipp, 2020). As keystone species, their decline may disrupt broader ecosystem dynamics, underscoring the need for proactive conservation.
Despite their ecological importance and conservation concerned for certain species, the spatial patterns of oak diversity and their environmental drivers remain underexplored at regional scales. Most studies focus on individual species or localized areas, with limited use of advanced modeling tools to assess richness and suitability. These gaps constrain effective conservation planning, particularly under accelerating environmental change and anthropogenic disturbances such as rapid development and intensive silviculture. To address this, we investigated spatial patterns and environmental drivers of Quercus species richness in Arkansas, integrating species occurrence records with bioclimatic and topographic variables. Our objectives were: (1) map the spatial distribution of oak species richness across the state; (2) locate species richness “hotspots” for potential conservation prioritization; and (3) identify key environmental and topographic factors driving oak species richness. Our findings aimed to inform regional forest management and support adaptive strategies for preserving oak-dominated ecosystems in a changing climate.
Materials and methods
Species occurrence data
To assess the spatial patterns and environmental drivers of oak (Quercus) species richness in Arkansas (Figure 1), we compiled an extensive dataset of oak occurrence records from herbarium records. A total of 5,987 presence records were acquired from multiple herbaria via the southeast regional network expertise and collections (SERNEC Data Portal, 2022). Each record was georeferenced with latitude and longitude coordinates, enabling spatial mapping and bioclimatic and topographic data extraction. To minimize spatial sampling bias and effects of spatial autocorrelation, we implemented spatial thinning of the dataset using a 100 m × 100 m resolution grid. This process yielded a final dataset of 3,594 records with species counts ranging from a minimum of 17 for Q. coccinea to a maximum of 361 for Q. stellata (Figure 2, Supplementary Table 1). This rarefaction ensured that no two records within the dataset were located within the same grid cell (100 m × 100 m), thus preserving ecological independence among data points and improving the reliability of spatial modeling outputs.
Figure 1
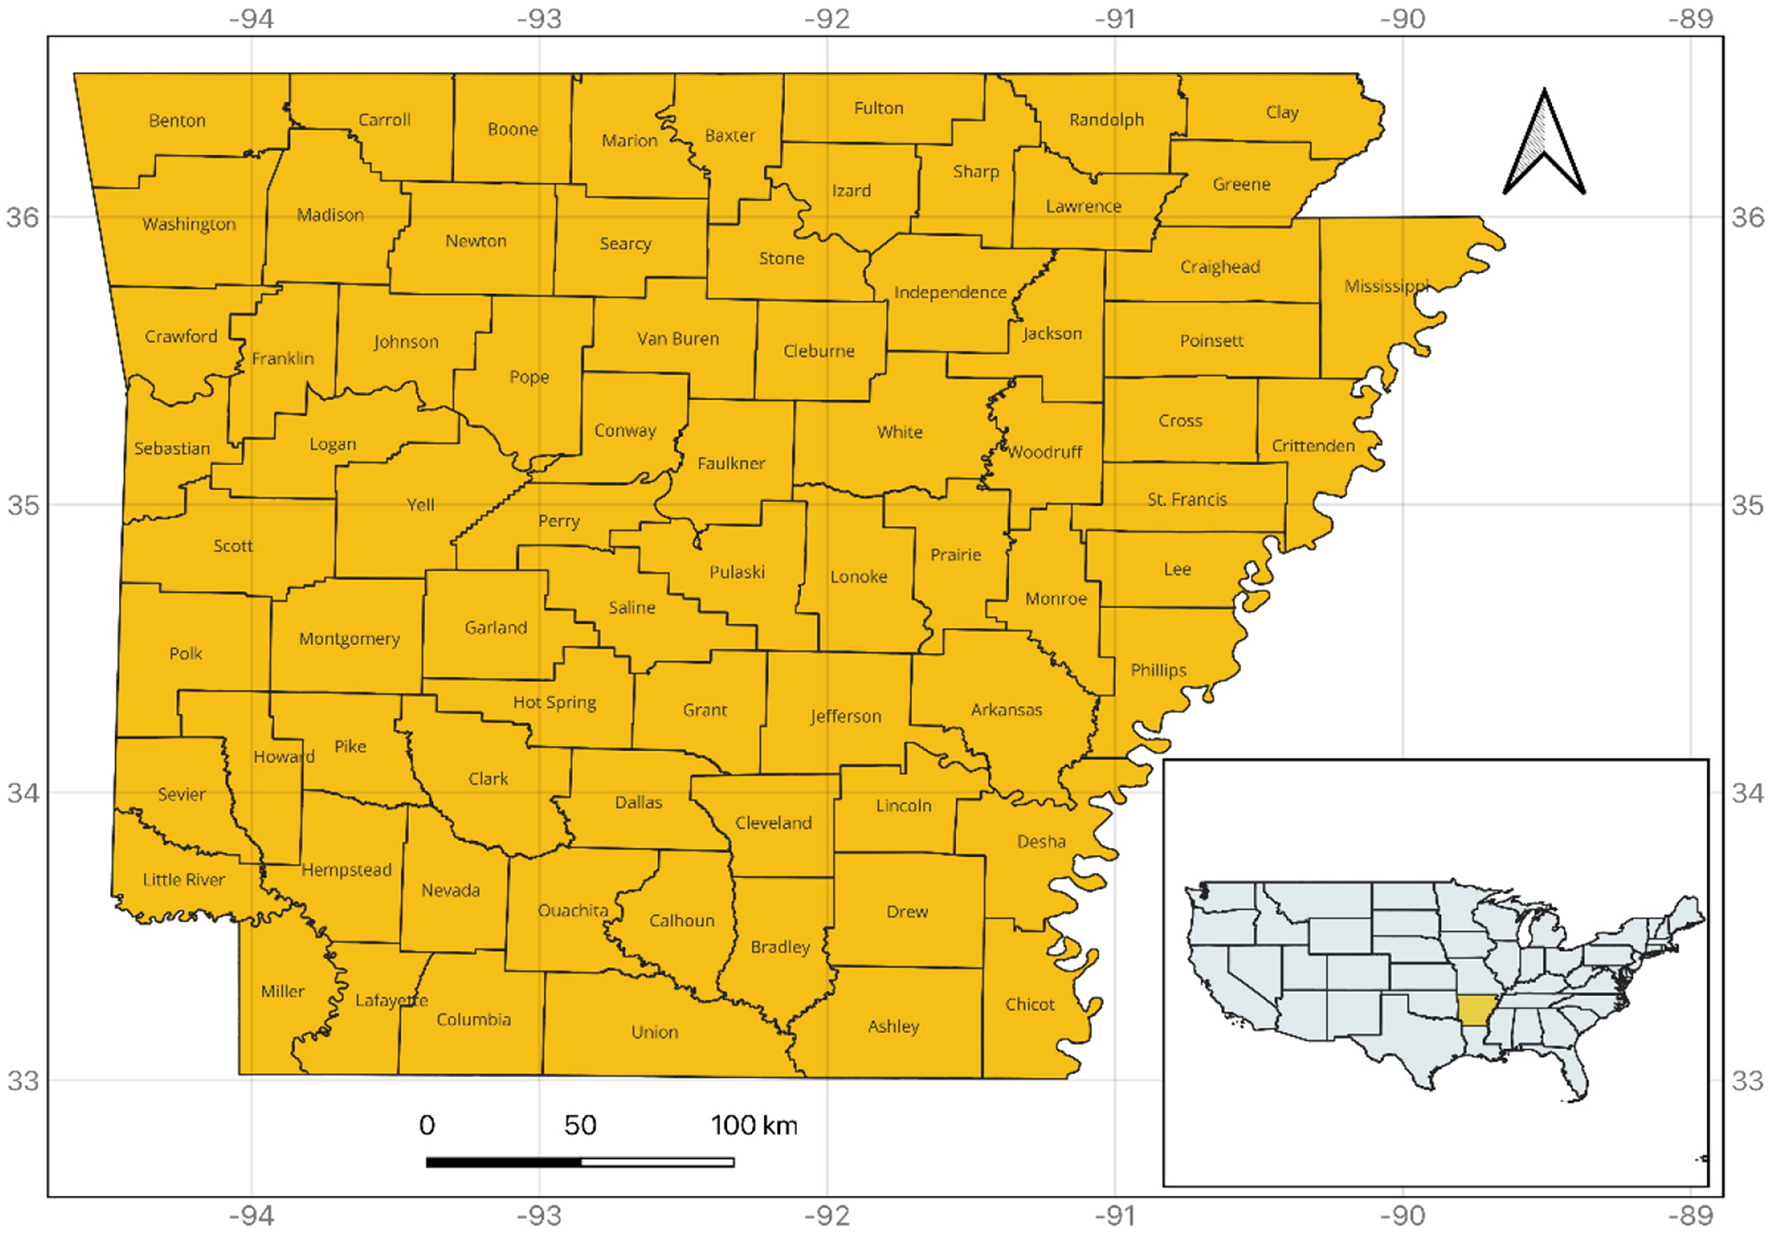
Study area (Arkansas) showing county boundaries, with its location highlighted on the map of the United States. The X-axis represents Longitude, and the Y-axis represents Latitude.
Figure 2
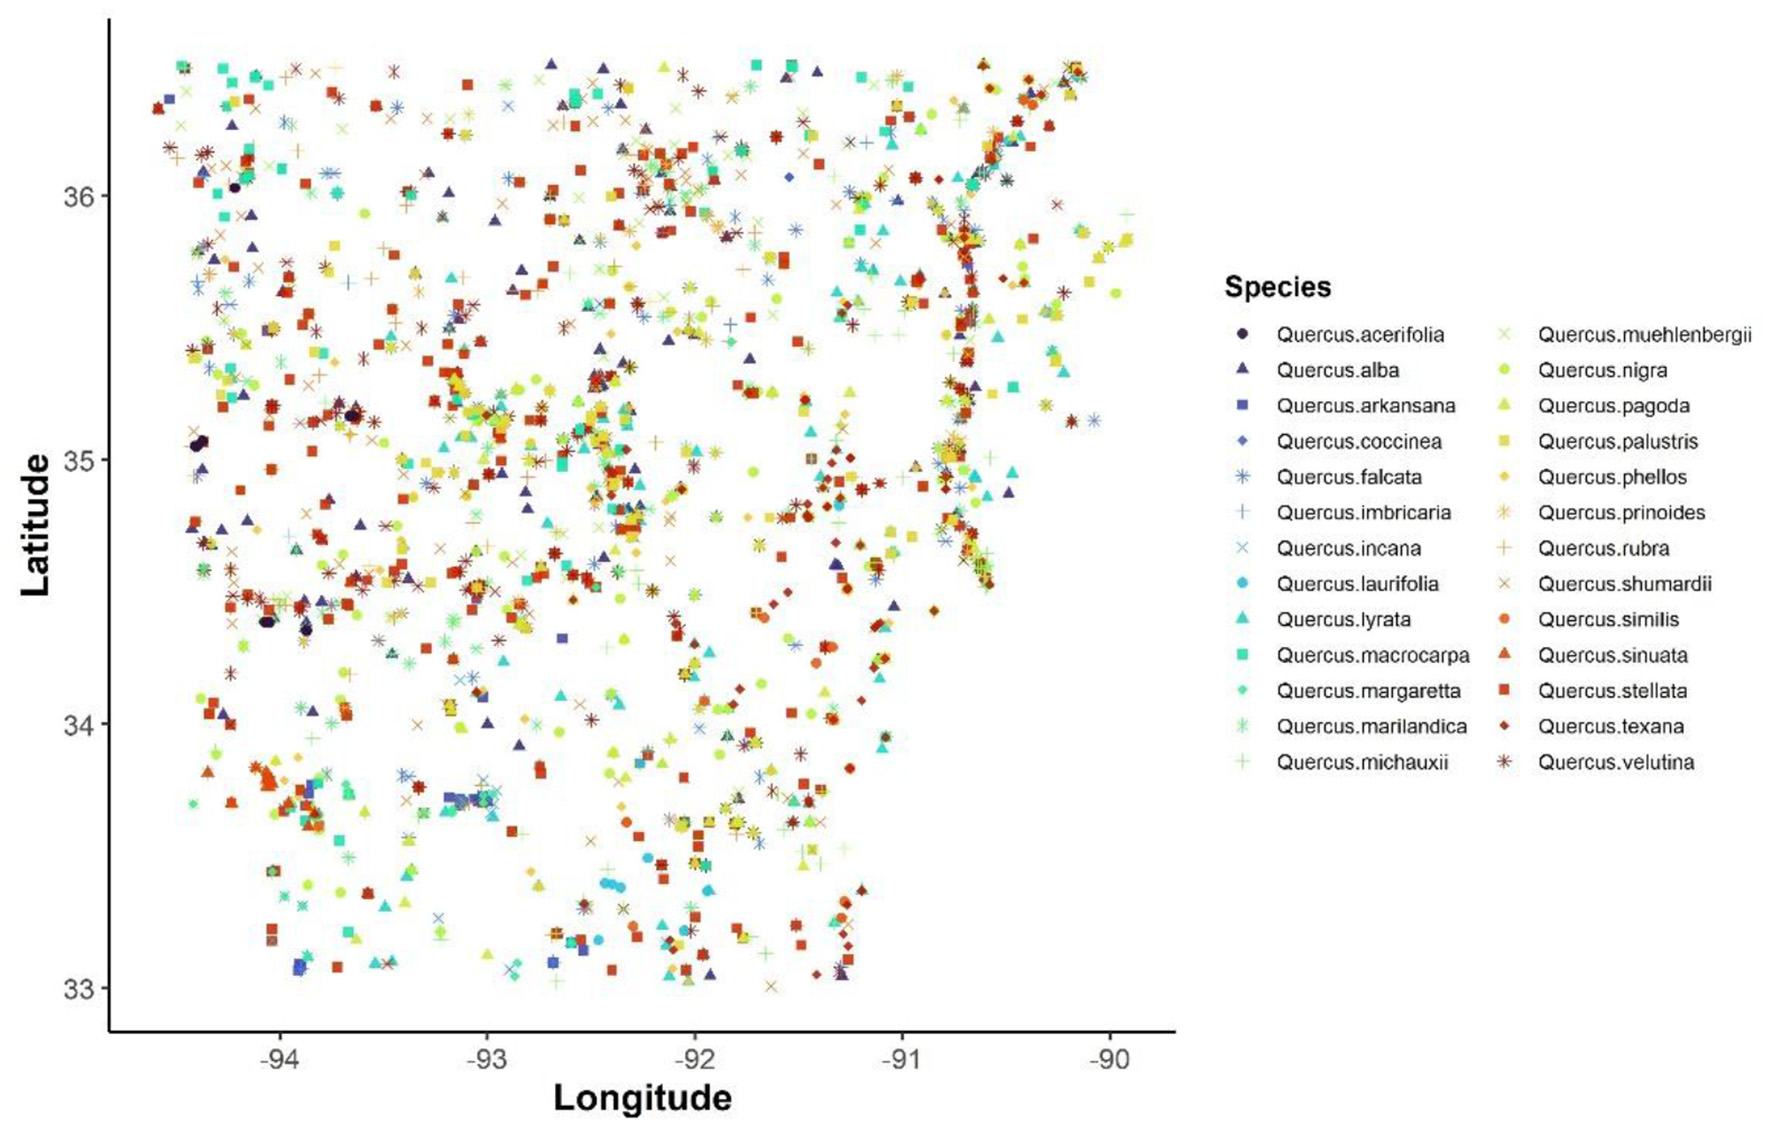
Georeferenced locations of 26 oak species (Quercus spp.) in Arkansas after spatial thinning. Each point represents a unique herbarium record, and points are color-coded by species.
Specimen georeferencing and mapping
Only 17.32% of the 5,987 herbarium specimens from Arkansas had GPS coordinates. For the remaining specimens, geographic coordinates (along with corresponding uncertainty estimates) were assigned based on locality information provided on the specimen labels. Localities were determined using primary reference points that included at least one distance and direction from a well-defined feature (e.g., road, intersection, or building). Specimens that lacked sufficient locality information were excluded from the analysis. Approximate coordinates were generated using GEOLocate version 3.22 (https://www.geo-locate.org/web/default.html) (Rios and Bart, 2010), with results recorded in decimal degrees.
Based on coordinates (latitude and longitude), each specimen was assigned to one of seven major United States Environmental Protection Agency (EPA) Level III ecoregions - Crowley's Ridge, Mississippi Alluvial Plain, Arkansas Valley, Ozark Highlands, Ouachita Mountains, Boston Mountains, and South-Central Plains (https://www.epa.gov/eco-research/ecoregion-download-files-state-region-6#pane-03). Habitat boundaries were delineated using the “Create” feature in ArcGIS Pro (version 3.4), based on specimen locations and cross-referenced with Environmental Protection Agency (EPA) ecoregion imagery.
Bioclimatic and topographic variables
Twenty-two environmental variables (19 bioclimatic and three topographic) were initially considered to represent climatic and topographic influences on oak distribution and richness. Nineteen bioclimatic variables were downloaded from the WorldClim database (version 2.1; https://www.worldclim.org) at a 30 arc-second spatial resolution (~1 km2). These variables describe annual trends, seasonality, and extreme conditions in temperature and precipitation, which are crucial for understanding tree species distributions and ecological niches. For topographic data, elevation data were downloaded from the United States Geological Survey (USGS) Elevation Model (DEM) database, ~3 m resolution (https://earthexplorer.usgs.gov/). Slope and aspect data were then calculated from the DEM in ArcGIS Pro software (esri.com). Topographic variables (elevation, slope, and aspect) represent fine-scale habitat heterogeneity that may influence microclimates, which in turn influence patterns of oak species richness, particularly in mountainous regions such as the Ozark and Ouachita mountains.
To address multicollinearity among the 22 initial environmental predictors (19 bioclimatic and 3 topographic), we performed pairwise Pearson correlation analysis. Variables with a correlation coefficient (|r|) > 0.75 were considered collinear (Subedi et al., 2024, 2023; Adhikari et al., 2023; Dormann et al., 2013). From each pair of correlated variables, one was removed based on ecological relevance and variable contribution in preliminary models. Ultimately, 10 non-collinear variables were retained for modeling (Table 1, Figure 3).
Table 1
| Variable code | Variable type | Source | Description | Native resolution |
|---|---|---|---|---|
| Bio1 | Bioclimatic | WorldClim v2.1 | Annual mean temperature (°C) | 30″ (~1 km) |
| Bio2 | Bioclimatic | WorldClim v2.1 | Mean diurnal temperature range (°C) | 30″ (~1 km) |
| Bio8 | Bioclimatic | WorldClim v2.1 | Mean temperature of wettest quarter (°C) | 30″ (~1 km) |
| Bio9 | Bioclimatic | WorldClim v2.1 | Mean temperature of driest quarter (°C) | 30″ (~1 km) |
| Bio13 | Bioclimatic | WorldClim v2.1 | Precipitation of wettest month (mm) | 30″ (~1 km) |
| Bio17 | Bioclimatic | WorldClim v2.1 | Precipitation of driest quarter (mm) | 30″ (~1 km) |
| Bio18 | Bioclimatic | WorldClim v2.1 | Precipitation of warmest quarter (mm) | 30″ (~1 km) |
| Elevation | Topographic | USGS (DEM) | Elevation above sea level (m) | 1″ (~30 m) |
| Slope | Topographic | Derived from USGS | Maximum rate of elevation change between adjacent cells (°) | 1″ (~30 m) |
| Aspect | Topographic | Derived from USGS | Direction of maximum slope (compass degrees) | 1″ (~30 m) |
Selected bioclimatic and topographic variables selected for modeling after correlation analysis (correlation coefficient (|r|) < 0.75 were considered).
For each variable, variable code, variable type, data source, description, and resolution are provided.
Figure 3
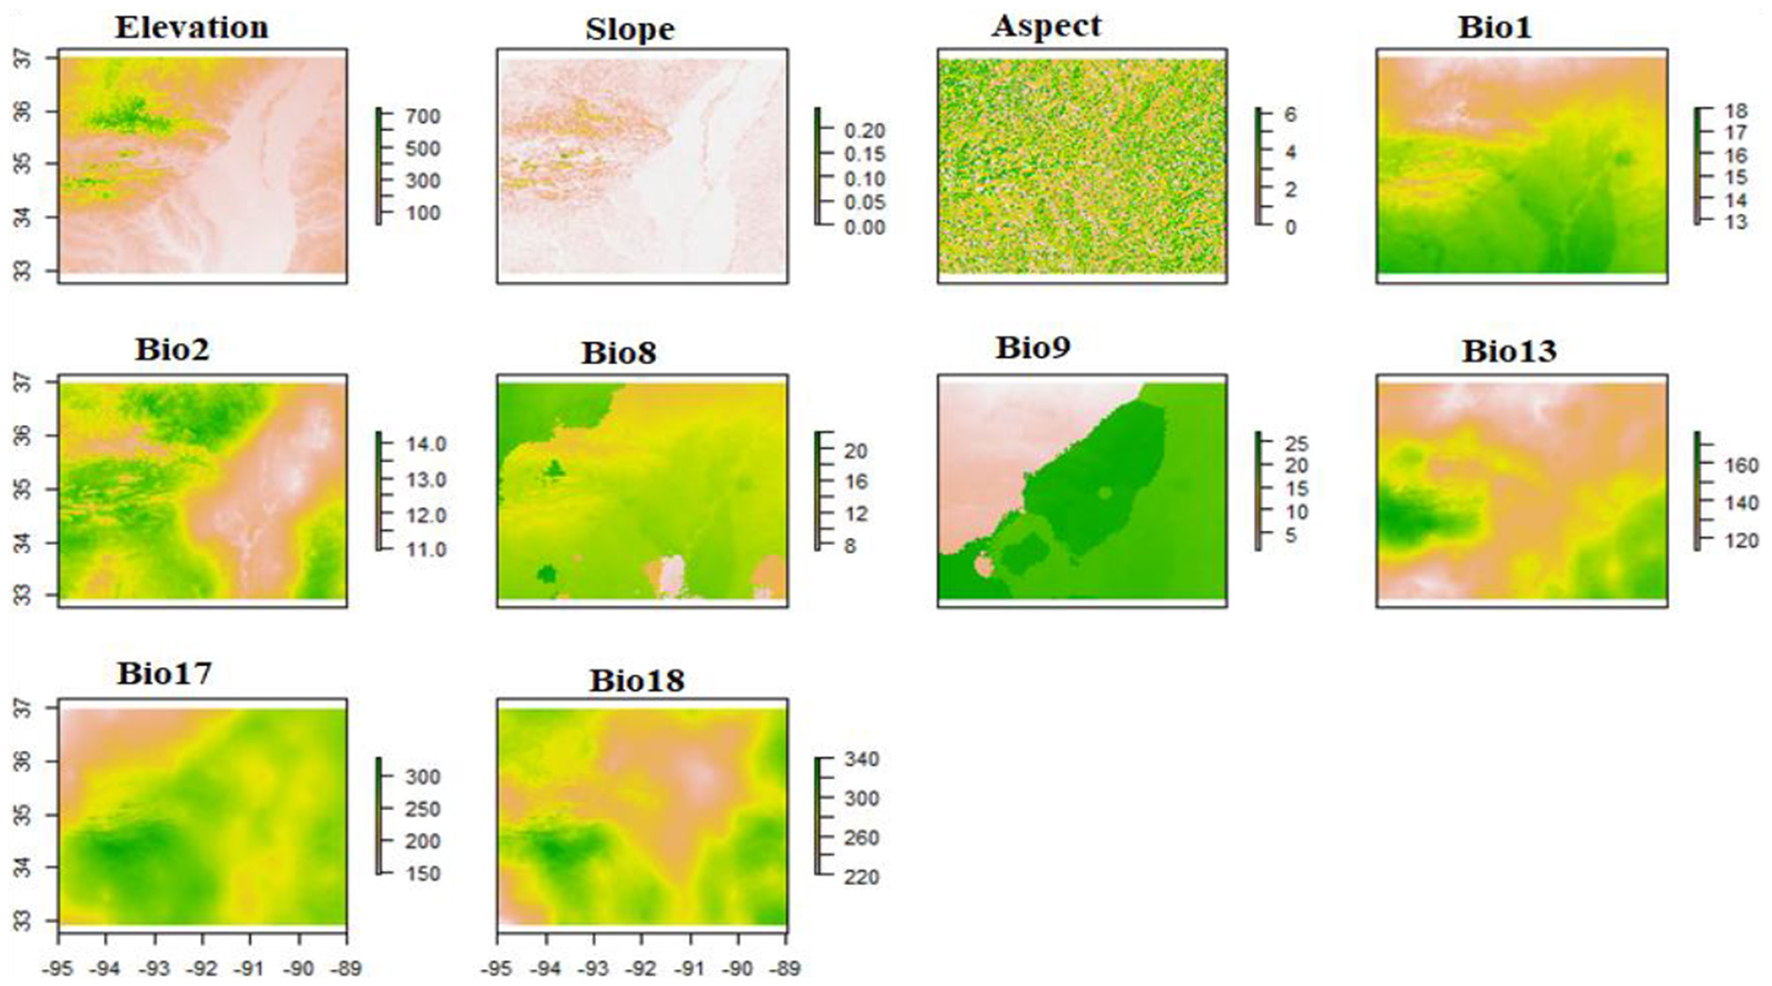
Environmental predictors used in species distribution modeling, topographic (Elevation, Slope, Aspect) and bioclimatic variables (Bio1, Bio2, Bio8, Bio9, Bio13, Bio17, Bio18). Variable descriptions, units, and resolutions are given in Table 3. The X-axis (Longitude) and Y-axis (Latitude) labels are identical across all bioclimatic variable panels.
Modeling framework
We employed an ensemble modeling approach using the BIOMOD2 package (Thuiller et al., 2016, 2020) in R v4.0.0 (R Development Core Team, 2020) to predict oak species richness. BIOMOD2 allows for integration of multiple algorithms and model evaluation metrics to produce robust species distribution models (SDMs). Nine algorithms: Artificial Neural Networks (ANN), Classification Tree Analysis (CTA), Flexible Discriminant Analysis (FDA), Generalized Additive Models (GAM), Generalized Boosted Models (GBM), Generalized Linear Models (GLM), Maximum Entropy (MAXENT), Random Forest (RF) and Surface Range Envelope (SRE), were included to generate ensemble models. Presence and pseudo-absence data for each species were split into training (70%) and testing data sets (30%). With the training dataset, we randomly generated 10,000 pseudo-absence points (within the current native range in state of Arkansas, outside of the 1-km buffer area places around each occurrence point), where we assigned equal weight to the presence and pseudo-absence datasets and repeated the pseudo-absence generation three times to avoid random bias. This approach, comprising nine algorithms, three pseudo-absence selection and three evaluation runs resulted in a total of 81 model runs for each species. Model accuracy was evaluated using the True Skill Statistic (TSS) and the Area Under the Curve (AUC) of the Receiver Operating Characteristic (ROC). We selected all models with TSS value > 0.8 and AUC value > 0.9 to build an ensemble model through a weighted mean approach.
The ensemble model, representing an average consensus across all algorithms, was used to produce continuous habitat suitability maps, which were further used to generate oak species richness maps by stacking individual species predictions. These outputs allowed for identification of oak richness “hot spots” and assessment of environmental drivers across space. Across all 26 modeled species, final ensemble models showed strong performance (AUC range: 0.72–0.94; TSS range: 0.61–0.85), confirming reliable discrimination and predictive ability.
Results
Spatial distribution and hotspot for oaks
Our multi-species ensemble distribution modeling showed clear spatial patterns of oak species richness across Arkansas (Figure 4). Species richness was highest in the northeastern and central parts of the state, with Crowley's Ridge (Mississippi Valley Loess Plains ecoregion) emerging as the primary hotspot (Figure 4). The model predicted that up to 20 oak species (out of 26 native species) could co-occur in parts of Crowley's Ridge. The Arkansas River Valley ecoregion exhibited the second-highest richness, with predictions of up to 18 species. In contrast, other regions—such as the Mississippi Alluvial Plain (Delta) and parts of the West Gulf Coastal Plain—showed lower oak species richness, with fewer than 12 species (Supplementary Figure 1). The upland Ozark and Ouachita Mountains had intermediate richness levels, 12–16 species (Supplementary Figure 2).
Figure 4
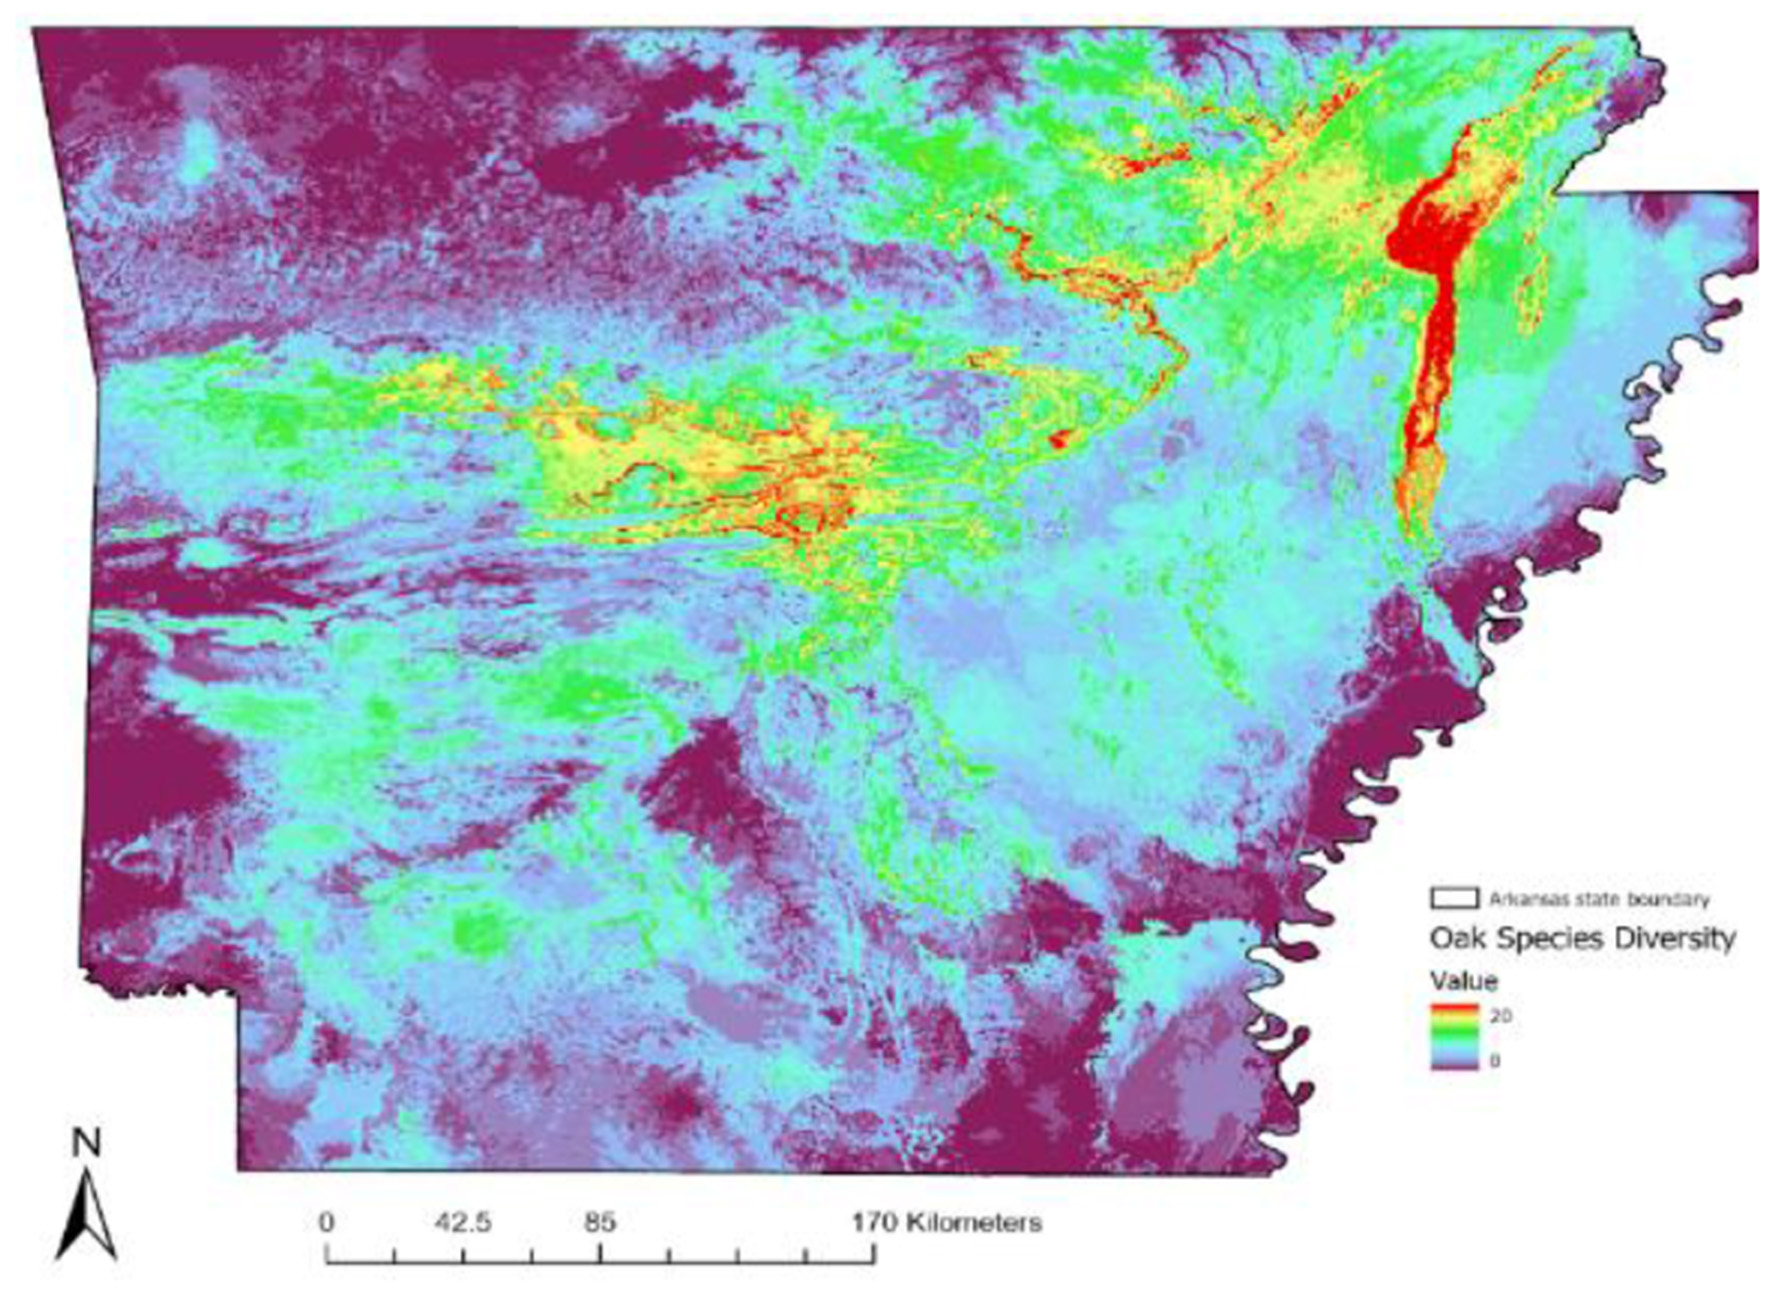
Modeled oak species richness in Arkansas using ensemble species distribution models. The map shows predicted species richness, with warmer colors indicating higher richness (up to 20 species) and cooler colors showing lower richness (as few as 9 species).
At the county level, several northeastern counties such as Clay, Lawrence, Jackson, Randolph, Sharp, Cross, and Poinsett had the highest number of oak species (Figure 5). These counties correspond to the Crowley's Ridge region and adjacent landscapes. In contrast, southeastern counties such as Desha and Chicot, located along the Mississippi River within the Delta Plain, showed much lower oak species richness.
Figure 5
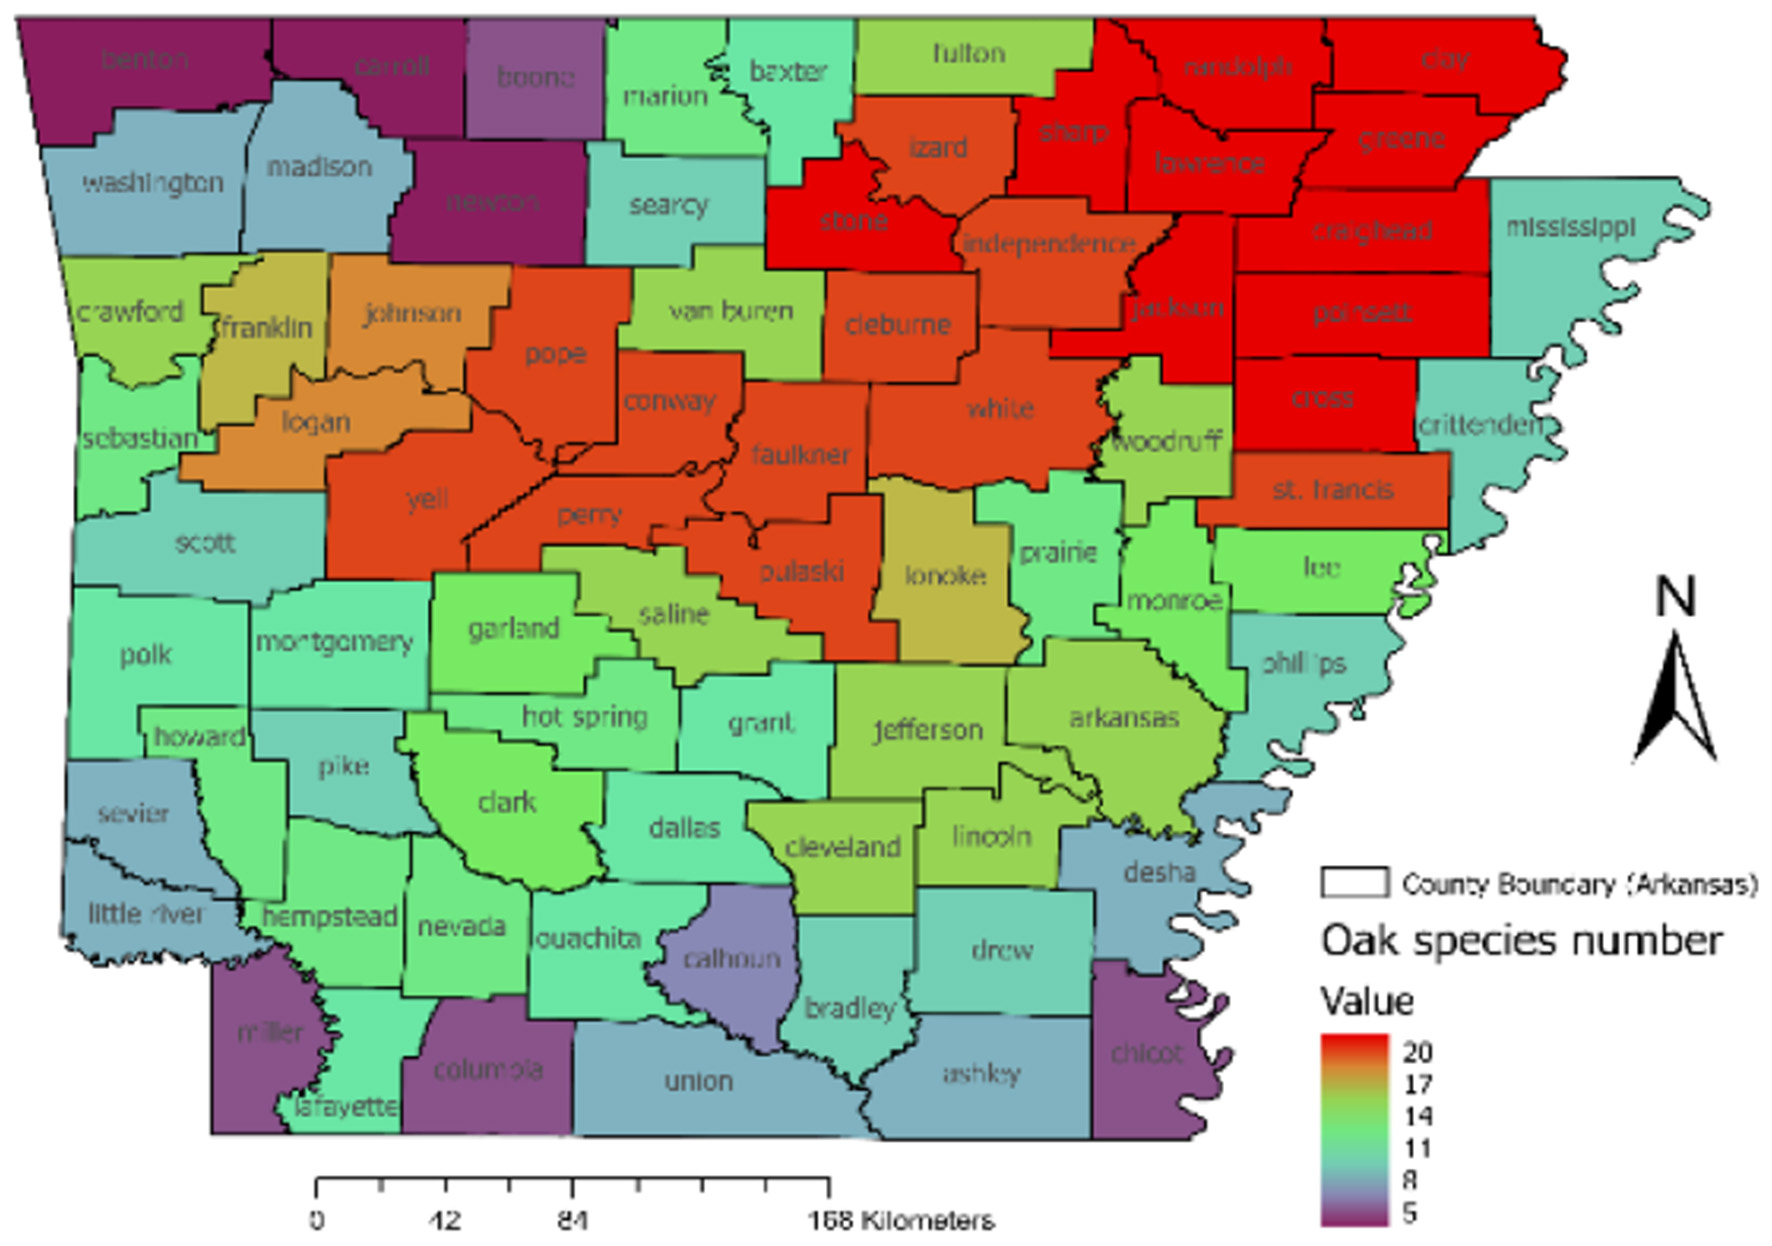
Oak species richness at the county level, with warmer colors (red) indicating higher species richness and cooler colors (blue, purple) representing lower richness.
Key environmental and topographic factors
Out of 10 bioclimatic and topographic variables, three variables (Bio18, Bio9, and elevation) accounted for over 80% of the explained model variation in oak richness (Figure 6). Bio18 (summer precipitation) was the most important predictor in most models (>45% relative importance), followed by Bio9 (mean temperature of driest quarter) with >23 % relative importance and elevation with >12% relative importance. The remaining seven variables each explained less than 5% of the variation in model prediction.
Figure 6
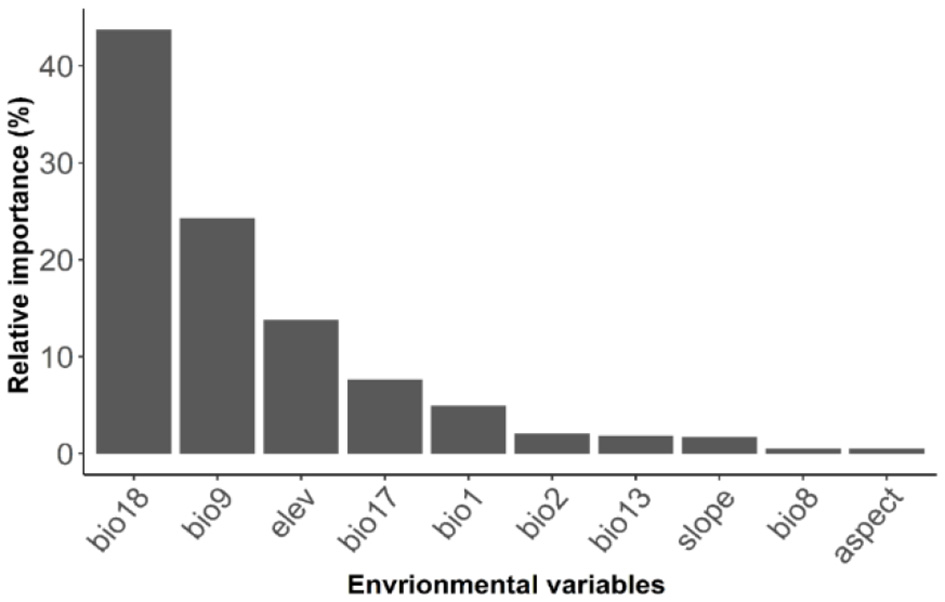
Relative importance of 10 environmental variables used in predicting oak species richness.
Response curves of Bio18 and Bio9 indicated that oak richness is greatest in areas with low precipitation in the warmest quarter (~250 mm over summer months) (Figure 7) and mild to warm mean temperatures during the driest quarter (~15–25 °C), while extremely hot and dry conditions led to lower species richness (Figure 8). Elevation was also a critical factor as the model indicated that oak species richness peaks at intermediate elevations (~100 m from the mean above sea level). Low-lying areas near 50 m (typical of the flat delta) and higher elevations above ~300 m (in the Ozark and Ouachita highlands) had fewer species (Figure 9). This mid-elevation peak (100–150 m) corresponds to landscapes such as Crowley's Ridge and parts of the Arkansas Valley foothills, suggesting that coexistence of upland and lowland habitat conditions at these elevations promotes a higher oak species richness.
Figure 7
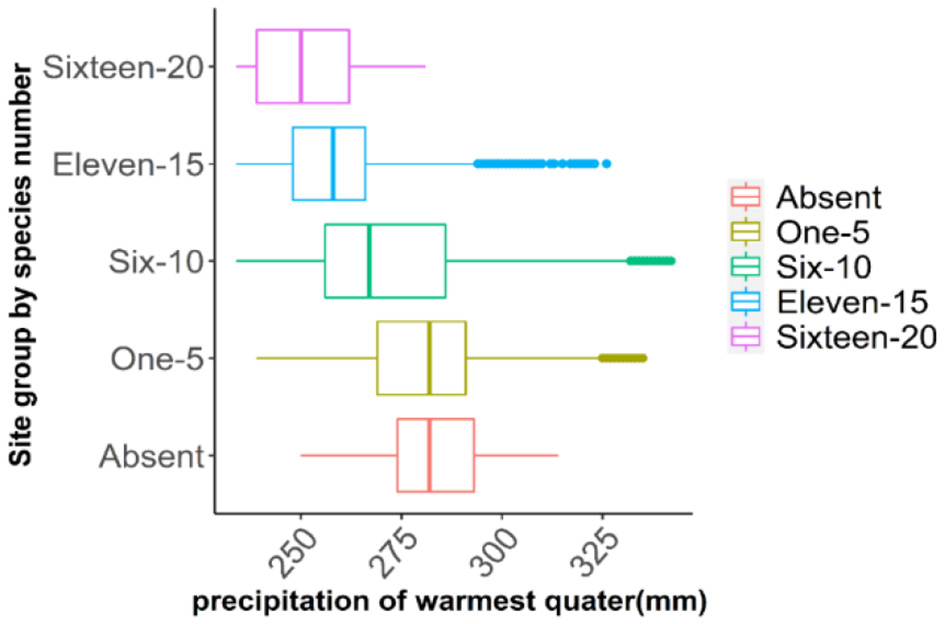
Predicted oak species richness in relation to precipitation during the warmest quarter (Bio18). The map categorizes predicted species richness into five groups: areas with no oak species (absent), low richness (1–5 species), moderate (6–10), high (11–15), and very high richness (16–20 species).
Figure 8
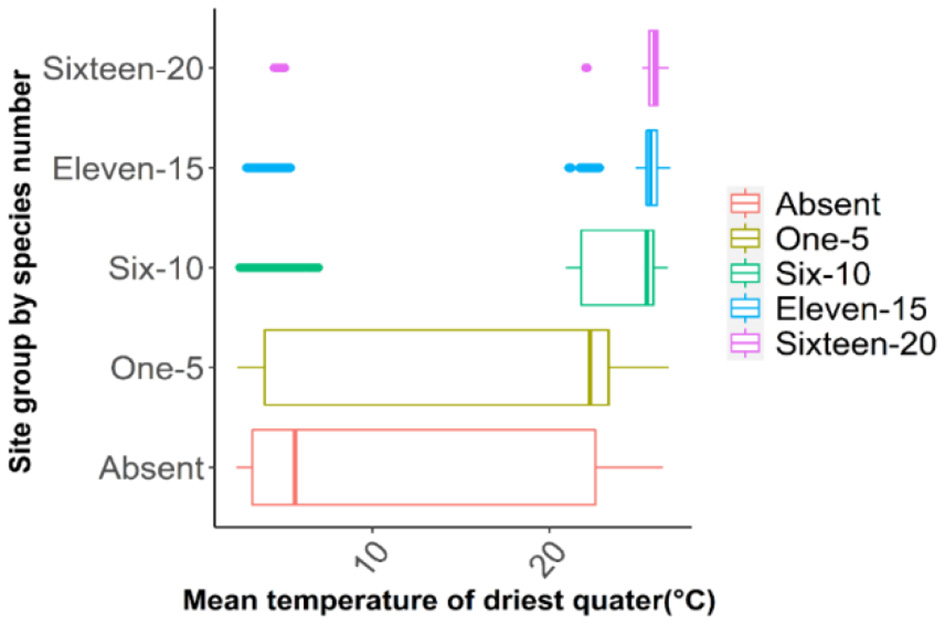
Predicted oak species richness in relation to mean temperature of the driest quarter (Bio9). The map classifies species richness into five categories, from absent to very high (16–20 species).
Figure 9
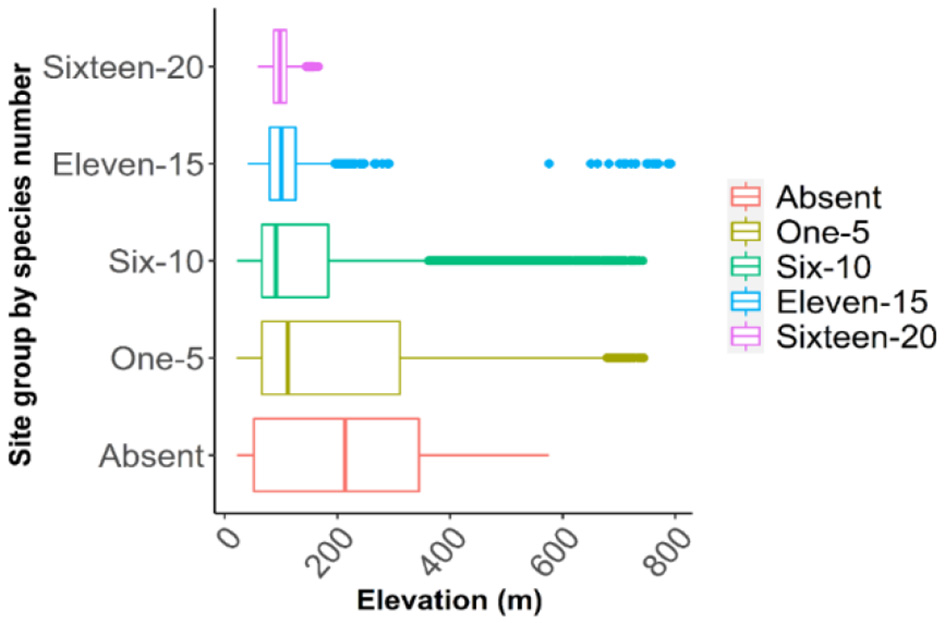
Predicted oak species richness in relation to elevation (m, above sea level). The map categorizes predicted oak species richness into five groups: areas with no oak species (absent), low richness (1–5 species), moderate (6–10), high (11–15), and very high richness (16–20 species).
Discussion
Spatial patterns and environmental drivers
Our findings reveal that oak richness varied across Arkansas, with strong ties to environmental gradients. The identification of Crowley's Ridge as a hotspot highlights the influence of unique local conditions in shaping patterns of oak species richness. Crowley's Ridge represents an isolated upland landform within the Mississippi Alluvial Plain characterized by fertile loess soils that support various tree species. These conditions differ from the surrounding flat, water-logged delta, enabling Crowley's Ridge to support a mix of oak species that depend on well-drained, nutrient-rich soils and moderate moisture. Mesic loess hill forests of Crowley's Ridge also support oak species absent from the surrounding delta, indicating that topographic and edaphic variation provides refugia for a broader range of oak species. The predicted oak richness peak (20 species) on Crowley's Ridge likely reflects the overlap of species with different habitat affinities.- Upland oaks (e.g., White oak, Q. alba, and Blackjack oak, Q. marilandica) occur on the drier upper slopes, whereas bottomland or mesic-site oaks (e.g., Cherrybark oak, Q. pagoda, and Shumard oak, Q. shumardii) occur lower slope positions where conditions are more favorable.
The observed oak richness pattern aligns with ecological theory that habitat heterogeneity and intermediate environmental conditions support higher richness. Both excessively xeric (dry) and excessively hydric (wet) environments tend to filter out many species, whereas intermediate environments (like those on Crowley's Ridge or the Arkansas Valley) can accommodate species adapted to a range of moisture and temperature conditions (Braun, 1950; Abrams, 1996). The combination of moderate elevation, loess soil, and mesic microclimate on Crowley's Ridge has the highest oak species richness in Arkansas. The Arkansas River Valley's high oak richness can be explained by its transitional nature—it contains floodplain forests, rolling hills, and foothills of two mountain ranges, creating a variety of niches for different oak species. Notably, oak species richness declines in the highest elevations of the Ozark and Ouachita Mountains, likely because only a subset of oak species is adapted to the thinner soils, cooler temperatures, and increased wind exposure. For instance, certain thermophilic bottomland oaks are largely absent at high elevation. Elevation's hump-shaped effect on richness (peak at ~100 m) exemplifies a mid-elevation richness peak, a phenomenon observed in other mountainous regions where species from lower and higher zones overlap at middle elevations (Subedi et al., 2015, 2020). While Arkansas's topographic relief is moderate compared to major mountain ranges, even these modest gradients are sufficient to create distinct microclimates. In Arkansas, climate variables (Bio9 and Bio18) emerged as the strongest predictors of oak richness, emphasizing the importance of seasonal moisture and temperature in driving oak distributions. This result is consistent with prior research indicating that moisture availability during the growing season is often the limiting factor for tree species richness in temperate forests (Prasad et al., 2013). Although many oak species are drought-tolerant, they might tolerate drought only up to a certain point. Areas that provide relief from extreme heat and drought through higher summer rainfall or cooler dry-season temperatures, can support both drought-hardy oaks and more moisture-demanding oaks, thereby increasing total richness. Conversely, some regions in Arkansas that experience very hot and dry summers (e.g., parts of the southwestern plains) or periodically waterlogged soils (e.g., parts of the delta) tend to be dominated by a few specialist oak species adapted to those extreme conditions (Abrams, 1996; Hanberry and Nowacki, 2016). Our findings support the hypothesis that climate and topography interact in shaping oak species richness. Even subtle differences in microclimate (such as slightly cooler, wetter summers on a north-facing loess slope compared to a sunbaked open spaces) can lead to pronounced variation in species coexistence.
While Arkansas hosts a reasonable number of oak species, it is important to discuss this in a broader biogeographical context. The Appalachian region (especially the southern Appalachians and Cumberland Plateau to the east) and the Interior Highlands (Ozark-Ouachita Mountains, spanning Arkansas and Missouri) are often noted for their rich hardwood diversity, including oaks (Braun, 1950; Johnson et al., 2019). Historical reconstructions suggest that oaks were a foundation genus in eastern North America's forests (Hanberry and Nowacki, 2016), dominating large swaths of the Appalachian and Interior Highland landscapes. However, even these broader regions do not approach the global oak species richness found in Mexico, which is the world's hotspot for oak richness. More than 160 oak species are reported from Mexico (Nixon, 2006; Manos and Hipp, 2021), owing to its complex terrain and climate diversity ranging from arid mountains to humid cloud forests. In Arkansas, the distribution of oak species is highly non-uniform. Interestingly, the mesophytic loess forests of Crowley's Ridge share some characteristics with the mixed mesophytic forests of the Appalachian foothills. Both areas harbor species-rich communities where oaks co-occur with numerous other hardwoods due to favorable moisture and soil conditions (Braun, 1950). In contrast, the extensive flat Mississippi Alluvial Plain flanking Crowley's Ridge is analogous to coastal plain or piedmont regions elsewhere. These areas typically have fewer oak species because of more homogeneous conditions (either too wet or recently disturbed for agriculture.
In the Ouachita and Ozark Mountains of Arkansas, oak diversity is relatively low because only a few species can tolerate the harsh mountain environment. High-elevation sites in these regions have thin, rocky soils and extreme climatic conditions (frequent ice, wind, and drought) that exclude many oak species. As a result, a few oak species (e.g., Q. stellata, Q. alba, Q. rubra, and Q. veluntina) dominate these exposed ridges. Some specialized endemic oaks survive in these rugged habitats. For example, the maple-leaf oak (Q. acerifolia) persists on dry, rocky slopes and bluffs of a few mountain peaks (Subedi et al., 2022). This rare endemic species is adapted to xeric environments and has been reported from just four isolated high-mountain sites (Subedi et al., 2022). This illustrates that while the interior highlands' severe environment supports fewer oak species, however, it harbors unique specialists that have evolved to survive there.
Implications for climate change and conservation
The strong influence of temperature and precipitation variables (Bio9 and Bio18) in our models suggests that oak diversity in Arkansas is likely sensitive to climate change. As global temperatures rise and precipitation patterns shift, the habitat suitability for many oak species in the region could be altered. Climate projections for the south-central U.S. indicate warmer summers and potentially more frequent droughts interspersed with heavy rain events. Species range shifts are expected consequence- some oak species may contract from their current range in Arkansas if local conditions become too warm or dry for them to compete, while others that are more heat-tolerant might persist or even expand. However, oaks have certain traits that complicate their response to rapid climate change. They are long-lived and slow to migrate, primarily due to limited seed dispersal distances (Davis and Shaw, 2001).
The resulting oak diversity map offers a valuable spatial framework for ecologists and forest managers. It pinpoints where conservation efforts could be prioritized, such as areas along Crowley's Ridge and Arkansas Valley that serve as reservoirs of oak genetic and species richness. These findings also contribute to a broader understanding of oak biogeography, demonstrating how a combination of climate variables and topography at a regional scale can influence oaks known for their ecological dominance. These findings provide a solid empirical basis for identifying priority areas and key factors for oak conservation and further ecological investigation.
Oak species richness in Arkansas is concentrated in specific regions, such as Crowley's Ridge and the Arkansas River Valley. These areas should be prioritized for protection to preserve habitat conditions that support both upland and bottomland oak species. Given the strong influence of climate variables, particularly temperature and precipitation seasonality, future shifts in these factors may reduce habitat suitability, especially in southern and lowland regions. Therefore, management efforts should focus on preserving high-diversity areas identified in our models and monitoring changes in oak species composition over time.
Conclusion
This study provides the comprehensive spatial assessment of oak species richness across Arkansas, revealing that oak species richness is unevenly distributed and strongly influenced by environmental gradients, particularly elevation, seasonal precipitation, and temperature. Oak richness hotspots, such as Crowley's Ridge and the Arkansas River Valley, highlight the importance of mesic microclimates, topographic diversity, and edaphic conditions in sustaining high oak richness. In contrast, extremes in soil moisture and climate, whether too dry, wet, or elevated, limit species richness to a few specialists (Subedi et al., 2019).
Our findings underscore the vulnerability of oak communities to climate change, with projected increases in drought and temperature likely to reduce habitat suitability in parts of the state. Given oaks' limited dispersal ability and the fragmented landscape, proactive conservation strategies are essential. These include protecting high-diversity areas, enhancing habitat connectivity, and implementing adaptive forest management practices that account for future climate scenarios (Subedi et al., 2019).
Although this study provides important insights into oak species richness across Arkansas, several limitations should be acknowledged. First, the analysis relies primarily on existing occurrence records, and direct field sampling of current distributions through finer-scale surveys would improve resolution and accuracy. Second, the environmental predictors used here do not fully capture fine-scale variation in soil characteristics, which can strongly influence oak establishment and persistence. Third, the models did not explicitly incorporate biotic interactions, such as competition with other tree species or the role of pests and pathogens (Sallé et al., 2014), which may significantly shape oak distributions. Future work addressing these limitations, through targeted field surveys, integration of fine-scale environmental and disturbance data, and incorporation of biotic interactions, will provide a more comprehensive understanding of oak diversity patterns and their vulnerability under climate change.
Statements
Data availability statement
The datasets presented in this study can be found in online repositories. The names of the repository/repositories and accession number(s) can be found in the article/Supplementary material.
Author contributions
SS: Formal analysis, Investigation, Methodology, Writing – review & editing, Writing – original draft, Validation, Visualization, Conceptualization, Project administration. SB: Methodology, Writing – original draft, Writing – review & editing, Visualization. BA: Writing – original draft, Conceptualization, Writing – review & editing, Methodology, Visualization.
Funding
The author(s) declare that no financial support was received for the research and/or publication of this article.
Acknowledgments
Thanks to the Southeast Regional Network of Expertise and Collections (SERNEC) for providing herbarium records. Thanks to undergraduate students at Norfolk State University for assistance in geolocating herbarium specimens. We would like to acknowledge a Summer Research Award for this project from Center for Teaching and Learning at Norfolk State University.
Conflict of interest
The authors declare that the research was conducted in the absence of any commercial or financial relationships that could be construed as a potential conflict of interest.
Generative AI statement
The author(s) declare that no Gen AI was used in the creation of this manuscript.
Any alternative text (alt text) provided alongside figures in this article has been generated by Frontiers with the support of artificial intelligence and reasonable efforts have been made to ensure accuracy, including review by the authors wherever possible. If you identify any issues, please contact us.
Publisher’s note
All claims expressed in this article are solely those of the authors and do not necessarily represent those of their affiliated organizations, or those of the publisher, the editors and the reviewers. Any product that may be evaluated in this article, or claim that may be made by its manufacturer, is not guaranteed or endorsed by the publisher.
Supplementary material
The Supplementary Material for this article can be found online at: https://www.frontiersin.org/articles/10.3389/ffgc.2025.1624716/full#supplementary-material
References
1
Abrams M. D. (1996). Distribution, historical development and ecophysiological attributes of oak species in the eastern United States. Annales des Sciences Forestières53, 487–512. 10.1051/forest:19960230
2
Adhikari B. Subedi S. C. Bhandari S. Baral K. Lamichhane S. Maraseni T. (2023). Climate-driven decline in the habitat of the endemic spiny babbler (Turdoides nipalensis). Ecosphere 14:e4584. 10.1002/ecs2.4584
3
Braun E. L. (1950). Deciduous Forests of Eastern North America. New York: Hafner Press. 10.1097/00010694-195102000-00012
4
Davis M. B. Shaw R. G. (2001). Range shifts and adaptive responses to quaternary climate change. Science292, 673–679. 10.1126/science.292.5517.673
5
Dormann C. F. Elith J. Bacher S. Buchmann C. Carl G. Carré G. et al . (2013). Collinearity: a review of methods to deal with it and a simulation study evaluating their performance. Ecography36, 27–46. 10.1111/j.1600-0587.2012.07348.x
6
Guldin J. M. Heitzman E. Spetich M. A. (2006). “Silvicultural options in forests affected by oak decline,” in Proceedings of the 13th Biennial Southern Silvicultural Research Conference, ed. K. F. Connor (Asheville, NC: USDA Forest Service, Southern Research Station), 605–610.
7
Hanberry B. B. Nowacki G. J. (2016). Oaks were the historical foundation genus of the east-central United States. Quat. Sci. Rev.145, 94–103. 10.1016/j.quascirev.2016.05.037
8
Heitzman E. (2003). Oak decline in the Ozark highlands: a regional perspective. South. J. Appl. For.27, 17–21. 10.1093/sjaf/27.4.264
9
Hipp A. L. Manos P. S. Hahn M. Avishai M. Bodénès C. Cavender-Bares J. Valencia-Avalos S. (2020). Genomic landscape of the global oak phylogeny. New Phytol.226, 1198–1212. 10.1111/nph.16162
10
Ibáñez I. Clark J. S. Dietze M. C. Feeley K. Hersh M. LaDeau S. Wolosin M. S. (2008). Predicting biodiversity change: outside the climate envelope, beyond the species-area curve. Ecology89, 956–966.
11
Johnson P. S. Shifley S. R. Rogers R. (2019). The Ecology and Silviculture of Oaks, 2nd Edn. London: CABI. 10.1079/9781780647081.0000
12
Kremer A. Hipp A. L. (2020). Oaks: an evolutionary success story. New Phytol.226, 987–1011. 10.1111/nph.16274
13
Manos P. S. Hipp A. L. (2021). An updated infrageneric classification of the North American oaks (Quercus subgenus Quercus): review of the contribution of phylogenomic data to biogeography and species diversity. Forests12:786. 10.3390/f12060786
14
McWilliams W. H. O'Brien R. A. Reese G. C. Waddell K. L. (2002). Distribution and Abundance of Oaks in North America. Oak Forest Ecosystems: Ecology and Management for Wildlife. Baltimore, Maryland, USA: Johns Hopkins University Press, 13–33.
15
Nixon K. C. (2006). “Global and neotropical distribution and diversity of oak (genus Quercus) and oak forests,” in Ecology and Conservation of Neotropical Montane Oak Forests (Berlin, Heidelberg: Springer Berlin Heidelberg), 3–13. 10.1007/3-540-28909-7_1
16
Prasad A. M. Gardiner J. D. Iverson L. R. Matthews S. N. Peters M. (2013). Exploring tree species colonization potentials using a spatially explicit simulation model: implications for four oaks under climate change. Glob. Change Biol.19, 2196–2208. 10.1111/gcb.12204
17
R Development Core Team (2020). R: A Language and Environment for Statistical Computing. Vienna: R Foundation for Statistical Computing.
18
Ramírez-Preciado R. P. Gasca-Pineda J. Arteaga M. C. (2019). Effects of global warming on the potential distribution ranges of six Quercus species (Fagaceae). Flora251, 32–38. 10.1016/j.flora.2018.12.006
19
Rios N. E. Bart H. L. (2010). GEOLocate (Version 3.22) [computer software]. Belle Chasse, LA: Tulane University Museum of Natural History.
20
Rodà F. Retana J. Garcia C. A. Bellot J. (1999). Ecology of Mediterranean Evergreen Oak Forests. Springer Science & Business Media. Available online at: https://link.springer.com/book/10.1007/978-3-642-58618-7 (Assessed May 1, 2025).
21
Sallé A. Nageleisen L. M. Lieutier F. (2014). Bark and wood boring insects involved in oak declines in Europe: current knowledge and future prospects in a context of climate change. For. Ecol. Manage.328, 79–93. 10.1016/j.foreco.2014.05.027
22
SERNEC Data Portal (2022). Available online at: https://sernecportal.org/portal/ (Assessed December 2022)
23
Subedi S. C. Bhattarai K. R. Chauudhary R. P. (2015). Distribution pattern of vascular plant species of mountains in Nepal and their fate against global warming. J. Mountain Sci.12, 1345–1354. 10.1007/s11629-015-3495-9
24
Subedi S. C. Bhattarai K. R. Perez T. M. Sah J. P. (2020). Gymnosperm species richness patterns along the elevational gradient and its comparison with other plant taxonomic groups in the Himalayas. Front. Biogeogr. 12:e44232. 10.21425/F5FBG44232
25
Subedi S. C. Drake S. Adhikari B. Coggeshall M. V. (2024). Climate-change habitat shifts for the vulnerable endemic oak species (Quercus arkansana Sarg.). J. For. Res.35:23. 10.1007/s11676-023-01673-8
26
Subedi S. C. Hogan J. A. Ross M. S. Sah J. P. Baraloto C. (2019). Evidence for trait-based community assembly patterns in hardwood hammock forests. Ecosphere10:e02956. 10.1002/ecs2.2956
27
Subedi S. C. Ruston B. Hogan J. A. Coggeshall M. V. (2023). Defining the extent of suitable habitat for the endangered Maple-Leaf oak (Quercus acerifolia). Front. Biogeogr. 15:e58763. 10.21425/F5FBG58763
28
Subedi S. C. Walls S. C. Barichivich W. J. Boyles R. Ross M. S. Hogan J. A. Tupy J. A. (2022). Future changes in habitat availability for two specialist snake species in the imperiled rocklands of South Florida, USA. Conserv. Sci. Pract.4:e12802. 10.1111/csp2.12802
29
Tantray Y. R. Wani M. S. Hussain A. (2017). Genus Quercus: an overview. Int. J. Adv. Res. Sci. Eng.6, 1880–1886.
30
Thuiller W. Georges D. Engler R. Breiner F. (2020). biomod2: Ensemble platform for species distribution modeling. R package version 3.4.6. Available online at: https://cran.r-project.org/web/packages/biomod2/index.html (Assessed May 1, 2025).
31
Thuiller W. Georges D. Engler R. Breiner F. Georges M. D. Thuiller C. W. (2016). Species Distribution Modeling Within an Ensemble Forecasting Framework.
Summary
Keywords
oak species richness, climate change, oak diversity, species distribution modeling, Arkansas
Citation
Subedi SC, Bhandari S and Adhikari B (2025) Mapping oak diversity and habitat suitability using multi-species niche modeling. Front. For. Glob. Change 8:1624716. doi: 10.3389/ffgc.2025.1624716
Received
07 May 2025
Accepted
09 October 2025
Published
05 November 2025
Volume
8 - 2025
Edited by
Toshiaki Owari, The University of Tokyo, Japan
Reviewed by
Prashant Sharma, National Academy of Agricultural Research Management (ICAR), India
Kyaw Thu Moe, Swedish University of Agricultural Sciences, Sweden
Updates
Copyright
© 2025 Subedi, Bhandari and Adhikari.
This is an open-access article distributed under the terms of the Creative Commons Attribution License (CC BY). The use, distribution or reproduction in other forums is permitted, provided the original author(s) and the copyright owner(s) are credited and that the original publication in this journal is cited, in accordance with accepted academic practice. No use, distribution or reproduction is permitted which does not comply with these terms.
*Correspondence: Suresh C. Subedi subedi.suresh@gmail.com
Disclaimer
All claims expressed in this article are solely those of the authors and do not necessarily represent those of their affiliated organizations, or those of the publisher, the editors and the reviewers. Any product that may be evaluated in this article or claim that may be made by its manufacturer is not guaranteed or endorsed by the publisher.