 Camilla Foggia1*
 Fabio Attorre1
 Carine Bourgeois2
 Elisabetta Candeago3
 Paolo Ramoni-Perazzi1,4
 Luca Malatesta1
- 1Department of Environmental Biology, University of Rome Sapienza, Rome, Italy
- 2U.S. Forest Service International Programs and Trade, Kinshasa, Democratic Republic of the Congo
- 3Department of Agriculture, Food, Environment and Forestry (DAGRI) University of Florence, Florence, Italy
- 4Center of Simulation and Modeling, Engineering Faculty, University of the Andes, Mérida, Venezuela
Introduction: Due to its vulnerability to climate-driven floods and storms, Mozambique faces significant challenges in coastal planning due to limited reliable data. In this context, studying mangrove cover and dynamics could provide valuable insights to enhance coastal area management.
Methods: This study introduces an innovative framework that assesses mangrove extent and coastal vulnerability by integrating the Mangrove Vegetation Index (MVI) with the InVEST Coastal Vulnerability model to accurately identify areas of highest priority for intervention. Using MVI applied to Landsat-8 (30 m) and Sentinel-2 (2023, resampled from 10 m to 30 m) imagery, we mapped mangrove cover for 2013 and 2023, refining accuracy by excluding pixels beyond 1.2 km inland and above 10 m elevation. A cloud-based workflow leveraging Google Earth Engine and QGIS enabled scalable, efficient analysis.
Results: The mangrove area declined from 2,116 km2 in 2013 to 1,739 km2 in 2023—a 18% loss, equivalent to 1.8% annually. The results of the Coastal Vulnerability Model, applied to the entire coast of Mozambique, produced an Exposure Index (EI) for flooding and erosion events. Each point along the coast was classified with values from 1 to 5 at a distance of 100 m from each other: the highest values indicating greater exposure. It emerged that 16.2% of the 11,768.11 km of coastline were classified with an EI as ‘Very Low’, 42% as ‘Low’, 32% as ‘Intermediate’, 9.4% as ‘High’ and 0.1% as ‘Very High’. Considering the points classified with a ‘High’ and ‘Very High’ EI, approximately 1,117.97 km of coastline is highly vulnerable and in need of intervention. Analysis of the impact of Cyclone Idai (2018–2019) on the Púnguè and Buzi River delta revealed a 69% reduction in mangrove cover, from 76 km2 to 23 km2.
Discussion: These findings underscore the urgent need for targeted interventions, prioritizing Sofala and Zambezia for mangrove restoration and nature-based solutions to bolster coastal resilience. This scalable approach advances global mangrove monitoring and supports data-driven coastal management in climate-vulnerable regions.
1 Introduction
Salt-tolerant mangrove ferns, palms and woody plants, thrive in tropical and subtropical intertidal zones and form vital interfaces between land and sea along sheltered coastlines, estuaries, and deltas (Barbosa et al., 2001; Saenger and Saenger, 2002; FAO, 2007). Their unique adaptations such as prop roots and pneumatophores for structural support and gas exchange, porous tissues for efficient oxygen diffusion, salt-exclusion mechanisms, and buoyant propagules for water dispersal, are key to their survival in saline, waterlogged, and tidal environments (Lugo and Snedaker, 1974; Rabinowitz, 1978; Wang et al., 2011; Duke and Schmitt, 2015). These traits also shape clear zonation patterns across intertidal gradients, which in turn support ecosystem resilience and functional diversity (Lugo et al., 1975; Duke et al., 1998).
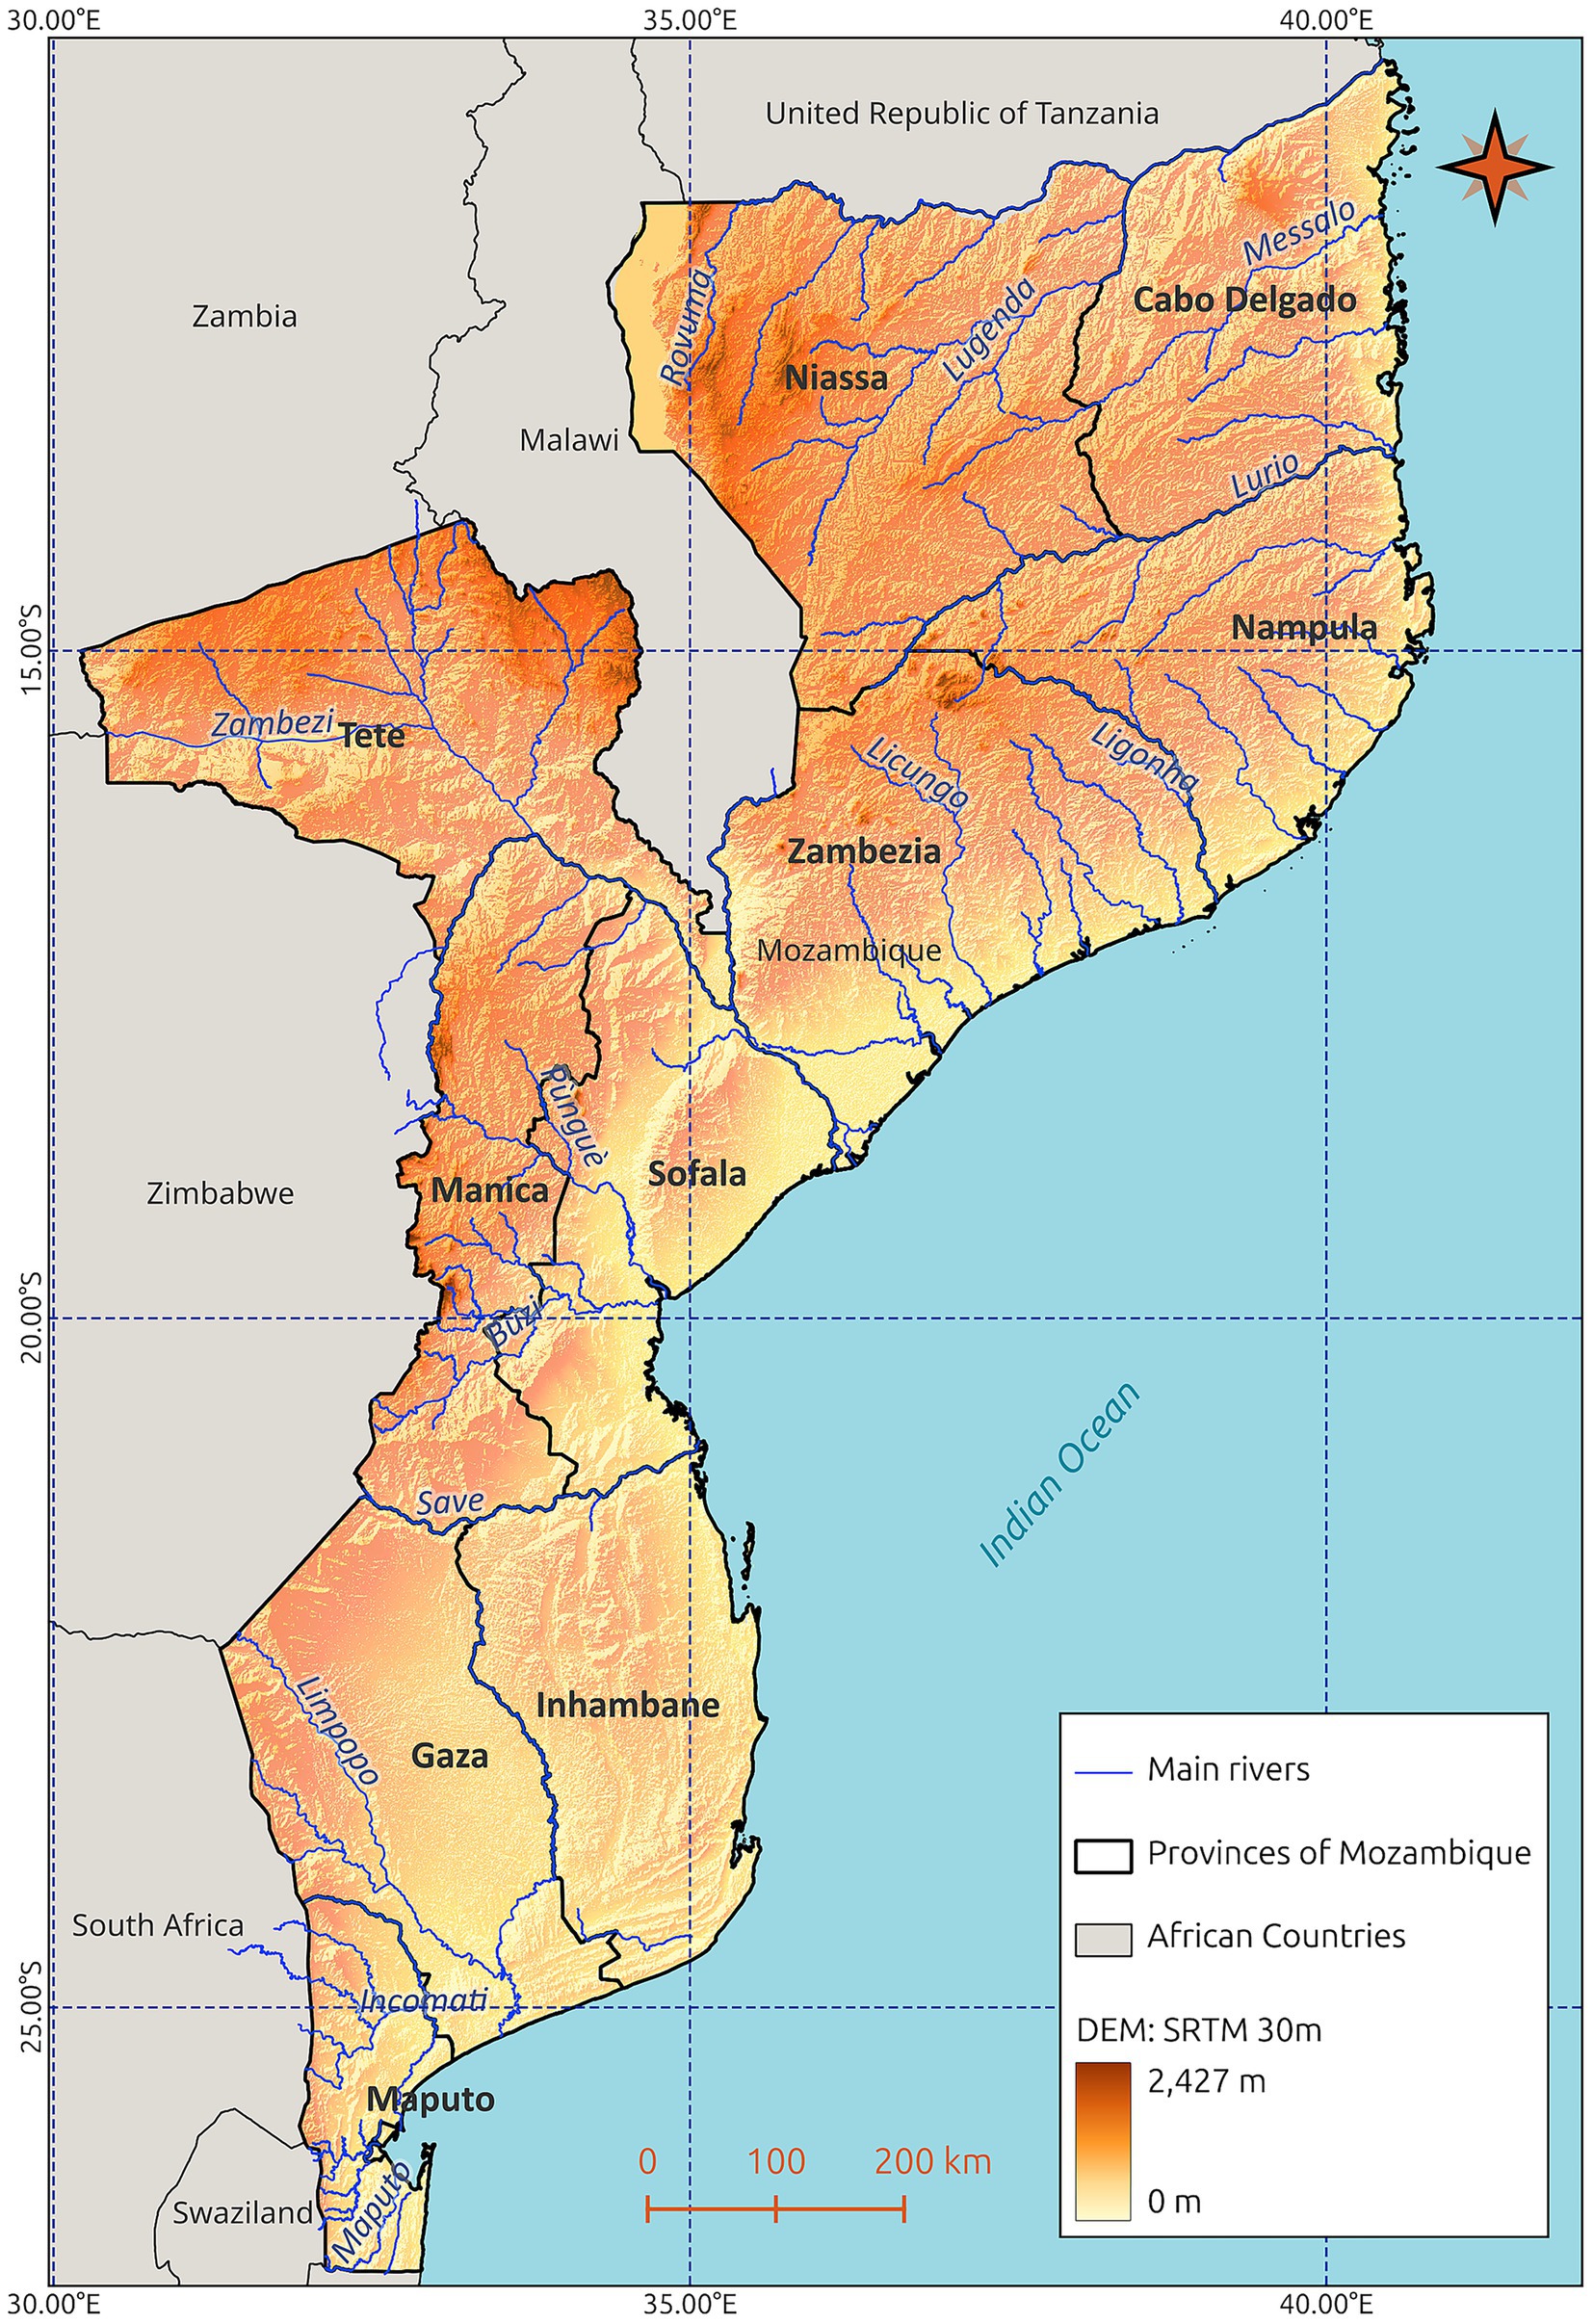
Figure 1. Map of Mozambique showing the main hydrographic network. The map shows the administrative division of the country into provinces, outlined in black, and the network of main waterways (blue lines). The altimetry is represented by a 30-meter resolution SRTM Digital Elevation Model (DEM). The countries bordering Mozambique and the Indian Ocean to the east are also shown. The map is georeferenced with geographic coordinates in decimal degrees (WGS 84).
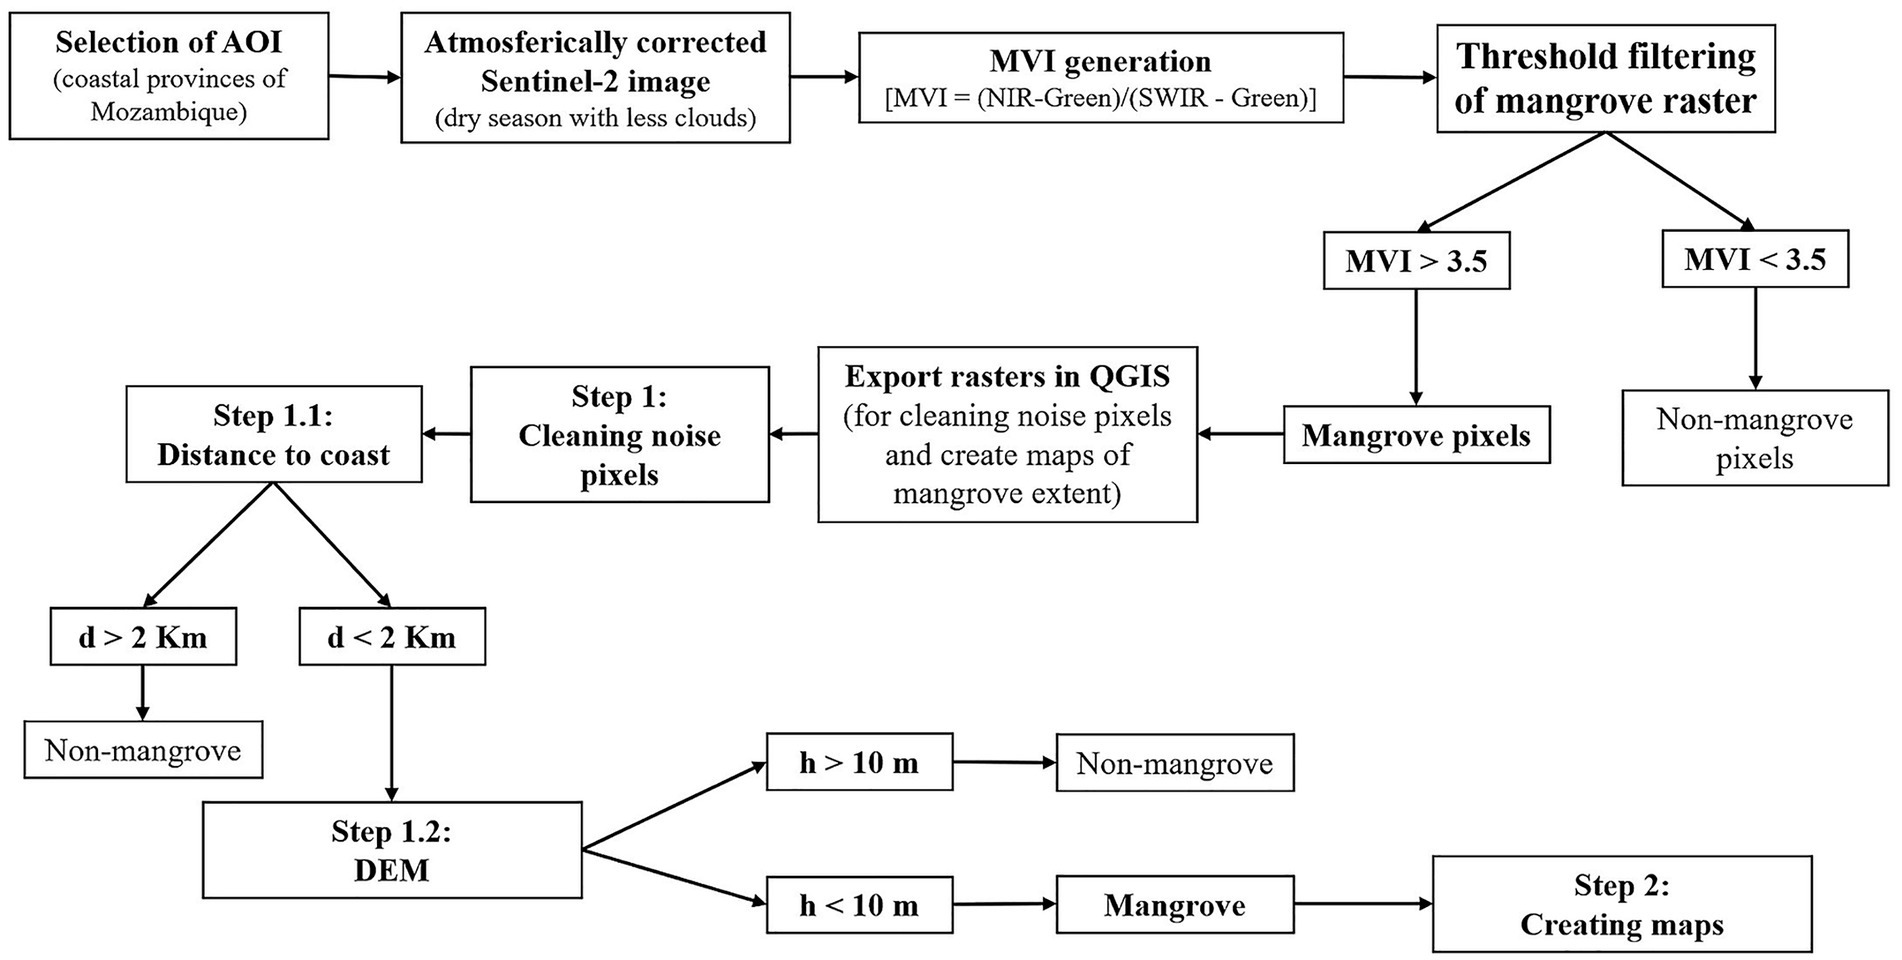
Figure 2. Workflow for generating MVI-based mangrove maps from Sentinel-2 and Landsat-8 imagery. The process uses atmospherically corrected images as inputs, combining the green, SWIR1, and NIR bands to produce the MVI output in Google Earth Engine. A thresholding step separates mangrove pixels from other land cover classes. The resulting mangrove layer is then exported to QGIS for noise removal, map layout preparation, and statistical analysis.
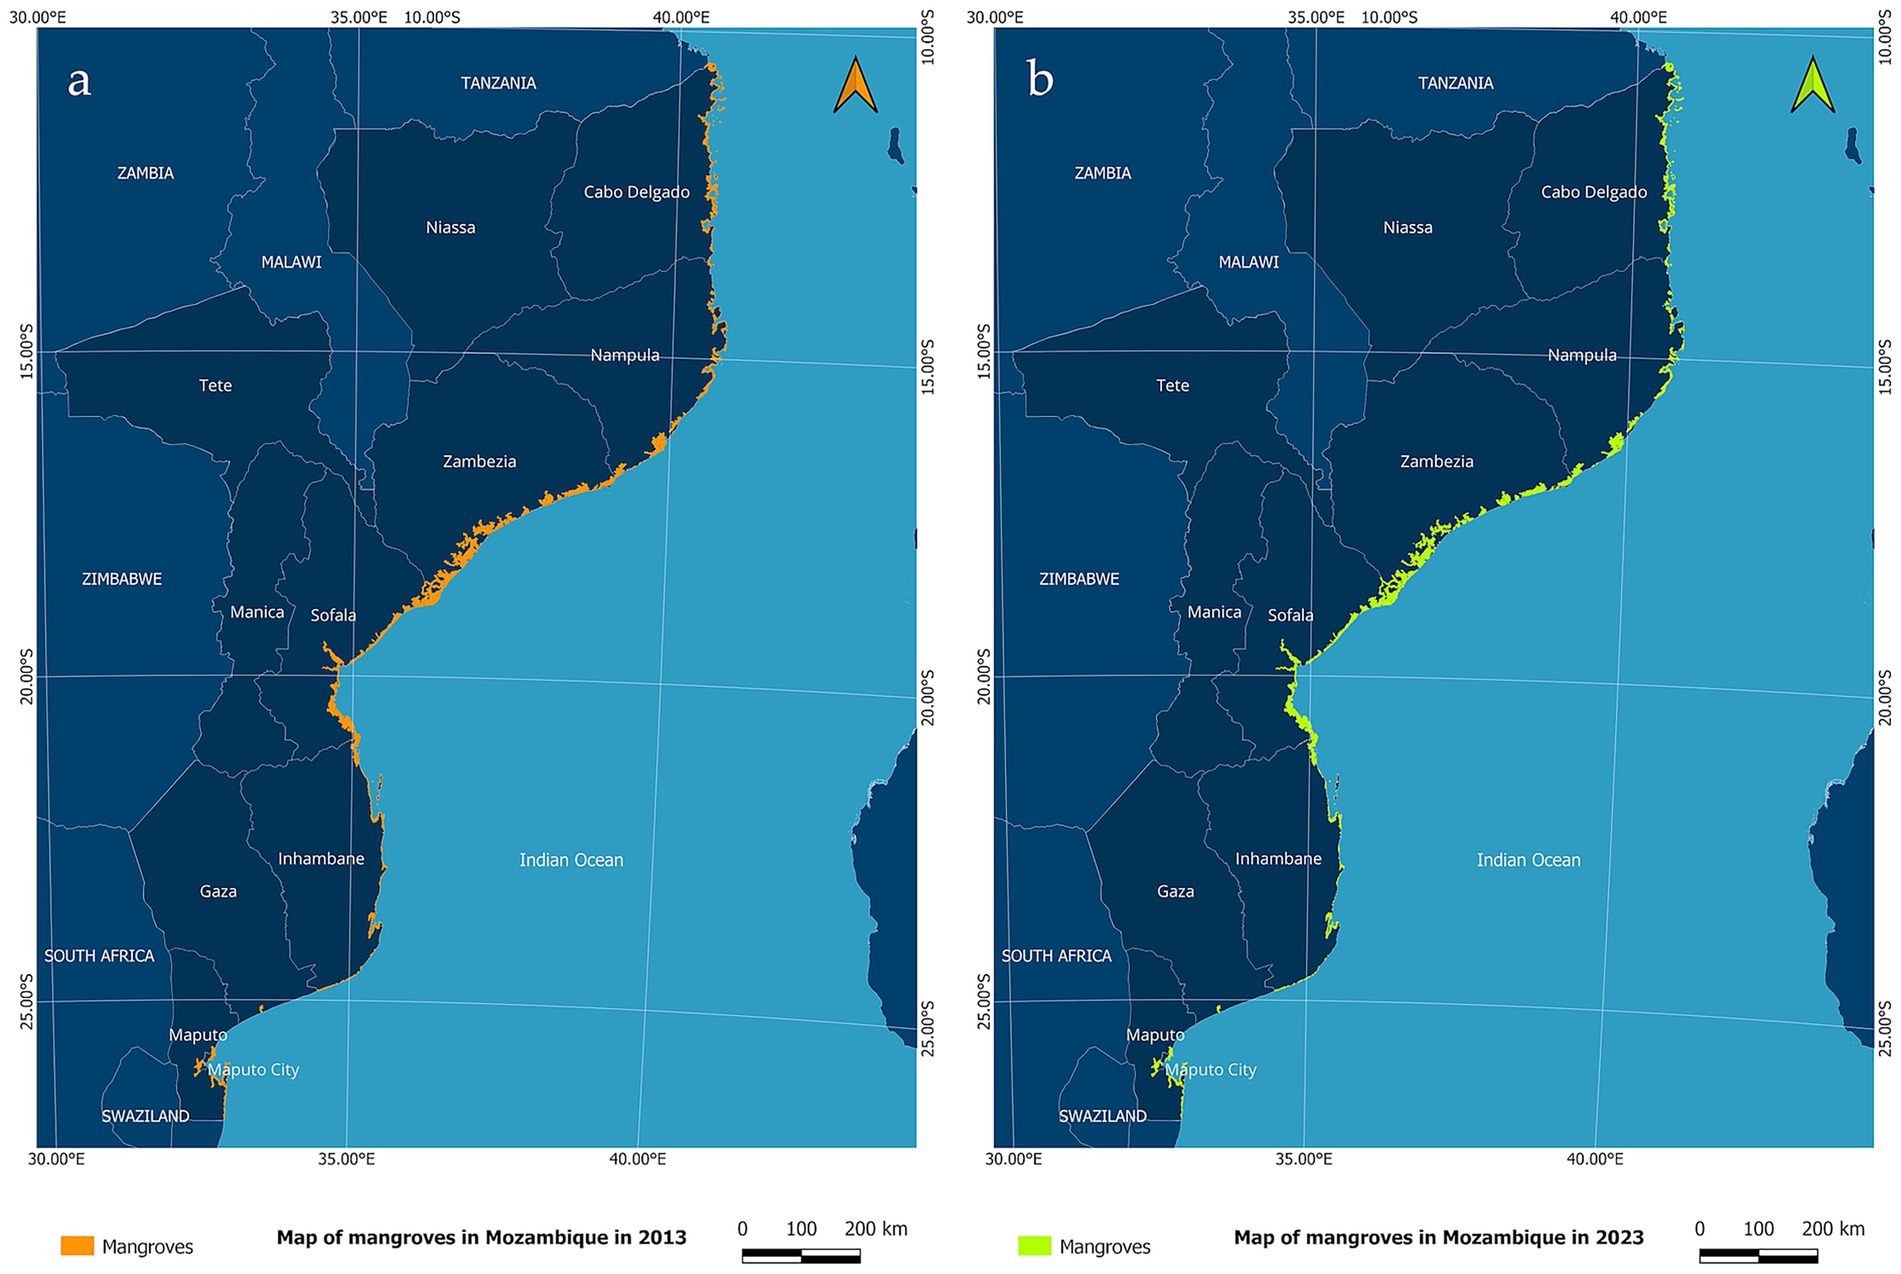
Figure 3. Mangrove cover distribution along Mozambique coastline in 2013 (a) and in 2023 (b).
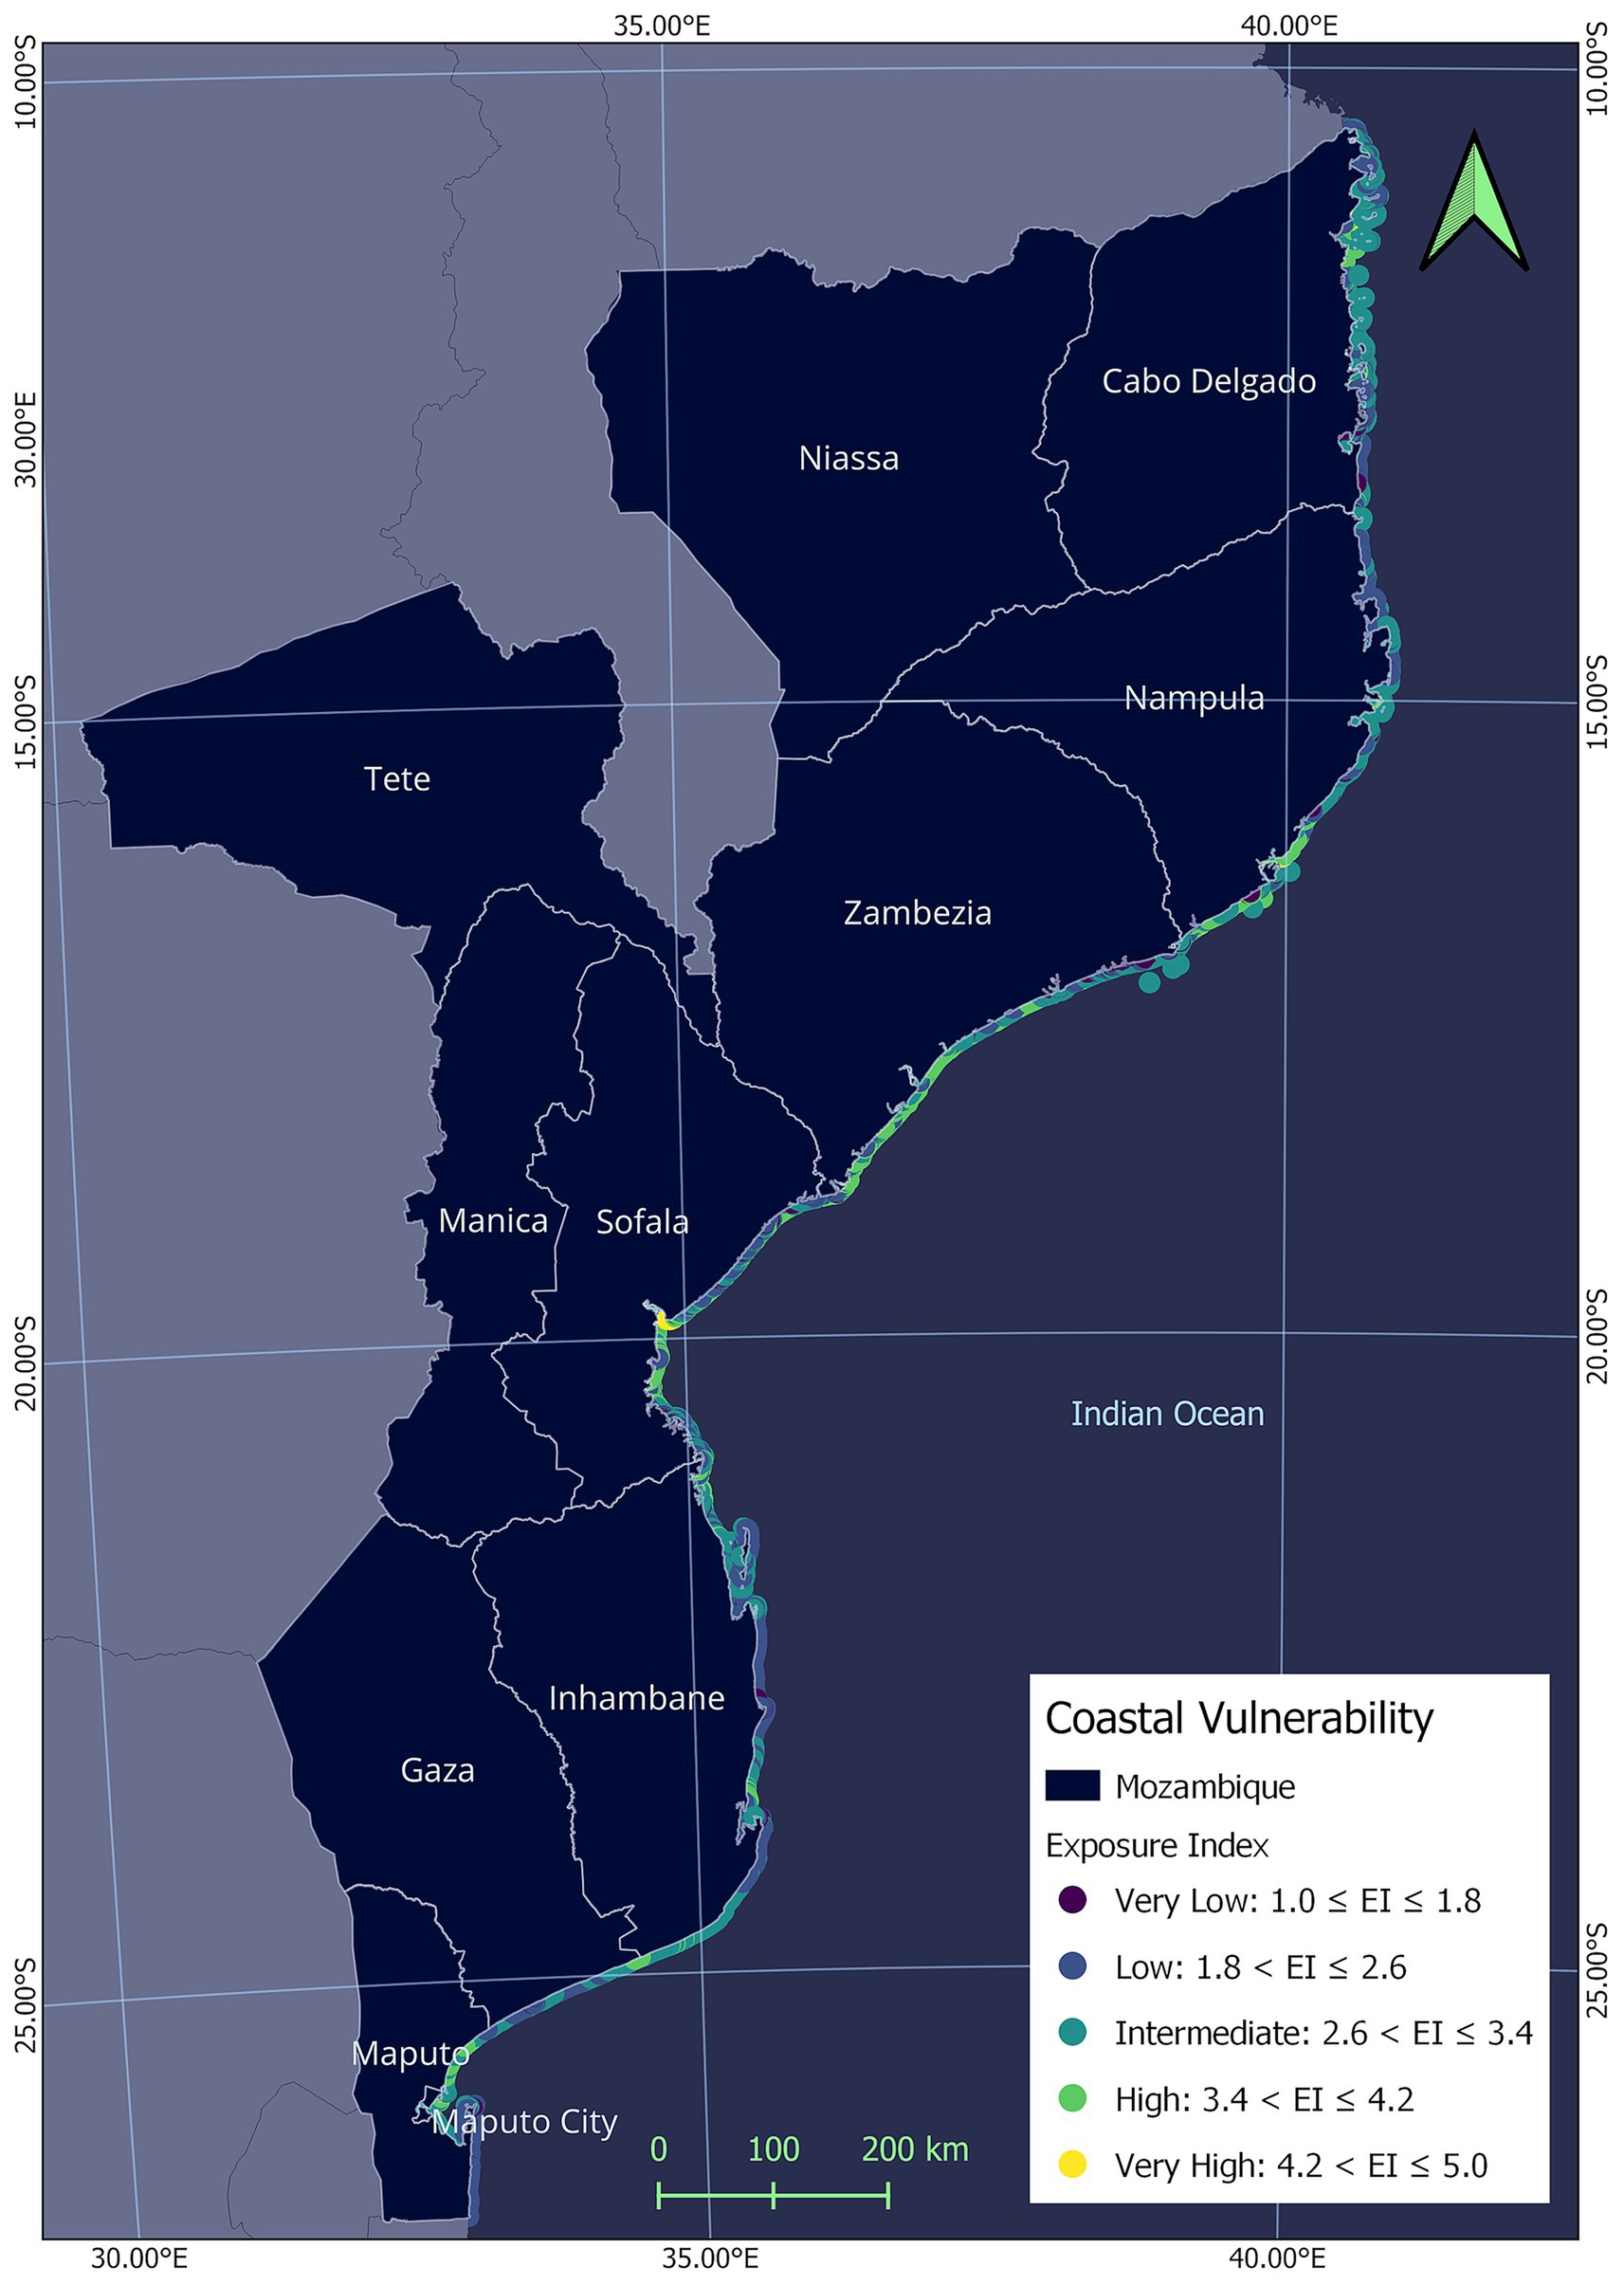
Figure 4. Variation in the EI along the coast of Mozambique in 2023. Values generated using the Coastal Vulnerability Model (available in InVEST software). The higher the EI values, the greater the exposure of that portion of the coastline to flooding and erosion events.
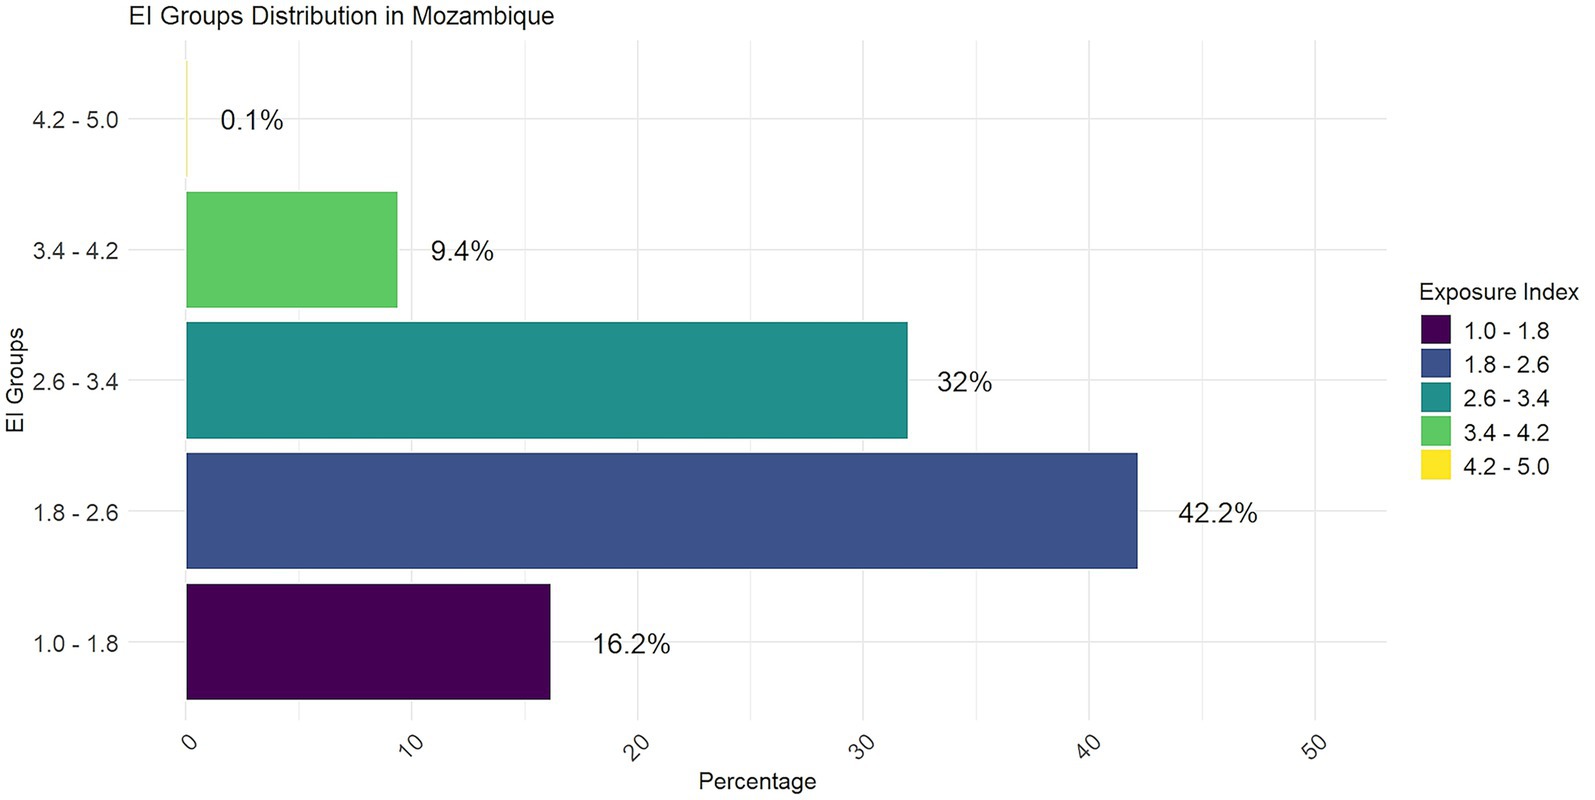
Figure 5. Percentages of the total Mozambican coastline under different levels of EI in 2023. Values generated using the coastal vulnerability model, available in the InVEST software.
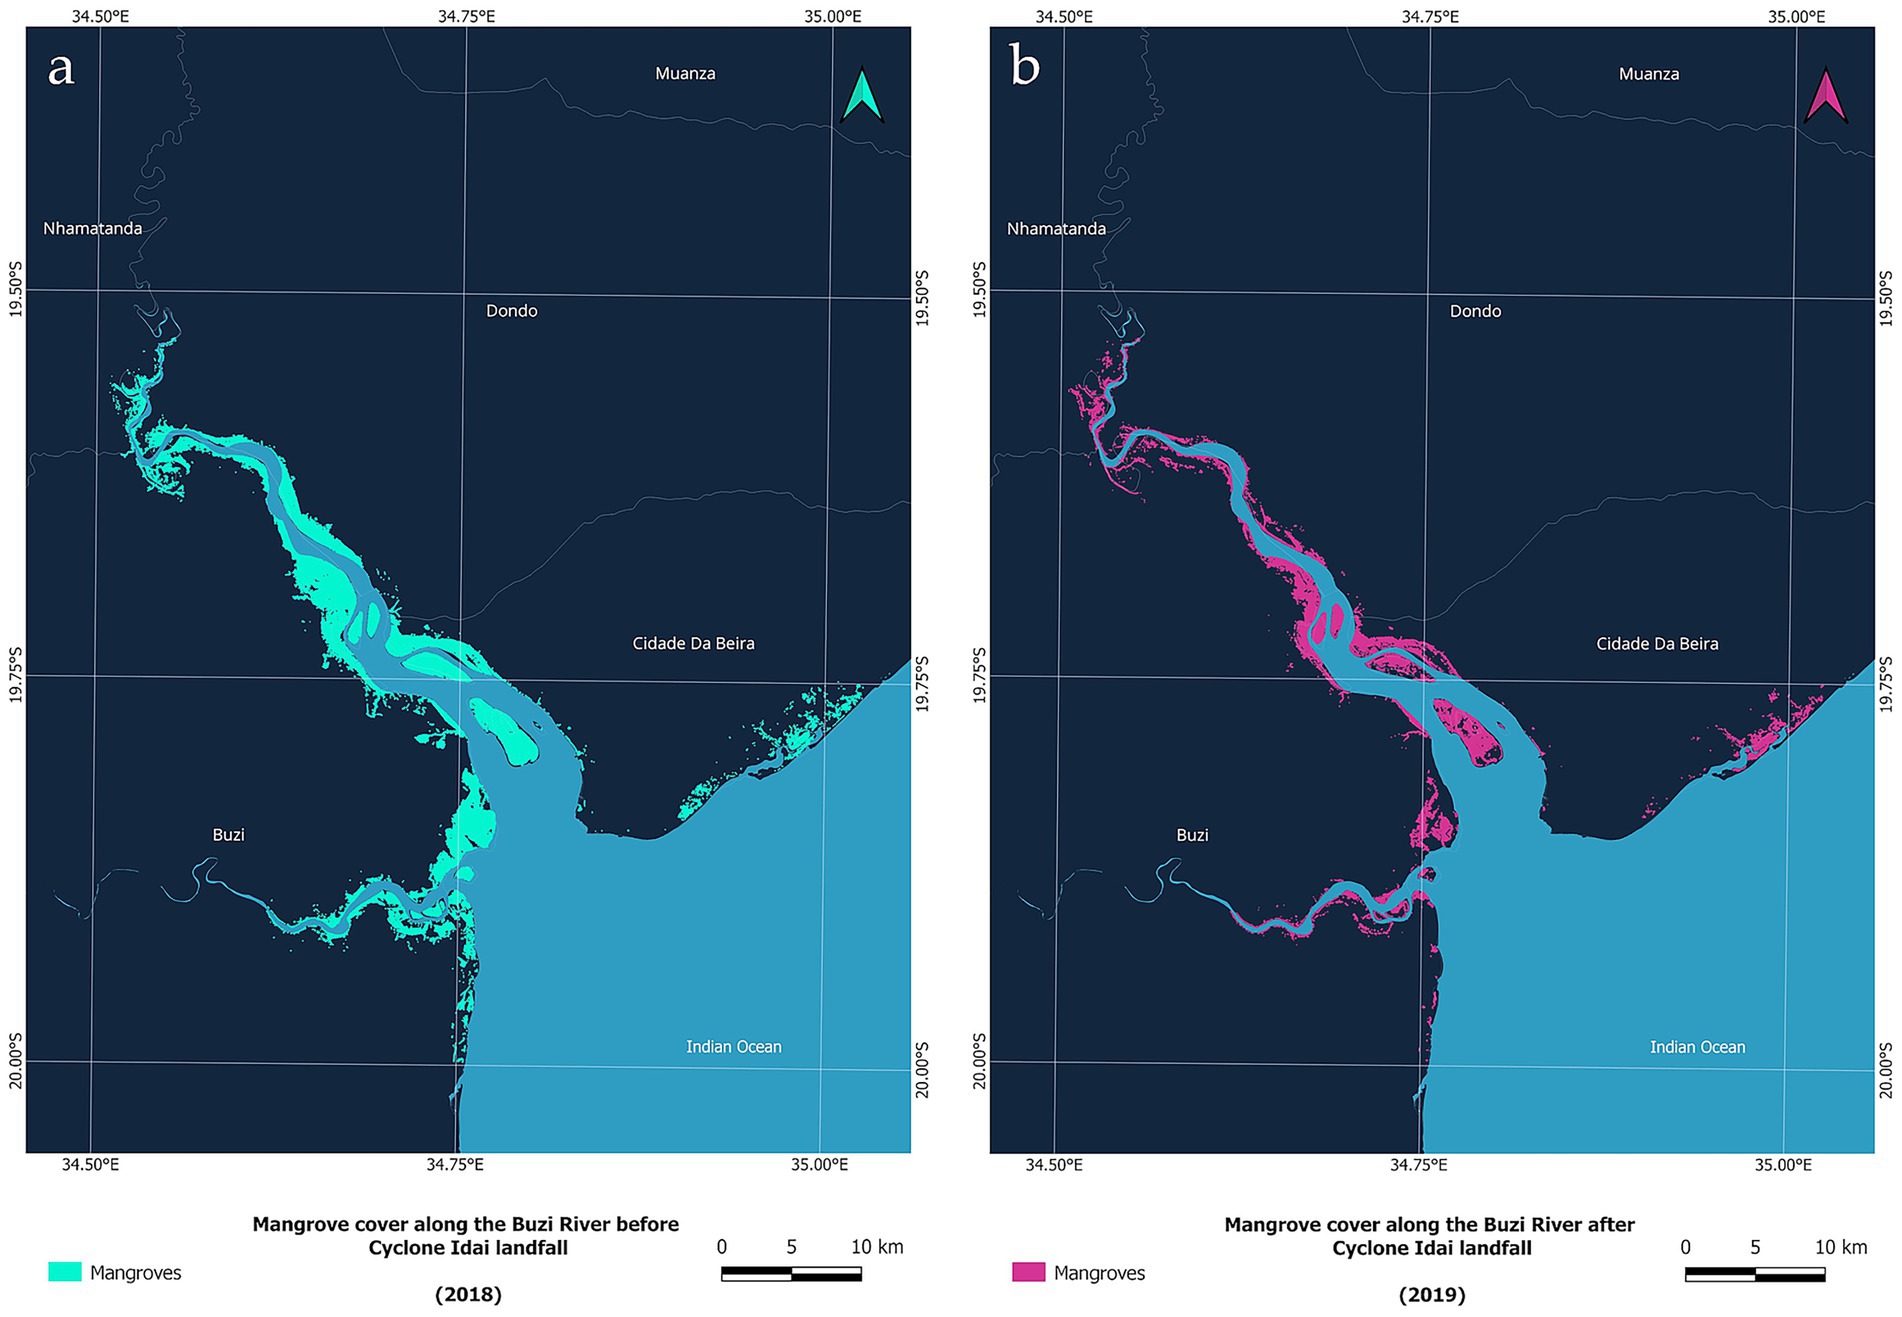
Figure 6. Mangrove cover distribution (a) before and (b) after the passage of Cyclone Idai, illustrating the cyclone’s impact.
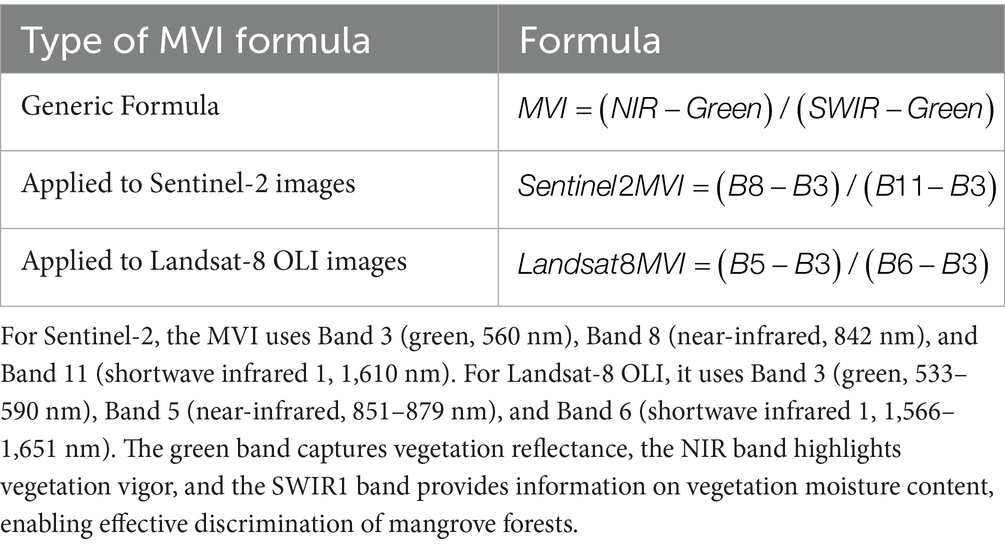
Table 1. MVI formulas used for Sentinel-2 and Landsat-8 OLI imagery (after Baloloy et al., 2020).
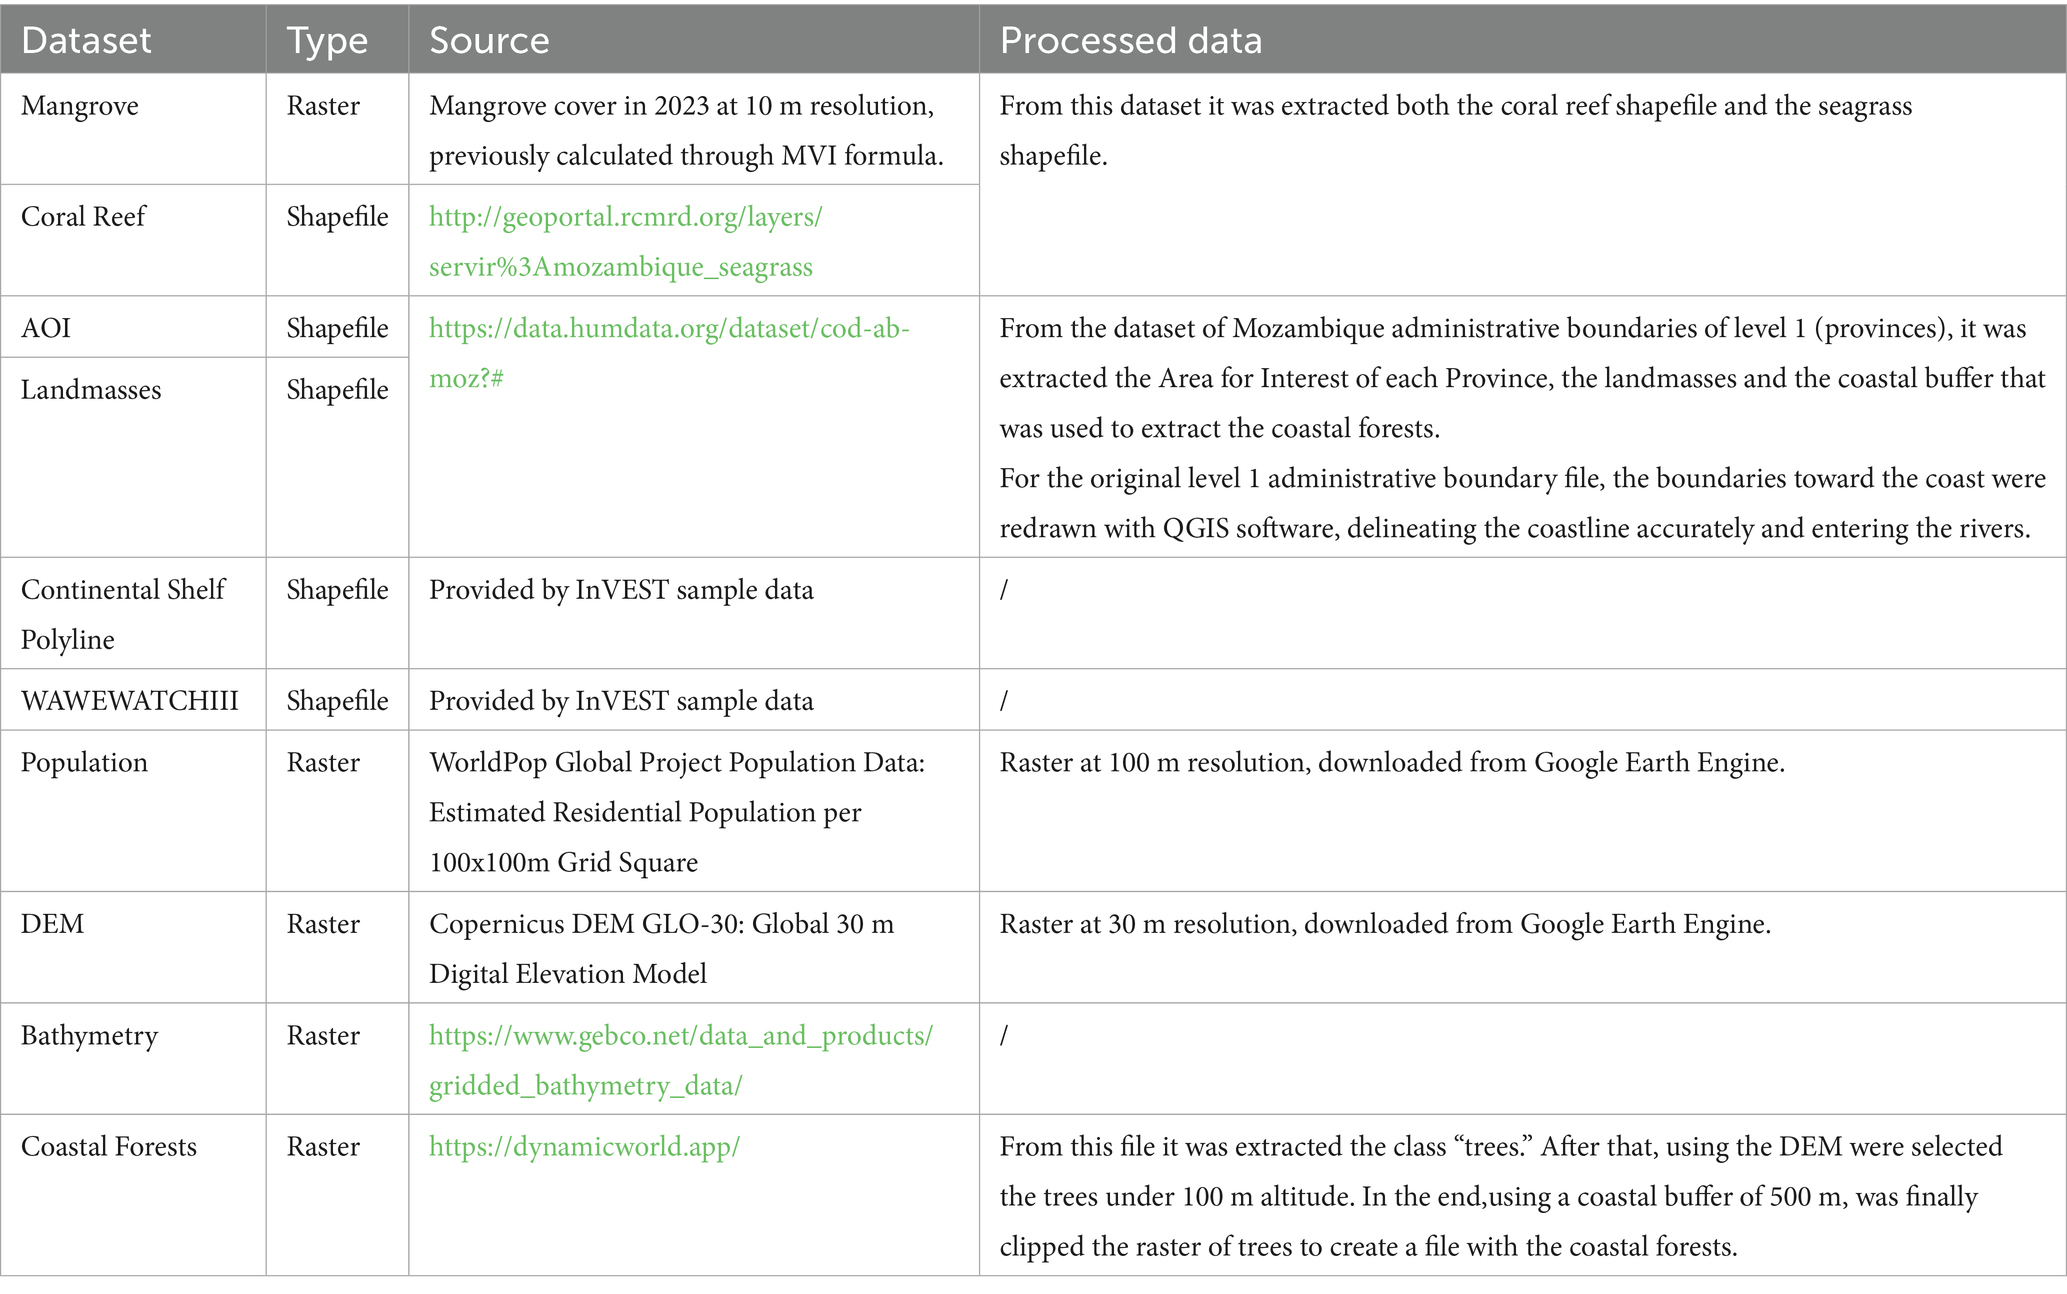
Table 2. Description of datasets used in this study to calculate the coastal vulnerability model.
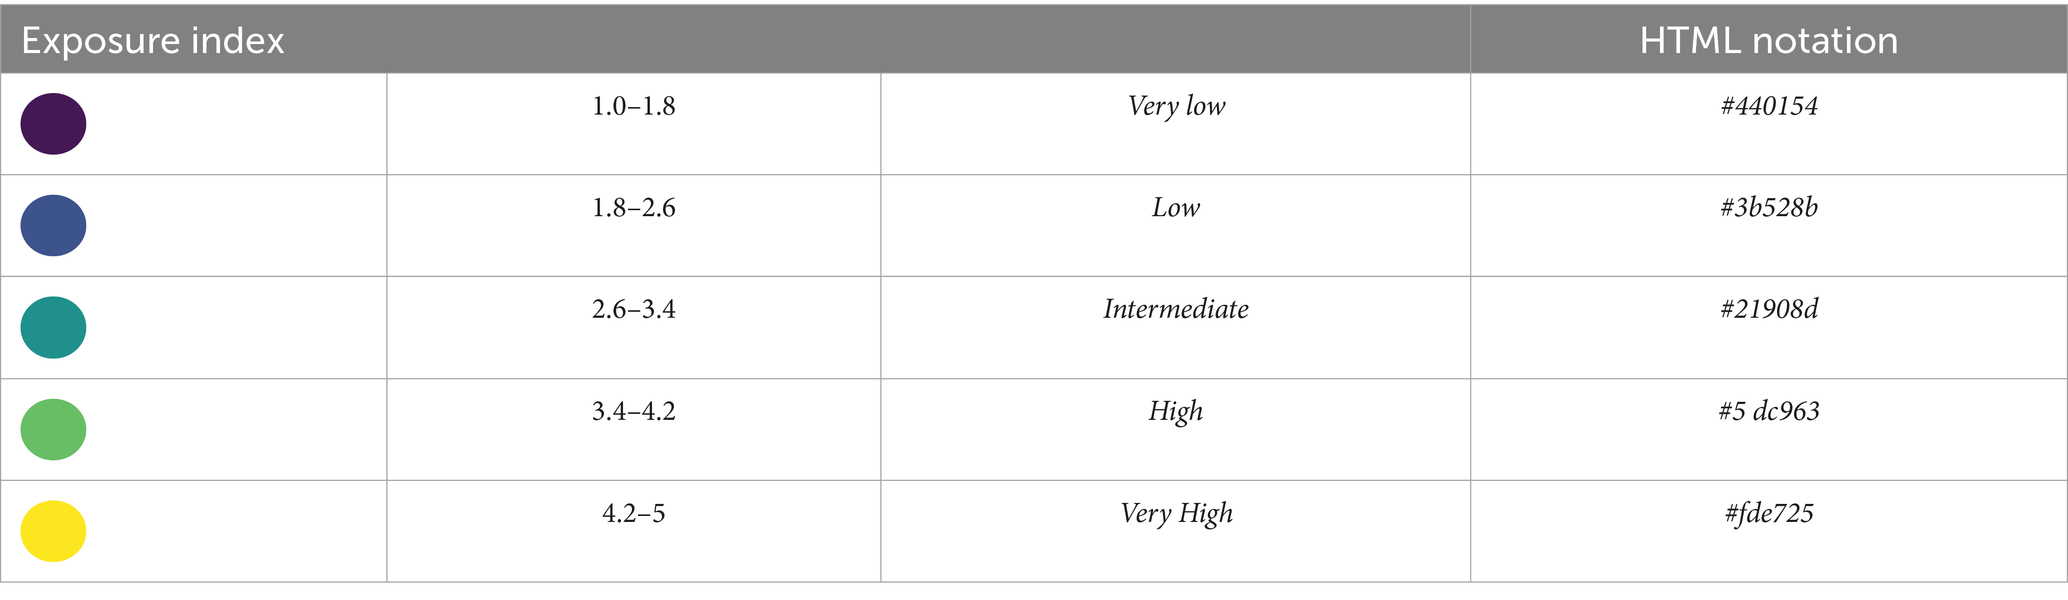
Table 3. Range of EI values calculated through the InVEST coastal vulnerability model (Natural Capital Project, 2025) used in Mozambique’s coastal vulnerability classification.
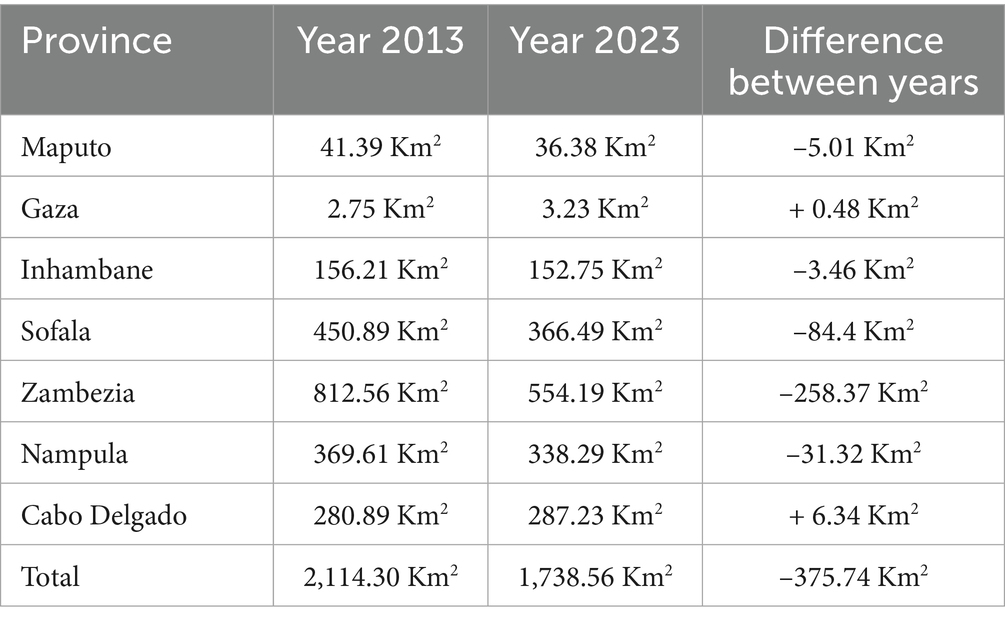
Table 4. Changes in mangrove cover (km2) in Mozambique between 2013 and 2023.
As one of the planet’s most productive ecosystems, mangroves support exceptional biodiversity, by serving as critical nursery habitats for countless marine species, and providing critical habitat for migratory birds (Duke et al., 2007; FAO, 2007; Spalding and Leal, 2024). Moreover, mangroves trap sediments, organic matter, and pollutants through dense canopies and root networks (Tam and Wong, 1993), contributing significantly to carbon sequestration, averaging 394 tons per hectare, with peaks of 650 tons in high-density areas (Spalding and Leal, 2024). Socioeconomically, mangroves provide vital resources for coastal communities, valued between USD 200,000 and 900,000 per km2 annually (UNEP-WCMC, 2006; Fatoyinbo et al., 2008). They also offer seafood, fuelwood, fibers, construction materials, honey, edible leaves, medicinal plants, and even ground for ecotourism, thereby supporting food security, livelihoods, and local economies (Rönnbäck, 1999; Barbier, 2000; UNEP-WCMC, 2006; Fatoyinbo et al., 2008; Lee et al., 2014; Friess, 2017; Goldberg et al., 2020).
Mangroves are fundamental to coastal protection, particularly as climate change intensifies storm activity (McIvor et al., 2015). Their structural complexity slows water flow, reduces wave energy, and mitigates storm surge impacts, lessening flood and erosion risks across tropical shorelines (Massel et al., 1999; Mazda et al., 2006; Barbier et al., 2011; Blankespoor et al., 2017). Broad mangrove belts spanning several kilometers buffer wave energy and floodwater, while even smaller stands provide measurable protection to nearby areas (Spalding and Leal, 2024).
Mozambique hosts Africa’s second-largest mangrove coverage, approximately 54.6% of its 11,768 km coastline, offering vital protective functions and supporting high species diversity, with 9–10 species recorded (Fatoyinbo et al., 2008; Charrua et al., 2020; Global Mangrove Watch, 2024; Barbosa et al., 2001). However, besides the significant degradation driven by aquaculture, urban expansion, land reclamation, and unsustainable logging, mangrove loss is further aggravated by sea level rise, cyclones, and extreme rainfall (Farnsworth and Ellison, 1997; Giri et al., 2008; Fatoyinbo et al., 2008; Baloloy et al., 2020). Globally, mangrove cover has declined by roughly one-third over the past five decades, with Mozambique experiencing sharp losses—particularly after Cyclone Idai (2019), a Category 4 storm that caused widespread ecological and human devastation (Spalding et al., 1997; Lovelock et al., 2015; Devi, 2019; Charrua et al., 2020). With tropical cyclones accounting for 45% of global mangrove mortality in the last 60 years, and projections indicating increased frequency and intensity, growing risks to both ecosystems and human settlements are anticipated (Hoque et al., 2018; Charrua et al., 2020; Phiri et al., 2021). The intrusion of salt water inland is a direct consequence of climate change, mainly linked to rising sea levels. In this context, it has been documented that mangroves have the ability to migrate inland when conditions are favorable in terms of ecological timing and availability of suitable soil (Visschers et al., 2022). In addition, while mangroves are threatened by seawater intrusion (flooding and sea level rise), they are also often threatened by altered freshwater inflows from inland areas (e.g., dam construction that alters water flow and pollutants).
The conservation of these ecosystems is imperative; deforestation or natural erosion not only put these carbon stocks at risk, but also risk releasing significant amounts of greenhouse gases into the atmosphere, thus aggravating climate change. Protecting mangroves is essential to sustain their role in global carbon sequestration and to prevent further acceleration of climate impacts (Charrua et al., 2020; Bourgeois et al., 2024).
Accelerating mangrove loss and intensifying climate threats highlight the urgent need for research to guide conservation and restoration efforts. Nature-based Solutions that restore ecosystem function and enhance coastal resilience are essential, particularly as coastal regions face growing erosion and flooding risks from storms and sea-level rise. Understanding and preserving the protective role of natural habitats is critical for sustainable coastal management, aligning with global goals like the SDGs and regional initiatives under the UNEP-Nairobi Convention (Bosire et al., 2015; Tallis et al., 2015; Charrua et al., 2020).
In the present study we examine the spatial and temporal dynamics of degradation, evaluate mangroves’ protective capacity against floods and erosion, and explore strategies to maintain their ecological and socioeconomic value. Through this work, we aim to support Mozambique’s efforts to protect vulnerable coastlines and strengthen coastal communities facing increasing climate-related challenges.
Several studies have assessed the extent and condition of Mozambique’s mangroves over the past three decades, using diverse methods ranging from aerial surveys (Saket and Matusse, 1994) and field-based inventories (Barbosa et al., 2001) to satellite remote sensing (Fatoyinbo et al., 2008) combined Landsat ETM + and Shuttle Radar Topography Mission data to estimate mangrove extent, height, and biomass, while Charrua et al. (2020) used field data and environmental parameters to model the distribution of mangrove forests and an EI to climate hazards and erosion. Charrua et al. (2021) used Landsat time-series analysis to analyze temporal changes in Land Use and Land Cover (LULC) after the passage of Cyclone Idai across Sofala Province. More recently, the Global Mangrove Watch (2024) has produced global baseline maps at 30 m resolution. Although these studies provide valuable insights into mangrove dynamics, they differ in scale, resolution, and methodological consistency, limiting their utility for long-term, standardized national monitoring. Moreover GIS and remote sensing have been effectively used for produce datasets used multi-criteria decision analyses (MCDA) in the context of land use planning, such as forest fire (Akay and Erdoğan, 2017), protected areas management (Nelson and Burnside, 2019), evaluation of environmental hazards (Arabameri et al., 2019; Darwish, 2023). However this approach is never been applied in mangroves ecosystems in Mozambique, as highlighted by Frosi et al. (2025). By integrating the Mangrove MVI with the InVEST (see Appendix) Coastal Vulnerability Model, our study addresses these gaps, offering a novel framework to assess both mangrove cover change and coastal vulnerability in Mozambique at high spatial resolution.
2 Materials and methods
2.1 Study area
2.1.1 Geography and socio-economic context
Mozambique, located in southeast Africa and bordering six countries and the Indian Ocean, between 10°20’S and 26°50’S, spans 800,000 km2 across 11 provinces (Figure 1). Approximately 70% of the population lives in rural areas, with 40% concentrated in Nampula and Zambézia provinces (Cabral et al., 2017). Coastal resources (fisheries, agriculture, and forestry) support ~66% of coastal populations and contribute significantly to the national economy (Sete et al., 2002).
Mozambique features 11 major rivers, including the Zambezi and Limpopo, and contains ~104 river basins that support mangrove ecosystems (Sete et al., 2002). The country has Africa’s third-longest coastline, with diverse habitats including beaches, dunes, coral reefs, and mangroves forests (Sete et al., 2002; Cabral et al., 2017; Charrua et al., 2020). The climate is tropical (subtropical in the south), with a rainy season (November–March) and dry season (April–October; Barbosa et al., 2001). The northern climate is influenced by equatorial low-pressure systems, the southern by subtropical anticyclones, and the central by the Intertropical Convergence Zone (Sete et al., 2002). Wind patterns vary regionally, with monsoons in the north and southeasterly trade winds in the south (Sete et al., 2002). Tropical cyclones occur from November to April, peaking in January–February, with an average of 1.16 landfalls per year (1980–2007) and increasing intensity since 1993 (Cabral et al., 2017).
2.1.2 Mangroves in Mozambique
Mozambique’s coastline harbors a mangrove forests with estimated extents ranging from approximately 2,909 km2 (Fatoyinbo et al., 2008) to 3,960.80 Km2 (Saket and Matusse, 1994), likely due to differences in estimation methods. The most recent estimate of mangrove coverage in Mozambique is 3,380.27 km2 as of 2020, reported by the Global Mangrove Watch (2024). These mangroves occur along three main coastal regions (Hoguane and Armando, 2015). First, the Northern Rocky Coast (Ruvuma River, 10°S, 40°27’E to Angoche River, 16°12’S, 39°54’E) features shallow reefs with hermatypic corals and mangroves in sheltered bays and estuaries. Second, the Central Swampy Coast (Angoche to Save River, 20°52’S, 35°30’E) encompasses the Sofala Bank—a key fishing area—supports extensive, well-preserved mangrove forests growing on organic mud and freshwater inflows. These include the tallest mangroves in Mozambique (Fatoyinbo et al., 2008). Finally, the Southern Sandy Dune Coast (Save River to Ponta do Ouro, 26°30’S, 32°24′E) includes cooler sandy dunes, the Bazaruto Archipelago, and Maputo Bay, a major mangrove area fed by four large rivers (Barbosa et al., 2001; Charrua et al., 2020).
In Mozambique, mangroves provide essential ecological, economic, and environmental benefits. They act as natural coastal buffers against erosion, storms, and tides, and support commercially important fish and shrimp species (Barbosa et al., 2001; Fatoyinbo et al., 2008). Mangrove-associated fishing contributes around 40% of Mozambique’s GDP, with shrimp fishing alone generating $55.4 million annually (MICOA, 1998). Coastal areas are also attracting growing interest for development in agriculture, aquaculture, bioenergy, tourism and related infrastructures (Cabral et al., 2017).
However, mangroves face both anthropogenic and natural threats: overharvesting for fuel and construction materials, clearing for agriculture and salt production, pollution, reduced freshwater inflow due to dams (e.g., Cahora Bassa), hurricanes, industrial development, and population influx (Saket and Matusse, 1994; Barbosa et al., 2001; Fatoyinbo et al., 2008). In urban areas such as Maputo and Beira, approximately 1,821 hectares are lost annually, with reports of oil spills and heavy metal contamination (Barbosa et al., 2001). In Mossuril, 50% of mangroves have been converted to salt pans (Barbosa et al., 2001). Dams exacerbate saltwater intrusion and erosion, while unsustainable tourism and high coastal population density further drive mangrove degradation (Barbosa et al., 2001; Charrua et al., 2020).
2.1.3 Mozambican legislation about mangroves
Mangrove governance in Mozambique is regulated by more than 20 legal instruments, creating a fragmented and sometimes contradictory framework. While mangroves benefit from direct and indirect protection, legislation simultaneously allows industrial and extractive activities under special licenses or “national interest,” often undermining conservation goals. Weak enforcement of Environmental Management Plans and overlapping institutional mandates further add to governance confusion. Recent reforms mark important progress: the 2023 Forest Law reclassifies mangroves as conservation forests (Government of Mozambique, 2023), and the Maritime Law (Government of Mozambique, 2019) criminalizes unauthorized destruction. The 2020–2024 Mangrove Management Strategy and community-based mechanisms also strengthen participatory governance (Government of Mozambique, 2020). Nonetheless, limited institutional capacity and fragmented policies continue to constrain effective conservation, highlighting the need for legal coherence and stronger community rights in line with international commitments (WWF, 2024).
2.1.4 Climate risks and coastal vulnerability
An increasing number of people live in coastal areas characterized by high geophysical and biophysical vulnerability (Cabral et al., 2017). It is therefore essential to equip coastal planners with tools to develop effective management plans that mitigate the growing risks posed by coastal climate hazards to both life and infrastructure (Cabral et al., 2017).
Mozambique’s extensive coastline and mangroves are particularly vulnerable to climate risks such as cyclones and flooding (Charrua et al., 2020), due to both its geographical location and low coastal elevation in some areas. The central region (Sofala) is the most cyclone-prone, featuring a wide tidal range and vast plains (Charrua et al., 2021). The cyclone season (November–April) sees 3–12 cyclones annually in the Mozambique Channel, with landfall frequency rising since the 2000s (Charrua et al., 2021; Chichava et al., 2024). Notable cyclones include Idai (2019) caused over 1,000 deaths, more than 1,600 injuries, and $3.2 billion in damages (Charrua et al., 2021; Phiri et al., 2021). With about 60% of the population lives along the coast, Mozambique ranks 10th globally and 3rd in Africa in terms of climate vulnerability (Chichava et al., 2024). Improved disaster management—including mapping and early warning systems—is critical for reducing the impacts of such events (Phiri et al., 2021; Lee et al., 2019).
2.2 Mangrove vegetation index
Recent mangrove declines highlight the critical need to map and monitor these ecosystems to understand their historical and current distributions, identify threats, and guide territorial planning (Liu et al., 2008; Zhang et al., 2017; Baloloy et al., 2020). Remote sensing offers significant advantages over traditional field surveys, which are time-consuming, costly, and spatially limited (Liu et al., 2008; Zhang et al., 2017; Baloloy et al., 2020).
Advances in sensor technologies have transformed land cover mapping, significantly improving mangrove monitoring (Giri et al., 2011; Zhang et al., 2017; Baloloy et al., 2020). Medium-resolution multispectral data (10–30 m) provide reliable regional-scale information (Zhang et al., 2017). Researchers have used diverse methods, including visual interpretation, semi-automatic pixel- and object-based classification, and machine learning algorithms using vegetation indices (Liu et al., 2008; Zhang et al., 2017; Baloloy et al., 2020). However, conventional indices like NDVI often misclassify mangroves due to spectral similarities with other vegetation types (Liu et al., 2008; Zhang et al., 2017).
To address this, Baloloy et al. (2020) developed the Mangrove Vegetation Index (MVI), which enhances mangrove detection and minimizes post-classification corrections. The MVI, calculated as |NIR–Green|/|SWIR–Green| using Sentinel-2 and Landsat-8 bands, leverages the distinctive greenness and moisture properties of mangroves to differentiate them from terrestrial vegetation and non-vegetated surfaces (Baloloy et al., 2020; Kumar et al., 2019). Specifically, the |NIR-Green| component of the index captures the differences in greenness between mangrove forests and terrestrial vegetation, while the |SWIR-Green| component reflects the distinct humidity of mangroves due to their environment—without requiring additional intertidal data and water indices.
Higher MVI values indicate a greater likelihood of mangrove presence (Baloloy et al., 2020). However, tidal fluctuations can affect spectral reflectance and reduce classification accuracy; in such cases, multi-temporal imagery has proven more effective than single-date acquisitions (Zhang et al., 2017).
We mapped mangrove extent in Mozambique for 2023 (Sentinel-2) and 2013 (Landsat-8) to evaluate decadal changes. Cloud-free images were selected, and Sentinel-2 data were resampled from 10 m to 30 m to match Landsat-8 resolution. To account for latitudinal bioclimatic variations across the country, we adjusted MVI thresholds and image acquisition dates. The MVI was calculated using green, NIR, and SWIR1 bands: B3 (green), B8 (NIR), and B11 (SWIR1) for Sentinel-2; and B3 (green), B5 (NIR), and B6 (SWIR1) for Landsat-8 (Baloloy et al., 2020). The formulas for the generic MVI, applied to Sentinel-2 and Landsat-8 OLI sensors are shown in Table 1.
Baloloy et al. (2020) reported that higher MVI values correspond to an increased probability of a pixel representing mangrove cover. They identified an optimal MVI threshold range between 4.5 and 20 to distinguish mangroves but noted that threshold values may require adjustment depending on canopy density and local coastal conditions. In our case study, we set the lower threshold at 3.5 to better capture mangrove pixels. Additionally, while in some areas the maximum MVI values remained within the expected range (<20) reported by Baloloy et al. (2020), other regions exhibited considerably higher maximum values (>200), likely reflecting site-specific biophysical variations.
To map mangroves in Mozambique, we developed a workflow (Figure 2) based on a standardized set of rules for MVI calculation and post-processing. The use of rules and steps set in the workflow made it possible to replicate the calculation many times to cover the entire coastal area of Mozambique, avoiding classification errors between one area and another. This workflow therefore allows temporal data to be comparable (as in this case, 2013 and 2023). We applied this workflow to both 2013 and 2023 datasets to assess decadal changes in mangrove cover. The workflow was supported by two platforms: (i) Google Earth Engine (see Appendix) for automated retrieval, atmospheric correction, and processing of Sentinel-2 and Landsat-8 imagery; and (ii) QGIS (version 3.28.11) for post-processing, noise removal, mapping, and area calculation. The workflow comprised the following steps:
Step 1—Selection of Areas of Interest. Mozambique’s coastal provinces (Cabo Delgado, Nampula, Zambezia, Sofala, Inhambane, Gaza, and Maputo) have been selected, allowing for flexible adaptation of acquisition dates and MVI thresholds to local conditions.
Step 2—Image Acquisition. For each province, atmospherically corrected Sentinel-2 (2023) and Landsat-8 (2013) images have been acquired. To minimize cloud disturbances and classification errors, images from the dry season (March–September) and carefully tested acquisition dates have been prioritized, also applying a filter to discard images with a higher percentage of cloud cover. For each province, the acquisition dates were tested to capture the fewest number of noise pixels. In many cases, the time range was extended to calculate the MVI average over a longer period (March–December). For more details on the dates of acquisition of the satellite images, see Supplementary Table 5.
Step 3—MVI Calculation. The MVI formula was applied in Google Earth Engine, extracting mangrove pixels within a range of 3.5 < MVI < 700. In some provinces (e.g., Gaza), maximum MVI values aligned with literature thresholds (<20; Baloloy et al., 2020), whereas in others (e.g., Cabo Delgado), dense mangroves produced much higher values (>200), consistent with independent mangrove distribution maps (Spalding and Leal, 2024).
Step 4—Resampling The 2023 outputs have been resampled from 10 m to 30 m resolution to match the 2013 data for comparison.
Step 5—Cyclone Idai Impact Analysis. In Sofala province, it was been conducted a focused analysis of mangrove degradation along the Buzi River. Sentinel-2 images were used before (acquisition dates: April 2018 to February 2019) and after the passage of the cyclone (April 2019 to December 2019). For more details on the dates of acquisition of the satellite images, see Supplementary Table 6.
Step 6—Export to GIS. The processed rasters have been exported to QGIS for further refinement, mapping, and mangrove area calculations.
Step 7—Post-processing and Noise Removal. To improve classification accuracy, elevation and distance-based rules have been adapted from Liu et al. (2008). Using a DEM, pixels above 10 m elevation have been excluded. To remove pixels unlikely to represent mangroves, a national coastline shapefile has been refined and after that, it was been applied a 1,200 m inland and 200 m ocean-side buffer. In river delta regions, the buffer based on historical mangrove presence (mangrove distribution map developed by Professor Hugo Mabilana from Eduardo Mondlane University) has been modified and adapteddata to account for coastline discrepancies.
Step 8—Mangrove Area Estimation. Mangrove areas for 2013 and 2023 at 30 m resolution have been calculated to assess trends in spatial extent.
Step 9—Mapping Outputs. Finally, mangrove maps have been produced for 2013 and 2023 at provincial, regional, and national scales. In addition, loss and gain maps have been created (see Supplementary materials) to better visualize the differences between mangrove coverage extent in 2013 and 2023.
2.3 Coastal vulnerability model
Coastal areas are exposed to increasing risks due to climate change (such as sea level rise and increased frequency of cyclones causing flooding) and increased anthropogenic pressures along these areas (Cabral et al., 2017). In this context, exposure is defined as the presence of people, assets, or systems in hazard-prone areas subject to potential losses, while vulnerability reflects their susceptibility to harm from hazardous events (United Nations International Strategy for Disaster Reduction (UNISDR), 2009; Cabral et al., 2017; Charrua et al., 2020). Vulnerability encompasses social factors and the built environment, while exposure includes biophysical site conditions (Cabral et al., 2017).
We applied the InVEST Coastal Vulnerability Model, a free, open-source tool from the Natural Capital Project (2025), to assess coastal exposure to erosion and flooding in Mozambique at a 100-m resolution—an improvement over previous studies using 1–2 km resolution (Cabral et al., 2017). Designed for data-scarce regions, the model provides a qualitative exposure estimate, identifying high-risk coastal areas and evaluating the protective role of natural habitats (Cabral et al., 2017). Its accessibility, low data requirements, and spatially explicit outputs make it well-suited for coastal management (Cabral et al., 2017). The model supports adaptive coastal management by highlighting vulnerable areas, informing policy decisions, and promoting habitat conservation to reduce climate risks (Tallis et al., 2015).
The InVEST Coastal Vulnerability Model generates an EI at 100 m intervals along the coastline, assessing relative exposure to erosion and flooding. By integrating population data, it identifies high-risk human settlements. Outputs include geospatial points and EI maps, providing interpretable results for stakeholders prioritize intervention areas (Cabral et al., 2017). The model uses the following bio-geo-physical variables:
• Landmass: Coastal boundaries of Mozambique’s provinces (Cabo Delgado, Nampula, Zambezia, Sofala, Inhambane, Gaza, Maputo) were manually redrawn for accuracy.
• Area of Interest (AOI): Encompasses the shoreline, enabling EI calculations at 100-m intervals.
• Habitats: Mangroves (10-m resolution), coral reefs, seagrass beds, and coastal forests (extracted from DynamicWorld, <100 m altitude, within 500 m of the coast) were included, with assigned protection distances and grades (Cabral et al., 2017; Das and Crépin, 2013).
• WAWEWATCHIII: Global dataset for wind and wave exposure during storms.
• Continental Shelf Polyline: Estimates storm surge exposure based on shelf distance.
• Population: Density near each coastal point.
• DEM: Altitude above sea level.
• Bathymetry: Depth data.
Further information on the datasets used are available in Table 2.
We excluded sea level rise and geomorphology due to data unavailability. We calculated the EI as the geometric mean of bio-geo-physical variable rankings (1 = very low, 5 = very high), following Gornitz (1990) and Hammar-Klose and Thieler (2001):
Where Ri represents the ranking of the ith biogeophysical variable (Cabral et al., 2017). For this study, we used an equal interval with an increment of 0.8 (Table 3). For a complete list of the data source and software used in this study, see Appendix.
3 Results
The MVI analysis revealed that Mozambique’s mangrove cover decreased from 2,114 km2 in 2013 to 1,739 km2 in 2023 (Figure 3; Table 4), reflecting a net loss of 376 km2 (−18%) over the decade. The InVEST Coastal Vulnerability model classified the entire Mozambican coastline using the EI (Figure 4), ranging from 1 (low vulnerability) to 5 (high vulnerability; Table 3). Quantile-based grouping (0.8 increments) indicated that 42% of the coastline (1,150 km out of 11,768 km) exhibits intermediate to high vulnerability to flooding and erosion (Figure 5). This underscores the need for disaster prevention measures, particularly in areas affected by cyclone landfall. All coastal provinces are impacted, with Maputo (including Maputo City), Sofala, and Zambezia identified as the most vulnerable. Detailed results for the seven coastal provinces, ordered by mangrove loss (from highest to lowest), are presented below. For clarity, Maputo Province and Maputo City are combined. Province-specific maps are provided in the Supplementary materials.
The analyses showed that the most vulnerable provinces are also those that have experienced the greatest mangrove loss—namely, Zambezia, Sofala, Maputo.
MVI analysis indicated that Zambezia suffered the larger mangrove area decrease in Mozambique, from 813 km2 in 2013 to 554 km2 in 2023—a loss of 258 km2 (−32%). The Coastal Vulnerability Model showed that 46% of Zambezia’s coastline (classified from “Intermediate” to “Very High”) is highly exposed to flooding events and would therefore need intervention. Namacurra District exhibited the highest vulnerability, with coastal segments classified as EI “Very High” (see Supplementary Figure 15).
The province with the next highest mangrove surface loss is Sofala, where mangrove area shrank from 451 km2 in 2013 to 366 km2 in 2023—a loss of 84 km2 (−19%). EI values range from 1.1 to 5, with a mean value of 2.5. The Coastal Vulnerability Model showed that 40% of Sofala’s coastline (classified from “Intermediate” to “Very High”) is highly exposed to flooding event. Cidade da Beira District displayed the highest vulnerability, with coastal segments ranked as “High” and “Very High” EI. Notably, Cyclone Idai severely impacted Beira, and the MVI analysis of the Buzi River area revealed a mangrove cover reduction from 76 km2 pre-cyclone (2018) to 23 km2 post-cyclone (2019)—a loss of 53 km2 (−69%; Figure 6). This underscores the cyclone’s significant impact on mangrove ecosystems, as well as on human life and infrastructe.
In Nampula Province, MVI analysis indicated a mangrove area decrease from 370 km2 in 2013 to 338 km2 in 2023—a loss of 31 km2 (−8%). EI values range from 1.1 to 4.8, with a mean value of 2.4. The Coastal Vulnerability Model showed that 39% of Napula’s coastline (classified from “Intermediate” to “Very High”) is highly exposed to flooding. Moma and Angoche Districts showed the highest vulnerability, with coastal segments classified as EI “Very High” (see Supplementary Figure 18).
In Maputo Province, MVI analysis revealed that mangrove area decreased from 41 km2 in 2013 to 36 km2 in 2023—a loss of 5 km2 (−12%), equating to approximately 0.5 km2 per year. EI values range from 1 to 4.5 (mean: 2.6). The Coastal Vulnerability Model showed that 46% of Maputo’s coastline (classified from “Intermediate” to “Very High”) is highly exposed to flooding events. Marracuene and Manhiça Districts exhibited the most “Intermediate-High” EI values, while Cidade de Maputo had “Very High” EI segments.
In Inhambane Province, the MVI analysis showed a slight decrease in mangrove area—from 156 km2 in 2013 to 153 km2 in 2023—a loss of 3 km2 (−2%). EI values range from 1 to 4.2 (mean: 2.4). The Coastal Vulnerability Model showed that 38% of the coastline of Inhambane Province (values ranging from “Intermediate” to “High” - no “Very High” values were recorded) is found to be highly exposed to flooding. Zavala District exhibited the most “Intermediate-High” EI values.
Conversely, Cabo Delgado Province experienced a mangrove area increase, from 281 km2 in 2013 to 287 km2 in 2023—a gain of 6 km2 (+2%). EI values range from 1 to 4.6 (mean: 2.4). The Coastal Vulnerability Model showed that 39% of the coastline of Cabo Delgado Province (values ranging from “Intermediate” to “Very High”) is highly exposed to flooding. Palma District exhibited the highest vulnerability, with “Very High” EI coastal segments, followed by Mocímboa da Praia.
Similarly, MVI analysis revealed a mangrove area increase in Gaza Province from 2.8 km2 in 2013 to 3.2 km2 in 2023—a gain of 0.5 km2 (+15%). These mangroves, located primarily in the protected Limpopo River delta, showed no significant disturbance. EI values range from 1.4 to 4 (mean: 2.6). The Coastal Vulnerability Model showed that 50.7% of the coastline of Gaza Province (values ranging from “Intermediate” to “High”; no “Very High” values recorded) is highly exposed to flooding. Mandlakaze District exhibited the most “Intermediate-High” EI values, indicating higher vulnerability.
For more details on the results for each coastal province, see Supplementary materials section B. In addition, maps showing mangrove loss and gain for certain areas of Mozambique are available in Supplementary materials section C.
4 Discussion
This study presents a robust framework for evaluating the dynamics of mangrove ecosystems and the vulnerability of the coastline in Mozambique, an area that is particularly vulnerable to the effects of climate change, such as intensifying cyclones and rising sea levels (Chichava et al., 2024). Our approach enhances the precision of mangrove monitoring and coastal exposure analysis by integrating the MVI with the InVEST Coastal Vulnerability Model at a 100 m resolution. The standardized, cloud-based workflow utilizing Google Earth Engine and QGIS offers a scalable alternative to traditional field surveys, enabling the efficient identification of priority areas for conservation and restoration. This methodology strengthens Mozambique’s disaster risk management framework and makes a significant contribution to global research on coastal resilience in regions vulnerable to climate change.
This study rigorously quantifies mangrove loss in Mozambique from 2013 to 2023, documenting a 18% reduction (377 km2), which aligns with global mangrove decline rates of 1–2% annually (Zhang et al., 2017). By applying the MVI within Google Earth Engine, we effectively mapped mangroves at 10 m and 30 m resolutions, leveraging its ability to distinguish mangroves from other vegetation types (Baloloy et al., 2020). The MVI’s simplicity and automation potential position it as a scalable tool for rapid, cloud-based monitoring, surpassing labor-intensive field surveys (Liu et al., 2008; Baloloy et al., 2020). However, the MVI’s upper limit in Mozambique exceeds reported thresholds, suggesting denser mangrove stands and highlighting the need for region-specific calibration to optimize classification accuracy (Baloloy et al., 2020).
The provinces of Zambezia and Sofala, in addition to being the provinces with the highest mangrove coverage in the country, are also those that have suffered the greatest losses. In the case of Zambezia province, we are talking about a 32% (−259 km2) reduction in 10 years, concentrated mainly in the districts of Maquival and Namacurra. It is believed that among the main causes of this loss are the construction of the Kariba Dam in 1960 and the Cahora Bassa Dam in 1975 on the Zambezi River, which over the years have altered both the total flow of fresh water into the delta and the cyclical flooding of the floodplain (Fatoyinbo et al., 2008). Those districts also result in high coastal vulnerability to flooding and erosion, as assessed by the InVEST Coastal Vulnerability Model (Tallis et al., 2015). About 14% of Zambezia’s coastline is classified as highly or very highly vulnerable, due to its geomorphology like low-lying land and large estuaries (Cabral et al., 2017; Charrua et al., 2020).
As for the province of Sofala, there has been an 18% (−85 km2) loss in 10 years, with the greatest losses concentrated along the Buzi and Púnguè rivers (hit in 2019 by Cyclone Idai). The cyclone reduced Buzi and Púnguè River mangrove cover by 69.33% (54 km2), highlighting the destructive impact of extreme weather events (Charrua et al., 2021; Phiri et al., 2021). This is an area highly prone to cyclones, which cause severe flooding (Sete et al., 2002). While mangroves have the ability to protect coastlines from storm surges—reducing wave speed thanks to their dense system of aerial roots (Quartel et al., 2007; Zhang et al., 2012; Pinsky et al., 2013; Spalding and Leal, 2024)—these events can also pose a serious threat, leading to extensive destruction of trunks and roots (Charrua et al., 2021; Phiri et al., 2021). This study quantitatively assessed the degradation of mangroves after Cyclone Idai struck the Beira area (in Sofala province), but further research on estimating the recovery time of these plants is needed. It should be noted that the greater the frequency of these extreme weather events, the less time these plants have to grow and recolonize areas, and the less ecosystem services they can provide to coastal populations. Timely intervention to promote restoration in degraded areas that are highly susceptible to cyclones could be an effective strategy for maintaining active coastal protection ecosystem services to limit damage to people and infrastructure in preparation for the next flood. In addition to being an area highly prone to this type of event, mangroves are also threatened by deforestation (Barbosa et al., 2001).
In contrast, Gaza and Cabo Delgado provinces showed modest mangrove gains (14 and 2%, respectively), possibly due to favorable riverine conditions and lower anthropogenic pressures (Fatoyinbo et al., 2008). In particular, with regard to the province of Cabo Delgado, this area is known to be sparsely populated and to have security problems. We believe that this may have contributed to both a better EI (despite being an area highly prone to cyclones) and less mangrove loss (due to less human influence).
Maputo Province, despite pollution from oil spills and urban waste (Sete et al., 2002; Simbine, 2023), experienced a moderate loss of 18%, which may suggest localized resilience or restoration efforts. Notably, initiatives such as the Italian Agency for Development Cooperation’s project in the Maputo Baia (AICS, 2022) and recent ecological assessments on the mangroves of Matola District (Simbine, 2023; Litulo et al., 2023) reflect a growing institutional focus on conservation and rehabilitation. These provincial variations underscore the interplay of local ecological conditions and human activities in shaping mangrove dynamics. The main threats to mangroves reported in the literature for Maputo Bay are firstly that Maputo City hosts one of the major ports in Southeast Africa, increasing the risk of oil spills (Sete et al., 2002). A total of 14 minor and two major crude oil spills involving mangroves have occurred in Maputo Harbor, including one in 1992 involving the tanker Katina P (Barbosa et al., 2001). In addition, five rivers, some of which are international, flow into the bay and are used for agricultural purposes in the upper part of the riviera, and thus there is an influx of pollutants and reduced river flow in the lower part of the riviera (Sete et al., 2002). Another problem is that the existence of mangroves and the high level of nutrients from the rivers encourages the development of commercially valuable fisheries, such as shallow-water shrimp and small pelagic species (Sete et al., 2002). Moreover, Maputo City, which is connected to the bay, is overpopulated, with about 2 million people, without adequate treatment of domestic waste. The country’s major industries are located in Maputo and Matola and dump their waste into the bay (Sete et al., 2002). All these factors contribute to the possible pollution of the bay through domestic, industrial, and agricultural wastes, which, in turn, can affect water quality and thus ecosystem productivity. Finally, regarding the main causes of mangrove destruction in Maputo Bay, Charrua et al. (2020) include deforestation and urban expansion.
Mangroves play a critical role in mitigating coastal hazards by reducing wave energy and storm surge impacts, as evidenced by modeling studies (Massel et al., 1999; Mazda et al., 2006; Barbier, 2008; Blankespoor et al., 2017). Their protective capacity depends on forest width, density, and coastal topography (Spalding and Leal, 2024). In Mozambique, 9.5% of the 11,768.11 km coastline is highly or very highly vulnerable, with Zambezia, Sofala, and Maputo facing elevated risks (Charrua et al., 2020). The severe mangrove loss in these provinces likely amplifies coastal exposure, as mangroves provide critical stabilization and flood protection (Alongi, 2008; UNEP-WCMC, 2006).
The combined use of the MVI and InVEST models offers a robust framework for identifying priority areas for mangrove management. High-vulnerability districts, such as Buzi and Cidade da Beira (Sofala) and Maquival and Namacurra (Zambezia), which also experience significant mangrove loss and population pressures, warrant urgent intervention (Charrua et al., 2020). Restoration projects, prioritizing flood-tolerant species like Avicennia marina (Alongi, 2008), could enhance coastal resilience in these areas. Moreover, stakeholder engagement and enforced regulations are essential to ensure community development, biodiversity conservation, and social equity in mangrove management (Charrua et al., 2020).
The mangrove loss rate observed in Mozambique from 2013 to 2023 (−18%) is consistent with values found in other tropical and subtropical regions but slightly exceeds the global annual average of 0.16–2% (Hamilton and Casey, 2016; Zhang et al., 2017). The Global Mangrove Watch (2024) reports that, among the countries with the highest mangrove coverage, Mozambique ranks eighth among the top 10 mangrove-holding countries in terms of loss between 1996 and 2020. Globally, the most severe recent declines have occurred in Indonesia, Australia, Mexico, Myanmar, and Cuba (Hamilton and Casey, 2016; Global Mangrove Watch, 2024). Despite these trends, our findings suggest that the rate of mangrove loss in Mozambique is higher than the global average, indicating a particularly critical situation.
Despite its strengths, this study does not include accuracy estimates for the MVI, limiting confidence in its precision. The discrepancy between our 2023 mangrove estimate (1,739.44 km2) and GMW’s 2020 estimate (3,380.27 km2) likely reflects methodological or resolution differences, which should be further investigated (Global Mangrove Watch, 2024). Future research should focus on validating MVI performance across ecosystems, incorporating time-series analyses (e.g., NDVI) to detect flooding events, and assess restoration outcomes. Additionally, investigating cyclone impacts under climate change scenarios is critical for designing Nature-based Solutions, particularly in under-studied regions such as Sofala (Charrua et al., 2021).
The choice to resample Sentinel-2 imagery from 10 m to 30 m resolution was made to ensure direct comparability with Landsat-8 data, allowing consistent application of the MVI across both time periods. Although alternative approaches such as pan-sharpening Landsat imagery to 15 m using the panchromatic band have been applied in other land cover studies, this option was not suitable for our analysis. The Landsat panchromatic band does not include the shortwave infrared (SWIR) wavelengths that are essential for MVI calculation, and pan-sharpening can introduce spectral distortions that may reduce the reliability of vegetation indices in complex coastal environments. For these reasons, we prioritized spectral integrity and methodological consistency. Nevertheless, future studies could explore pan-sharpened datasets as complementary inputs, particularly for object-based classifications or fine-scale land cover mapping.
The InVEST Coastal Vulnerability Model simplifies the EI calculation by using a geometric mean and does not incorporate habitat quality and conservation status (Cabral et al., 2017). Data unavailability for sea level rise and geomorphology limited the analysis. Furthermore, the model does not account for cyclone damage occurring inland—a significant omission in Mozambique, where lightweight housing often results in severe impacts hundreds of kilometers from the coast (Cabral et al., 2017).
Mozambique’s multi-tiered disaster management system—led by the National Institute for Disaster Management (INGC) and supported by regional centers and community committees—is reinforced by anticipatory action protocols and early warning systems (IFRC, 2013). This article strengthens that framework by providing a spatially explicit assessment of mangrove loss and cyclone vulnerability using MVI and the InVEST model. The findings support targeted intervention, mangrove restoration, and integration of Nature-based Solutions into national disaster preparedness and coastal adaptation strategies.
Mozambique has developed a comprehensive, multi-level approach to cyclone preparedness and response, combining strong national coordination through the National Institute for Disaster Management (INGC), regional specialization via emergency operation centers (CENOE) in Vilankulos, Caia, and Nacala, and grassroots engagement through local Disaster Risk Management Committees. This system is complemented by community-based early warning mechanisms and anticipatory action frameworks, including the Early Action Protocol (EAP) for cyclones and forecast-based financing supported by the Mozambique Red Cross Society and the World Food Program (IFRC, 2013). Within this framework, the present article provides a timely and valuable contribution by delivering a spatially explicit assessment of mangrove loss and cyclone vulnerability. It strengthens Mozambique’s national DRR planning, aligning closely with the objectives of the Plano Director para a Redução do Risco de Desastres 2017–2030 (PDRRD), which emphasizes integrated risk management, territorial planning, and ecosystem-based adaptation (PDRRD, 2017).
The combined use of the MVI and the InVEST Coastal Vulnerability Model offers operational decision support for implementing Nature-based Solutions (NbS), identifying restoration priorities, and mainstreaming resilience into development strategies. By identifying priority zones for mangrove restoration and highlighting high-risk coastal segments, this study supports both defense and environmental institutions in proactively reducing cyclone-related impacts. It also serves broader cross-sectoral goals—from blue economy development to land-use planning—ultimately strengthening Mozambique’s resilience in the face of escalating climate risks.
Despite its strengths, this study does not include accuracy estimates for the MVI, limiting confidence in its precision, a common limitation in large-scale mangrove remote sensing studies, where logistical and financial constraints often hinder systematic ground data collection (Giri et al., 2011; Zhang et al., 2017; Baloloy et al., 2020). Future research should focus on validating MVI performance across ecosystems, incorporating time-series analyses, and targeted field validation.
In conclusion, this study advances mangrove monitoring by combining MVI mapping with coastal vulnerability modeling, emphasizing the urgent need for conservation in Mozambique’s most at-risk provinces. By providing a scalable, data-driven approach, our workflow supports global mangrove management efforts and contributes to safeguarding ecosystem services that are vital to coastal communities (Liu et al., 2008; Zhang et al., 2017; Baloloy et al., 2020).
5 Conclusion
This study provides the first national-scale analysis combining mangrove cover change and coastal vulnerability in Mozambique using the MVI and the InVEST Coastal Vulnerability Model. Results reveal a significant decline in mangrove extent between 2013 and 2023, with a 18% national loss and more severe reductions in provinces facing the highest exposure to coastal hazards. This spatial correlation underscores the urgent need to integrate mangrove conservation into coastal risk management strategies.
The MVI proved effective for rapid, large-scale mangrove monitoring, while the InVEST model highlighted areas where natural habitats play a critical role in mitigating erosion and flooding. However, both tools have limitations. The MVI requires further validation, and the InVEST model excludes important variables such as inland cyclone impacts and habitat condition. These gaps call for targeted field validation and the integration of additional data layers, including sea-level rise and geomorphology, to enhance future assessments.
Given Mozambique’s high vulnerability to climate extremes and rapid coastal development, the findings support the prioritization of Nature-based Solutions, particularly mangrove restoration, in spatial planning. Protecting and rehabilitating mangroves in high-risk areas such as Zambezia, Sofala, and Maputo provinces will be essential to safeguard ecosystems, livelihoods, and infrastructure in the face of escalating climate threats.
Data availability statement
Data on mangrove cover at 30 m resolution (as of 2013 and 2023) are available at this link in GeoTIFF format: https://doi.org/10.6084/m9.figshare.29249738.v2. For data at 10 m resolution, please contact the authors. Raster data on mangrove loss and gain between 2013 and 2023 are available in GeoTIFF format at the following link: https://doi.org/10.6084/m9.figshare.30011083.v1.
Author contributions
CF: Data curation, Resources, Validation, Conceptualization, Visualization, Formal analysis, Supervision, Methodology, Writing – review & editing, Software, Writing – original draft, Investigation. FA: Visualization, Methodology, Supervision, Funding acquisition, Software, Project administration, Resources, Writing – review & editing, Validation. CB: Supervision, Data curation, Conceptualization, Investigation, Validation, Resources, Writing – review & editing, Visualization. EC: Visualization, Supervision, Writing – review & editing. PR-P: Formal analysis, Resources, Visualization, Funding acquisition, Project administration, Supervision, Data curation, Writing – review & editing, Conceptualization, Validation. LM: Writing – review & editing, Software, Formal analysis, Visualization, Validation, Conceptualization, Supervision, Methodology, Data curation, Investigation.
Funding
The author(s) declare that financial support was received for the research and/or publication of this article. This research was funded by the project “ManGrowth – Preservation of Ecosystems for Sustainable Development” (AID 12432), an international cooperation project between Sapienza University of Rome and University Eduardo Mondlane of Maputo, funded by AICS (Italian Agency for Development Cooperation).
Acknowledgments
The authors would like to thank Pierluca Nazari for his technical support in GIS applications during the conduct of this study.
Conflict of interest
The authors declare that the research was conducted in the absence of any commercial or financial relationships that could be construed as a potential conflict of interest.
Generative AI statement
The author(s) declare that no Gen AI was used in the creation of this manuscript.
Any alternative text (alt text) provided alongside figures in this article has been generated by Frontiers with the support of artificial intelligence and reasonable efforts have been made to ensure accuracy, including review by the authors wherever possible. If you identify any issues, please contact us.
Publisher’s note
All claims expressed in this article are solely those of the authors and do not necessarily represent those of their affiliated organizations, or those of the publisher, the editors and the reviewers. Any product that may be evaluated in this article, or claim that may be made by its manufacturer, is not guaranteed or endorsed by the publisher.
Supplementary material
The Supplementary material for this article can be found online at: https://www.frontiersin.org/articles/10.3389/ffgc.2025.1648754/full#supplementary-material
References
AICS (2022). Projeto de gestão sustentável dos mangais na baía de Maputo Available online at: https://maputo.aics.gov.it/pt/2022/5468/ (Accessed April 20, 2025).
Akay, A. E., and Erdoğan, A. (2017). GIS-based multi-criteria decision analysis for forest fire risk mapping. ISPRS Annals of the photogrammetry, remote sensing and spatial information sciences IV-4/W4, 25–30. doi: 10.5194/isprs-annals-IV-4-W4-25-2017
Alongi, D. M. (2008). Mangrove forests: resilience, protection from tsunamis, and responses to global climate change. Estuar. Coast. Shelf Sci. 76, 1–13. doi: 10.1016/j.ecss.2007.08.024
Arabameri, A., Pradhan, B., Rezaei, K., and Conoscenti, C. (2019). Gully erosion susceptibility mapping using GIS-based multi-criteria decision analysis techniques. Catena 180, 282–297. doi: 10.1016/j.catena.2019.04.032
Baloloy, A. B., Blanco, A. C., Ana, R. R. C. S., and Nadaoka, K. (2020). Development and application of a new mangrove vegetation index (MVI) for rapid and accurate mangrove mapping. ISPRS J. Photogramm. Remote Sens. 166, 95–117. doi: 10.1016/j.isprsjprs.2020.06.001
Barbier, E. B. (2000). Valuing the environment as input: review of applications to mangrove-fishery linkages. Ecol. Econ. 35, 47–61. doi: 10.1016/S0921-8009(00)00167-1
Barbier, E. B. (2008). In the wake of tsunami: lessons learned from the household decision to replant mangroves in Thailand. Resour. Energy Econ. 30, 229–249. doi: 10.1016/j.reseneeco.2007.08.002
Barbier, E. B., Hacker, S. D., Kennedy, C., Koch, E. W., Stier, A. C., and Silliman, B. R. (2011). The value of estuarine and coastal ecosystem services. Ecol. Monogr. 81, 169–193. doi: 10.1890/10-1510.1
Barbosa, F. M., Cuambe, C. C., and Bandeira, S. O. (2001). Status and distribution of mangroves in Mozambique. S. Afr. J. Bot. 67, 393–398. doi: 10.1016/S0254-6299(15)31155-8
Blankespoor, B., Dasgupta, S., and Lange, G. M. (2017). Mangroves as a protection from storm surges in a changing climate. Ambio 46, 478–491. doi: 10.1007/s13280-016-0838-x
Bosire, J., Celliers, L., Groeneveld, J., Paula, J., and Schleyer, M. H. (2015). Regional state of the coast report-western Indian ocean. Nairobi, Kenya: UNEP-Nairobi Convention and WIOMSA.
Bourgeois, C. F., MacKenzie, R. A., Sharma, S., Bhomia, R. K., Johnson, N. G., Rovai, A. S., et al. (2024). Four decades of data indicate that planted mangroves stored up to 75% of the carbon stocks found in intact mature stands. Sci. Adv. 10:eadk5430. doi: 10.1126/sciadv.adk5430
Cabral, P., Augusto, G., Akande, A., Costa, A., Amade, N., Niquisse, S., et al. (2017). Assessing Mozambique's exposure to coastal climate hazards and erosion. Int. J. Disaster Risk Reduct. 23, 45–52. doi: 10.1016/j.ijdrr.2017.04.002
Charrua, A. B., Bandeira, S. O., Catarino, S., Cabral, P., and Romeiras, M. M. (2020). Assessment of the vulnerability of coastal mangrove ecosystems in Mozambique. Ocean Coast. Manag. 189:105145. doi: 10.1016/j.ocecoaman.2020.105145
Charrua, A. B., Padmanaban, R., Cabral, P., Bandeira, S., and Romeiras, M. M. (2021). Impacts of the tropical cyclone Idai in Mozambique: a multi-temporal Landsat satellite imagery analysis. Remote Sens 13:201. doi: 10.3390/rs13020201
Chichava, D., Yu, J., King, P. H., and Ekwacu, S. (2024). Change in the number of tropical cyclone landfall and approach over Mozambique from 1980 to 2020. J. Geoscience Environ. Prot. 12, 1–20. doi: 10.4236/gep.2024.1210001
Darwish, K. (2023). GIS-based multi-criteria decision analysis for flash flood hazard and risk assessment: a case study of the eastern Minya watershed, Egypt. Environ. Sci. Proc. 25:87.
Das, S., and Crépin, A. S. (2013). Mangroves can provide protection against wind damage during storms. Estuar. Coast. Shelf Sci. 134, 98–107. doi: 10.1016/j.ecss.2013.09.021
Devi, S. (2019). Cyclone Idai: 1 month later, devastation persists. Lancet 393:1585. doi: 10.1016/S0140-6736(19)30892-X
Duke, N., Ball, M., and Ellison, J. (1998). Factors influencing biodiversity and distributional gradients in mangroves. Glob. Ecol. Biogeogr. Lett. 7, 27–47.
Duke, N. C., Meynecke, J. O., Dittmann, S., Ellison, A. M., Anger, K., Berger, U., et al. (2007). A world without mangroves? Science 317, 41–42. doi: 10.1126/science.317.5834.41b
Duke, N. C., and Schmitt, K. (2015). Mangroves: Unusual forests at the seas edge. Berlin, Heidelberg: Tropical forestry handbook, vol. 1.
FAO (2007). The world’s mangroves 1980–2005. FAO forestry paper 153. Rome, Italy: Food and Agricultural Organization, 77.
Farnsworth, E. J., and Ellison, A. M. (1997). The global conservation status of mangroves. Okinawa, Japan.
Fatoyinbo, T. E., Simard, M., Washington-Allen, R. A., and Shugart, H. H. (2008). Landscape-scale extent, height, biomass, and carbon estimation of Mozambique's mangrove forests with Landsat ETM+ and shuttle radar topography Mission elevation data. J. Geophys. Res. 113:G02506. doi: 10.1029/2007JG000551
Friess, D. A. (2017). Ecotourism as a tool for mangrove conservation. Sumatra J. Disaster, Geography and Geography Educ. 1, 24–35.
Frosi, L., Arcioni, M., Macamo, C., Attorre, F., Nicosia, E., Americo, M., et al. (2025). Temporal trends, geographic scope, and research gaps in Mozambican mangrove studies. Reg. Stud. Mar. Sci. 90:104422. doi: 10.1016/j.rsma.2025.104422
Giri, C., Ochieng, E., Tieszen, L. L., Zhu, Z., Singh, A., Loveland, T., et al. (2011). Status and distribution of mangrove forests of the world using earth observation satellite data. Glob. Ecol. Biogeogr. 20, 154–159. doi: 10.1111/j.1466-8238.2010.00584.x
Giri, C., Zhu, Z., Tieszen, L. L., Singh, A., Gillette, S., and Kelmelis, J. A. (2008). Mangrove forest distributions and dynamics (1975–2005) of the tsunami-affected region of Asia. J. Biogeogr. 35, 519–528. doi: 10.1111/j.1365-2699.2007.01806.x
Global Mangrove Watch. (2024) Global mangrove watch. Available online at: https://www.globalmangrovewatch.org (Accessed on August 23, 2025)
Goldberg, L., Lagomasino, D., Thomas, N., and Fatoyinbo, T. (2020). Global declines in human-driven mangrove loss. Glob. Chang. Biol. 26, 5844–5855. doi: 10.1111/gcb.15275
Gornitz, V. (1990). Vulnerability of the East Coast, USA to future sea level rise. J. Coast. Res., 201–237. Available at: http://www.jstor.org/stable/44868636
Government of Mozambique (2019). Lei do mar, no. 20/2019 [law of the sea]. Maputo: Government of Mozambique.
Government of Mozambique (2020). Estratégia de Gestão de Mangais 2020–2024 [Mangrove Management Strategy], Resolution No. 33/2020. Maputo: Government of Mozambique.
Government of Mozambique (2023). Lei de Florestas, No. 17/2023 [Forest Law]. Maputo: Government of Mozambique.
Hamilton, S. E., and Casey, D. (2016). Creation of a high spatio-temporal resolution global database of continuous mangrove forest cover for the 21st century (CGMFC-21). Glob. Ecol. Biogeogr. 25, 729–738. doi: 10.1111/geb.12449
Hammar-Klose,, and Thieler, E.R. (2001). Coastal vulnerability to sea-level rise: A preliminary database for the U.S. Atlantic, Pacific, and Gulf of Mexico coasts. U.S. Geological Survey, digital data series DDS-68, 1 CD-ROM.
Hoguane, A. M., and Armando, E. V. (2015). The influence of the river runoff in the artisanal fisheries catches in tropical coastal waters–the case of the Zambezi River and the fisheries catches in the northern Sofala Bank, Mozambique. Rev. Gestão Costeira Integr. 15, 443–451. doi: 10.5894/rgci600
Hoque, M. A. A., Phinn, S., Roelfsema, C., and Childs, I. (2018). Assessing tropical cyclone risks using geospatial techniques. Appl. Geogr. 98, 22–33. doi: 10.1016/j.apgeog.2018.07.004
IFRC (2013). Early warning, early action in Mozambique Available online at: https://preparecenter.org/wp-content/sites/default/files/cs-ewea-mozambique-en_0.pdf (Accessed April 15, 2025).
Kumar, T., Mandal, A., Dutta, D., Nagaraja, R., and Dadhwal, V. K. (2019). Discrimination and classification of mangrove forests using EO-1 hyperion data: a case study of Indian Sundarbans. Geocarto Int. 34, 415–442. doi: 10.1080/10106049.2017.1408699
Lee, J., Im, J., Cha, D. H., Park, H., and Sim, S. (2019). Tropical cyclone intensity estimation using multi-dimensional convolutional neural networks from geostationary satellite data. Remote Sens 12:108. doi: 10.3390/rs12010108
Lee, S. Y., Primavera, J. H., Dahdouh-Guebas, F., McKee, K., Bosire, J. O., Cannicci, S., et al. (2014). Ecological role and services of tropical mangrove ecosystems: a reassessment. Glob. Ecol. Biogeogr. 23, 726–743. doi: 10.1111/geb.12155
Litulo, C., Fernandes, R. S., Soares, M., and Pereira, M. A (2023) Estudo Sobre os Mangais do Distrito da Matola e Estuário do Espírito Santo, Baía de Maputo. Maputo, Mozambique.
Liu, K., Li, X., Shi, X., and Wang, S. (2008). Monitoring mangrove forest changes using remote sensing and GIS data with decision-tree learning. Wetlands 28, 336–346. doi: 10.1672/06-91.1
Lovelock, C. E., Cahoon, D. R., Friess, D. A., Guntenspergen, G. R., Krauss, K. W., Reef, R., et al. (2015). The vulnerability of indo-Pacific mangrove forests to sea-level rise. Nature 526, 559–563. doi: 10.1038/nature15538
Lugo, A. E., Evink, G., Brinson, M. M., Broce, A., and Snedaker, S. C. (1975). “Diurnal rates of photosynthesis, respiration, and transpiration in mangrove forests of South Florida” in Tropical ecological systems: Trends in terrestrial and aquatic research. (Eds.) Golley, F. B., and Medina, E. (Berlin, Heidelberg: Springer Berlin Heidelberg), 335–350.
Massel, S. R., Furukawa, K., and Brinkman, R. M. (1999). Surface wave propagation in mangrove forests. Fluid Dyn. Res. 24, 219–249.
Mazda, Y., Magi, M., Ikeda, Y., Kurokawa, T., and Asano, T. (2006). Wave reduction in a mangrove forest dominated by Sonneratia sp. Wetl. Ecol. Manag. 14, 365–378. doi: 10.1007/s11273-005-5388-0
McIvor, A., Spencer, T., Spalding, M., Lacambra, C., and Möller, I. (2015). “Mangroves, tropical cyclones, and coastal hazard risk reduction” in Coastal and marine hazards, risks, and disasters (Elsevier), 403–429.
MICOA (1998). Strategy and areas for action for the conservation of biological diversity in Mozambique. Maputo: MICOA.
Nelson, K., and Burnside, N. G. (2019). Identification of marine management priority areas using a GIS-based multi-criteria approach. Ocean Coast. Manag. 172, 82–92. doi: 10.1016/j.ocecoaman.2019.02.002
PDRRD. (2017). Plano Director para a Redução do Risco de Desastres 2017–2030. Governo de Moçambique, Available online at: https://ingd.gov.mz/wp-content/uploads/2020/11/PDRRD_BROCHURA_FINAL_IMpressao.pdf (Accessed April 16, 2025).
Phiri, D., Simwanda, M., and Nyirenda, V. (2021). Mapping the impacts of cyclone Idai in Mozambique using Sentinel-2 and OBIA approach. S. Afr. Geogr. J. 103, 237–258. doi: 10.1080/03736245.2020.1740104
Pinsky, M. L., Guannel, G., and Arkema, K. K. (2013). Quantifying wave attenuation to inform coastal habitat conservation. Ecosphere 4, 1–16. doi: 10.1890/ES13-00080.1
Quartel, S., Kroon, A., Augustinus, P. G. E. F., Van Santen, P., and Tri, N. H. (2007). Wave attenuation in coastal mangroves in the red River Delta, Vietnam. J. Asian Earth Sci. 29, 576–584. doi: 10.1016/j.jseaes.2006.05.008
Rönnbäck, P. (1999). The ecological basis for economic value of seafood production supported by mangrove ecosystems. Ecol. Econ. 29, 235–252.
Saenger, P., and Saenger, P. (2002). Mangrove Silviculture and restoration. Mangrove ecology, Silviculture and conservation (Dordrecht, The Netherlands), 229–270.
Saket, M., and Matusse, R. V. (1994) Study for the determination of the rate of deforestation of the mangrove vegetation in Mozambique. Rome, italy.
Sete, C. I., Ruby, J., and Dove, V. (2002). Seasonal variation of tides, currents, salinity and temperature along the coast of Mozambique: Instituto Nacional de Hidrografia e Navegacao, Maputo, 72.
Simbine, J. J. (2023) Avaliação das técnicas de remediação do solo e água contaminados pelo derrame do gasóleo, usadas pela empresa Conut Organic na bacia do Rio Umbeluzi. Maputo, Mozambique.
Spalding, M. D., Blasco, F., and Field, C. D. (1997). World mangrove atlas. Okinawa, Japan: International Society for Mangrove Ecosystems.
Tallis, H., Rickets, T., Guerry, A., and Wood, S., (2015). InVEST 3.1.1 user’s guide: Integrated valuation of environmental services and trade-offs Nat. Capital. Proj. Available online at: https://naturalcapitalproject.stanford.edu/invest/ (Accessed October 2024).
Tam, N. F., and Wong, Y. S. (1993). Retention of nutrients and heavy metals in mangrove sediment receiving wastewater of different strengths. Environ. Technol. 14, 719–729.
UNEP-WCMC (2006). In the front t line: Shoreline protection and other ecosystem services from mangroves and coral reefs. Cambridge, UK: UNEP-WCMC, 33.
United Nations International Strategy for Disaster Reduction (UNISDR). (2009). UNISDR terminology on disaster risk reduction. United Nations. Available online at: https://www.undrr.org/publication/2009-unisdr-terminology-disaster-risk-reduction (Accessed July 8, 2025).
Visschers, L. L., Santos, C. D., and Franco, A. M. (2022). Accelerated migration of mangroves indicate large-scale saltwater intrusion in Amazon coastal wetlands. Sci. Total Environ. 836:155679. doi: 10.1016/j.scitotenv.2022.155679
Wang, W., Yan, Z., You, S., Zhang, Y., Chen, L., and Lin, G. (2011). Mangroves: obligate or facultative halophytes? A review. Trees 25, 953–963. doi: 10.1007/s00468-011-0570-x
WWF (2024). Community rights and natural resource governance in Mozambique: Policy brief. Maputo, Mozambique: Worldwide Fund for Nature (Formaly World Wildlife Fund) South West Indian Ocean Regional, Programme.
Zhang, K., Liu, H., Li, Y., Xu, H., Shen, J., Rhome, J., et al. (2012). The role of mangroves in attenuating storm surges. Estuar. Coast. Shelf Sci. 102-103, 11–23. doi: 10.1016/j.ecss.2012.02.021
Zhang, X., Treitz, P. M., Chen, D., Quan, C., Shi, L., and Li, X. (2017). Mapping mangrove forests using multi-tidal remotely-sensed data and a decision-tree-based procedure. Int. J. Appl. Earth Obs. Geoinf. 62, 201–214. doi: 10.1016/j.jag.2017.06.010
Appendix
Data and software
• Natural Capital Project. (2025). InVEST coastal vulnerability model [Computer software]. Stanford University. https://naturalcapitalproject.stanford.edu/software/invest
• QGIS.org. (2024). QGIS Geographic Information System (Version 3.28.11) [Software]. QGIS Association. https://qgis.org.
• Gorelick et al. (2017). Google Earth Engine: Planetary-scale geospatial analysis for everyone. Remote Sensing of Environment, 202, 18–27. https://doi.org/10.1016/j.rse.2017.06.031. https://earthengine.google.com.
• R Core Team. (2024). R: A Language and Environment for Statistical Computing (Version 4.3.1) [Software]. R Foundation for Statistical Computing. https://www.R-project.org.
• Coral reef and seagrass: http://geoportal.rcmrd.org/layers/servir%3Amozambique_seagrass.
• Coastal Forests: https://dynamicworld.app/.
• Landmass and AOI: https://data.humdata.org/dataset/cod-ab-moz?#.
• DEM: Copernicus DEM GLO-30: Global 30 m Digital Elevation Model.
• Bathymetry: https://www.gebco.net/data_and_products/gridded_bathymetry_data/.
• Population: WorldPop Global Project Population Data: Estimated Residential Population per 100x100m Grid Square.
• WAVEWATCH III®: https://polar.ncep.noaa.gov/waves/wavewatch/.
• Mozambique Administrative Boundaries: https://data.humdata.org/dataset/cod-ab-moz?#
• USGS Landsat 8 Level 2, Collection 2, Tier 1.
• Harmonized Sentinel-2 MSI: MultiSpectral Instrument, Level 2A.
• Mozambique waterways: https://data.humdata.org/dataset/hotosm_moz_waterways.
Keywords: mangrove cover change, coastal vulnerability, cyclone impact, remote sensing, InVEST model
Citation: Foggia C, Attorre F, Bourgeois C, Candeago E, Ramoni-Perazzi P and Malatesta L (2025) Shields of the shore: mangrove ecosystem shifts and climate vulnerability in Mozambique. Front. For. Glob. Change. 8:1648754. doi: 10.3389/ffgc.2025.1648754
Edited by:
Soumendra Bhanja, Oak Ridge National Laboratory (DOE), United StatesReviewed by:
Youssef M. Youssef, Suez University, EgyptAnselme Muzirafuti, University of Messina, Italy
Peter Gitau, Max Planck Institute of Geoanthropology, Germany
Copyright © 2025 Foggia, Attorre, Bourgeois, Candeago, Ramoni-Perazzi and Malatesta. This is an open-access article distributed under the terms of the Creative Commons Attribution License (CC BY). The use, distribution or reproduction in other forums is permitted, provided the original author(s) and the copyright owner(s) are credited and that the original publication in this journal is cited, in accordance with accepted academic practice. No use, distribution or reproduction is permitted which does not comply with these terms.
*Correspondence: Camilla Foggia, Y2FtaWxsYS5mb2dnaWExOTk4QGdtYWlsLmNvbQ==