 Heng Wu1,2
 Xianglin Tian3*
 Francesco Minunno4
 Che Liu5
 Chunlin Luo1Xianpeng Xu1Changping Sun1
 Annikki Mäkelä2,5*
- 1Southwest Survey and Planning Institute, National Forestry and Grassland Administration, Kunming, China
- 2Department of Forest Sciences, University of Helsinki, Helsinki, Finland
- 3College of Forestry, Northwest A&F University, Yangling, China
- 4Yucatrote, Forest Modelling, Lagos, Portugal
- 5Institute for Atmospheric and Earth System Research (INAR), University of Helsinki, Helsinki, Finland
A scientific evaluation of site quality is essential for the sustainable management of forest ecosystems. However, the absence of a standardized evaluation framework has resulted in site quality assessments that are not comparable across different broadleaf forest types on large spatial scales, impacting forest management decisions related to afforestation, thinning, and carbon sink management. Therefore, establishing a methodological framework for evaluating the site quality of various broadleaf stands could provide practical implications for forestry. Using the data from four cycles of the National Forest Inventory (NFIs) of China, the Richards, Logistic, and Korf models were applied to simulating the growth of 18 major groups of broadleaf trees. We fitted guide curves using the models and constructed site productivity index models for each group. A generalized site productivity index model for broadleaf stands was developed using conversion coefficients between species, with subsequent applicability testing and spatial analysis to assess dynamic changes in site productivity. Results indicate that the Richards model, with an average coefficient of determination (R2) of 0.91, performed better than the Logistic and Korf models. Statistical tests show that the site productivity index models of major broadleaf stands achieve accuracy rates exceeding 90%. The Spearman correlation coefficient is greater than 0.99 between the productivity index classes based on generalized and specific models, demonstrating both the reliability and applicability of the generalized model. Proportional and spatial analyses indicate a continuous trend of improvement in the site productivity of broadleaf stands from 2003 to 2018. The generalized productivity index model based on the relationship between age and biomass was validated by feasibility tests, making it suitable for application in forestry management and prediction. A continuous improvement trend in the site productivity of broadleaf forest was demonstrated, despite fluctuations during short intervals related to uncertainties in our models, which provided a robust, large-scale tool for evaluating forest productivity, offering critical support for sustainable forest management, policy-making, and carbon sequestration strategies in China.
1 Introduction
Site quality is a measure of the ability of a site to produce plant biomass, or stemwood volume in forestry, over a period (Skovsgaard and Vanclay, 2008; Weiskittel et al., 2011). In the context of global climate change, accurate assessments of site productivity are no longer just for timber yield prediction but are fundamental for quantifying forest carbon sequestration potential, modeling ecosystem responses to environmental change, and guiding climate-adaptive forest management, such as afforestation planning and optimizing silvicultural practices. Site quality depends on both climatic and edaphic factors prevailing at the site, and due to wide small-scale variability of soil properties, it can vary considerably within relatively confined areas. Classifying sites based on their site quality would therefore be of great value for regional forest management planning, with implications on forest productivity, carbon sequestration, and the ecosystem’s ability to adapt to climate change (Cheveau et al., 2008; Pretzsch, 2020; Sheil and Bongers, 2020). However, determining site quality from environmental factors directly, remains challenging owing to the fact that the dominant factors influencing stand growth vary among tree species, and these factors interact with each other. Historically, methods for evaluating site quality have predominantly relied on two major approaches: biotic-factor-based methods and geographic-factor-based methods. In these methods, site index and dominant height-DBH relationships have been the most commonly used biotic indicators of site quality, while geographic indicators are easily categorized but often lack biological connections (Skovsgaard and Vanclay, 2008; Weiskittel et al., 2011; Ferrero et al., 2013). The basis of the classical site index theory is the finding that cumulative volume correlates with dominant height regardless of site quality, making dominant-height growth rate an easily measurable proxy for volume or biomass accumulation rate. However, the height-based methods are increasingly being challenged, as height growth is subject to external influences such as management practices and climate fluctuations, which affect the reliability and stability of site quality assessments (Molina-Valero et al., 2019). This inherent variability reduces the method’s accuracy, particularly in forests characterized by mixed species, uneven-aged structures, or complex canopy layers (Huang and Titus, 1993; Arias-Rodil et al., 2015; Duan et al., 2018; Hilmers et al., 2019).
An alternative to height-based site quality index is provided by the use of forest biomass as a direct indicator of site productivity. Biomass reflects the cumulative growth of forest stands and provides a more comprehensive measure of forest productivity than tree height alone (Teobaldelli et al., 2009; Hennigar et al., 2017). Using biomass as the primary indicator of site quality can enhance the accuracy and robustness of site evaluations, particularly in regions where forest conditions are highly variable or where management practices have significantly altered forest structure to select the dominant trees (Fu et al., 2017; Yu et al., 2024). This shift from height-based to biomass-based metrics is particularly essential in forestation projects for enhancing forest carbon sequestration in response to global climate change (Gao et al., 2024).
The lack of accurate, nationwide-scale evaluations of site quality has significantly constrained advancements in forest management and monitoring technologies, particularly in China (Wang et al., 2011). This gap highlights the necessity of developing large-scale, standardized models for assessing site productivity across the country’s diverse forest types (Farooq et al., 2020). The need for accurate evaluations of site quality has become increasingly urgent under the strategy of “carbon peak and carbon neutrality,” proposed by China at the 75th UNGA (United Nations General Assembly) General Debate. As carbon sinks play a key role in mitigating climate change, enhancing forest productivity through targeted management practices requires reliable and precise assessments of site potential (Tong et al., 2020). China’s vast and diverse forest ecosystems, both natural and planted forests, present unique challenges for site quality assessment (Liu and Yin, 2012). Differences in silvicultural systems-such as pure vs. mixed stands, even-aged vs. uneven-aged stands, and natural vs. plantation forests-further complicate the evaluation process (Wang et al., 2021). The diversity in forest composition and structure necessitates the development of flexible, large-scale models that can accommodate these differences at national level (Moreno-Fernández et al., 2018; Aguirre et al., 2022; Pretzsch et al., 2022).
The present research aims to bridge the gap by establishing biomass-based site productivity index models for major broadleaf forest types in China, providing a foundational tool for assessing forest productivity on the national scale. Developing a method to normalize species-specific productivity indices onto a generalized scale, that account for the complex dynamics of China’s diverse forest ecosystems, ensures that site quality potential evaluations are conducted on the same baseline level, which aims to provide forest managers and policymakers with the tools necessary to make informed decisions regarding forest productivity improvement.
2 Data source and descriptive statistics
2.1 Data source
The data for this study were sourced from the sixth (1999–2003), seventh (2004–2008), eighth (2009–2013), and ninth (2014–2018) national forest inventories (NFIs) of China, which primarily utilizes permanent plots for re-measurement to regularly and accurately assess the quantity, quality, and dynamic changes of forest resources at the national or provincial levels. Considering the number of sample plots for major broadleaf forests in China, 18 broadleaf tree species groups were classified, including stands dominated by Quercus spp., Betula spp., FJPh (Fraxinus mandshurica, Juglans mandshurica and Phellodendron amurense), Cinnamomum spp., Phoebe spp., Ulmus spp., Robinia spp., Schima spp., Liquidambar spp., or other hardwood stands, and Tilia spp., Populus spp., Salix spp., Paulownia spp., Eucalyptus spp., Acacia spp., Casuarina spp., or other softwood stands in Figure 1. A tree species was defined as “dominant” when its volume accounted for more than 65% of the total volume in the sample plot. Samples of minimum size for modeling within each group were treated individually, while smaller sample sizes were combined under “other.” The mixed stands were excluded from the development of the site productivity index model for major broadleaf stands.
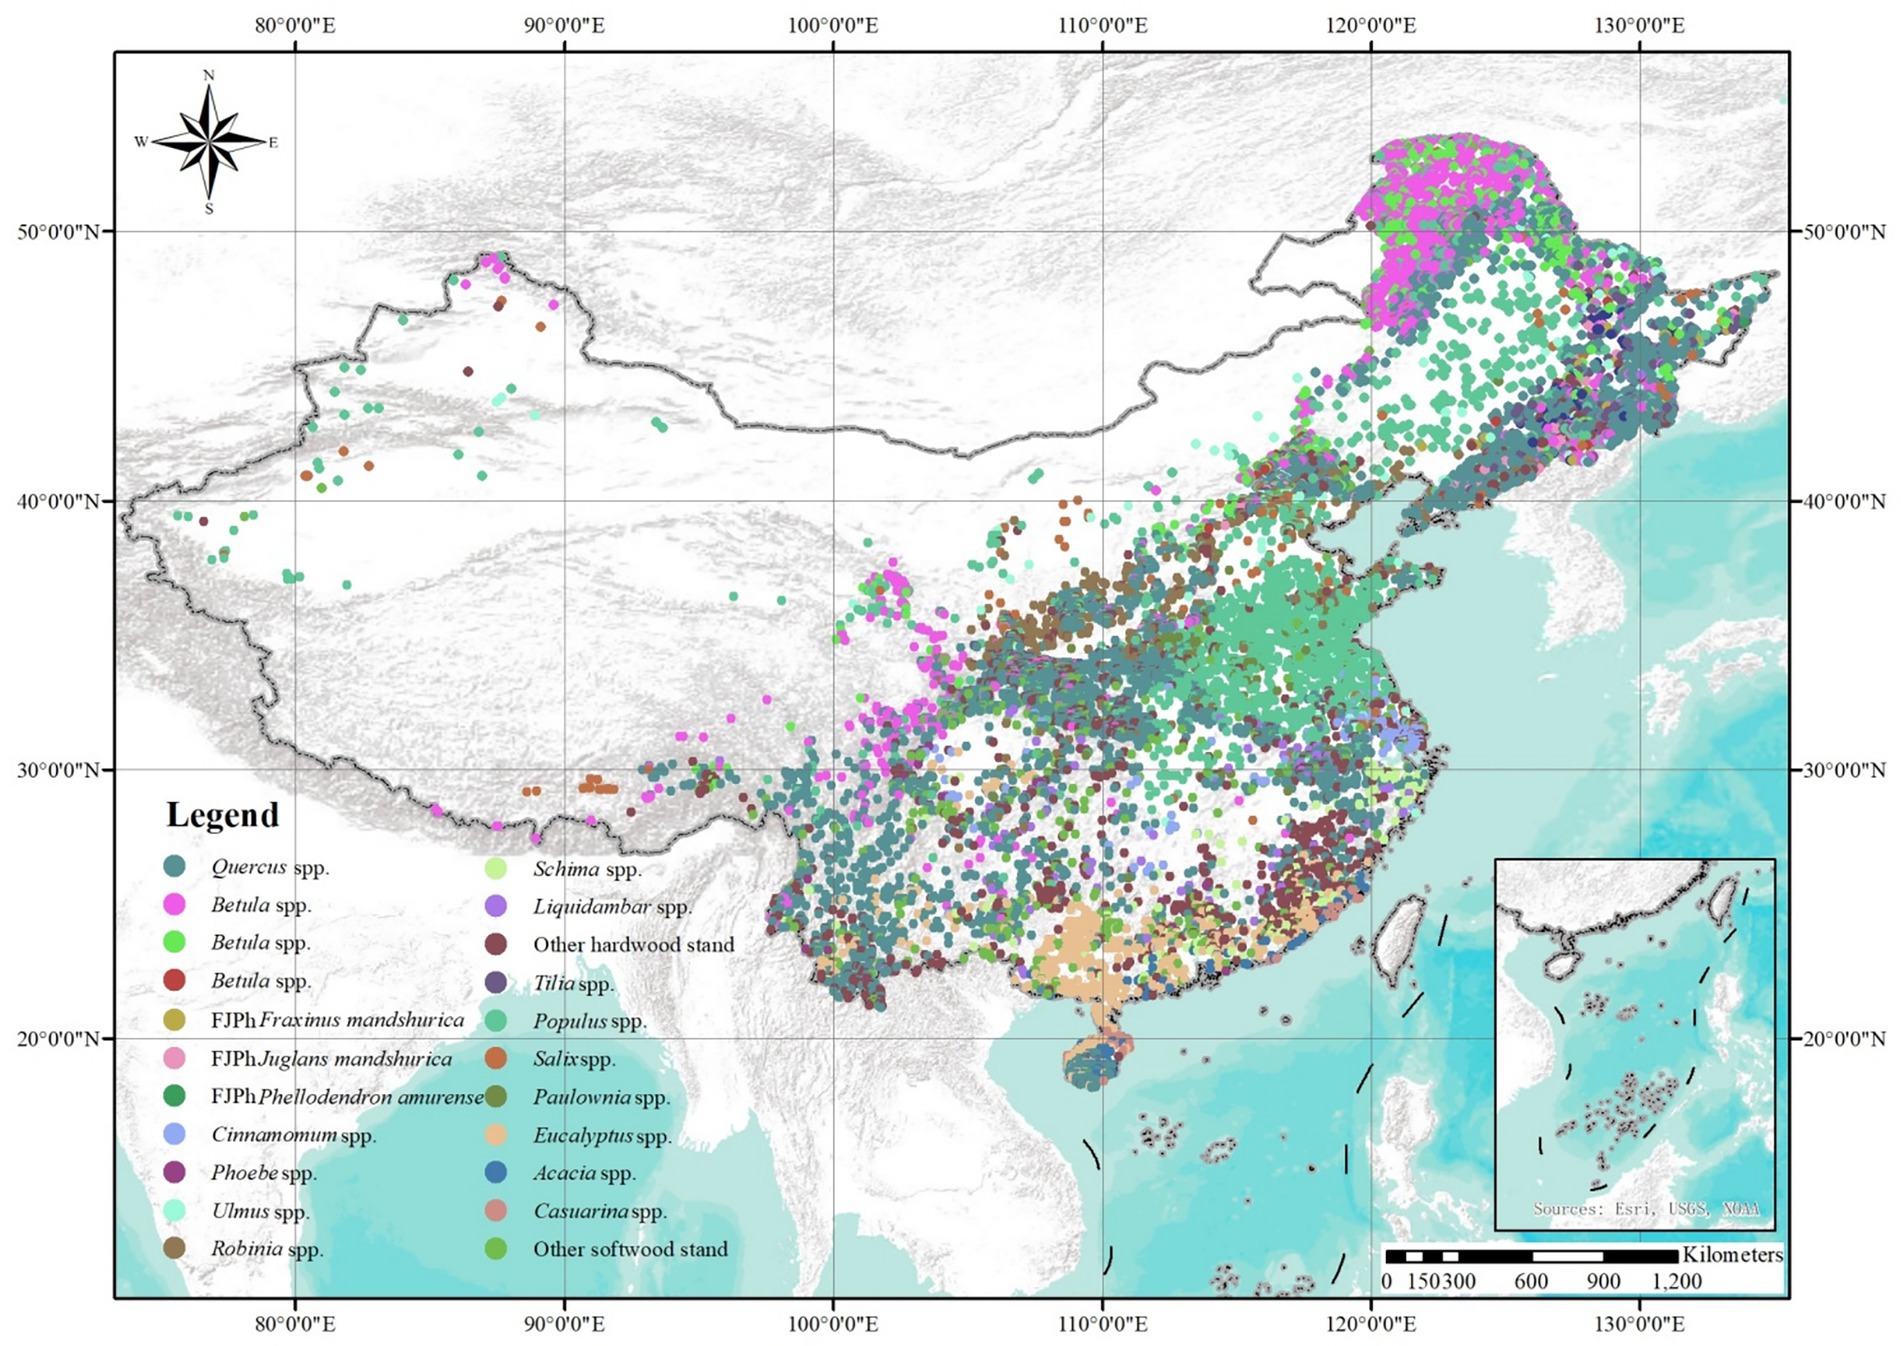
Figure 1. Distribution map of plots of major broadleaf species stands.
2.2 Descriptive statistics of estimated stand biomass
The NFI sample plots selected for modeling were required to be fully stocked (canopy cover = 1.0) and could not have been affected by management measures like harvesting, which would affect site productivity. However, in reality, few plots are fully stocked, and determining the standard density for each tree species group is challenging. Therefore, it is a commonly accepted approach to use a high canopy cover as a proxy for a fully stocked stand. Following established guidelines (Ji et al., 2012), we selected stands with a canopy cover of 0.7 or higher, which are considered to adequately represent the site’s productive potential. Sample plots with any harvesting measures were excluded. Tree biomass was calculated for the four periods using individual tree models developed in China for national carbon accounting (Zeng et al., 2024; Zeng, 2024). These provide diameter-based allometric equations for the above and belowground biomass of individual trees. Total biomass is obtained by summing up the individual tree biomasses. The models have been parameterized for the major species in China (Zeng et al., 2024). For stands with missing model parameters, the biomass expansion factor method is used to convert volume to biomass (Zeng et al., 2024). The parameters for this method are derived from the Technical Guidelines for National Forestry Carbon Sink Measurement and Monitoring, based on the biomass conversion factors for dominant tree species and species groups in the different regions. This allowed us to calculate the statistics of the sample data (Table 1). A total of 22,622 plots were used for the modeling, with the number of plots from the 6th, 7th, 8th, and 9th NFI being 4,790, 5,653, 5,793, and 6,386, respectively. The largest number of sample plots was for Quercus spp. stands, totaling 9,229 plots, while the smallest number was for Phoebe spp. stands, with only 55 plots. The average stand age ranged from 5 to 55 years, and the average forest biomass ranged from 33.8 t/ha to 132.3 t/ha.
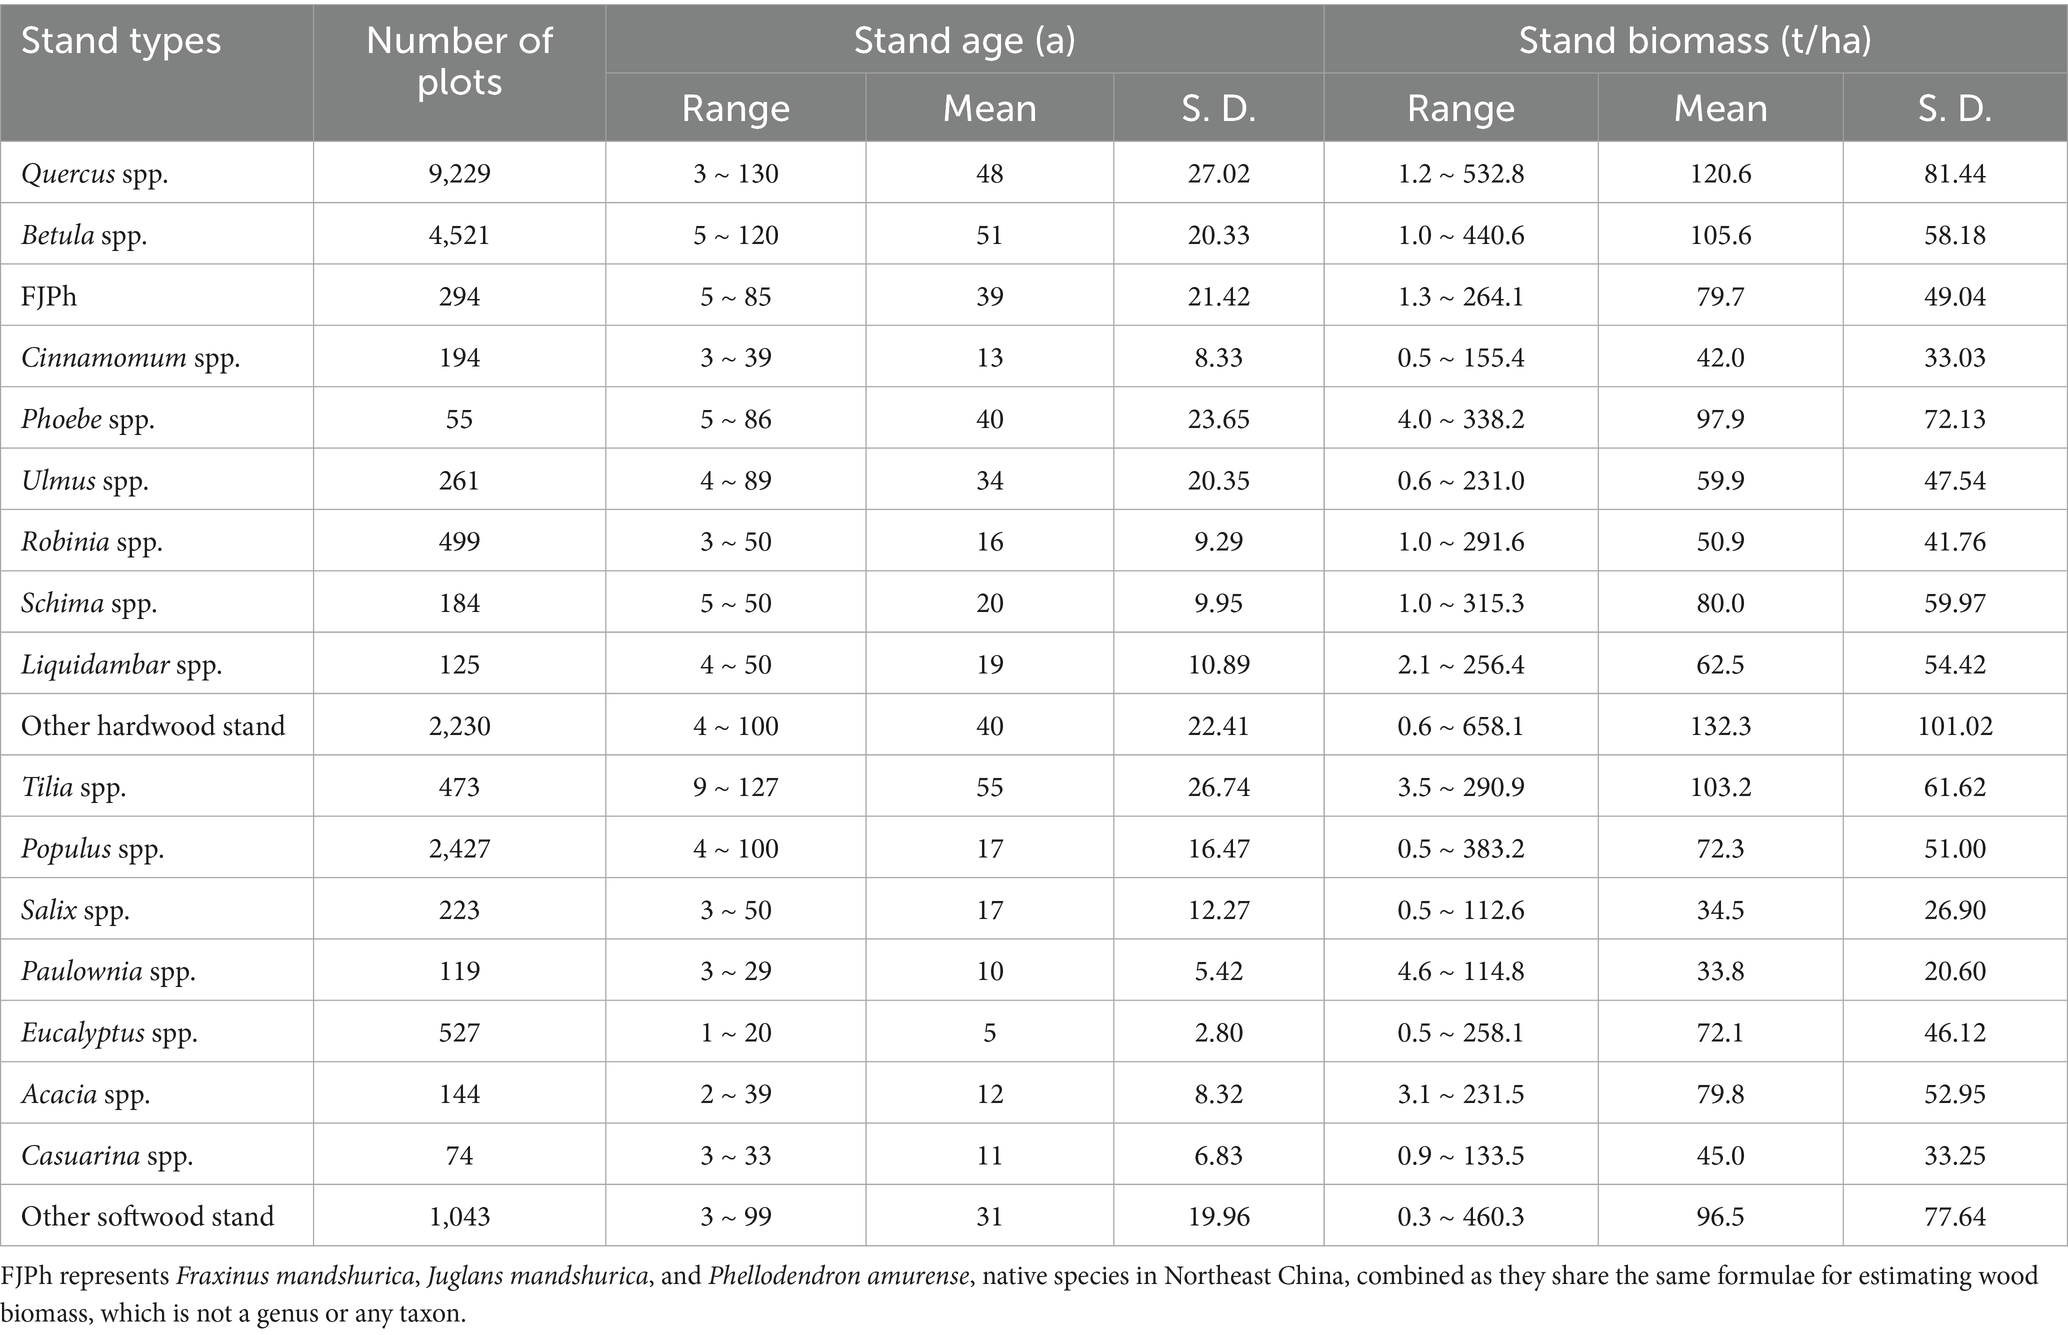
Table 1. Statistics for data used in the development of the site productivity index model.
3 Methods
3.1 Establishment of the site productivity index model
3.1.1 Fitting of guide curves
We compared three different models used for describing growth, termed here guide curves, for fitting the biomass-age dependence of the stands for each species separately. The selection of guide curve, representing the accumulation of stand biomass with age for moderate site quality, directly affects the accuracy of the site productivity index model. Therefore, the guide curve must not only adhere to the biological laws of stand productivity growth but also optimize the data fitting (Repola, 2009). A good guide curve should exhibit the form of an “S”-shaped growth equation with an upper asymptote, owing to the growth rate of stand biomass with stand age progressing from slow to rapid, then slowing down and eventually stopping. In this study, three growth models—Richards (Equation 1), Logistic (Equation 2), and Korf (Equation 3)—were used to fit the relationship of age and biomass (Wu et al., 2015). The choice of the guide curve model was based on the coefficient of determination (R2), standard error of estimate (SEE) and the curve’s shape.
where 𝐵T represents the total biomass of the stand (t/ha); 𝐴 represents the age of the stand (a); and 𝑎, 𝑏, and 𝑐 are parameters to be estimated.
We use the chosen guide curve to estimate the mean biomass-age relationship per species, using the data illustrated in Table 1. We then normalize this curve with respect to a reference age, , as follows:
Thus, .
3.1.2 Determination of reference age
The reference age (AR) significantly influences the compilation of the productivity index model (Equation 4). The reference age is the age at which stand biomass growth tends to stabilize and can sensitively reflect site quality differences. In this study, a large number of historical plot survey data was analyzed to assess the growth trajectory of stand biomass. Simultaneously, the coefficient of variation (CV) of forest biomass and stand productivity was calculated across different age classes (Equation 5). The reference age was determined based on the principle that the CV of stand productivity growth stabilizes while being sensitive enough to reflect site quality.
where CV represents the coefficient of variation of stand biomass; 𝐴 represents the average age of the stand; and 𝑎, and 𝑏 are parameters to be estimated.
3.1.3 Compilation of the productivity index table
We utilized forest stand biomass growth curves and biomass standard deviation curves. Based on the principle of ±3 times the standard deviation (Li, 2019), we determine the upper and lower limit curves for site productivity classes. Using the area enclosed by these curves and setting five index classes, we applied a relative coefficient method to define the upper and lower limits of each index level. The relative coefficient method is an approach that shifts the guide curve by a certain proportion. This formed a cluster of site productivity index curves, from which we compiled a site productivity index table for major broad-leaved forest stands.
In the relative coefficient method, the age-biomass growth curve is shifted proportionally. After determining a guide curve model, the stand age is substituted into the model to obtain the theoretical stand biomass, and the reference age is used to determine the theoretical stand biomass value. Based on the normalized guide curve, we can now define the respective curves for all site productivity curve clusters j as
where is the biomass of site index class j at the reference age (Equation 6).
3.1.4 Generalized productivity index model
Due to the natural productivity differences among stands of different tree species, a unified reference species needs to be established as the reference species for theoretical site productivity to eliminate the effect of species on site quality evaluation at a certain normalized age of 50. This enables the evaluation of large-scale site quality variation on a consistent baseline. In this study, a generalized broadleaf species site productivity index model was developed, achieved through conversion coefficients between different species (Equation 7).
where represents the general biomass of each index class of the stand; represents the general stand age of each index class; represents the general reference age; fS represents the conversion coefficient of stand species S; is the biomass of the guide curve for the species S at the reference age; and are the solved parameters of general guide curve.
3.2 Model statistical testing
3.2.1 Scatter testing
Scatter plots of stand average age and forest biomass data were drawn and overlaid onto the site productivity curve cluster. The probability that the scatter points fall inside the area enclosed by the curves represents the explanatory power of the site productivity table regarding forest biomass growth. The probability greater than 90% is generally considered sufficient for the established site productivity model to meet practical use requirements (Li, 2019). If the result is below this threshold, adjustments on the models should be made.
3.2.2 Applicability testing
Applicability testing for the newly established site productivity table was conducted using continuous survey and monitoring data. Based on the stand’s average age and biomass, the site productivity index table was used to determine the site’s productivity class. The productivity class of each site was then compared to examine whether the site fluctuated between classes in different NFIs periods, and the percentage of such fluctuated sites out of the total number of sites was calculated. A fluctuation percentage below 5% was considered acceptable (Li, 2019), indicating that the new productivity table meets the requirements for practical assessments.
3.3 Analysis of site quality variation
3.3.1 Conversion coefficient
Before conducting spatial analysis, it is essential to ensure that the site productivity indices of all stands are at the same reference level. This requires constructing a model for the reference conversion coefficients of different tree species. Conversion coefficient model (Equation 8) enables the conversion between a generalized broadleaf stand site productivity index model and a group-specific stand site productivity index model to eliminate biological differences in annual production per unit area among different tree species groups.
where fS represents the conversion coefficient of stand species S; is the biomass of the guide curve for the species S at the reference age; is the biomass of the guide curve for the generalized broadleaf tree species (without subdividing stand types) at the reference age.
3.3.2 Spatial interpolation
Spatial interpolation was carried out to produce a smoother density raster for site quality change of broadleaf stands. This was done, using a Kriging interpolation function (Equation 9), by calculating a magnitude per unit area from plot site productivity index to fit a smoothly tapered surface to each field. The weights λi were derived from the variogram or covariance function, ensuring that the prediction is unbiased and the variance of the prediction error is minimized.
where represents the predicted value at the target location x; represents the observed value at the i-th observation; represents the weight assigned to the i-th observation, determined based on the spatial correlation structure (variogram); n represents the total number of observed data points used in the interpolation.
4 Results
4.1 Fitting results of the site productivity guide curve
The fitted site productivity guide curves using the Richards model showed a high average R2 = 0.91 and mean SEE = 12.88 t/ha for all analyzed species-specific stands (Table 2). The Logistic model presented an average R2 = 0.90 with mean SEE = 12.98 t/ha, and the Korf model average R2 = 0.89 and mean SEE 13.53 t/ha. Although the Richards model generally demonstrated broader applicability across species, it showed discrepancies in Robinia spp. dominant species stand, where the upper asymptote parameter (a = 896.3306) exceeded three times the maximum observed value in the plot. This deviated from the biological characteristics reflected by the Richards model. Similar examples include: the Logistic model produced unrealistic parameter values for the upper asymptote (a = 355156.0590) in Cinnamomum spp. stands, as well as the Korf model did for Robinia spp. stands (a = 84716.4938).
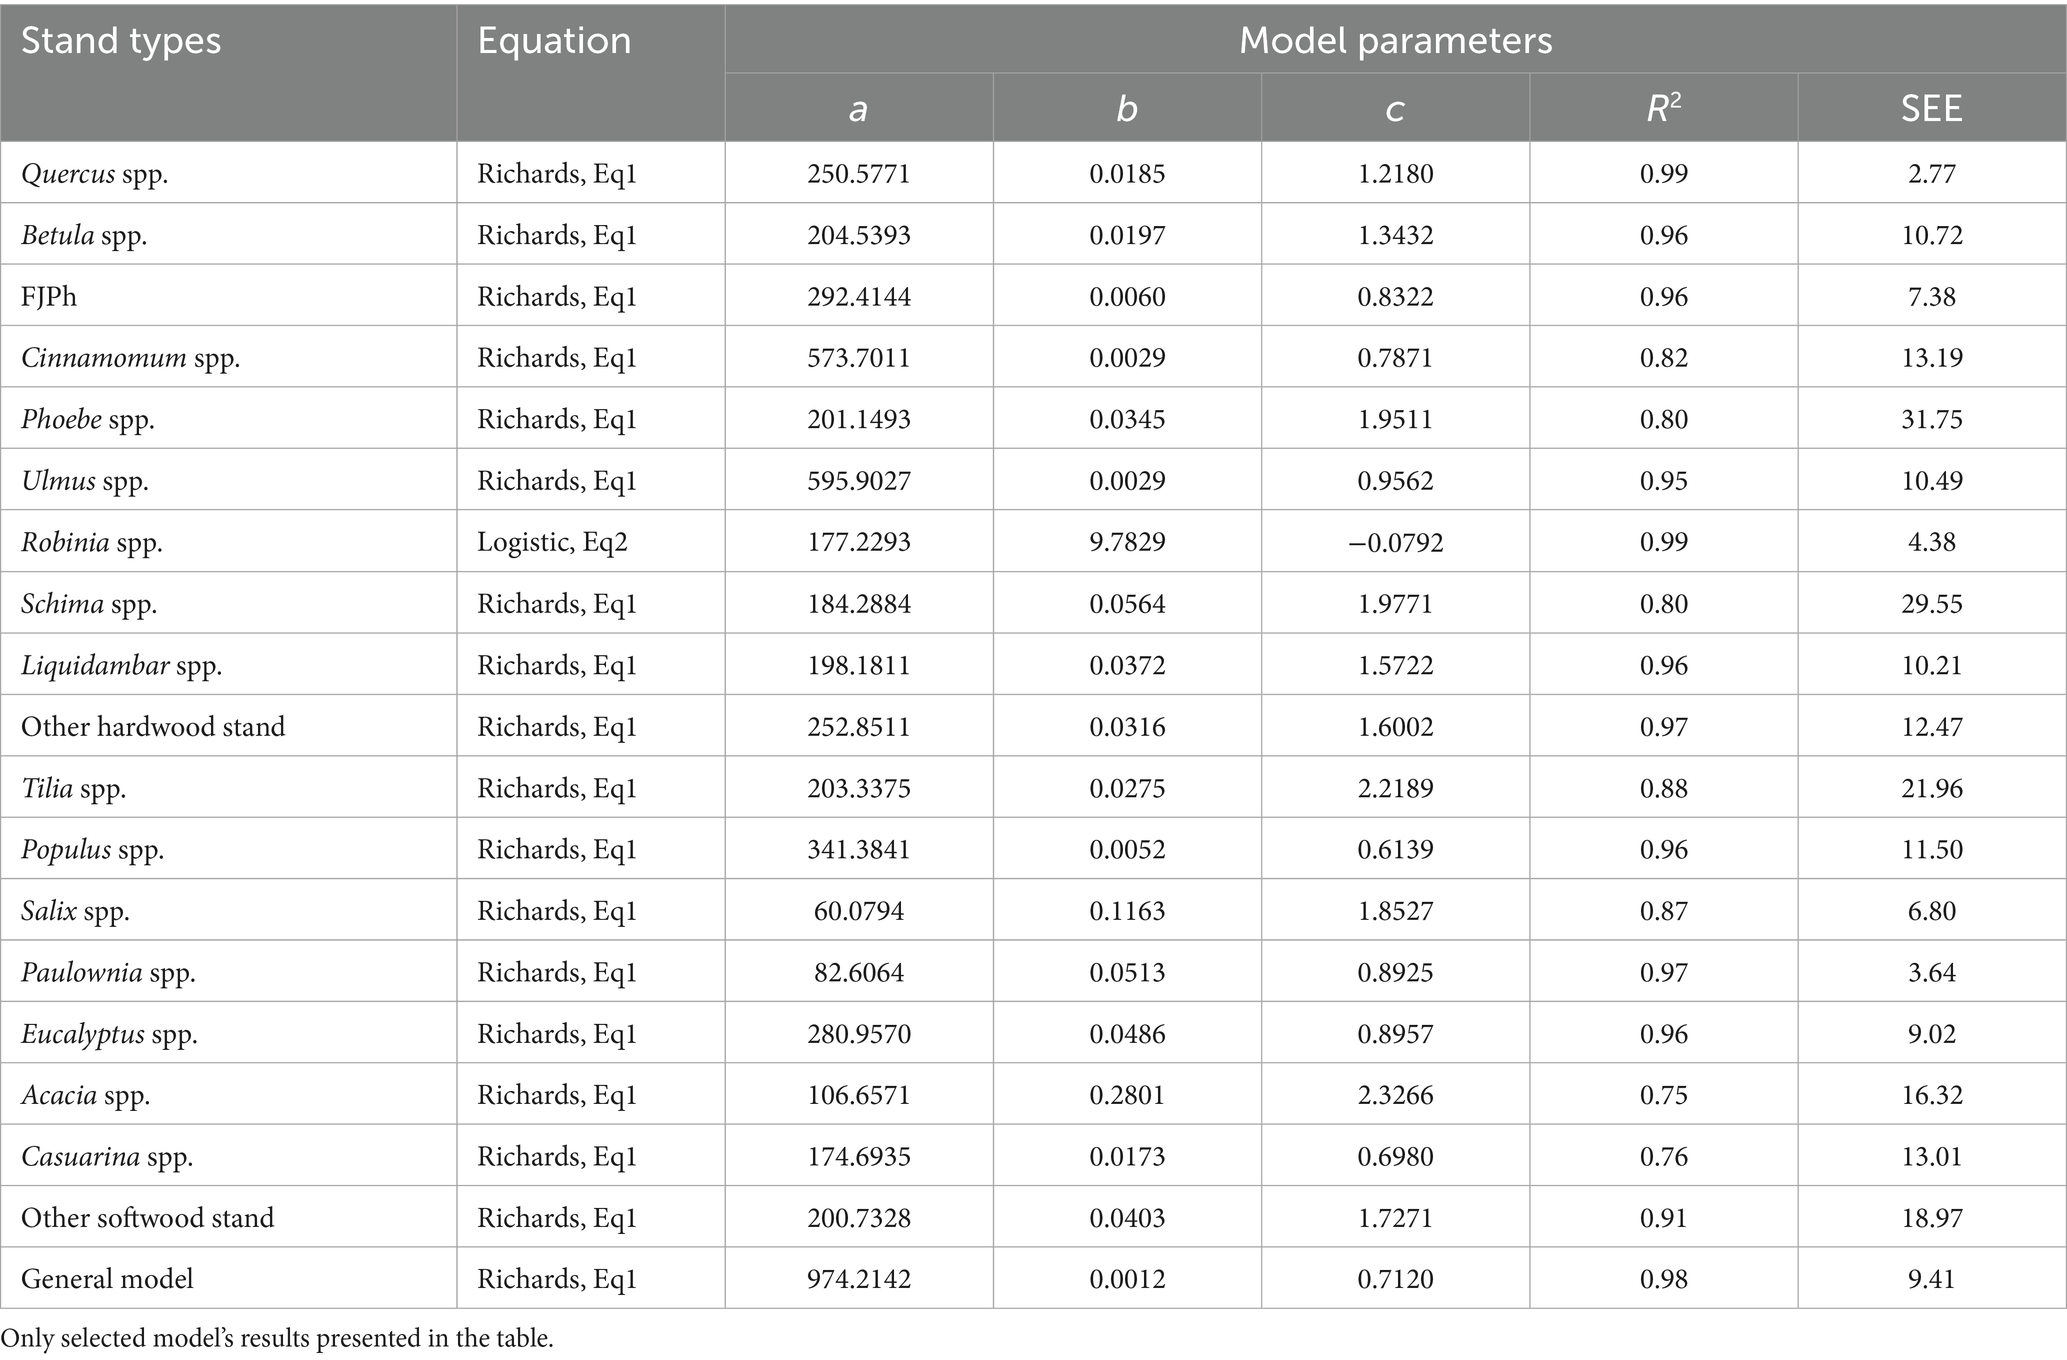
Table 2. Fitting results of the guide curve for the stand productivity index model.
When selecting a guide curve, it is crucial not only to consider the model’s fit, such as the coefficient of determination (R2) and the range of parameters, but also to ensure that the guide curve maintains a biologically reasonable shape, particularly during the early and late stages of stand development. In large-scale regional survey data, the number of sample plots across different age classes tends to follow a normal distribution. This results in fewer data points for both young and over mature stands, making it difficult to comprehensively reflect the growth of forest vegetation biomass at these stages. The standard deviations for broadleaf species are smaller in stands with a large amount of data (Figure 2). Broadleaf stands with smaller sample plot data, such as Phoebe spp., Ulmus spp., Liquidambar spp., Paulownia spp., Acacia spp., and Casuarina spp., exhibit uncertainty in the fitting results, especially during the young or mature stand stages. For species such as Salix spp., Paulownia spp., Eucalyptus spp., Acacia spp., and Casuarina spp., modeling data do not extend beyond 50 years.
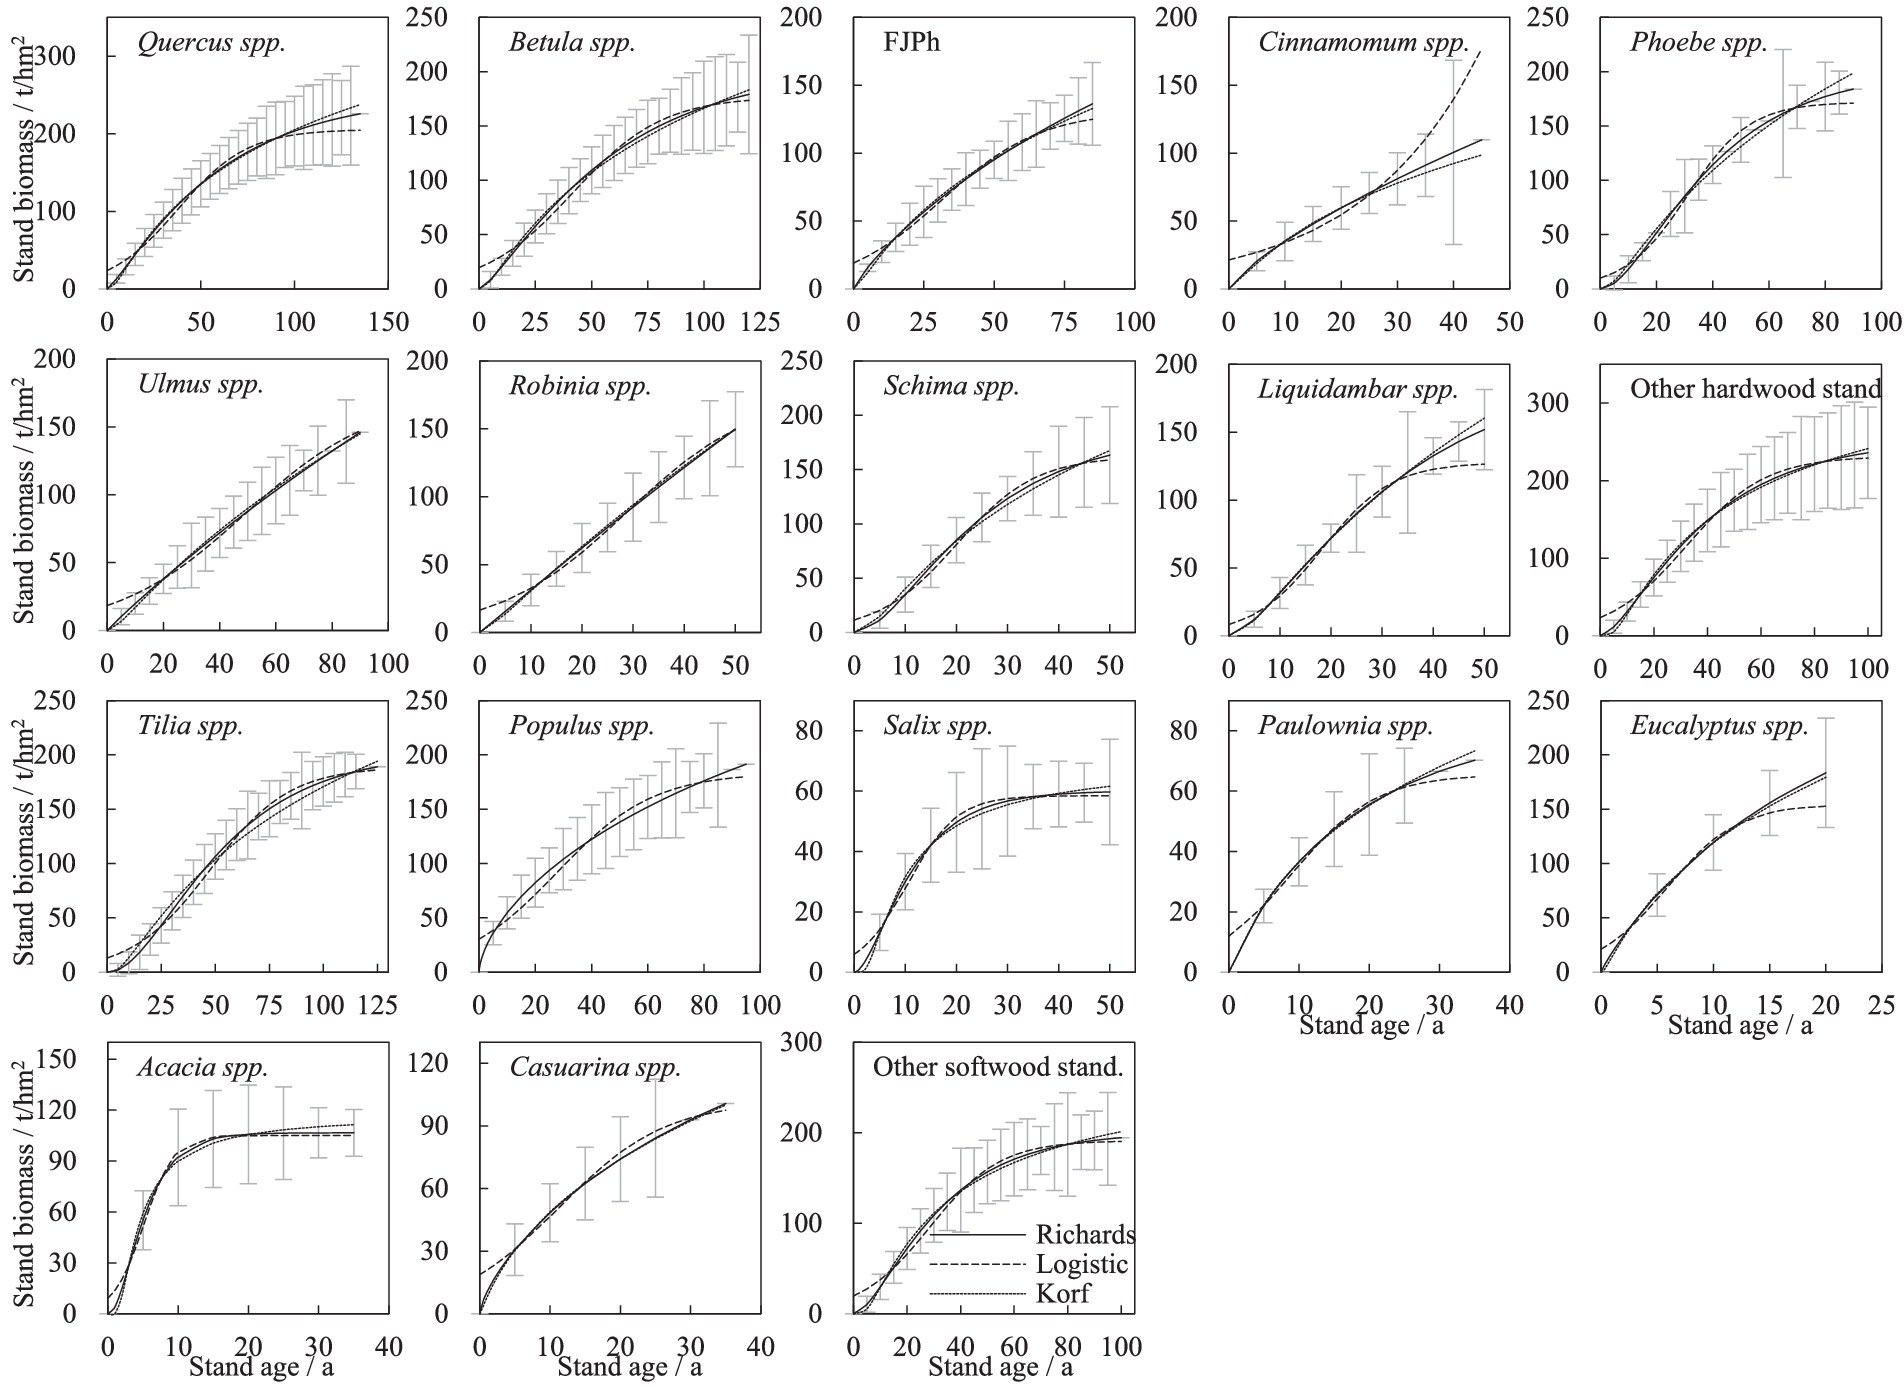
Figure 2. Guide curves of age and stand biomass for the analyzed stands.
4.2 Results of the site productivity index model and validation
4.2.1 Model construction factors
The reference age of analyzed stands ranged from 5 to 60 years. For some fast-growing species in tropical and subtropical regions, such as Eucalyptus spp., Acacia spp., and Casuarina spp., the reference age was from 5 to 10 years. The reference age of hardwood species was generally higher than that of softwood species (Table 3). The conversion coefficient reflects the growth rate differences between target species stand and generalized broadleaf stand, thereby enabling site quality evaluation on a large scale based on a consistent reference.
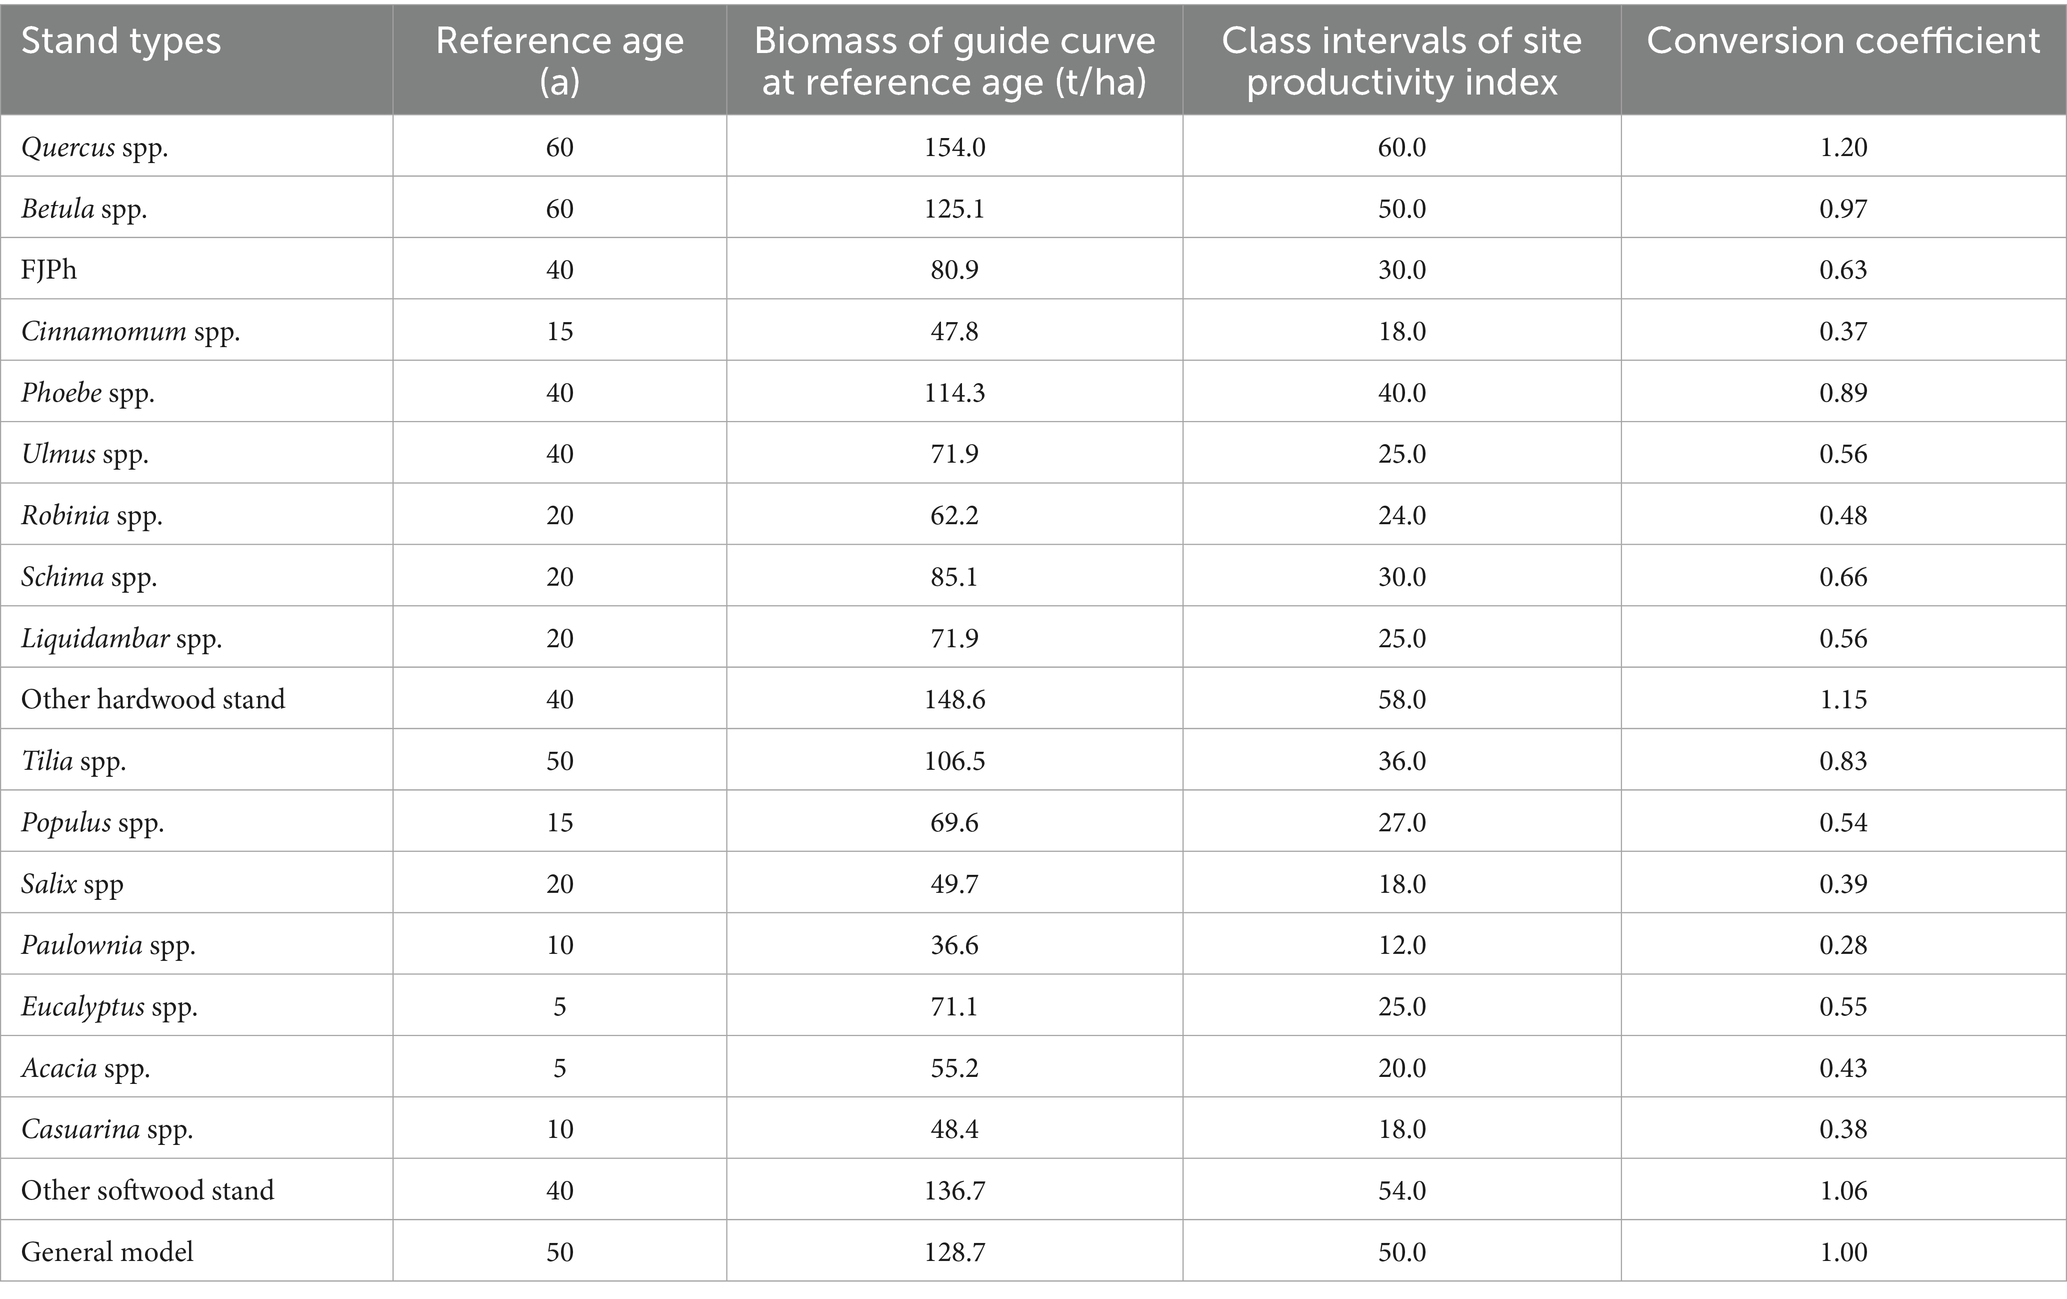
Table 3. Reference age and conversion coefficient for the site productivity index model.
4.2.2 Results of statistical testing
The scatter testing results of the site productivity index model, based on the family of curves of different site quality for major broadleaf stands, indicate high reliability across different species (Figure 3). The percentage of scatter testing for Betula spp. stand shows the highest value, 96.53%, while the lowest value, 90.03%, is observed in the other softwood stand. All scatter testing percentages exceeded 90%, indicating that the established models are suitable for practical use in forest management. Additionally, the figure reveals another phenomenon that the larger the sample size, the higher the percentage value of scatter testing.
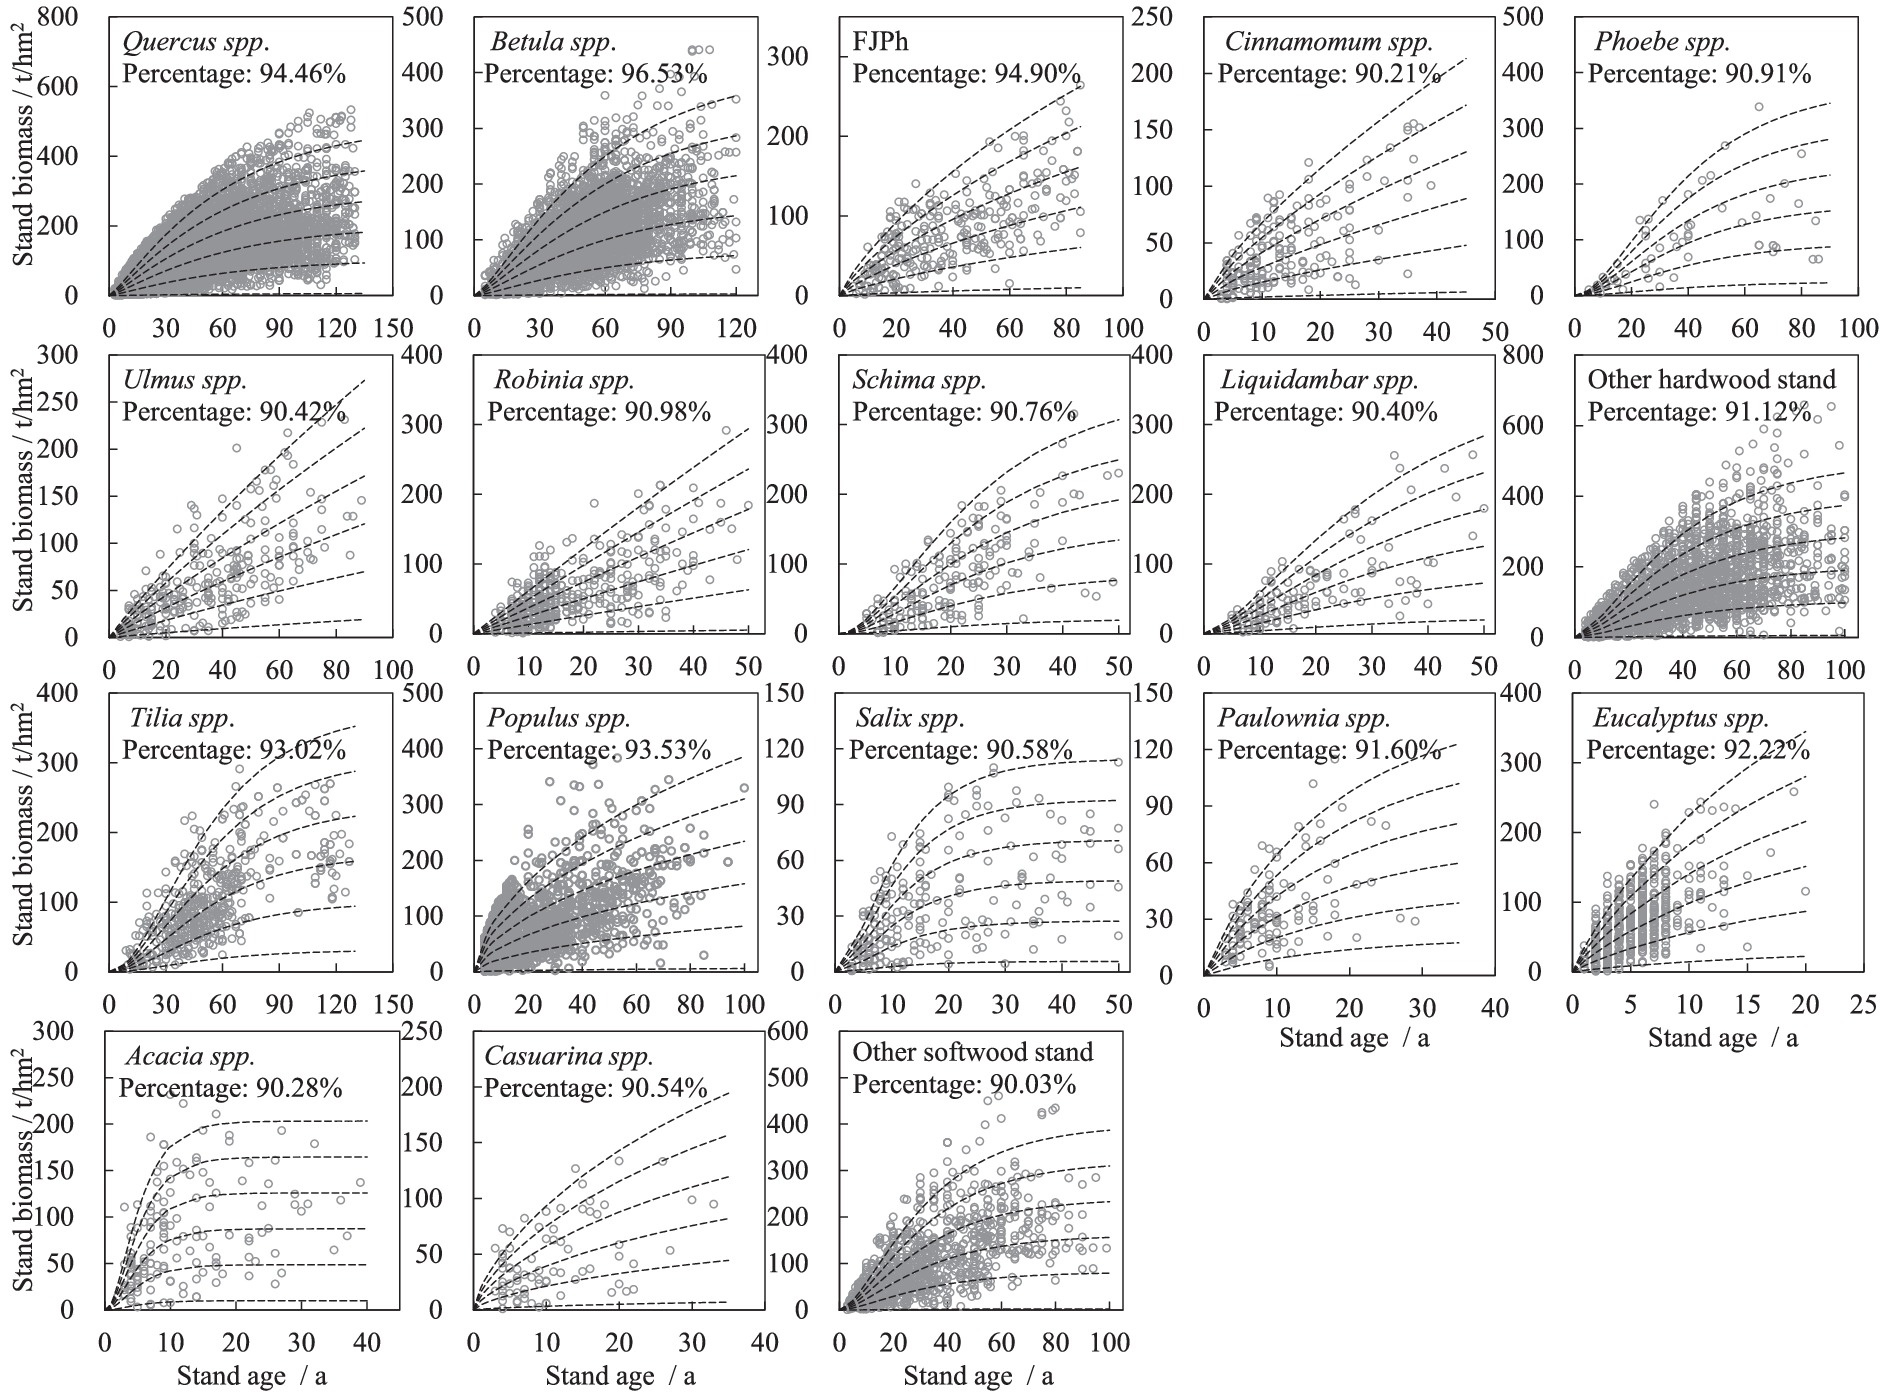
Figure 3. Curves of the site productivity index model for major broadleaf stands. The six curves for each stand type delineate the boundaries of the five site productivity classes, from Class I (top curve, highest productivity) to Class V (bottom curve, lowest productivity). The scatter points represent the observed plot data from the NFI.
4.2.3 Generalized productivity index table
The rank-based Spearman correlation coefficient between the site productivity index classes of the species specific productivity index model and the converted generalized productivity index model classes is greater than 0.99. While a high correlation was expected when dealing with a small number of ranked classes, this result, combined with the finding that only 1.41% of the 22,622 plots (318 plots) shifted class after conversion, with most of these shifts occurring in young stands with uncertainty, demonstrates the consistency and feasibility of establishing a generalized broadleaf stand productivity index model. Based on these results, a site productivity index for generalized broadleaf stands was constructed (Table 4). At the reference age of 50 years, the median biomass of classes I, II, III, IV, and V are 228.7 t/ha, 178.7 t/ha, 128.7 t/ha, 78.7 t/ha, and 28.7 t/ha, respectively. The table covers stand biomasses from 0.7–10.5 t/ha (reached in the poorest site quality class at age 5) to 388.9–484.3 t/ha (reached in the most productive site quality class at age 130). These values represent generalized average levels.
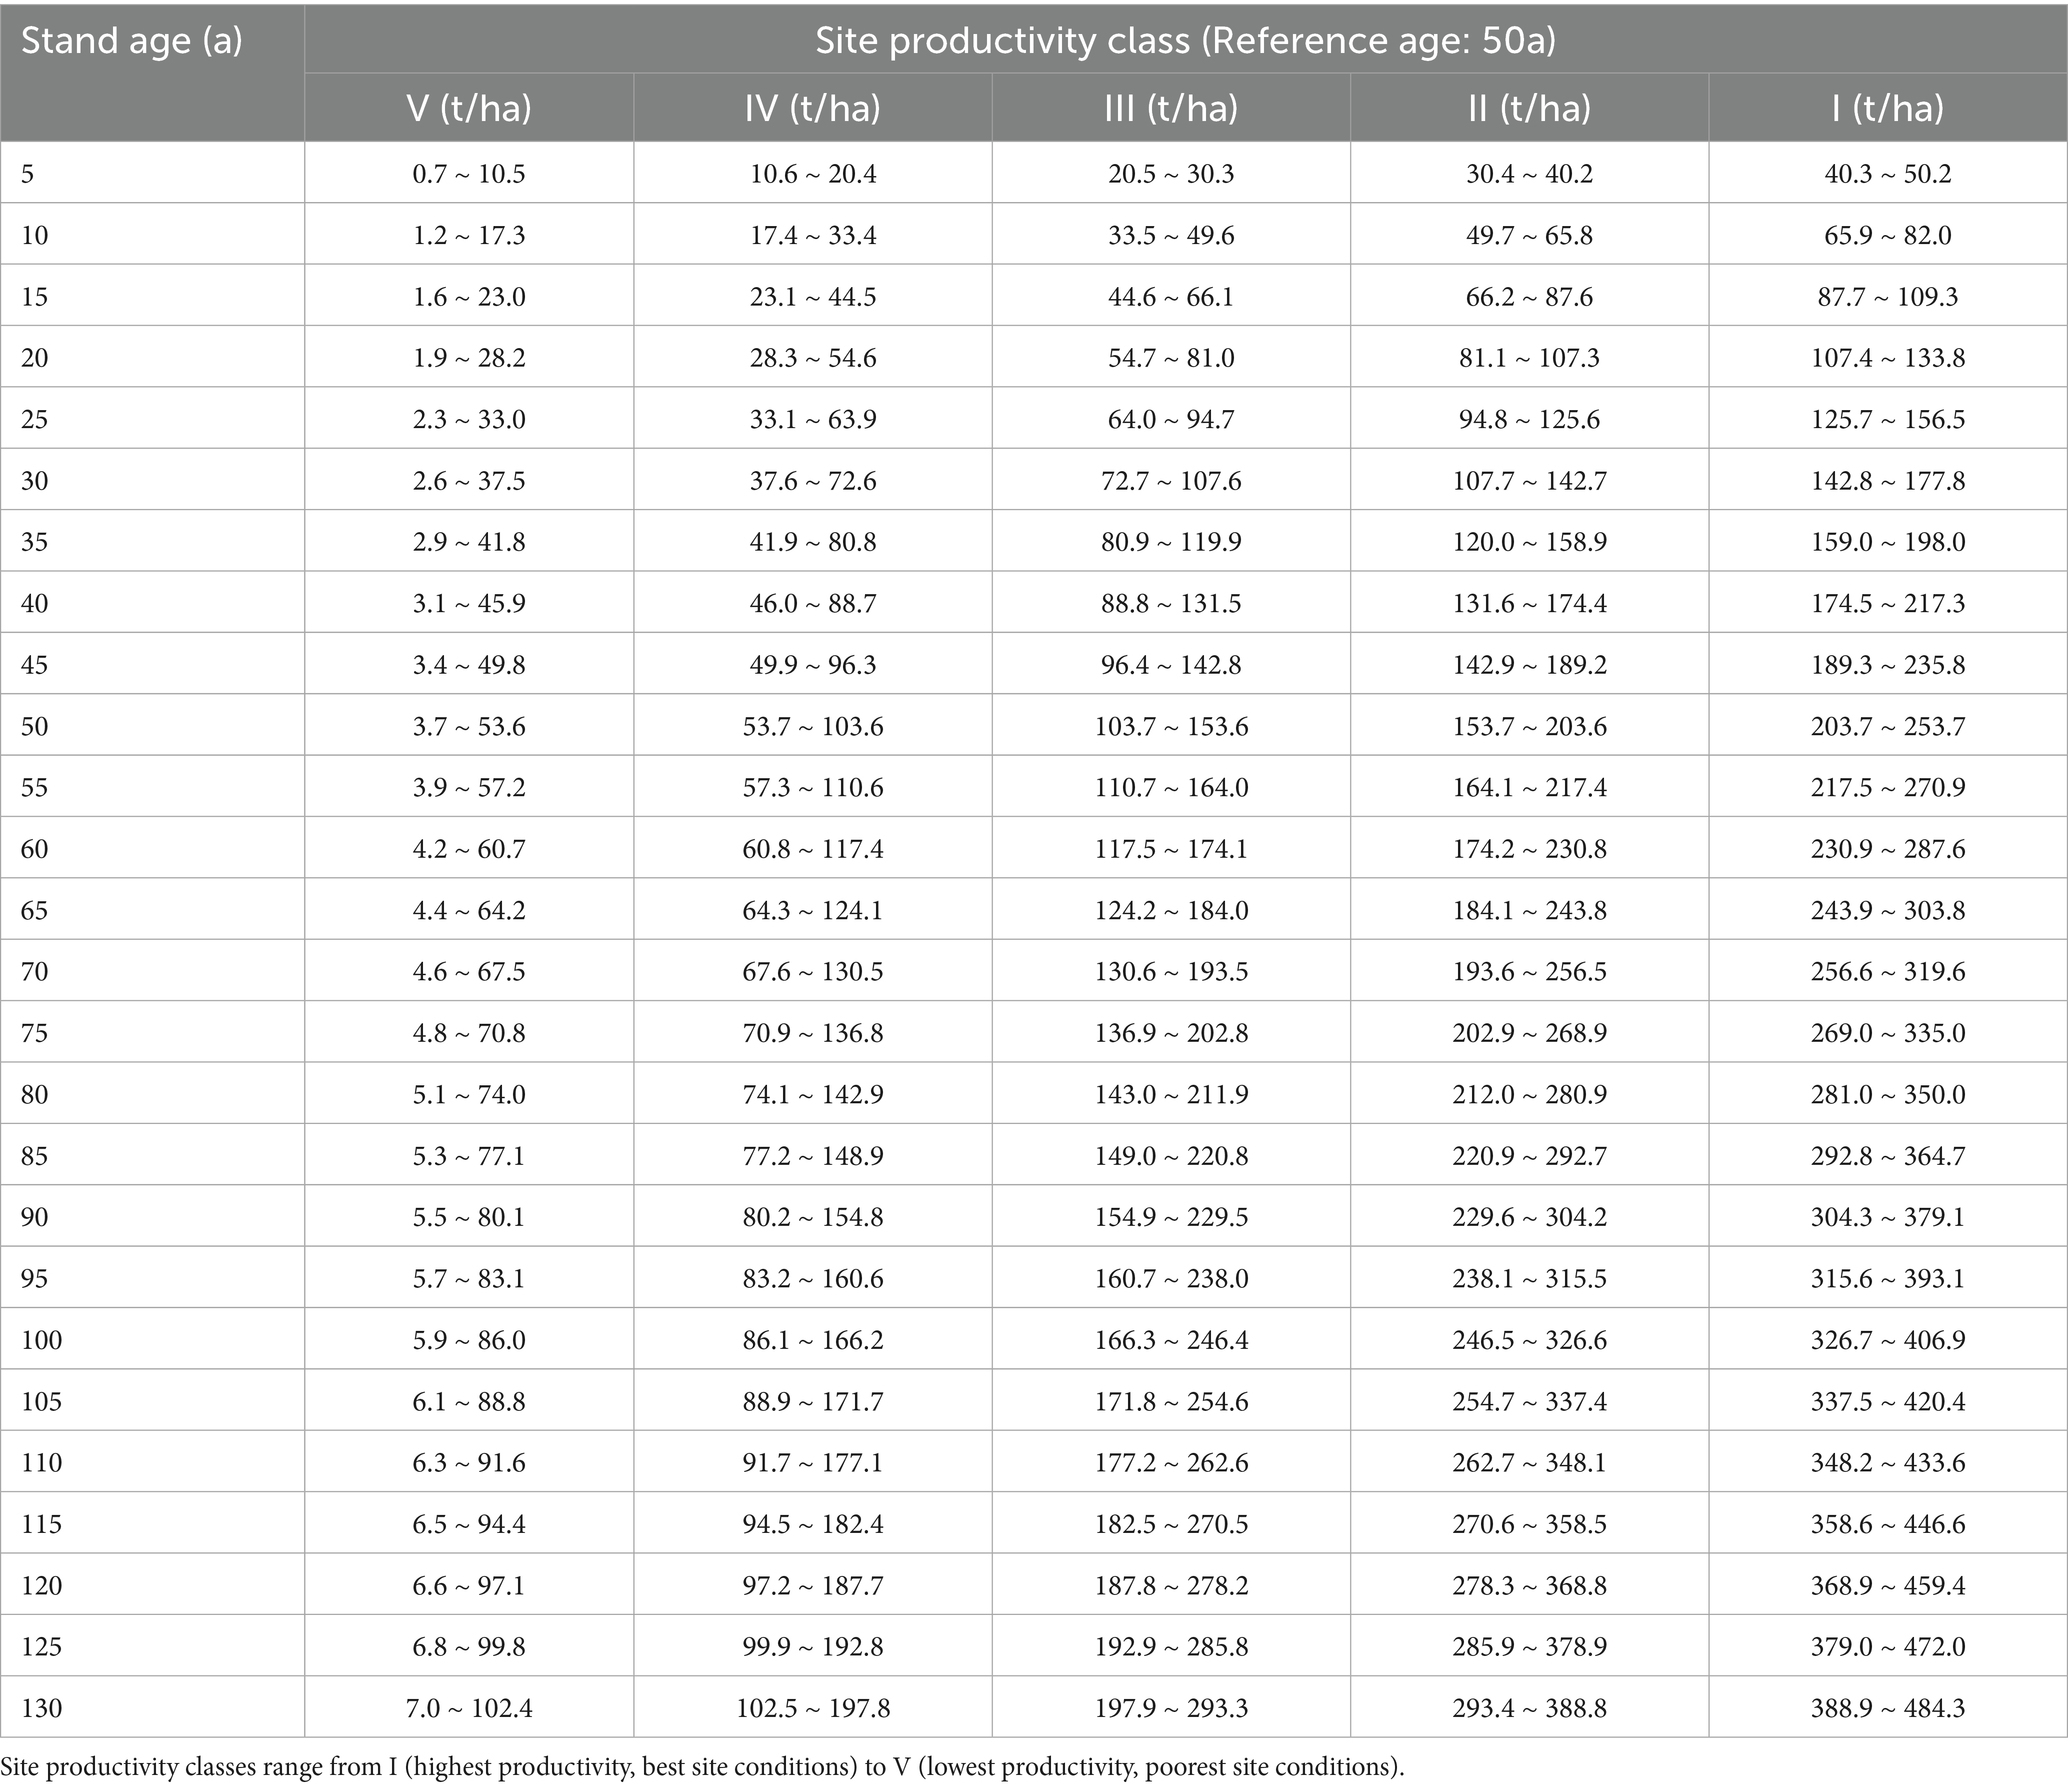
Table 4. Generalized broadleaf stand site productivity class table.
4.3 Analysis of the dynamic changes in site productivity
The dynamic analysis of the site productivity class distribution of analyzed stands reveals improvement trends from 2003 to 2018 (Figure 4), although there was a slight fluctuation in site quality degradation for major broadleaf stands from 2003 to 2008. In 2003, the average proportion of site productivity classes, with every species-specific model and generalized broadleaf model, for the broadleaf stands was as follows: Class I (13.20%), Class II (17.37%), Class III (29.58%), Class IV (28.20%), and Class V (11.64%). By 2008, these proportions shifted to Class I (12.11%), Class II (16.88%), Class III (28.84%), Class IV (29.36%), and Class V (12.81%). In 2013, the respective proportions were Class I (14.75%), Class II (17.95%), Class III (29.38%), Class IV (27.51%), and Class V (10.41%). Finally, in 2018, the proportions for the broadleaf stand were Class I (17.20%), Class II (18.15%), Class III (29.49%), Class IV (25.85%), and Class V (9.31%). During the four consecutive forest resources inventory periods, the combined average for Class I and II increased by 4.78 percentage points, while Class III showed a slight decrease of 0.09 percentage points. In contrast, Class IV and V decreased by a total of 4.69 percentage points. This indicates an overall improvement in the site productivity of broadleaf stands in China over the past over 20 years, with a shift toward higher productivity. This reflects successful forest management practices aimed at enhancing site productivity, especially for species that were more frequently monitored and had sufficient data for comparison.
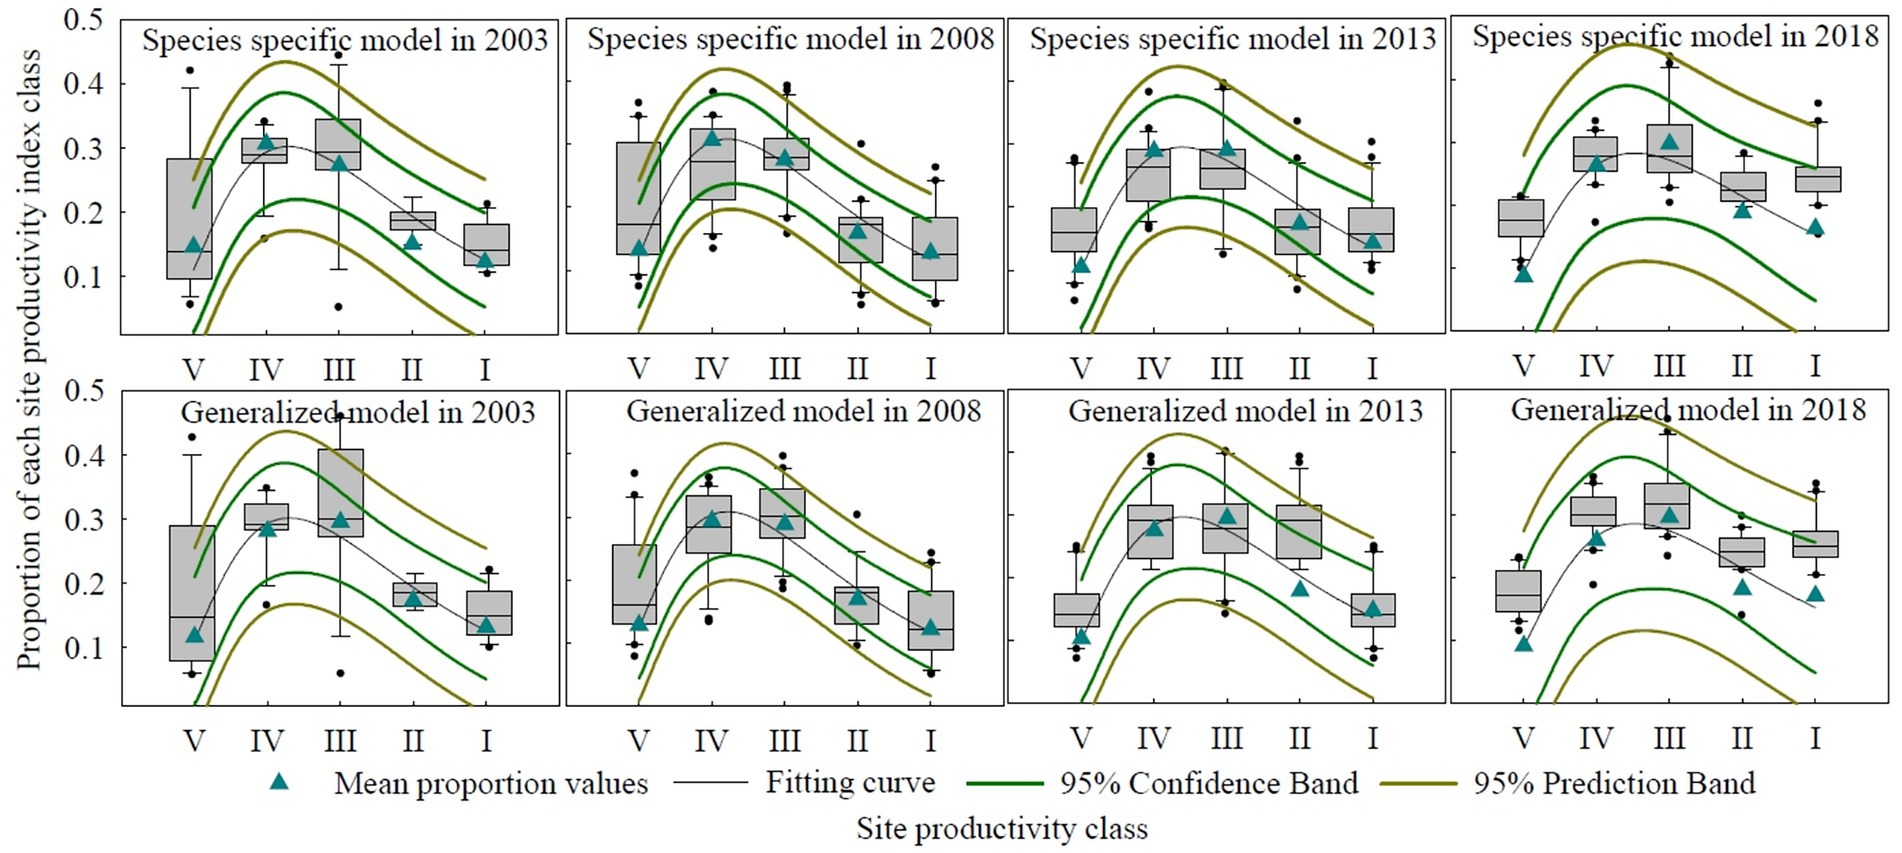
Figure 4. Curves of the site productivity index model for major broadleaf stands.
From 2003 to 2018, the site productivity of broadleaf stands shows a trend of continuous improvement and enhancement, with the productivity index expanding by various intervals (Figure 5). Although some arid and semi-arid regions, such as the Tianshan Mountains in Xinjiang, also shows slight increases in productivity index, most areas of site quality improvement were concentrated in regions with 400 mm or more of rainfall. The overall productivity levels of broadleaf stands in tropical and subtropical regions are not uniformly higher than those in temperate regions like the Greater Khingan Mountains, Changbai Mountains, Yin Mountains, and the Qinling Mountains. Additionally, in Yunnan, Guizhou, Sichuan, and Guangxi Province, the site productivity index for broad-leaved forest stands showed a slight downward trend between different intervals, following a pattern similar to the previous proportional statistical analysis results.
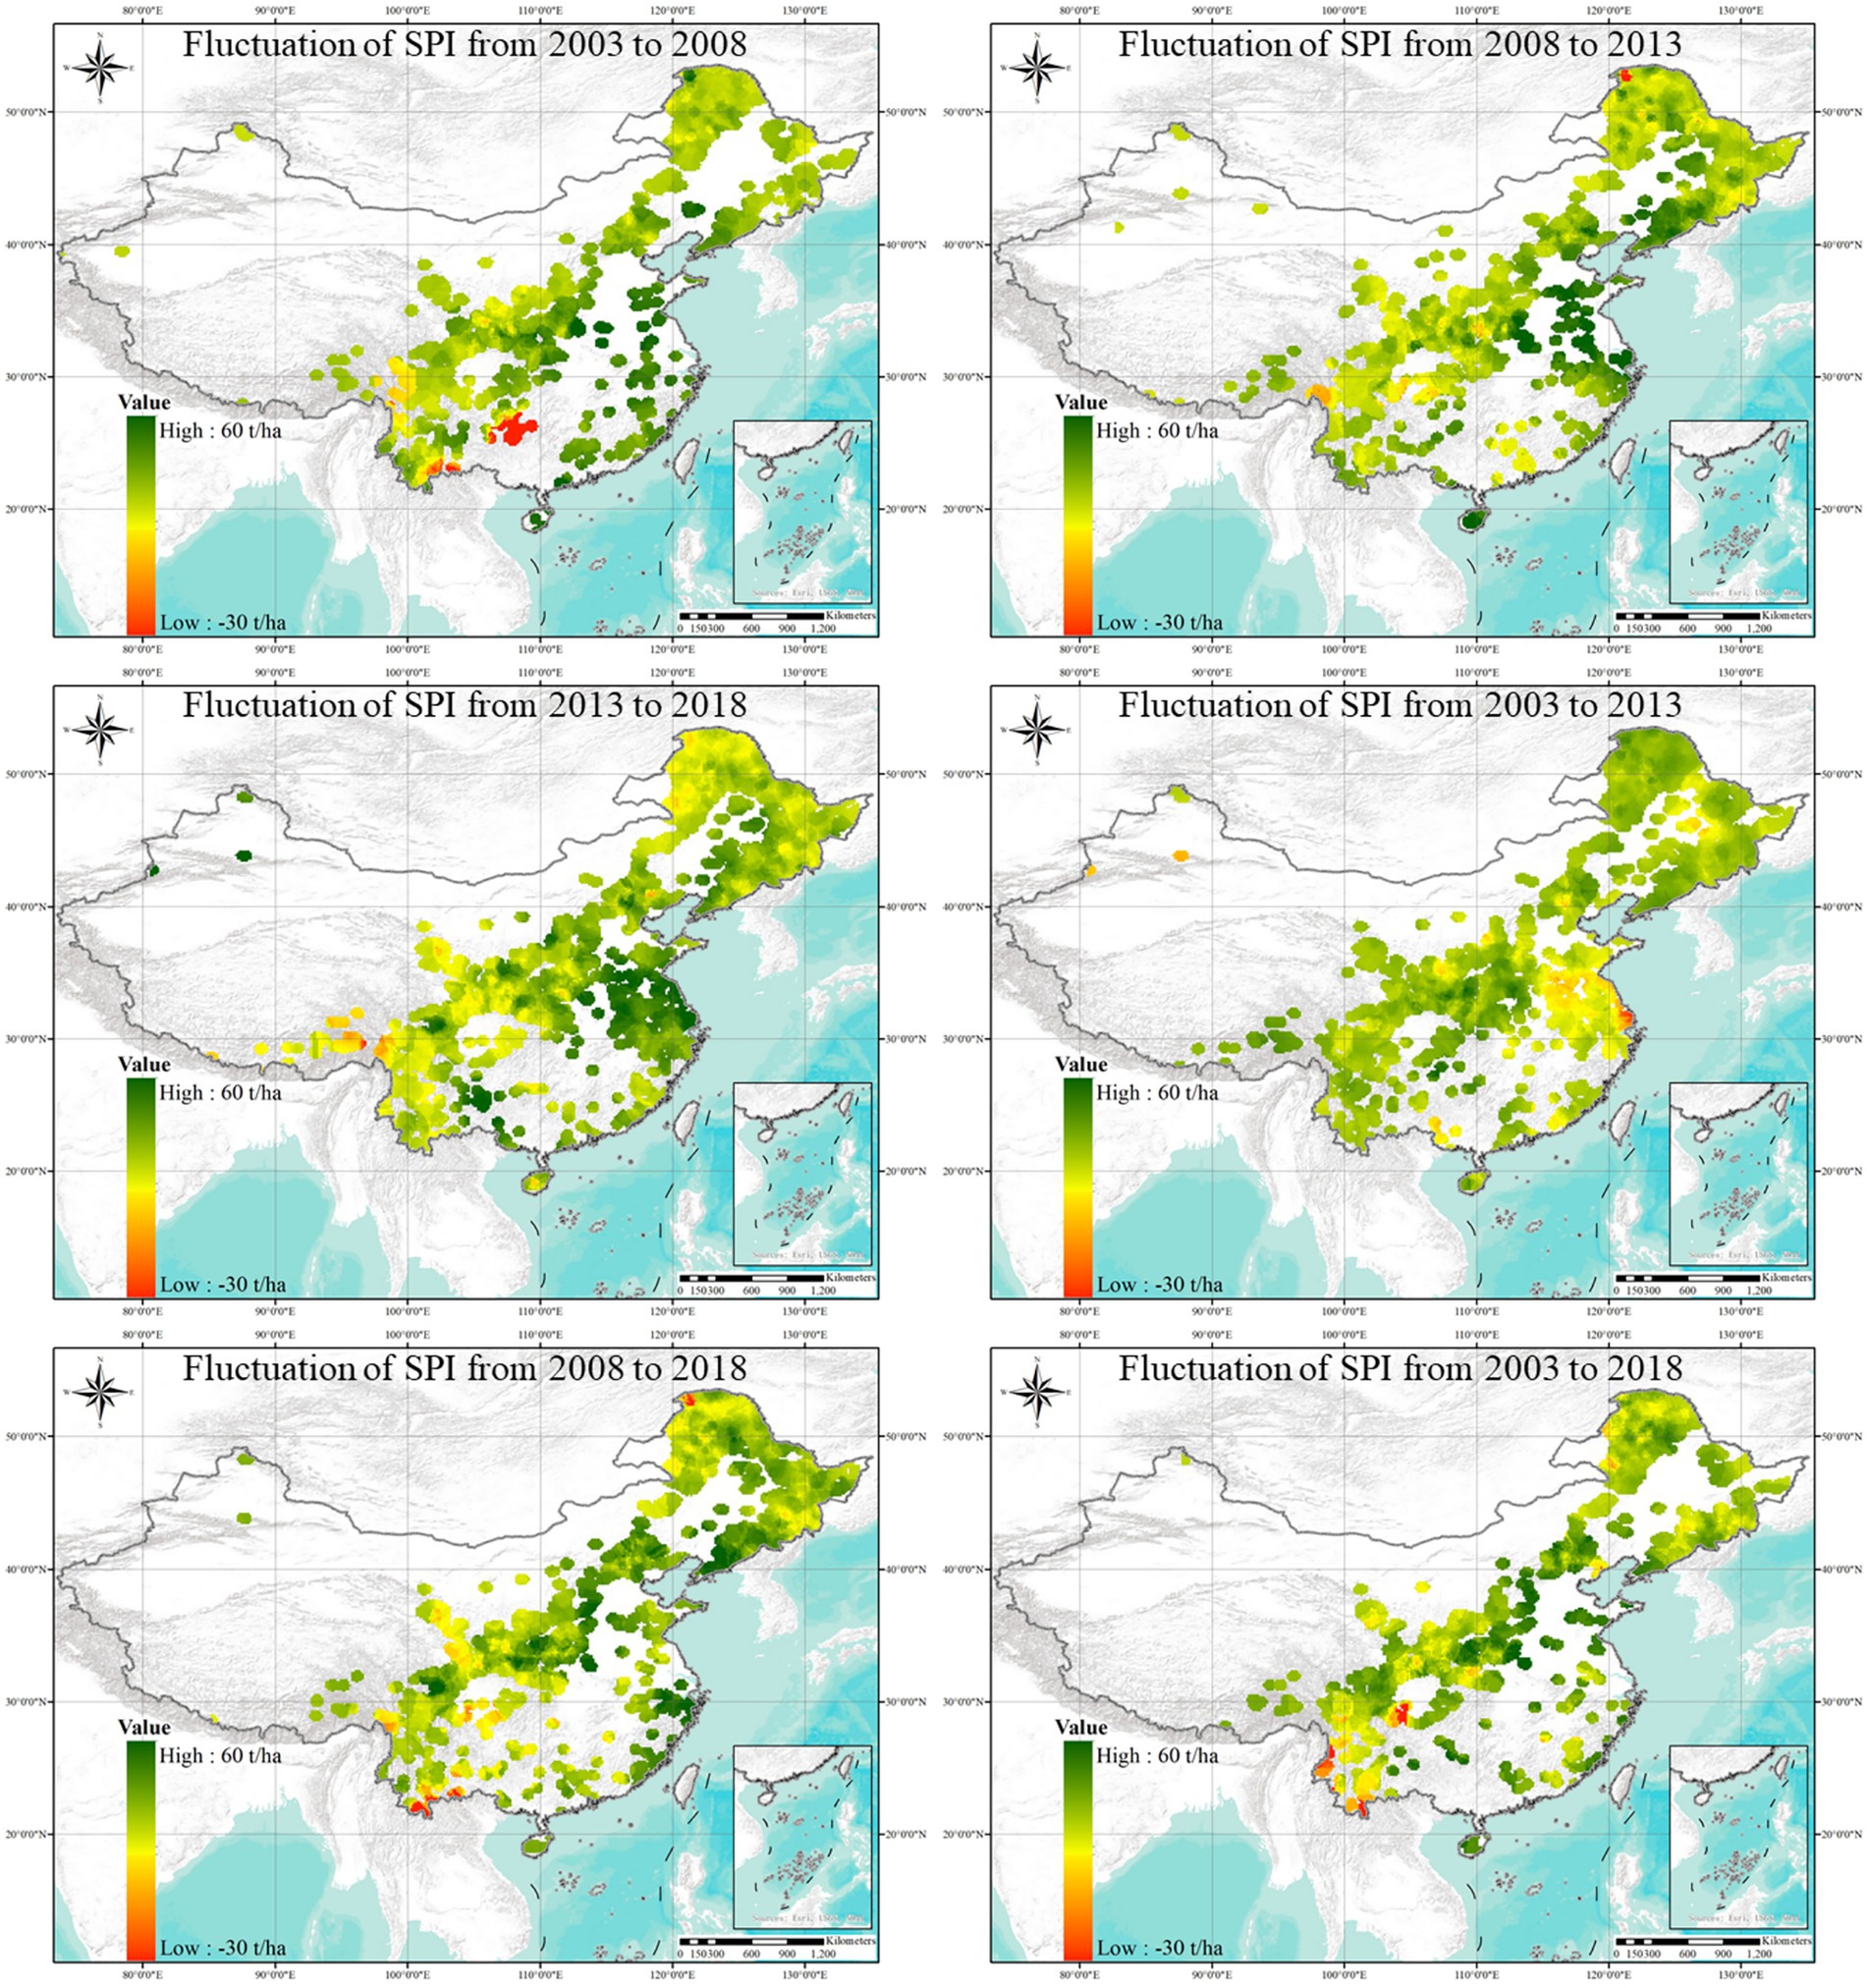
Figure 5. Spatial dynamic changes in site productivity for broadleaf stands by various intervals from 2003 to 2018.
5 Discussion
Site productivity depends on nutrient availability, water use efficiency, etc., influencing the health and stability of broadleaf forest ecosystem. This study has developed a generalized site productivity index model for broadleaf stands that enables the assessment of spatial variation and pattern characteristics of site quality for different broadleaf species across large regional scales. The period of data used for assessing site quality in China covered 15 years, which is relatively short for many sites in relation to environmental variability that may cause fluctuations forest biomass, and probably too short for detecting any significant trend-like dynamic changes expected over longer cycles (Cao et al., 2023). For instance, the long-term accumulation and decomposition of litter can increase available nutrients like phosphorus and nitrogen in stand soil, improving soil texture and structure (Högberg et al., 2017; Kooch et al., 2017). Conversely, unsound management practices may lead to sustained declines in soil organic matter, resulting in deteriorating soil porosity and nutrient levels (Spies, 1997). These factors collectively suggest that in the long term, site quality should exhibit a trend of either improvement or degradation, and evaluation results should capture these dynamics.
Key factors affecting site quality, such as soil type, thickness, texture, and nutrient status, will generally remain stable without human interference and are less affected by climate variations, suggesting that the evaluation should also have stability, which is particularly important for constructing site productivity index models and determining reference ages. Consequently, it is recommended that evaluations focus primarily on middle-aged and near-mature stands to reduce the occurrence of site quality class fluctuation and minimize the uncertainty in the evaluation results when young or over mature stands are used. In practice, fast-growing broadleaf stands in in tropical and subtropical regions (e.g., of Populus spp. and Eucalyptus spp.), are often harvested earlier based on silvicultural objectives. For example, 82.41% of the Populus spp. modeling sample stands had an age of less than 30 years and were primarily distributed in Northwestern forest areas or natural primary forest areas, and thus we lacked sample data for naturally mature stands. It is essential to minimize shifts in the site quality index caused by comprehensive factors such as human interference and climate change (Bontemps and Bouriaud, 2014; Bontemps et al., 2009; Skovsgaard and Vanclay, 2008; Janssen et al., 2018; Aertsen et al., 2010). The evaluation of site quality for fast-growing and high-yield plantations should differ from the general methods used for assessing forest site quality, acknowledging their unique growth dynamics and management practices. This adjustment ensures that the evaluation better aligns with the realities of forest management, particularly for fast-growing species where traditional site quality assessments may not apply effectively. Meanwhile, fitting results suggest that while the Richards model is generally suitable for most broadleaf species stands, exceptions must be made for Robinia spp. stands, where the Logistic model better aligns with biological growth patterns and provides a more accurate representation of site productivity.
This study’s findings align with this principle, showing that broadleaf stand productivity improved continuously from 2003 to 2018, radiating outward from core areas. Although there is a slight fluctuation within 5-year intervals, the general trend is positive. A critical consideration is the observed fluctuation. True site quality, which is governed by stable edaphic and topographic factors, is not expected to change rapidly. Our biomass-based index, however, reflected the stand’s realized productivity, which is sensitive to short-term influences such as inter-annual climate. Variability partly caused by several sources of methodological uncertainties, including propagation of errors from allometric biomass models, potential measurement inaccuracies in plot data, and limited model robustness at the extremes of the age distribution (i.e., in very young or old stands), too. Therefore, some fluctuation between classes is expected. However, the consistent increase in higher-quality sites (Classes I and II) over the entire 15-year period suggests an improvement trend in underlying productive capacity, likely attributable to factors such as improved silvicultural practices. It is important to clarify that our site productivity index, being derived from stand biomass and age, is an indicator of realized stand productivity rather than a direct measure of intrinsic site quality defined by soil properties, topography, and geology. While the trends observed in Figures 4, 5 likely changes in site quality, we cannot disentangle these from the effects of normal stand development or inherent site characteristics without incorporating these environmental variables. Future research should aim to integrate soil physicochemical properties and climate data to establish more mechanistic models of site quality, thereby separating long-term site potential from short-term productivity fluctuations to support the positive improvement.
In forestry practice, the choice of evaluation methods depends on data availability, economic and technical feasibility, and the required scale of analysis (Aguirre et al., 2022; Ding et al., 2021). Our scatter testing curves suggest that the site productivity curves represented a well-defined split of stands into site quality classes and the Spearman correlation coefficient between productivity index classes of major broadleaf stands and the converted generalized index classes exceeded 0.99. These findings corroborate that forest biomass is a direct indicator of stand productivity. As a result, volume or biomass-based site quality assessment can be recommended for use in forest management practice for its effectiveness and potential to minimize the impact of methodological bias on the accuracy of site productivity assessments. Our approach ensures a more realistic and precise reflection of the land’s productive capacity, even though it may result in slightly lower test values compared to traditional height-based evaluations. Indirect methods, such as using stand mean height or dominant height to assess site quality, assume that tree height reflects site quality differences without being affected by stand density or management practices (Adeyemi, 2016). However, this assumption may be challenged, especially in mixed, uneven-aged, or multi-layered stands, where height may not accurately reflect site quality (Padilla-Martínez et al., 2022). Additionally, there is some subjectivity in determining dominant and mean heights in practice, leading to uncertainty when using height as an indicator.
Other indirect methods, like using indicator vegetation types to classify site types, have been found effective in boreal forests where the number of species is limited (Cajander, 1949; Heiskanen et al., 2018). However, the correlation between indicator vegetation types and forest productivity may be weak for more complex ecosystems. Direct evaluation methods, such as using yield volume, do not represent the net primary production due to differences in wood density among species, unless volume is converted to biomass (Gerwin et al., 2018). Biomass-based evaluations have their own limitations, as they assume that stands can achieve full stocking density, a canopy cover of 1.0, and full utilization of site productivity (Ji et al., 2012), which are difficult to achieve in real-world forests. In this study, a requirement of canopy cover greater than 0.70 and no harvesting was set as a prerequisite. Meanwhile, biomass data is more challenging to obtain than height data. All site quality measures share the difficulty of estimating potential productivity from measurements of actual stands that are always more or less constrained by management interference and other non-site factors such as disturbances.
This study was focused on evaluating the range of productivity and hence site quality classes of broadleaved species in China, without attempting to explain these classifications by any independent variables. However, such variables (e.g., soil health and climate variability) have been suggested to be incorporated into site quality assessments (Li et al., 2022). Also, it is important to understand species-specific growth responding to varying environmental conditions (Szatniewska et al., 2022), which further underscores the complexity of accurately assessing site productivity (Babst et al., 2013). Wu et al. (2015, 2022) have pointed out that site quality evaluation should encompass both soil site (reflecting land productivity) and stand site (reflecting the forest’s growth status). Process-based modeling studies have suggested to split the impacts into climate that influences carbon assimilation (Peltoniemi et al., 2015; Tian et al., 2020), and edaphic factors that influence carbon allocation belowground, and that site index and productivity should be derived from a combination of both (Mäkelä et al., 2016, Härkönen et al., 2019). However, it is challenging to analyze site quality changes and construct a unified site quality model on the large spatial scale, as climatic differences among regions affect species growth rates and impact the age-biomass relationship (Repo et al., 2021). Nonetheless, the generalized productivity index developed here has significant applications in modern ecological and environmental management beyond traditional forestry. For example, it can be integrated into large-scale carbon budget models to provide more accurate estimates of regional carbon sinks. It can also serve as a key variable in assessing forest vulnerability to climate change, as sites with higher productivity may exhibit different sensitivities to drought or temperature stress. For policymakers, such a tool enables the targeted allocation of resources for forest restoration projects, ensuring that investments are directed toward areas with the highest potential for biomass accumulation and carbon capture. Thus, developing reliable and scientifically sound models for evaluating site quality is essential for improvement of forest management at national and global levels.
6 Conclusion
In this study, we established site productivity index models for major broadleaf stands based on the age-biomass relationship to evaluate site quality. On this basis, a generalized broadleaf stand productivity index model was constructed using conversion coefficients. Statistical tests validated the feasibility of the generalized model, making them suitable for use in forestry management and prediction. The generalized productivity index model facilitates the evaluation of spatial changes and pattern characteristics of site quality across different broadleaf species at large regional scales. Analysis of NFI sample plot data from 2003 to 2018, including proportional statistics and spatial analysis, indicated a continuous improvement trend in the site productivity of broadleaf forest, despite fluctuations during the 5-year intervals caused by methodological uncertainties. The generalized productivity index model demonstrates applicability but requires caution regarding potential biases in evaluation results due to uncertainty, especially when based on small sample data.
Data availability statement
The original contributions presented in the study are included in the article/Supplementary material, further inquiries can be directed to the corresponding authors.
Author contributions
HW: Writing – original draft, Methodology, Investigation, Software, Project administration, Funding acquisition, Resources, Data curation, Conceptualization, Formal analysis. XT: Conceptualization, Methodology, Writing – review & editing. FM: Writing – review & editing, Supervision, Methodology, Validation. CLi: Methodology, Writing – review & editing, Formal analysis. CLu: Resources, Methodology, Writing – original draft, Project administration, Software, Data curation. XX: Methodology, Investigation, Writing – original draft, Data curation. CS: Data curation, Investigation, Methodology, Writing – original draft. AM: Validation, Supervision, Visualization, Writing – review & editing, Conceptualization, Writing – original draft, Methodology.
Funding
The author(s) declare that financial support was received for the research and/or publication of this article. This research was funded by Yunnan Fundamental Research Projects (grant number 202501AU070001), the Southwest Survey and Planning Institute, National Forestry and Grassland Administration (grant number 202309), and Shaanxi Provincial International Science and Technology Cooperation Program (grant number 2024GH-YBXM-13).
Acknowledgments
We would like to acknowledge the Academy of Forest Inventory and Planning, National Forestry and Grassland Administration of China for the data and initial calculation.
Conflict of interest
The authors declare that the research was conducted in the absence of any commercial or financial relationships that could be construed as a potential conflict of interest.
Generative AI statement
The authors declare that no Gen AI was used in the creation of this manuscript.
Any alternative text (alt text) provided alongside figures in this article has been generated by Frontiers with the support of artificial intelligence and reasonable efforts have been made to ensure accuracy, including review by the authors wherever possible. If you identify any issues, please contact us.
Publisher’s note
All claims expressed in this article are solely those of the authors and do not necessarily represent those of their affiliated organizations, or those of the publisher, the editors and the reviewers. Any product that may be evaluated in this article, or claim that may be made by its manufacturer, is not guaranteed or endorsed by the publisher.
Supplementary material
The Supplementary material for this article can be found online at: https://www.frontiersin.org/articles/10.3389/ffgc.2025.1650547/full#supplementary-material
References
Adeyemi, A. A. (2016). Site quality assessment and allometric models for tree species in the Oban Forest, Nigeria. J. Sustain. For. 35, 280–298. doi: 10.1080/10549811.2016.1187955
Aertsen, W., Kint, V., Van Orshoven, J., Özkan, K., and Muys, B. (2010). Comparison and ranking of different modelling techniques for prediction of site index in Mediterranean mountain forests. Ecol. Model. 221, 1119–1130. doi: 10.1016/j.ecolmodel.2010.01.006
Aguirre, A., Moreno-Fernández, D., Alberdi, I., Hernández, L., Adame, P., Cañellas, I., et al. (2022). Mapping forest site quality at national level. For. Ecol. Manag. 508:120043. doi: 10.1016/j.foreco.2022.120043
Arias-Rodil, M., Crecente-Campo, F., Barrio-Anta, M., and Diéguez-Aranda, U. (2015). Evaluation of age-independent methods of estimating site index and predicting height growth: a case study for maritime pine in Asturias (NW Spain). Eur. J. Forest Res. 134, 223–233. doi: 10.1007/s10342-014-0842-8
Babst, F., Poulter, B., Trouet, V., Tan, K., Neuwirth, B., Wilson, R., et al. (2013). Site-and species-specific responses of forest growth to climate across the European continent. Glob. Ecol. Biogeogr. 22, 706–717. doi: 10.1111/geb.12023
Bontemps, J. D., and Bouriaud, O. (2014). Predictive approaches to forest site productivity: recent trends, challenges and future perspectives. Forestry 87, 109–128. doi: 10.1093/forestry/cpt034
Bontemps, J. D., Hervé, J. C., and Dhôte, J. F. (2009). Long-term changes in forest productivity: a consistent assessment in even-aged stands. For. Sci. 55, 549–564. doi: 10.1093/forestscience/55.6.549
Cao, L., He, X., Chen, S., and Fang, L. (2023). Assessing forest quality through forest growth potential, an index based on improved catboost machine learning. Sustainability 15:8888. doi: 10.3390/su15118888
Cajander, A. K. (1949). Forest types and their significance. Acta Forestalia Fennica. 56:7396. doi: 10.14214/aff.7396
Cheveau, M., Imbeau, L., Drapeau, P., and Bélanger, L. (2008). Current status and future directions of traditional ecological knowledge in forest management: a review. For. Chron. 84, 231–243. doi: 10.5558/tfc84231-2
Ding, Z., Li, R., O’Connor, P., Zheng, H., Huang, B., Kong, L., et al. (2021). An improved quality assessment framework to better inform large-scale forest restoration management. Ecol. Indic. 123:107370. doi: 10.1016/j.ecolind.2021.107370
Duan, G., Gao, Z., Wang, Q., and Fu, L. (2018). Comparison of different height–diameter modeling techniques for prediction of site productivity in natural uneven-aged pure stands. Forests 9:63. doi: 10.3390/f9020063
Farooq, T. H., Shakoor, A., Wu, X., Li, Y., Rashid, M. H., Zhang, X., et al. (2020). Perspectives of plantation forests in the sustainable forest development of China. iForest 14, 166–174. doi: 10.3832/ifor3571-013
Ferrero, M. E., Villalba, R., De Membiela, M., Ripalta, A., Delgado, S., and Paolini, L. (2013). Tree-growth responses across environmental gradients in subtropical Argentinean forests. Plant Ecol. 214, 1321–1334. doi: 10.1007/s11258-013-0255-0
Fu, L., Sharma, R. P., Zhu, G., Li, H., Hong, L., Guo, H., et al. (2017). A basal area increment-based approach of site productivity evaluation for multi-aged and mixed forests. Forests 8:119. doi: 10.3390/f8040119
Gao, J., Wang, C., Wang, Z., Lin, J., Zhang, R., Wu, X., et al. (2024). Site selection decision for biomass cogeneration projects from a sustainable perspective: a case study of China. Energy 286:129518. doi: 10.1016/j.energy.2023.129518
Gerwin, W., Repmann, F., Galatsidas, S., Vlachaki, D., Gounaris, N., Baumgarten, W., et al. (2018). Assessment and quantification of marginal lands for biomass production in Europe using soil-quality indicators. Soil 4, 267–290. doi: 10.5194/soil-4-267-2018
Härkönen, S., Neumann, M., Mues, V., Berninger, F., Bronisz, K., Cardellini, G., et al. (2019). A climate-sensitive forest model for assessing impacts of forest management in Europe. Environ Model Softw. 115, 128–143. doi: 10.1016/j.envsoft.2019.02.009
Heiskanen, J., Hallikainen, V., Uusitalo, J., and Ilvesniemi, H. (2018). Co-variation relations of physical soil properties and site characteristics of Finnish upland forests. Silva Fenn. 52:9947. doi: 10.14214/sf.9947
Hennigar, C., Weiskittel, A., Allen, H. L., and MacLean, D. A. (2017). Development and evaluation of a biomass increment based index for site productivity. Can. J. For. Res. 47, 400–410. doi: 10.1139/cjfr-2016-0391
Hilmers, T., Avdagić, A., Bartkowicz, L., Bielak, K., Binder, F., Bončina, A., et al. (2019). The productivity of mixed mountain forests comprised of Fagus sylvatica, Picea abies, and Abies alba across Europe. Forestry 92, 512–522. doi: 10.1093/forestry/cpz025
Högberg, P., Näsholm, T., Franklin, O., and Högberg, M. N. (2017). Tamm review: on the nature of the nitrogen limitation to plant growth in Fennoscandian boreal forests. For. Ecol. Manag. 403, 161–185. doi: 10.1016/j.foreco.2017.01.041
Huang, S., and Titus, S. J. (1993). An index of site productivity for uneven-aged or mixed-species stands. Can. J. For. Res. 23, 558–562. doi: 10.1139/x93-075
Janssen, E., Kint, V., Bontemps, J. D., Özkan, K., Mert, A., Köse, N., et al. (2018). Recent growth trends of black pine (Pinus nigra J.F. Arnold) in the eastern mediterranean. For. Ecol. Manag. 412, 21–28. doi: 10.1016/j.foreco.2018.01.033
Ji, B. Y., Tao, J. X., and Wang, W. W. (2012). Forest site quality evaluation based on biomass data from continuous forest inventories. J. Southwest Forestry Univ. 32, 45–50. doi: 10.3969/j.issn.2095-1914.2012.04.010
Kooch, Y., Samadzadeh, B., and Hosseini, S. M. (2017). The effects of broad-leaved tree species on litter quality and soil properties in a plain forest stand. Catena 150, 223–229. doi: 10.1016/j.catena.2016.11.020
Li, X., Duan, A., and Zhang, J. (2022). Site index for Chinese fir plantations varies with climatic and soil factors in southern China. J. For. Res. 33, 1765–1780. doi: 10.1007/s11676-021-01428-1
Liu, P., and Yin, R. (2012). Sequestering carbon in China’s forest ecosystems: potential and challenges. Forests 3, 417–430. doi: 10.3390/f3020417
Mäkelä, A., Pulkkinen, M., and Mäkinen, H. (2016). Bridging empirical and carbon-balance based forest site productivity–Significance of below-ground allocation. For. Ecol. Manag. 372, 64–77. doi: 10.1016/j.foreco.2016.03.059
Molina-Valero, J. A., Diéguez-Aranda, U., Álvarez-González, J. G., Castedo-Dorado, F., and Pérez-Cruzado, C. (2019). Assessing site form as an indicator of site quality in even-aged Pinus radiata D. Don stands in North-Western Spain. Ann. For. Sci. 76:10. doi: 10.1007/s13595-018-0789-3
Moreno-Fernández, D., Álvarez-González, J. G., Rodríguez-Soalleiro, R., Pasalodos-Tato, M., Cañellas, I., Montes, F., et al. (2018). National-scale assessment of forest site productivity in Spain. For. Ecol. Manag. 417, 197–207. doi: 10.1016/j.foreco.2018.03.012
Padilla-Martínez, J. R., Paul, C., Corral-Rivas, J. J., Husmann, K., Diéguez-Aranda, U., and Von Gadow, K. (2022). Evaluation of the site form as a site productive indicator in temperate uneven-aged multispecies forests in Durango, Mexico. Plants 11:2764. doi: 10.3390/plants11202764
Peltoniemi, M., Pulkkinen, M., Aurela, M., Pumpanen, J., Kolari, P., and Mäkelä, A. (2015). A semi-empirical model of boreal-forest gross primary production, evapotranspiration, and soil water—calibration and sensitivity analysis. Boreal Environ. Res. 20, 151–171. doi: 10.60910/10xa-dh5x
Pretzsch, H. (2020). Density and growth of forest stands revisited. Effect of the temporal scale of observation, site quality, and thinning. For. Ecol. Manag. 460:117879. doi: 10.1016/j.foreco.2020.117879
Pretzsch, H., Bravo-Oviedo, A., Hilmers, T., Ruiz-Peinado, R., Coll, L., Löf, M., et al. (2022). With increasing site quality asymmetric competition and mortality reduces scots pine (Pinus sylvestris L.) stand structuring across Europe. For. Ecol. Manag. 520:120365. doi: 10.1016/j.foreco.2022.120365
Repo, A., Rajala, T., Henttonen, H. M., Lehtonen, A., Peltoniemi, M., and Heikkinen, J. (2021). Age-dependence of stand biomass in managed boreal forests based on the Finnish National Forest Inventory data. For. Ecol. Manag. 498:119507. doi: 10.1016/j.foreco.2021.119507
Repola, J. (2009). Biomass equations for scots pine and Norway spruce in Finland. Silva Fenn. 43, 625–647. doi: 10.14214/sf.184
Sheil, D., and Bongers, F. (2020). Interpreting forest diversity-productivity relationships: volume values, disturbance histories and alternative inferences. Forest Ecosyst. 7:6. doi: 10.1186/s40663-019-0211-5
Skovsgaard, J. P., and Vanclay, J. K. (2008). Forest site productivity: a review of the evolution of dendrometric concepts for even-aged stands. Forestry 81, 13–31. doi: 10.1093/forestry/cpn004
Spies, T. (1997). “Forest stand structure, composition, and function” in Creating a forestry for the 21st century. eds. K. Kohm and J. Franklin (Washington, USA: Island Press), 11–30.
Szatniewska, J., Zavadilova, I., Nezval, O., Krejza, J., Petrik, P., Čater, M., et al. (2022). Species-specific growth and transpiration response to changing environmental conditions in floodplain forest. For. Ecol. Manag. 516:120248. doi: 10.1016/j.foreco.2022.120248
Teobaldelli, M., Somogyi, Z., Migliavacca, M., and Usoltsev, V. A. (2009). Generalized functions of biomass expansion factors for conifers and broadleaved by stand age, growing stock and site index. For. Ecol. Manag. 257, 1004–1013. doi: 10.1016/j.foreco.2008.11.002
Tian, X., Minunno, F., Cao, T., Peltoniemi, M., Kalliokoski, T., and Mäkelä, A. (2020). Extending the range of applicability of the semi-empirical ecosystem flux model PRELES for varying forest types and climate. Glob. Change Biol. 26, 2923–2943. doi: 10.1111/gcb.14995
Tong, X., Brandt, M., Yue, Y., Ciais, P., Rudbeck, J. M., Penuelas, J., et al. (2020). Forest management in southern China generates short term extensive carbon sequestration. Nat. Commun. 11:129. doi: 10.1038/s41467-019-13798-8
Wang, H., He, M., Ran, N., Xie, D., Wang, Q., Teng, M., et al. (2021). China’s key forestry ecological development programs: implementation, environmental impact and challenges. Forests 12:101. doi: 10.3390/f12010101
Wang, S., Zhou, L., Chen, J., Ju, W., Feng, X., and Wu, W. (2011). Relationships between net primary productivity and stand age for several forest types and their influence on China’s carbon balance. J. Environ. Manag. 92, 1651–1662. doi: 10.1016/j.jenvman.2011.01.025
Weiskittel, A. R., Hann, D. W., Kershaw, J. A., and Vanclay, J. K. (2011). Forest growth and yield modeling. New York, USA: John Wiley & Sons.
Wu, H., Dang, K. L., Tian, X. L., Sun, S. C., Chen, S. J., Zhao, P. X., et al. (2015). Evaluating site quality for secondary forests and plantation in Qinling Mountains. Sci. Silvae Sin. 51, 78–88. doi: 10.11707/j.1001-7488.20150410
Wu, H., Xu, H., Tang, F., Ou, G., and Liao, Z. (2022). Impacts of stand origin, species composition, and stand density on height-diameter relationships of dominant trees in Sichuan Province, China. Austrian J. Forest Sci. 139, 51–72.
Yu, Z., Liu, S., Li, H., Liang, J., Liu, W., Piao, S., et al. (2024). Maximizing carbon sequestration potential in Chinese forests through optimal management. Nat. Commun. 15:3154. doi: 10.1038/s41467-024-47353-2
Zeng, W. (2024). Tree biomass models and related parameters to carbon accounting for major tree species. Standard no. GB/T 43648–2024. Beijing: Standard Press of China.
Keywords: site quality, general productivity index, dynamic change, broadleaf forest stands, sustainable management
Citation: Wu H, Tian X, Minunno F, Liu C, Luo C, Xu X, Sun C and Mäkelä A (2025) Application of stand biomass in the evaluation of site quality for broadleaf forests in China. Front. For. Glob. Change. 8:1650547. doi: 10.3389/ffgc.2025.1650547
Edited by:
Chang-Bae Lee, Kookmin University, Republic of KoreaReviewed by:
Jong Bin Jung, Mokpo National University, Republic of KoreaTae Kyung Yoon, Kookmin University, Republic of Korea
Copyright © 2025 Wu, Tian, Minunno, Liu, Luo, Xu, Sun and Mäkelä. This is an open-access article distributed under the terms of the Creative Commons Attribution License (CC BY). The use, distribution or reproduction in other forums is permitted, provided the original author(s) and the copyright owner(s) are credited and that the original publication in this journal is cited, in accordance with accepted academic practice. No use, distribution or reproduction is permitted which does not comply with these terms.
*Correspondence: Xianglin Tian, eGlhbmdsaW4udGlhbkBoZWxzaW5raS5maQ==; Annikki Mäkelä, YW5uaWtraS5tYWtlbGFAaGVsc2lua2kuZmk=