Abstract
Quantifying the environmental factors influencing growth dynamics is essential for predicting ecosystem responses, especially under global climate change. However, achieving comprehensive, long-term tree-growth monitoring across extensive regions can be resource-intensive. Ideally, dendrochronological measurements are complemented by models capable of efficiently estimating growth patterns, particularly in under-sampled regions. We applied a modeling approach combining generalized additive models (GAMs) and extensive dendrochronological data from 258 Sweet chestnut (Castanea sativa Miller) cores collected across Georgia and eastern Turkey. Our models identified stand age, minimum temperature of coldest month, precipitation during the driest quarter, soil nitrogen content, and soil pH as significant predictors, explaining substantial variability in Ca. sativa growth rates. Younger stands (<50 years) in regions characterized by mild winter temperatures, moderate precipitation in the late winter and early spring, acidic soils, and elevated nitrogen content exhibited optimal growth conditions. Future scenario analyses (SSP126, SSP370, and SSP585) revealed regionally variable impacts, highlighting areas vulnerable to climate-induced stress or benefiting from warmer and drier conditions. Although the predictive validity of our model is most reliable within the observed distribution range of Ca. sativa, extrapolations to additional regions are reasonable, provided that environmental conditions fall within the range of the training data.
1 Introduction
Environmental factors are primary drivers of tree growth. Their role becomes increasingly important in the context of global climate change (Reinmann et al., 2019). The growth is contingent upon several variables, such as climate, soil, light, water, and nutrients, which are available to the stands and individual trees based on their social status and physical size (Velizarova, 2015). All these variables interact and fluctuate spatially and temporally, together resulting in observable variations in growth rates (Cienciala et al., 2016). Understanding these patterns is crucial for accurately predicting trees’ responses to global climate change and informing management strategies for species such as the Sweet chestnut (Castanea sativa Miller), which are increasingly influenced by climate change and human-induced stresses (Krebs et al., 2004).
Ca. sativa is a relict deciduous tree species and the only native Castanea species in its native distribution range. It generally reaches heights of 20–35 m (Dolukhanov, 2010; Konstantinidis et al., 2008). Ca. sativa may occur in practically monospecific stands as well as mixed with different oak (Quercus) species, beech (Fagus orientalis Lipsky), hornbeam (Carpinus betulus L., Carpinus caucasica Grossh.), often as a subdominant species (Nakhutsrishvili, 2013). The species is considered moderately shade-tolerant, but requires sufficient light throughout its early development (Conedera et al., 2024).
Regions with suitable habitats for Ca. sativa are primarily located across its native range, including parts of Southern and Central Europe, as well as Western and Southwestern Asia. Particularly, the areas characterized by moderate and mountain climates. The species grows within environments characterized by mild winters, warm summers, and adequate rainfall, commonly located in temperate deciduous forests, montane areas, and locales with seasonal snow accumulation at elevated altitudes (Dolukhanov, 2010; Metreveli et al., 2023).
Historically, Ca. sativa has been an important tree species in Caucasian forest ecosystems, contributing to biodiversity and providing essential resources for human societies (Conedera et al., 2024). It is an economically valuable tree species, with its nuts supporting agroforestry systems across Europe and Asia. Ca. sativa wood, known for its durability and resistance to decay, is a major resource for timber, furniture, and construction industries (Conedera et al., 2021). As a result of its numerous advantages, many Ca. sativa woodlands are being converted and replaced with planted stands, often through active management (Krebs et al., 2004; Newbigin, 1928).
Ca. sativa stands have undergone substantial transformation over the past century, not only due to human management but also as a result of biotic factors. Chestnut blight, caused by Cryphonectria parasitica, has profoundly altered Ca. sativa populations across its range, reducing vitality and growth in many stands (Rigling and Prospero, 2018; Keleş et al., 2024; Metreveli et al., 2024). The anatomical wood characteristics and tree ring widths are significantly impacted by chestnut blight infections (Keleş et al., 2024). This and other factors, such as the inherent wood structure’s tendency to radial and circumferential splits, ring shake, absence of rings, and rapid growth rate, make dendrochronological analysis less accurate (Romagnoli et al., 2004; Spina and Romagnoli, 2010).
Consequently, many scientists choose to cross-match the growth of Ca. sativa with co-occurring native oak species, as they similarly respond to climatic conditions. This aids in constructing more resilient regional chronologies, particularly when Ca. sativa alone may not provide a clear or comprehensive record. However, some research suggests that Ca. sativa is suitable for growth analysis due to its decay-resistant heartwood and thin sapwood (Jarman et al., 2017).
Given the ecological and economic importance of Ca. sativa, a study of its growth and the impact of environmental factors on its development is needed. Ca. sativa growth is a multifaceted process affected by several environmental conditions, which are essential in influencing growth rates, wood quality, and total wood production (Romagnoli et al., 2004). Several dendrochronological studies have shown that the primary environmental factors affecting the growth of Ca. sativa are precipitation, temperature, and drought (Di Filippo et al., 2014; Jarman et al., 2017; Conedera et al., 2021; Velizarova, 2015). Some studies indicate that Ca. sativa growth is significantly related to spring rainfall (March–May), which is crucial for early-season development (Di Filippo et al., 2014; Jarman et al., 2017). In contrast, summer drought conditions (June–August) have an adverse effect on growth. Hot temperatures from April to August might inhibit growth, particularly in lower-altitude areas, where Ca. sativa needs a sufficient water supply to endure heat stress (Di Filippo et al., 2014). Jarman et al. (2017) indicated that February precipitation positively influenced growth; however, high rainfall in late spring and summer (May to July) may negatively affect growth due to soil waterlogging. Other studies emphasize the substantial impact of soil factors on the growth of Ca. sativa trees (Conedera et al. (2021), Velizarova (2015), Sillett et al. (2010)). These studies revealed that soil texture significantly affects nutrient availability, with trees impacting nitrogen cycling, organic matter accumulation, and cation exchange processes more profoundly in sandy loam soils than in finer silt soils. A strong correlation between foliar nitrogen and phosphorus levels and tree growth has been reported by Cernusak et al. (2010), whereas soil calcium showed an inverse relationship, suggesting that soil chemistry, particularly nutrient availability and pH, is crucial for Ca. sativa growth. Furthermore, soil calcium negatively impacts growth, whereas nitrogen-rich soils create more conducive conditions for trees’ productivity (Conedera et al., 2021; Velizarova, 2015). According to all these findings, we can suggest that different factors may have a substantial influence on Ca. sative growth in different locations. Given the context of global climate change, underscores the importance of thoroughly examining Ca. sativa growth responses across different regions, particularly those where the species is indigenous (Vlachou et al., 2024).
Climate change has been recognized as a primary driver altering forest ecosystems (Comerford et al., 2013). Increasing temperatures and altered precipitation patterns also significantly affect the development, distribution, and health of Ca. sativa, posing major challenges to its stands and impacting their physiology and phenology (Beridze et al., 2023). Elevated temperatures may result in a decrease in the growth rate, hindering seed production and spontaneous regeneration (REF) (Solla et al., 2024). Moreover, drought stress and heightened evapotranspiration may reduce growth rates and render trees more susceptible to pests and diseases (Solla et al., 2024; Vlachou et al., 2024; Metreveli et al., 2024).
Here, we conduct the first study on Ca. sativa growth in the Caucasus, a biodiversity hotspot and a region with extensive remaining natural Ca. sativa stands (Metreveli et al., 2023; Prospero et al., 2013). Our study aims to investigate the effects of current and future climatic, terrain, and soil factors on the average annual radial growth (mean ring width per core, in mm/year) rates of Ca. sativa. This indicator, which will be called average annual growth from now on, is different from traditional dendrochronological methods that focus on standardized ring-width indices (Midolo et al., 2021). We hypothesize that the average annual growth of Castanea sativa is influenced by a combination of climatic, terrain, soil, and biological factors. Following this, the main questions to answer are as follows: (1) How do current climatic, edaphic, and biological factors influence the average annual growth of Ca. sativa in the Caucasus? (2) How might these relationships alter under future climate scenarios (SSP126, SSP370, SSP585)? Our research aims at contributing to broader ecological investigations by providing dendrochronological data that elucidates the relationship between average annual growth and environmental variables. Furthermore, the identification of key factors influencing Ca. sativa growth can enrich forest management policies within the study region and beyond.
2 Materials and methods
2.1 Study area
Our study area encompasses the Caucasus ecoregion and lies between the Black Sea (oceanic) and the Caspian Sea, extending 1,300 km (Figure 1). Situated between 36° and 51° E longitude and 36° and 47° N latitude, the region encompasses an area of 580,000 km2 and consists of several notable features, including the North Caucasus Plain, the Greater Caucasus Range, the Lesser Caucasus and the Highland of South Caucasus, which includes portions of Asia Minor (Tielidze and Wheate, 2018). The region constitutes a significant Pleistocene refugium (Krebs et al., 2004; Tarkhnishvili et al., 2012).
Figure 1
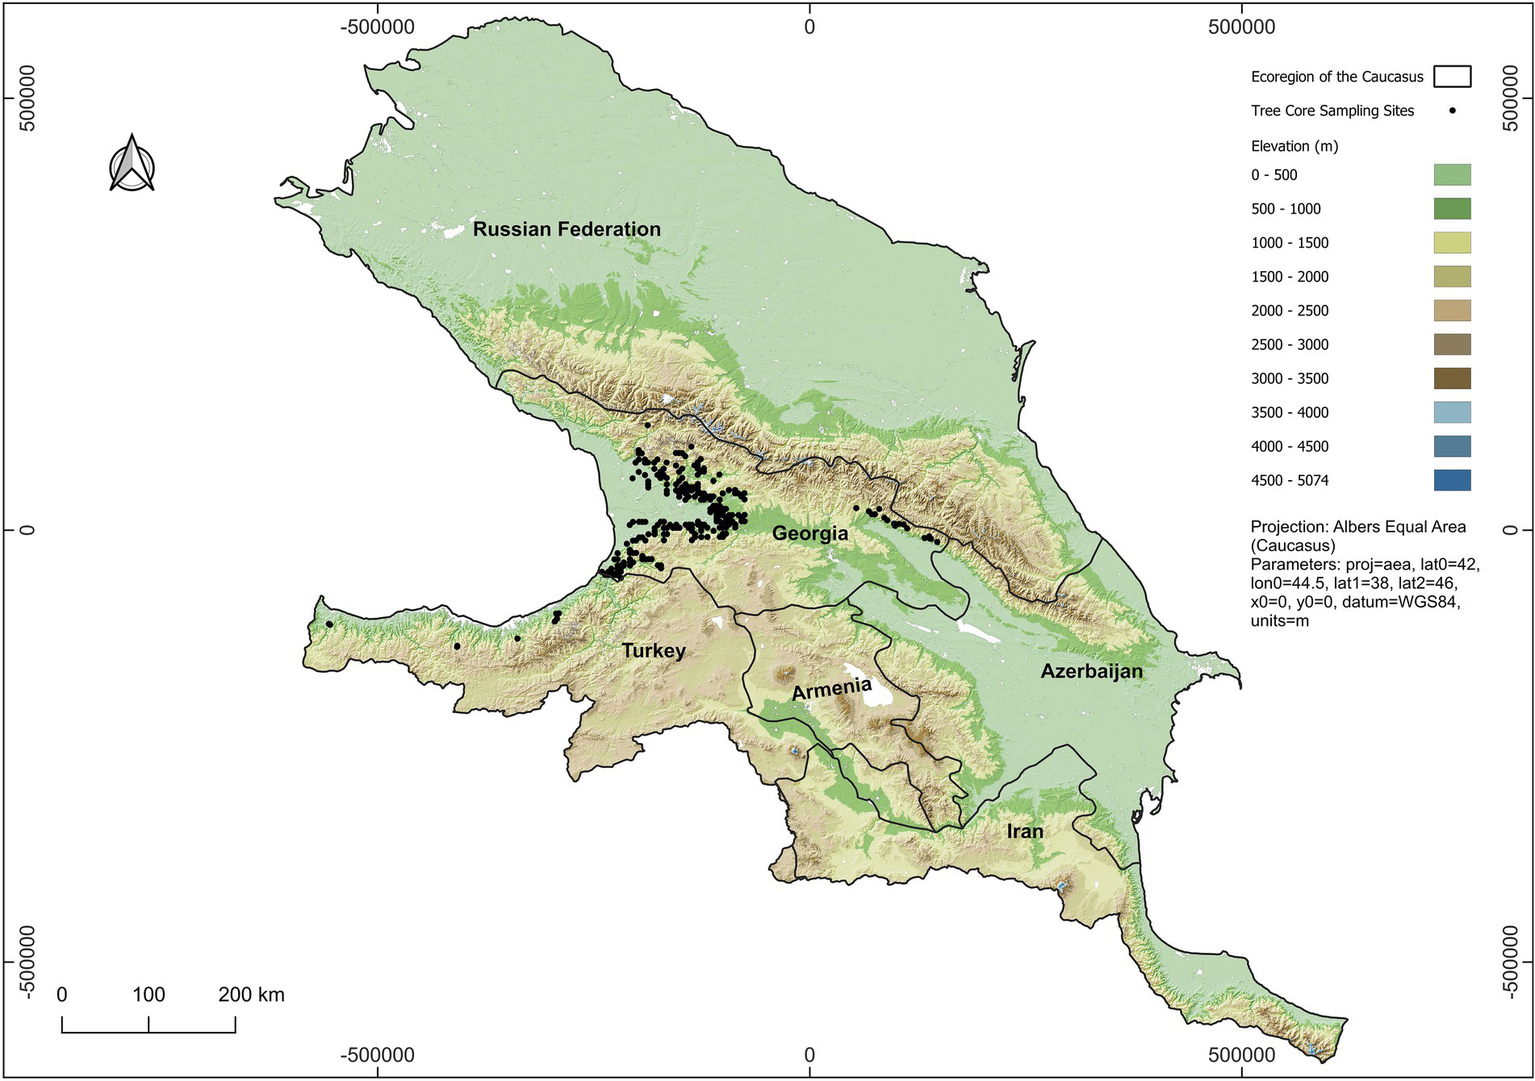
The map of the study area and Castanea sativa tree core sampling sites (n = 258).
2.2 Castanea sativa core samples
A sample of 200 tree cores from Georgia were obtained from Georgia’s National Forest Inventory, done by the Ministry of Environmental Protection and Agriculture of Georgia between 2019 and 2021 (Ministry of Environmental Protection and Agriculture of Georgia, 2023). An additional 10 cores from Turkey and 48 from eastern Georgia were collected by Vasil Metreveli between 2018 and 2019 for this study. Consequently, a total of 258 Ca. sativa trees from natural stands were cored at breast height (1.3 m) using Haglöf 2-thread increment borers (5 mm diameter, 40 cm length). Within each plot, one tree of average diameter was selected, avoiding suppressed and overly dominant individuals to minimize bias from microhabitat variation (Pretzsch, 2009; Midolo et al., 2021).
The National Forest Inventory plots featured a multiple-layer concentric circular configuration with radii of 5, 10, and 15 meters (Ministry of Environmental Protection and Agriculture of Georgia, 2023). However, the plots taken by Vasil Metreveli for this study utilized a single-layer circular design with a 12.6-meter radius. Wood core samples were collected at an elevation range of 112 to 1,664 meters above sea level. The sampled trees were evenly distributed across a large part of the species’ geographic range in Georgia. The sampled trees varied in diameter between 8–56 cm at DBH (Mean ± SD = 25 ± 10 cm). Each tree was cored once from one side. The smallest minimum distance between sampled trees was 100 meters. Core samples were preserved in paper straws in the field for further investigation in the lab.
2.3 Processing core samples
Core samples were fixed to wooden mounting boards for further processing. The samples were smoothed using a WSL Core Microtome to improve the visibility of yearly rings (Gärtner and Nievergelt, 2010). For example, with ambiguous ring delineation post-smoothing, increasingly finer grades of sandpaper were used.
Samples were then scanned for ring-width measurement at a resolution of 1,200 DPI. Annual ring measurements, increments, and calendar year assignments were ascertained using CooRecorder and Cdendro software (https://www.cybis.se/forfun/dendro/index.htm). This software enables ring measurements with an accuracy of 0.01 mm. Only fully formed last annual rings were measured, reflecting the year in which the tree finished its growth at the time of sampling. Rings that were not fully developed, signifying incomplete growth during the sampling year, were omitted to guarantee measurement precision and comparability. This methodology reduced potential inaccuracies in annual ring-width analysis and guaranteed that only complete growth cycles were included in the dataset (Kvaratskhelia and Gavashelishvili, 2025). All cores reached the pith, ensuring that the full radial sequence from the center to the bark was measured. Ring-width distances (mm) were carefully measured and visually checked to ensure accurate identification of annual boundaries (Ortega Rodriguez et al., 2023). A total of 258 cores were analyzed, covering the years from 1870 to 2020. The average ring width in the dataset is 2.66 ± 1.95 mm, and the values range over time from 0.06 mm to 14.86 mm (Supplementary Figure 1). Subsequently, the width of the ring series was averaged for each core to eliminate the effect of stand density and the size-growth relations (Midolo et al., 2021). Subsequently, the data were checked for measurement errors and prepared for statistical analysis.
2.4 Environmental variables and data processing
This study incorporates different environmental variables to evaluate their influence on the growth dynamics of Ca. sativa. These include climatic, topographical, and soil characteristics. The age of the tree, a key factor influencing growth (Thomas, 2011), was also considered. All variables were available for the complete dataset (n = 258 cores), with no missing values. The chosen variables provide insights into present conditions and possible future alterations under several climatic scenarios (Table 1).
Table 1
| Category | Variable name | Description |
|---|---|---|
| Age | Age | Age of the sampled tree in years |
| Climate | CHELSA climate variables V 2.1 (Current) | BIO1–19 (Current mean temp, precipitation, seasonality, extremes) |
| CHELSA climate variables V 2.1 (Future) | BIO1–19 (Future mean temp, precipitation, seasonality, extremes) - CMIP6 ISIMIP3b – gfdl_esm4 (ssp126, ssp370, ssp580) | |
| Topography | Elevation above sea level in (m) | Elevation data collected via the Shuttle radar topography mission (SRTM) |
| Surface roughness | Variability in terrain elevation, calculated from SRTM DEM | |
| Topographic ruggedness index | Terrain heterogeneity based on elevation differences, from SRTM DEM | |
| Topographic position index | Indicates valley, mid-slope, or ridge; calculated from SRTM DEM | |
| Slope (0°–90°) | Terrain steepness, from SRTM DEM | |
| Aspect (0°–360°) | Slope direction, derived from SRTM DEM | |
| Soil | Clay content (%) | Averaged over depths (cm): 0–5, 5–15, 15–30, 30–60, 60–100, 100–200 |
| Silt content (%) | Averaged over depths (cm): 0–5, 5–15, 15–30, 30–60, 60–100, 100–200 | |
| Sand content (%) | Averaged over depths (cm): 0–5, 5–15, 15–30, 30–60, 60–100, 100–200 | |
| Organic carbon (mg/kg) | Averaged over depths (cm): 0–5, 5–15, 15–30, 30–60, 60–100, 100–200 | |
| Organic carbon density (kg C/m2) | Averaged over depths (cm): 0–5, 5–15, 15–30, 30–60, 60–100, 100–200 | |
| Bulk density of fine earth fraction (kg/dm3) | Averaged over depths (cm): 0–5, 5–15, 15–30, 30–60, 60–100, 100–200 | |
| Nitrogen content (mg/kg) | Averaged over depths (cm): 0–5, 5–15, 15–30, 30–60, 60–100, 100–200 | |
| Soil pH (H₂O) | Averaged over depths (cm): 0–5, 5–15, 15–30, 30–60, 60–100, 100–200 | |
| Coarse fragment volume (cm3) | Averaged over depths (cm): 0–5, 5–15, 15–30, 30–60, 60–100, 100–200 |
Environmental and soil variables.
No missing values occurred. All variables were measured for the full dataset (n = 258).
We utilized 1 km resolution bioclimatic data (BIO1–BIO19) from CHELSA (1981–2010) and future climate predictions from the CMIP6 ISIMIP3b dataset (GFDL-ESM4, 2070–2,100) under SSP126, SSP370, and SSP580 scenarios (CHELSA version 2.1, 30 s ~ 1 km2, downloaded from https://chelsa-climate.org, accessed on 4 March 2025) (Karger et al., 2017). Terrain characteristics at a resolution of 30 m × 30 m encompassed elevation, slope, aspect, surface roughness, the topographic ruggedness index (TRI), and the topographic position index (TPI) (Gupta and Dixit, 2024; Hayakawa et al., 2008). Soil parameters were sourced from ISRIC (250 m × 250 m resolution), which included soil texture, organic carbon, nitrogen, pH, coarse fragment volume, and cation exchange capacity (CEC) (Poggio et al., 2021).
All raster data were projected to the Albers Equal Area coordinate system for the Caucasus (Adams, 1927), resampled to a uniform resolution of 30 m × 30 m, and aligned with the DEM. The data were subsequently clipped and masked utilizing the Caucasus ecoregion shapefile, hence ensuring spatial consistency for ecological and geographical research.
2.5 Data analysis
To reduce the potential multicollinearity among the 34 independent variables (Table 1), we first built correlation matrices to look at the correlations between pairs of variables (Supplementary Figure 2) (Schober et al., 2018). We subsequently divided the environmental variables into four separate groups, making sure that the Pearson’s correlation coefficient between any two variables in each group was r < 0.75. This threshold represents a widely used equilibrium in ecological modelling: stricter cutoffs might have omitted ecologically significant predictors and diminished interpretability, while more lenient cutoffs would have heightened redundancy and processing demands (Dormann et al., 2013). Subsequently, 4,000 unique variable combinations were generated within each set using the ‘gtools’ package in the R statistical computing environment (Warnes et al., 2021). Variable sets were constructed to ensure that highly correlated predictors were not included together. Beyond this restriction, predictors were freely combined, resulting in 16,000 models.
We employed generalized additive models (GAMs) to examine the factors affecting the growth of Ca. sativa, focusing on the relationship between growth rate, tree age (age of individual trees determined from ring counts at the pith) and environmental variables (Table 1). Generalized Additive Models (GAMs) were selected for their capacity to capture non-linear and non-monotonic relationships and were run using the “mgcv” package (Wood, 2011; Wood et al., 2016) in R version 4.2.2 (R Core Team, 2016). All predictors were modelled with smooth terms (s()), and no interactions were included to preserve interpretability. Given that the dependent variable (average growth/width of the ring series of trees) was non-negative and continuous, we employed the “Gamma” family with a log link function to address the variance that rises with the mean. We used the gam.check and gratia tools in R to check the residuals to make sure that the Gamma distribution assumption was correct. We looked at fitted vs. residuals plots, quantile–quantile (Q–Q) plots, and histograms of residuals to see if the model fit and distributional assumptions were correct (Wood, 2017; Simpson, 2022). Penalized thin plate regression splines were employed for expressing smooth terms, with smoothing parameters estimated using restricted maximum likelihood (REML) to guarantee robust estimation (Wood, 2011).
We examined all possible combinations of variables across the four sets, yielding 16,000 candidate models. We tested GAMs using two to ten predictors. Tree age was incorporated into all models to address ontogenetic patterns. We applied a two-step selection: first, models were screened based on predictive accuracy using 10-fold cross-validation (MSE) (Daniel et al., 2022a, b; Yates et al., 2023), retaining only those where all predictors were statistically significant (p < 0.05). Among this reduced set, the final model was chosen based on lowest AIC to balance predictive power with parsimony (Wagenmakers and Farrell, 2004; Chakrabarti and Ghosh, 2011). The concurvity among model terms was also assessed to ensure model reliability (Kovács, 2024).
The final model was employed to produce a spatial map of Ca. sativa growth. The growth map was subsequently compared to the species habitat suitability map of Metreveli et al. (2023). The growth raster was resampled to align with the spatial resolution and extent of the habitat suitability raster by bilinear interpolation. The two rasters were subsequently stacked and transformed into a data frame for pixel-wise analysis. A scatterplot was created to illustrate the correlation between habitat suitability and growth, and a linear regression model was applied to evaluate the statistical relationship. Pearson’s correlation coefficient was computed to measure the strength of this association. To investigate spatial mismatches, both rasters were standardized (scaled from 0 to 1), and their difference was computed, giving a new raster that emphasizes locations where habitat suitability meets or falls low of growth predictions.
Future projections of the growth were developed using CHELSA climate data under the SSP126, SSP370, and SSP585 scenarios. To assess the significance and nature of the expected changes, the projected maps were clipped by the binary distribution map from Metreveli et al. (2023). Subsequently, paired statistical tests (t-tests and Wilcoxon) were performed between the maps, and summary statistics were calculated to assess differences in Ca. sativa growth among the SSP126, SSP370, and SSP585 scenarios. Predicted growth across scenarios was visualized through the boxplots. Spatial difference maps were created by subtracting current growth predictions from future estimates, and areas were classified into three categories: increase, decrease, or no change. These classified rasters were then stacked and mapped to highlight spatial patterns of growth variation under each climate scenario. To measure how uncertain our growth projections are, we used the standard errors from the GAM predictions and used them to construct 95% confidence intervals (CI) for each raster cell (fit ± 1.96 × SE). This made three layers for each scenario: expected growth (fit), lower CI, and upper CI. We also found CI width (upper95 – lower95) to show geographic uncertainty and used mean, median, and maximum values to summarize it across scenarios. Lastly, we used density maps to show how uncertainty was spread out over all the grid cells (Beaumont et al., 2008).
3 Results
3.1 Modeling Castanea sativa growth
The six candidate models were chosen based on the Mean Squared Error (MSE) and with the significance tests. Among the candidate generalized additive models (GAMs), the best-performing model was identified by the lowest Akaike Information Criterion (AIC = 749.70). This model included BIO6 (Minimum Temperature of the Coldest Month, °C), BIO17 (Precipitation of the Driest Quarter, mm), Soil pH (H₂O), Nitrogen content (mg/kg), and Age (years) (Table 2).
Table 2
| N | Model variables | MSE | AIC |
|---|---|---|---|
| 1. | BIO6 (Min temp of coldest month, °C), BIO17 (Precipitation of driest quarter, mm), Soil pH (H₂O), Nitrogen (mg/kg), Age (years) | 1.74 | 749.70 |
| 2. | BIO11 (Mean temp of coldest quarter, °C), Silt (%), Coarse Fragments (cm3), Nitrogen (mg/kg), Age (years) | 1.77 | 752.17 |
| 3. | BIO1 (Annual mean temp, °C), Nitrogen (mg/kg), Age (years) | 1.73 | 754.48 |
| 4. | BIO9 (Mean temp of driest quarter, °C), Coarse fragments (cm3), Age (years) | 1.73 | 755.27 |
| 5. | Silt (%), Nitrogen (mg/kg), Age (years) | 1.74 | 756.61 |
| 6. | BIO1 (Annual mean temp, °C), coarse fragments (cm3), Age (years) | 1.79 | 758.20 |
Mean squared error (MSE) and Akaike information criterion (AIC) of the top 6 models.
The variables in the best model showed varying ranges and distributions. The sample of Ca. sativa trees had a skewed distribution toward lower average annual growth, with the majority of them recorded below 5 mm. The ages of the examined trees varied from around 9 to 151 years, with the majority falling between 25 and 75 years, indicating a positively skewed distribution. Climatic conditions revealed that the sampled trees mostly inhabited areas where the lowest temperature of the coldest month ranged from roughly −7.5 °C to −1 °C and precipitation during the driest quarter generally fluctuated between 100- and 400-mm. Soil characteristics showed a unimodal distribution for pH, centered between 5 and 6.5. The nitrogen content typically varied from approximately 200 to 500 mg/kg (Figure 2).
Figure 2
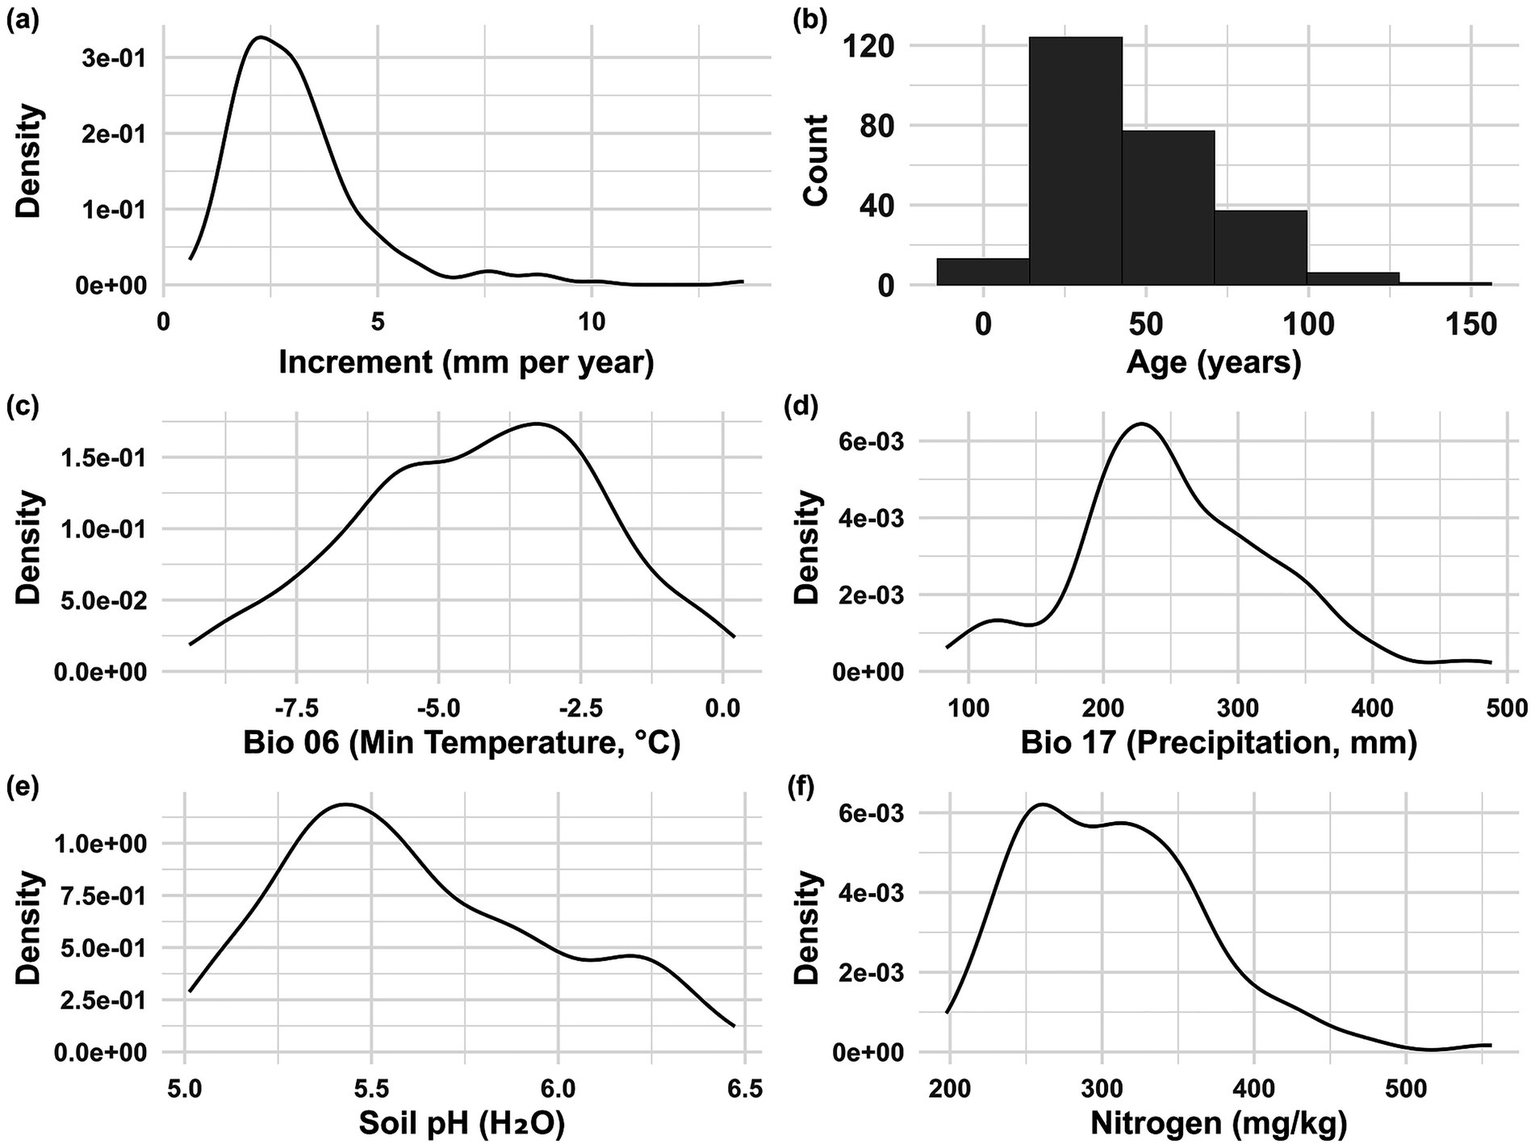
Density distributions of predictor variables used to model average annual growth of Ca. sativa across the Caucasus ecoregion. Panels: (a) Average annual growth (mm year-1); (b) Age (years); (c) BIO6—Minimum temperature of the coldest month (°C); (d) BIO17—Precipitation of the driest quarter (mm); (e) Soil pH (H₂O); (f) Soil nitrogen (mg/kg). See Table 1 for detailed variable descriptions.
The best model (GAM with Gamma distribution and log link) explained 43.8% of the variance in the average growth of Ca. sativa and 46.9% of the deviance (adjusted R2 = 0.438). Age exerted the strongest nonlinear influence on growth (p < 0.001), while climatic (Precipitation of the Driest Quarter - BIO17; Minimum Temperature of the Coldest Month - BIO6) and edaphic variables (Nitrogen content (mg/kg) and Soil pH) also contributed significantly (p < 0.05 for all smooth terms). Growth declined markedly with increasing stand age, with a pronounced nonlinear decrease after approximately 50 years. BIO17 showed a negative linear relationship, indicating reduced growth above ~100 mm of precipitation. Nitrogen content and BIO6 displayed significant positive linear associations with growth, whereas soil pH was negatively related, with growth declining slightly at higher pH values (Figure 3). Residual diagnostics confirmed the suitability of the Gamma distribution, with residuals centered around zero, no evidence of heteroscedasticity, and only minor deviations in the tails (Supplementary Figure 3) (Wood, 2017; Simpson, 2022). Concurvity analysis indicated low to moderate correlations among predictors, suggesting largely independent contributions to the model. Moderate concurvity was detected between soil pH and nitrogen, whereas Age and BIO17 exhibited low concurvity, supporting their strong and independent effects (Supplementary Figure 4) (Kovács, 2024).
Figure 3
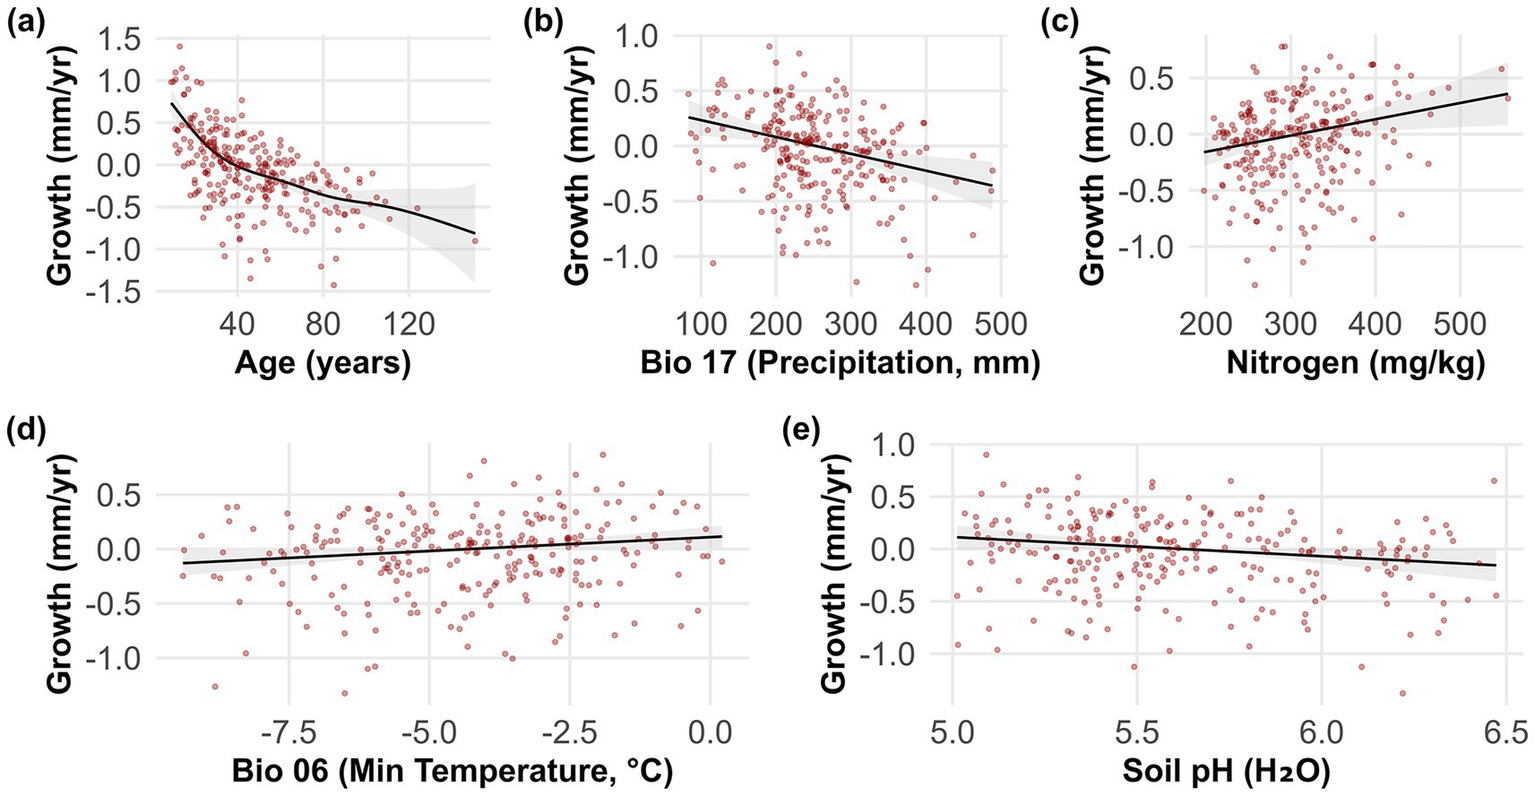
Partial residual plots from the best generalized additive model (GAM), showing the relationships between predictor variables and Castanea sativa in the Caucasus. Panels show the effects of: (a) Age (years, negative exponential effect-like function), (b) BIO17 (precipitation of the driest quarter, negative linear relationship with an approximate slope of −0.0015), (c) Nitrogen (mg/kg, positive linear relationship with an approximate slope of +0.0012), (d) BIO6 (minimum temperature of the coldest month, °C, slight positive linear effect with an approximate slope of +0.07), and (e) Soil pH (H₂O, slight negative linear effect with an approximate slope of −0.30). Shaded areas represent 95% Bayesian confidence intervals. See Table 1 for predictor descriptions.
The combined effects of the independent variables highlight the complexity and interrelation of age, climate, and soil factors in regulating Ca. sativa growth. The average annual growth is greatest in younger stands (typically under 50 years) and decreases rapidly in older stands. Highest growth is achieved with moderately mild winter temperatures, reduced precipitation during the driest quarter, elevated soil nitrogen levels, and strongly to moderately acidic soil pH. In contrast, growth significantly declines with longer stand ages, colder winter temperatures, reduced nitrogen availability, excessive moisture, and near-neutral soil pH (Figure 4).
Figure 4
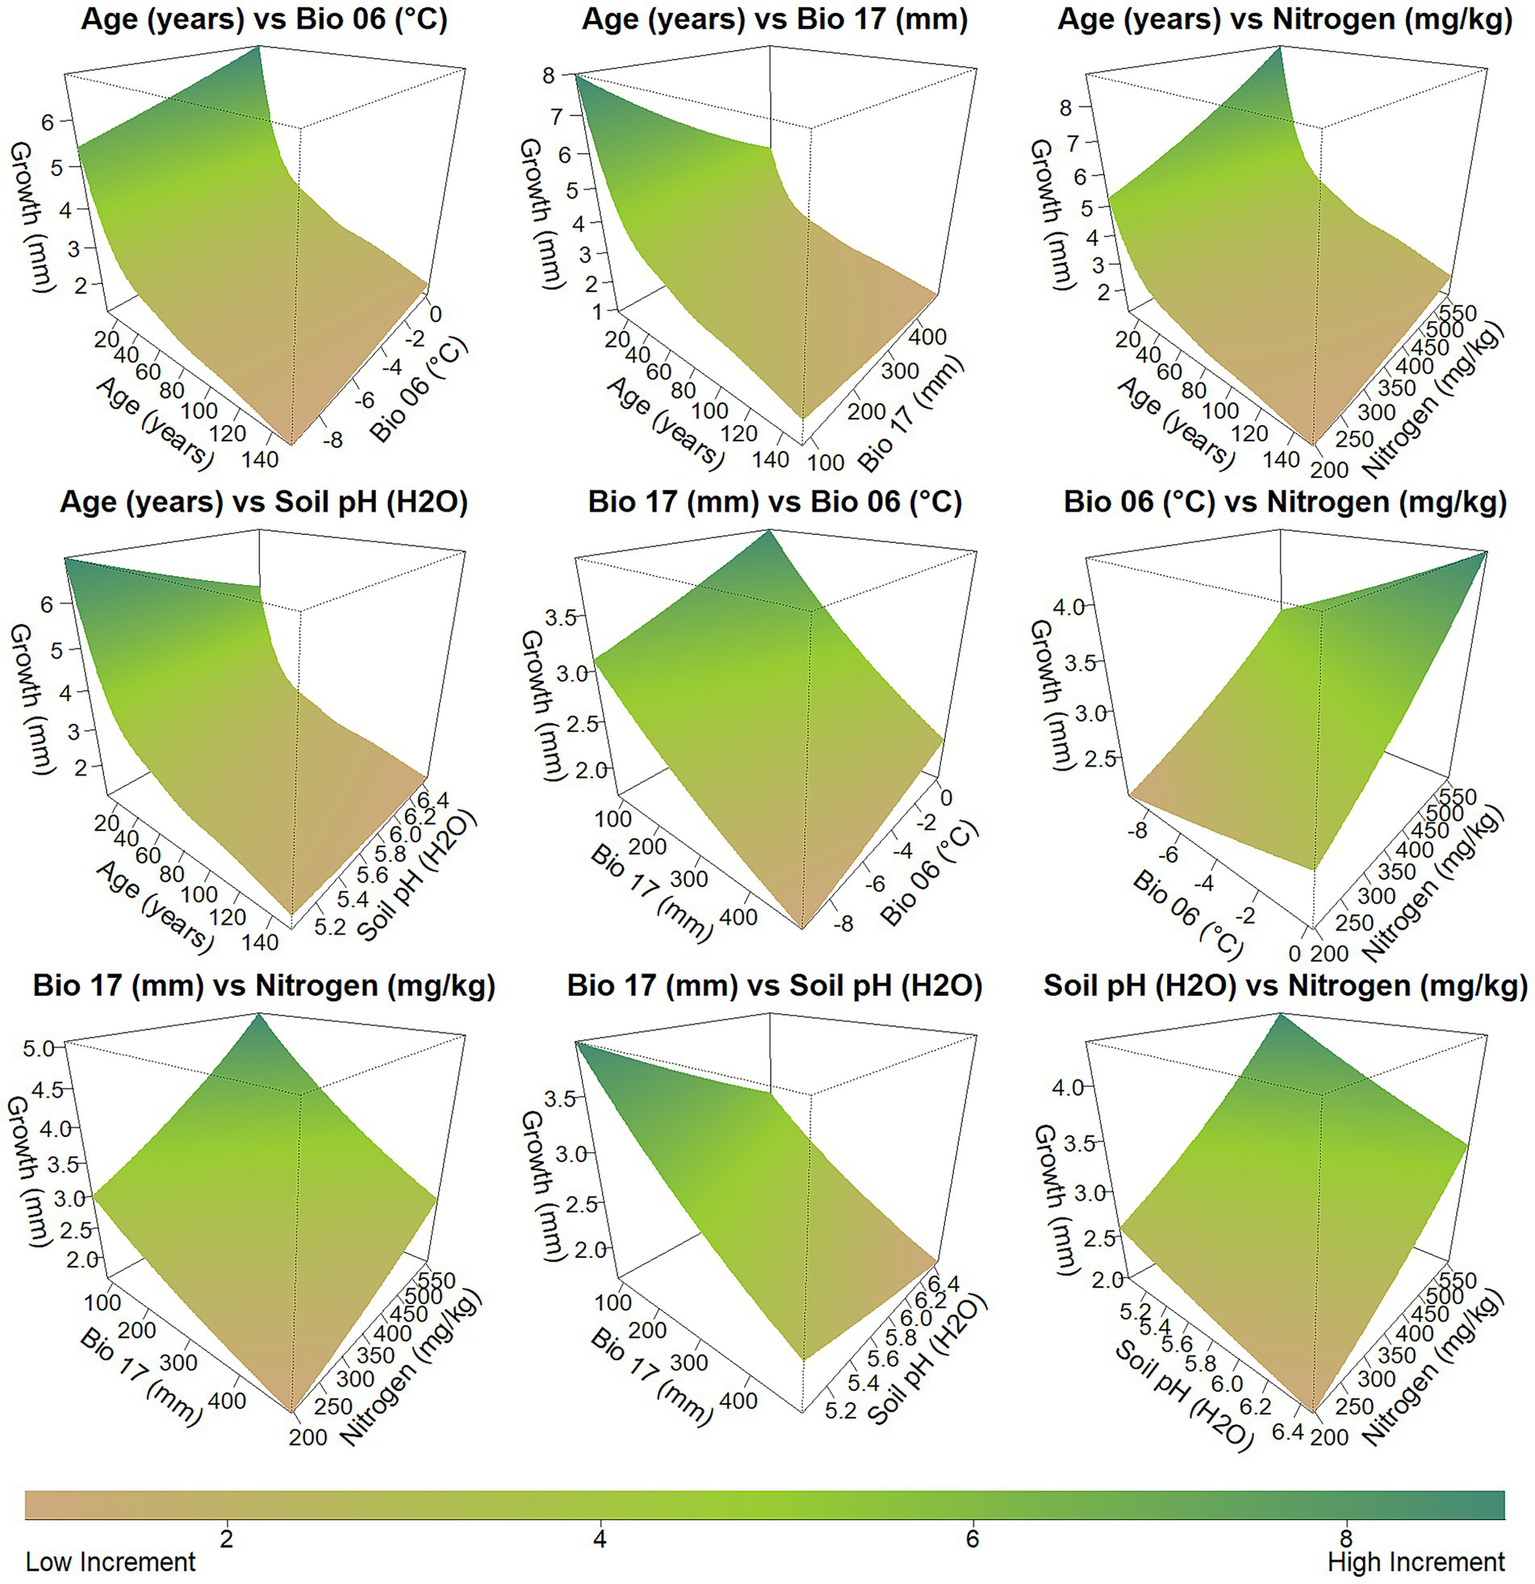
3D plots showing the GAM-fitted relationships between pairs of predictor variables and average annual growth of Castanea sativa in the Caucasus. Each surface Partial effect plots from the GAM analysis showing the smooth effects of individual predictors on average annual growth (mm year−1). Growth increases from brown (low average annual growth) to green (high average annual growth). Axes represent observed data ranges. See Table 1 for detailed descriptions of predictor variables.
The modelled growth maps indicate that the best conditions for Ca. sativa growth are mostly located in the western segment of the Caucasus ecoregion (Figure 5). Significant average annual growth over 3.5 mm are anticipated in the Kolkheti lowlands and along the Greater Caucasus mountain ranges, including substantial areas of western Georgia and extending into southern sections of the Russian Federation. Similarly, favorable conditions exist in the western portion of the Lesser Caucasus, particularly in southern Georgia and northwestern Turkey, indicative of beneficial climatic and soil conditions. In contrast, regions exhibiting smaller or negligible average annual growth (1.6–2.0 mm/a) include central and southeastern Georgia, large areas of northeastern Azerbaijan, northern Iran, and Armenia. Moderate average annual growth, reflecting intermediate ecological suitability, are seen in the south of the Russian Federation, eastern Georgia and southeastern Azerbaijan (Figure 5).
Figure 5
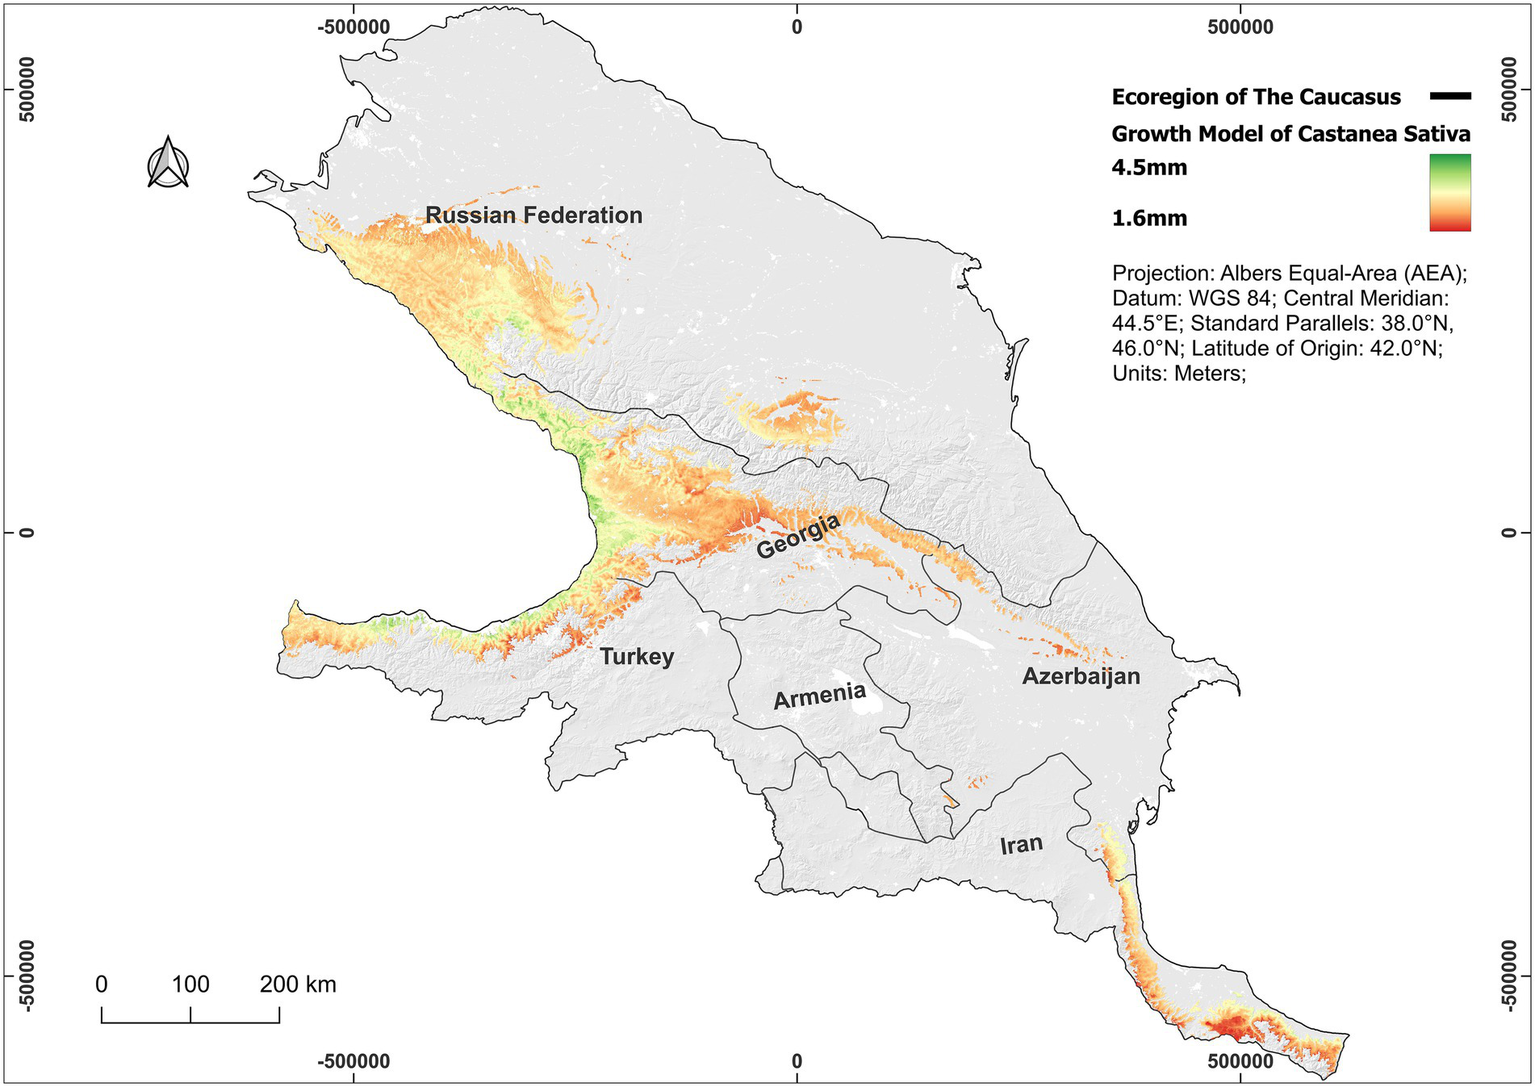
Modeled growth of Castanea sativa across the Caucasus Ecoregion at a resolution of 100×100 m. Growth predictions (mm/year), estimated using the best-fitting GAM, range from 1.6 mm (low, red) to 4.5 mm (high, green). Values are for visual interpretation and may not reflect local microsite variability. See Table 1 for details on model predictors.
3.2 Spatial patterns of Castanea sativa growth and habitat suitability
The analyzed spatial patterns of growth prediction and species habitat suitability indicated a moderate, positive, and highly significant correlation (r = 0.30, p < 0.001) and clear spatial heterogeneity. The model predicted that growth increases by approximately 0.47 mm for every 0.1-unit (on a standardized 0–1 scale) increase in habitat suitability, highlighting a meaningful, though modest, relationship (Supplementary Figure 5). The majority of the area exhibited moderately positive differences, indicating that the habitat suitability model slightly overestimated the growth model in central regions. However, notable negative differences were evident along certain edges and peripheries (Figure 6).
Figure 6
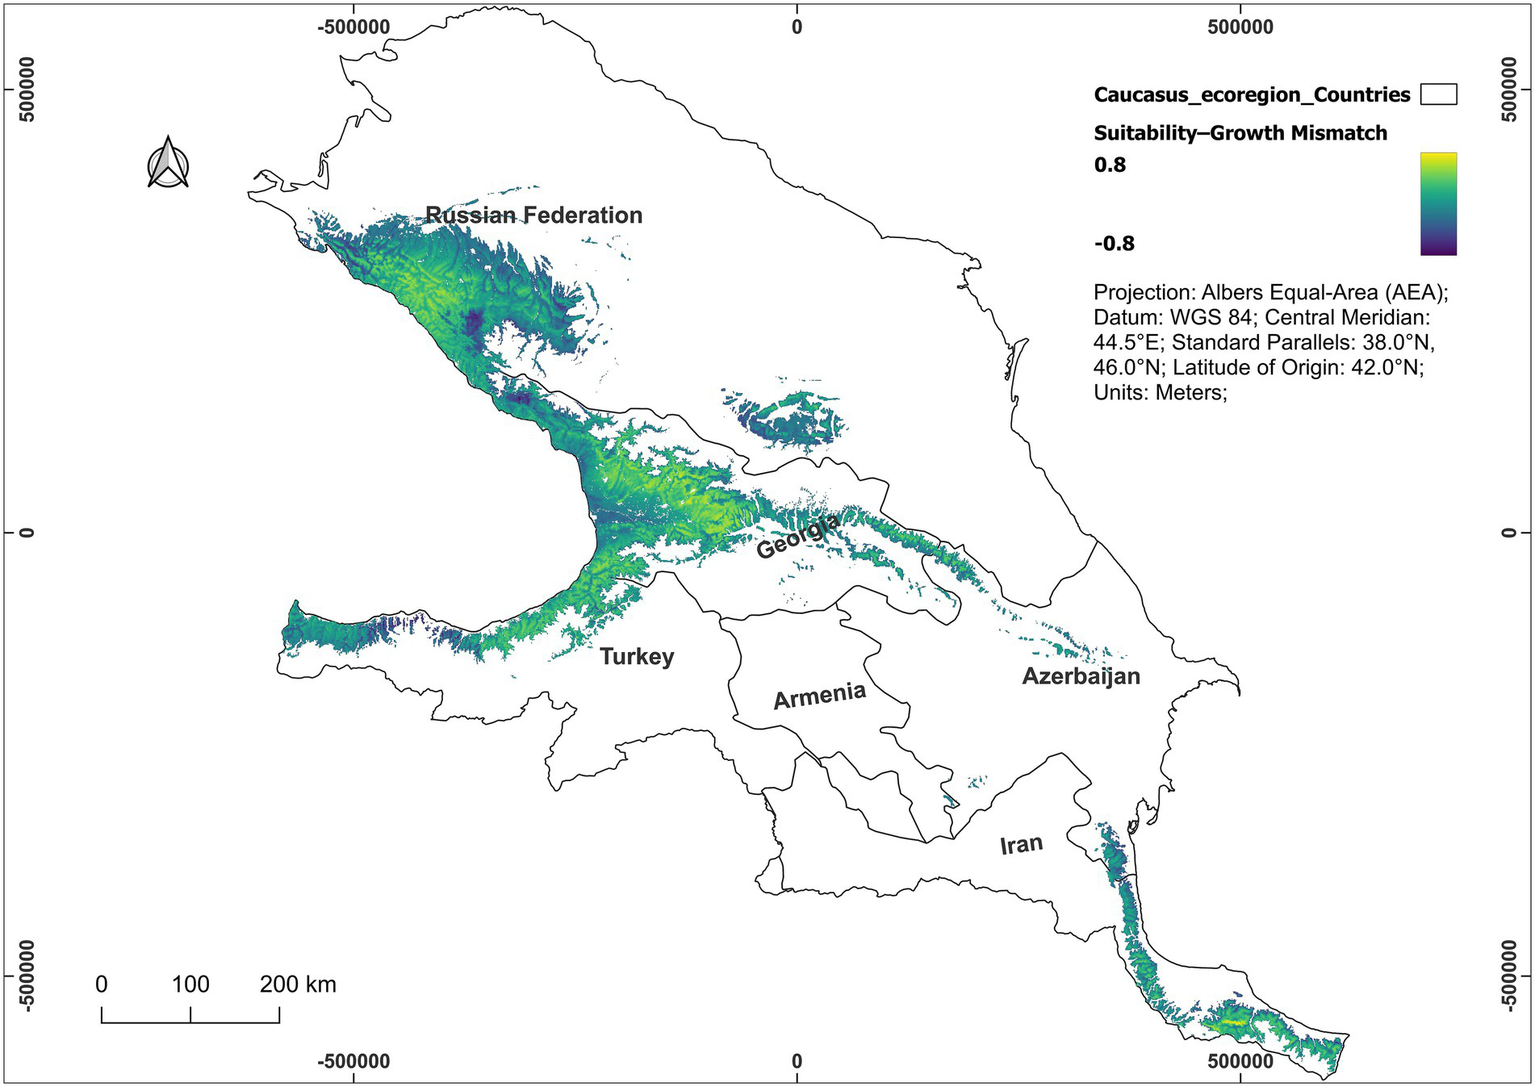
Spatial difference map between habitat suitability (distribution) and growth potential of Castanea sativa in the Caucasus Ecoregion. Values represent the standardized difference between the normalized habitat suitability model and the growth model, with positive values indicating areas more suitable for presence than for growth and negative values indicating the reverse. The color gradient shows the magnitude of difference, from −0.8 (growth > habitat suitability) to +0.8 (habitat suitability > growth).
3.3 Projected growth under climate change scenarios
The growth of Ca. sativa under current conditions and three future climatic scenarios (SSP126, SSP370, and SSP585) during the period 2071–2,100 is undergoing major temporal changes. The average growth significantly decreased under SSP126 (mean difference = −0.34, p < 2.2e-16) and SSP370 (mean difference = −0.04, p < 2.2e-16), but a slight yet significant rise was seen under SSP585 (mean difference = 0.02, p < 2.2e-16). Wilcoxon signed-rank tests validate these findings, demonstrating very significant changes in growth across all prospective scenarios. The boxplot visualization supports these statistical results, clearly demonstrating that SSP126 has the most significant negative effect relative to present conditions, whereas SSP585 reflects a little gain, and SSP370 maintains around current growth levels (Figure 7).
Figure 7
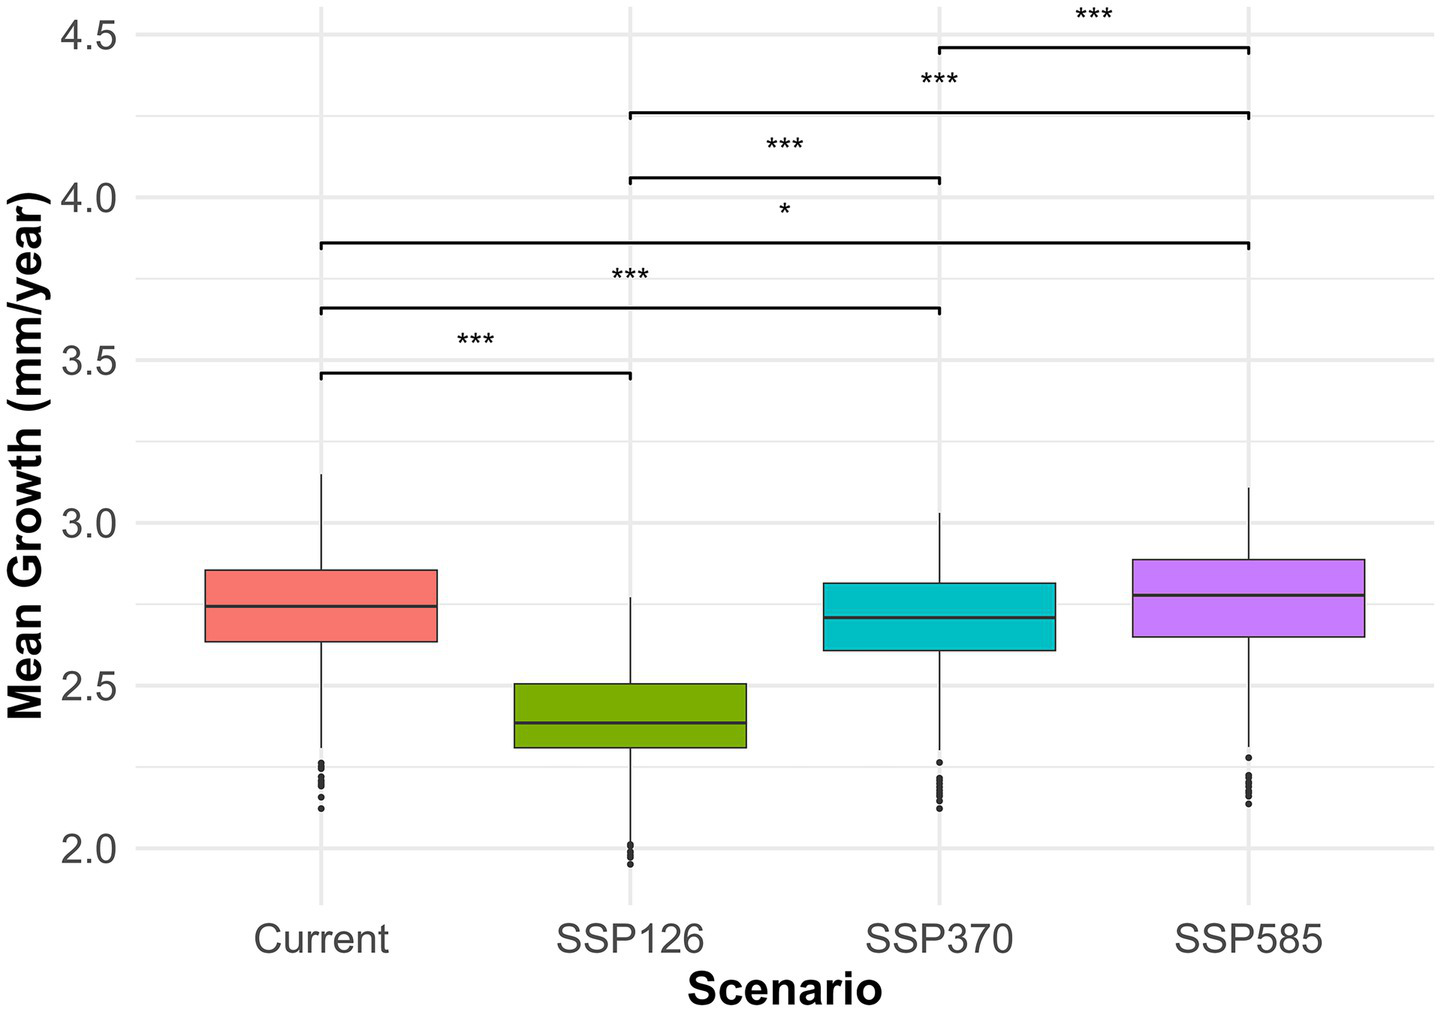
Boxplot comparison of predicted Castanea sativa growth under current climate and three future climate change scenarios (SSP126, SSP370, and SSP585). Growth predictions are based on GAM outputs. Asterisks indicate statistically significant pairwise differences between scenarios (****p < 0.0001). Growth is measured in mm/year. Color-coded boxplots correspond to scenarios shown in the legend.
The predicted maps depict major shifts in the geographical distribution of average annual growth under several future climatic scenarios (2071–2,100) in comparison to present conditions. In the low-emission scenario SSP126, the geographical distribution mostly mirrors current patterns, while the intensity of growth shows reduction, especially in formerly advantageous regions. The intermediate-emission scenario SSP370 indicates a geographical extension of optimum growth conditions into central and southern regions, demonstrating improved suitability in some locations despite a general mild decline. Conversely, the high-emission scenario SSP585 demonstrates the most notable geographical alterations, characterized by a distinct northern and upper transition in growth suitability and increased growth in formerly marginal areas, indicating adaptive regional adjustments despite the overall stress seen in other locations (Figure 8).
Figure 8
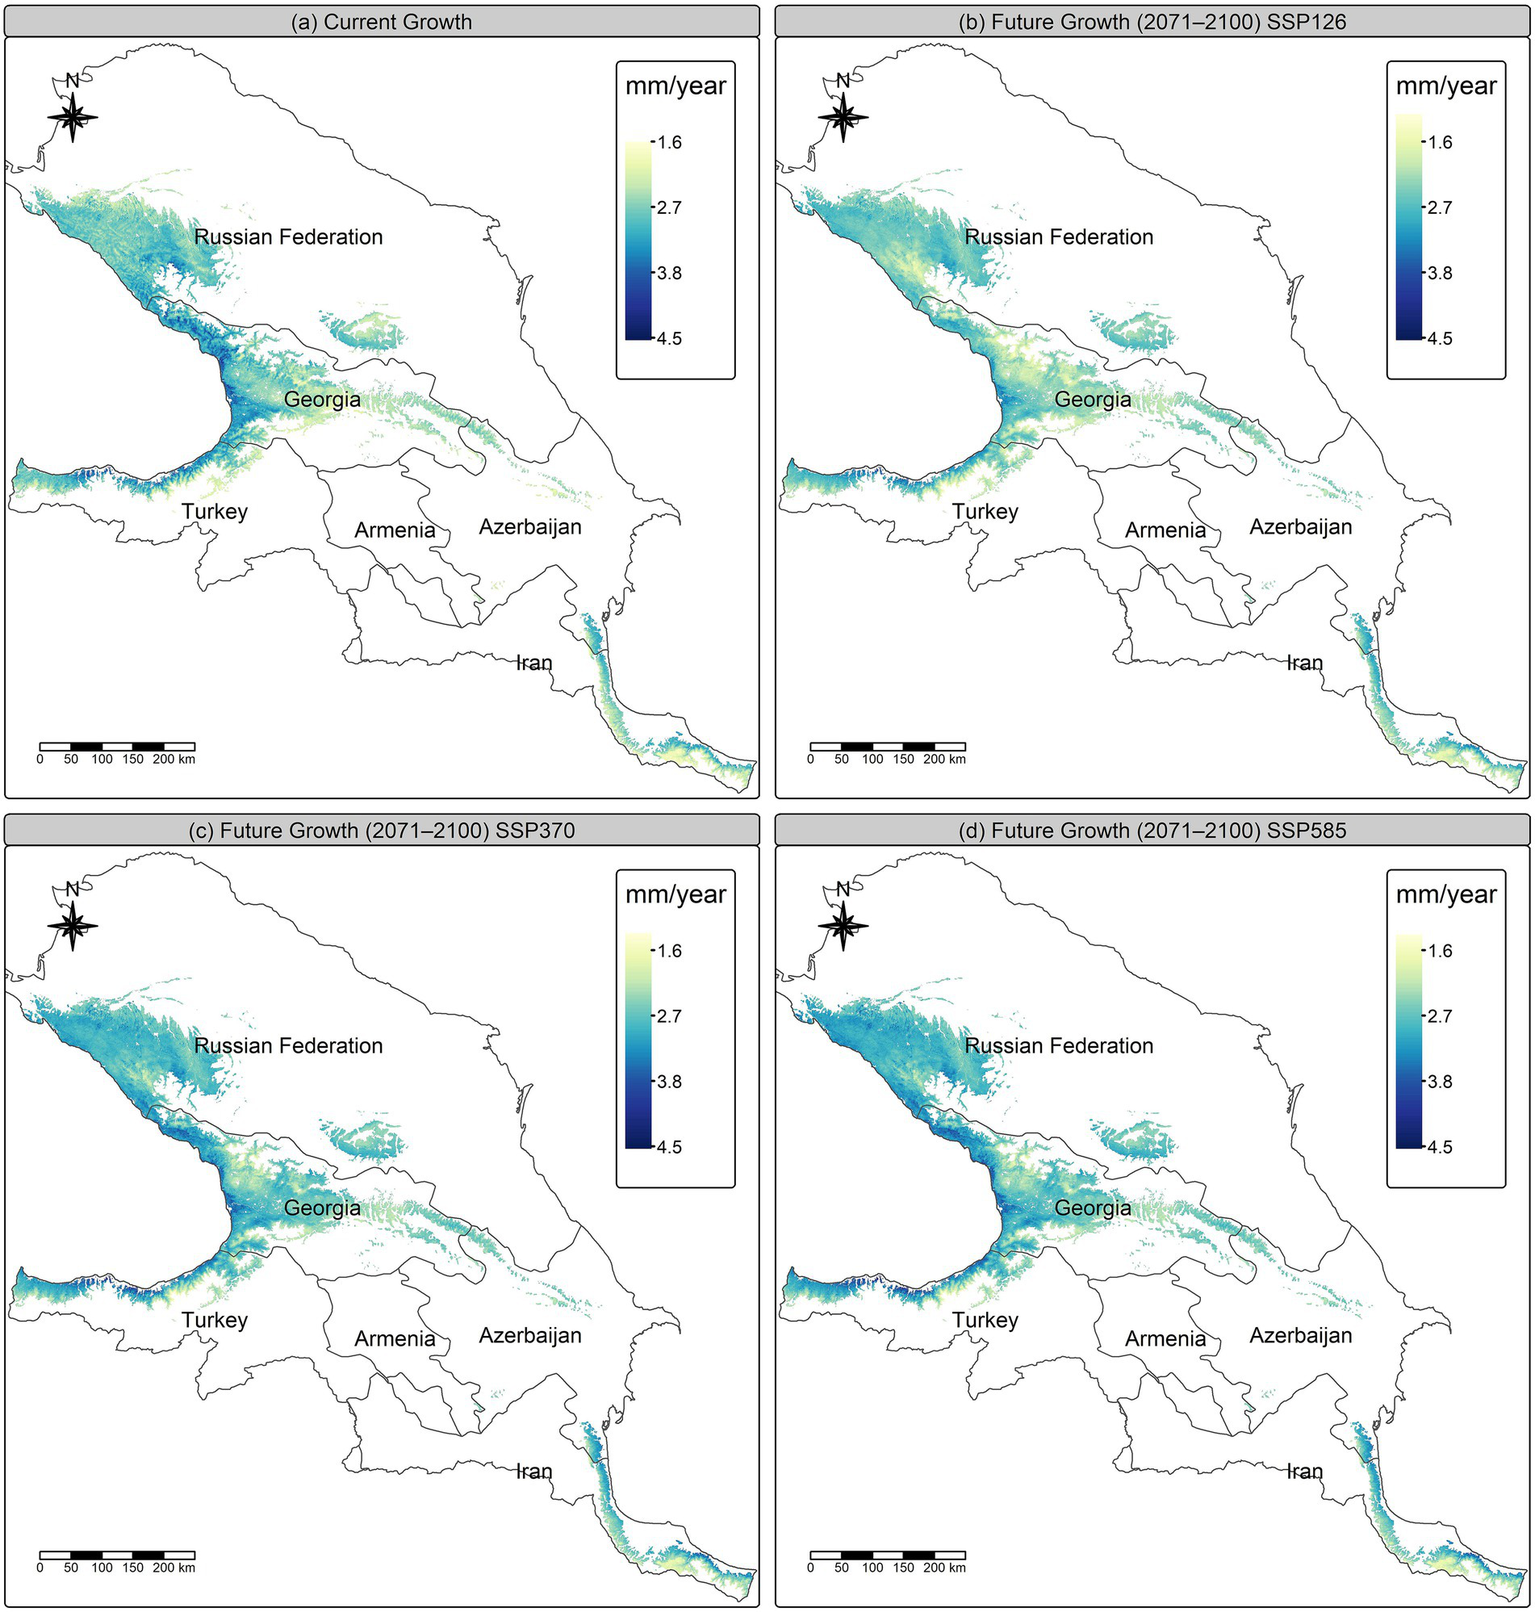
Predicted Castanea sativa growth under current and future climate scenarios across the Caucasus Ecoregion. (a) Current growth and future projections for the period 2071–2,100 under (b) SSP126, (c) SSP370, and (d) SSP585 scenarios. Cell values represent GAM-predicted growth (mm/year). Maps are shown at 250 m resolution. The color scale indicates relative growth magnitude from low (1.6 mm) to high (4.5 mm).
The confidence bounds for expected growth exhibited consistent regional patterns across scenarios (SSP), whereas growth uncertainty, shown by confidence interval width, displayed spatial heterogeneity. Core distribution areas of C. sativa had narrow intervals, while distribution margins and locations with less training data had more growth uncertainty. The growth uncertainty was low across all pixels, with median confidence interval widths of about 0.7 mm/year under the current climate and about 0.9 mm/year under future scenarios. Most readings stayed below 1.5 mm/year.
4 Discussion
This study provides a comprehensive assessment of growth dynamics for Ca. sativa within the Caucasus region. Based on new dendroecological measurements of 258 wood cores, it clarifies the roles of climate, soil, age, and terrain-related variables by applying a Generalized Additive Model (GAM) framework on annual tree ring growth. The best model, selected based on the lowest Akaike Information Criterion (AIC), included the following predictors: minimum temperature of the coldest month, precipitation of the driest quarter, soil pH, nitrogen content, and tree age. These variables reflect a combination of climatic, edaphic, and biological factors, highlighting the multifactorial nature of tree growth. The final model explained 43.8% of the variance in Ca. sativa growth (R2 = 0.438). While this indicates that a substantial proportion of variance remains unexplained, such values are typical in dendrochronological modeling. It is common when relating growth to climate and soil variables (Rozas, 2005).
4.1 Model of Castanea sativa growth
Generalized additive models revealed tree age as the primary factor affecting Ca. sativa growth, exhibiting a significant nonlinear negative relationship. Younger stands (typically under 50 years) demonstrated markedly greater average annual growth compared to older stands, aligning with established physiological processes (Sillett et al., 2010). The decline associated with aging can be linked to reduced nutrient uptake efficiency, changes in carbon allocation favoring maintenance rather than growth, and hydraulic constraints typically seen in mature trees (Sillett et al., 2010).
Climatic factors were also essential in affecting growth. A positive correlation exists between the minimum temperature of the coldest month and average annual growth. This finding is consistent with observations in other temperate tree species, indicating that winter and early spring warmth facilitates the earlier onset of physiological processes (Rashid et al., 2024). In contrast, increased precipitation in the driest quarter adversely affected growth. A combination of climate variables indicates that optimal growth occurs with moderately mild winter temperatures and less precipitation during the driest quarter. The driest quarter for Georgia has been calculated using data from local climate stations near our sample plots. The findings indicate that January, February, and March represent the driest months within the distribution zone of Ca. sativa in the Caucasus. Consequently, the driest quarter encompasses the precipitation recorded during these specific months (Supplementary Figure 6). Usually, late winter and early spring precipitation can induce stress in trees at any developmental stage, especially under low-temperature conditions (Klisz et al., 2022). Particularly in early spring when they initiate active biological processes (Ziaco et al., 2016). Ca. sativa prefers predominantly sunny environments (Conedera et al., 2021). As a result, the snow melts during the daytime and infiltrates the soil. At night, temperatures drop significantly, resulting in ground frost that may adversely affect the roots (Inouye, 2000; Reinmann et al., 2019). The results of the combined effect indicate that (Figure 3), an increase in the temperature of the coldest month corresponds with a decrease in the influential effect of precipitation. This supports the assertion that a higher temperature in the coldest month, indicative of a mild winter, correlates with reduced freezing of soil water (Domisch et al., 2018).
While several studies have documented a beneficial impact of spring or early summer precipitation on Ca. sativa growth throughout Europe. (Fonti and García-González, 2004; Waldboth and Oberhuber, 2009; Lebourgeois et al., 2013; Yılmaz, 2015; Camisón et al., 2016; Marini et al., 2019; Garcia-Barreda et al., 2021; Weise et al., 2025). However, our analysis did not identify significant relationships with precipitation outside the driest quarter. Instead, we found a negative correlation with precipitation during the driest quarter (January–March in the Caucasus). We believe that this disparity is associated with the regional climatic conditions. Most of the chestnut stands in the data we have are in areas that already get the right amount of rain. More rain or snow in late winter and early spring may not help plants develop, but instead cause stress. This is because freezing and melting cycles can freeze the soil and harm roots when cambial activity starts. In these circumstances, more precipitation does not alleviate drought, but instead, it exacerbates abiotic stress, thus explaining the negative impact reported in our model (Reinmann et al., 2019).
The significance of Soil pH (H₂O) and Nitrogen content (mg/kg) in the model highlights their vital role in soil fertility and nutrient availability for average annual growth, corroborating findings from other studies that demonstrate that optimal nutrient availability and acidity improve tree vitality and productivity (Andersson et al., 2000; Ouimet and Moore, 2015). The nitrogen concentration in the soil demonstrated a strong positive association with average annual growth, underscoring nitrogen’s essential function in tree biomass accumulation. Optimal development rates correlated with increased nitrogen concentrations (400–550 mg/kg), affirming nitrogen as a critical limiting resource in forest ecosystems (Ouimet and Moore, 2015). Conversely, soil pH had a comparatively lower but statistically significant negative impact on Ca. sativa growth, suggesting that an increase in soil pH (i.e., decreased acidity) correlates with a decline in growth. This trend indicates that Ca. sativa trees prefer more acidic soil conditions, often associated with lower pH values (Velizarova, 2015). The observed distribution of Ca. sativa (Figure 6) also indicates the species’ adaptability to strongly and moderately acidic forest soils. These may enhance food availability and microbial interactions conducive to Ca. sativa physiology (Álvarez-Álvarez et al., 2025). The combined effects of Nitrogen and PH on the growth indicate that optimum development occurs at higher soil nitrogen concentrations (~400–550 mg/kg) and a strongly to moderately acidic soil pH (about 5.0–6.0).
The spatial model identified certain regional trends in Ca. sativa potential for growth with higher average annual growth mostly found in the western Caucasus region, particularly in the Kolkheti plains and the areas along the Greater Caucasus mountains. These locations display favorable climate and soil conditions since they also represent the refugial habitats from the last glacial maximum (Tarkhnishvili et al., 2012; Gavashelishvili and Tarkhnishvili, 2016). In contrast, areas with reduced growth potential, including central and southern Georgia, northeastern Azerbaijan, and northern Iran, indicate regional constraints associated with extreme climate, reduced soil acidity, and human-induced disruptions (Metreveli et al., 2023). Moderate average annual growth, indicative of intermediate ecological suitability, are seen in southern Russia, eastern Georgia, and southeastern Azerbaijan, which also serve as refugial zones from the last glacial maximum (Tarkhnishvili et al., 2012). While these predictions are reliable for regional to ecoregional-scale analysis, careful consideration is necessary when evaluating them at the stand or microsite level. Since the predictor layers came from various original resolutions (1 km2 for climate, 250 m for soil, and 30 m for terrain), resampling to 30 m ensures consistency but may introduce false precision and smooth local heterogeneity. This is especially true in mountainous areas where the temperature, soil, and topography may change quickly over short distances (Nguyen Quang et al., 2024).
4.2 Contrasting patterns of growth potential and species habitat suitability
The correlation between modeled growth and species habitat suitability from Metreveli et al. (2023) gave ecological support for the model but highlighted noticeable geographic variation. Areas where the habitat suitability model overstated growth may indicate suboptimal soil conditions. The soil variables were excluded from that habitat suitability model. Simultaneously, regions with high suitability may be characterized by insufficient light, intense competition, or limited water availability for growth. Moreover, it is known that competition is more important than climate for average annual growth (Gómez-Aparicio et al., 2011). Conversely, the overestimated growth in outlying places suggests that Ca. sativa has different physiological strategies that facilitate varying growth rates in areas of low suitability. Distinct climatic conditions might promote dispersal but are not conducive to growth (Serra-Diaz et al., 2013). The previous study on habitat suitability revealed that winter temperature and precipitation significantly influence Ca. sativa dispersion (Metreveli et al., 2023). In the initial stages of tree development, winter precipitation, particularly snow, has a substantial influence on Ca. sativa survival (Suvanto et al., 2017). Nonetheless, it may provoke stress for growth (Domisch et al., 2018). Nevertheless, the inconsistency, the models exhibit a significant positive relationship (r = 0.3). The models were weakly to moderately correlated, likely reflecting differences in the underlying predictors. In addition, further investigation is needed to clarify the distinct contributions of geographical scaling and temporal resolution in the divergence between these two methodologies (Serra-Diaz et al., 2013).
4.3 Projected growth under climate change scenarios
Maps based on several future climatic scenarios (SSP126, SSP370, and SSP585) revealed considerable regional and temporal discrepancies in growth potential. Further study of the variables across several scenarios revealed that SSP370 to SSP585 indicates a higher warming level than SSP126 (Supplementary Figure 7). Nonetheless, SSP126 has more precipitation compared to the Current SSP370 and SSP585 scenarios (Supplementary Figure 8). This may serve as the primary elucidation of the growth alteration. Significant declines in growth were predicted in the low-emission scenario (SSP126), indicating that little warming combined with rising precipitation patterns intensifies current environmental stresses. The intermediate-emission scenario (SSP370) predicted rather steady growth conditions, suggesting a possible balance between rising temperatures and moisture availability. The high-emission scenario (SSP585) forecasted slight increases in average growth, accompanied by substantial northward and altitudinal changes in optimum growth conditions.
The density plot of the confidence interval width (Supplementary Figure 9) shows that the uncertainty in expected growth is small in all scenarios. The peaks are approximately 0.7 mm/year now and about 0.9 mm/year in the future. Very few grid cells have growth rates higher than 1.5 mm/year, which supports the idea that growth projections are strong even though there is a little more uncertainty with SSP370 and SSP585. We demonstrate the reliability of our growth estimates for C. sativa by explicitly mapping and quantifying projection uncertainty, revealing narrow confidence ranges throughout much of the distribution. Places where growth was less predictable were mostly located around range edges, where the test dataset fails to perform an adequate job of representing climate and edaphic conditions. Even though growth uncertainty rose in more severe climate change scenarios, the overall size stayed small (median CI widths <1 mm/year), which means that the predicted patterns of growth rise or decrease are probably not due to model error. However, our research did not consider inter-model heterogeneity among GCMs which may further expand the spectrum of potential outcomes (Beaumont et al., 2007).
Subsequent evaluations of expected development variations illustrate alterations in projected Ca. sativa growth. In the lowest emissions scenario (SSP126), there is a distinct number of regions exhibiting a decline in growth, with only isolated areas of growth at the outer edges. The assessments for the remaining two scenarios (SSP370, SSP585) show very similar trends and regions of decline and increase. The geographical distribution changes markedly, exhibiting a major expansion of favorable growth zones toward the northern periphery and central areas, whereas large portions of the Kolkheti plain and southern parts persist in demonstrating reduced average annual growth. These scenarios together indicate that climate change would likely result in significant regional changes in Ca. sativa growth suitability, with some peripheral places possibly gaining advantages while regions now exhibiting high growth rates face considerable decreases (Supplementary Figure 10).
These findings are contrary to the distribution models proposed by Beridze et al. (2023). Which indicates a significant reduction of appropriate habitat by the end of the century. Our analysis suggests that the growth potential in many regions of the Caucasus remains largely steady or may even improve marginally, particularly under intermediate and high-emission scenarios (SSP370 and SSP585). These contrasting results suggest that although the overall distribution may shrink, surviving populations could remain productive, underscoring the value of integrating distribution and growth-based approaches for a fuller understanding of species responses to climate change (Brook et al., 2009).
Several important factors influencing Ca. sativa growth were not included due to data limitations. Competition indices and stand density are key drivers, but the National Forest Inventory does not allow consistent assessment of competitor trees; instead, we sampled trees of average DBH to reduce extreme competition effects (Pretzsch, 2009). Light availability could not be quantified reliably because fisheye canopy photos were obstructed in many plots by dense understory vegetation such as Rhododendron ponticum L., Chestnut blight (Cr. parasitica) also affects growth, but its impact is stage-dependent and environmentally modulated (Metreveli et al., 2024), and with only one core per tree, disturbance signals could not be detected. This omission likely contributes to the moderate explanatory power of the model (R2 = 0.438).
Due to data limitations, certain significant elements that affect the development of Ca. sativa were not included. Inter and Intraspecific competition indices and stand density are significant factors; however, the National Forest Inventory does not provide a consistent evaluation of competitor trees. Consequently, sampled trees with average DBH mitigate the impact of intense competition (Pretzsch, 2009). It was not possible to accurately measure light availability because thick understory plants like Rhododendron ponticum L. obstructed fisheye canopy photographs in several locations. Chestnut blight (Cr. parasitica) also impacts growth, but its influence is stage-dependent and largely influenced by the environment (Metreveli et al., 2024). In addition, with only one core per tree, disturbance signals could not be identified. These exclusions probably make the model’s explanatory power relatively low (R2 = 0.438). Although the growth and habitat suitability of Ca. sativa are predominantly influenced by abiotic variables, human activities, habitat modifications, and pests and diseases are progressively affecting growth patterns (Conedera et al., 2024; Connor, 2011; Metreveli et al., 2024). Additionally, including environmental data at various spatial resolutions (1 km2, 30 m, 250 m) may result in scale discrepancies among the diverse landscapes of the Caucasus, hence reducing the accuracy of targeted predictions (Verburg et al., 2011). To address these challenges in the future, it will be important to add the mentioned drivers and ensure that spatial data resolutions are the same.
5 Conclusion
Our study provides new perspectives on the determinants of growth of Ca. sativa within the ecologically diverse Caucasus region based on new dendroecological measurements and generalized additive modelling. Our results highlight the interrelated influence of climate, soil chemistry, and tree age on growth. Specifically, our models identified age, minimum temperature of coldest month, precipitation in the driest quarter, soil nitrogen, and acidity as key determinants of Ca. sativa growth. Spatial investigation indicated that favorable growth circumstances are primarily found in western mountainous areas and the lowlands, whereas central and southeastern regions have restricted growth potential. Future climatic scenarios (2071–2,100) forecast geographically heterogeneous responses, characterized by growth reductions under low emissions (SSP126), stability under intermediate conditions (SSP370), and marginal enhancements under high-emission scenarios (SSP585), accompanied by significant altitudinal and latitudinal shifts. These findings emphasize the necessity of accounting for local-scale environmental interactions and recommend the incorporation of dendrochronological growth evaluations into comprehensive ecological forecasting models to improve adaptive forest management strategies in the context of climate change.
Statements
Data availability statement
The datasets presented in this study can be found in online repositories. The names of the repository/repositories and accession number(s) can be found at: https://doi.org/10.5281/zenodo.15374527.
Author contributions
VM: Conceptualization, Data curation, Formal analysis, Investigation, Methodology, Project administration, Resources, Software, Validation, Visualization, Writing – original draft, Funding acquisition, Writing – review & editing. HK: Conceptualization, Funding acquisition, Investigation, Supervision, Visualization, Writing – review & editing. ZJ: Conceptualization, Formal analysis, Investigation, Visualization, Writing – review & editing. SM: Data curation, Software, Writing – review & editing. GC: Data curation, Software, Writing – review & editing. IA: Conceptualization, Formal analysis, Investigation, Visualization, Writing – review & editing. AG: Conceptualization, Funding acquisition, Investigation, Methodology, Resources, Supervision, Validation, Visualization, Writing – review & editing.
Funding
The author(s) declare that financial support was received for the research and/or publication of this article. This research was funded by the Volkswagen Stiftung in the framework of the joint project “Structured Education – Quality Assurance – Freedom to Think” (Grant No. 04/46) and Shota Rustaveli National Science Foundation of Georgia (Grant No. 04/46). Vasil Metreveli was supported by the Carl Friedrich Lehman-Haupt International Doctoral Program.
Acknowledgments
We offer our gratitude to Volkswagen Stiftung in the framework of the joint project “Structured Education – Quality Assurance – Freedom to Think” and Shota Rustaveli National Science Foundation of Georgia and Carl Friedrich Lehman-Haupt International Doctoral Program for financial support. We are grateful to Joachim Puhe for his suggestions and recommendations. We express our gratitude to Mehmet Kürşat Şahin for his support in the collection of field data in Turkey. Furthermore, we are grateful to the Ministry of Environmental Protection and Agriculture of Georgia, for providing the field data.
Conflict of interest
The authors declare that the research was conducted in the absence of any commercial or financial relationships that could be construed as a potential conflict of interest.
Generative AI statement
The authors declare that no Gen AI was used in the creation of this manuscript.
Any alternative text (alt text) provided alongside figures in this article has been generated by Frontiers with the support of artificial intelligence and reasonable efforts have been made to ensure accuracy, including review by the authors wherever possible. If you identify any issues, please contact us.
Publisher’s note
All claims expressed in this article are solely those of the authors and do not necessarily represent those of their affiliated organizations, or those of the publisher, the editors and the reviewers. Any product that may be evaluated in this article, or claim that may be made by its manufacturer, is not guaranteed or endorsed by the publisher.
Supplementary material
The Supplementary material for this article can be found online at: https://www.frontiersin.org/articles/10.3389/ffgc.2025.1670459/full#supplementary-material
References
1
Adams O. S. (1927). Tables for Albers projection. Department of Commerce, U.S. Coast and Geodetic Survey, Special Publication No. 130 (Serial No. 378). Washington, DC: Government Printing Office.
2
Álvarez-Álvarez P. Aviñoa-Arias A. Díaz-Varela E. López-Bao J. V. Pérez-Girón J. C. (2025). Impact of climate change over distribution and potential range of chestnut in the Iberian Peninsula. Front. For. Glob. Change8:1561027. doi: 10.3389/ffgc.2025.1561027
3
Andersson F. O. Ågren G. I. Führer E. (2000). Sustainable tree biomass production. For. Ecol. Manag.132, 51–62. doi: 10.1016/S0378-1127(00)00379-0
4
Beaumont L. J. Hughes L. Pitman A. J. (2008). Why is the choice of future climate scenarios for species distribution modelling important?Ecol. Lett.11, 1135–1146. doi: 10.1111/j.1461-0248.2008.01231.x
5
Beaumont L. J. Pitman A. J. Poulsen M. Hughes L. (2007). Where will species go? Incorporating new advances in climate modelling into projections of species distributions. Glob. Change Biol.13, 1368–1385. doi: 10.1111/j.1365-2486.2007.01357.x
6
Beridze B. Sękiewicz K. Walas Ł. Thomas P. A. Danelia I. Fazaliyev V. et al . (2023). Biodiversity protection against anthropogenic climate change: conservation prioritization of Castanea sativa in the South Caucasus based on genetic and ecological metrics. Ecol. Evol.13:e10068. doi: 10.1002/ece3.10068
7
Brook B. W. Akçakaya H. R. Keith D. A. Mace G. M. Pearson R. G. Araújo M. B. (2009). Integrating bioclimate with population models to improve forecasts of species extinctions under climate change. Biol. Lett.5, 723–725. doi: 10.1098/rsbl.2009.0480
8
Camisón A. Silla F. Camarero J. J. (2016). Influences of the atmospheric patterns on unstable climate-growth associations of western Mediterranean forests. Dendrochronologia40, 130–142. doi: 10.1016/j.dendro.2016.09.004
9
Cernusak L. A. Winter K. Turner B. L. (2010). Leaf nitrogen to phosphorus ratios of tropical trees: experimental assessment of physiological and environmental controls. New Phytol.185, 770–779. doi: 10.1111/j.1469-8137.2009.03106.x
10
Chakrabarti A. Ghosh J. K. (2011). “AIC, BIC and recent advances in model selection” in Philosophy of statistics, Handbook of the Philosophy of Science, vol. 7 (Oxford: North-Holland (Elsevier)), 583–605. doi: 10.1016/B978-0-444-51862-0.50018-6
11
Cienciala E. Russ R. Šantrůčková H. Altman J. Kopáček J. Hůnová I. et al . (2016). Discerning environmental factors affecting current tree growth in Central Europe. Sci. Total Environ.573, 541–554. doi: 10.1016/j.scitotenv.2016.08.115
12
Comerford D. P. Schaberg P. G. Templer P. H. Socci A. M. Campbell J. L. Wallin K. F. (2013). Influence of experimental snow removal on root and canopy physiology of sugar maple trees in a northern hardwood forest. Oecologia171, 261–269. doi: 10.1007/s00442-012-2393-x
13
Conedera M. Krebs P. Gehring E. Wunder J. Hülsmann L. Abegg M. et al . (2021). How future-proof is Sweet chestnut (Castanea sativa) in a global change context?For. Ecol. Manag.494:119320. doi: 10.1016/j.foreco.2021.119320
14
Conedera M. Tinner W. Krebs P. de Rigo D. Caudullo G. San-Miguel-Ayanz J. et al . (2024). Castanea sativa in Europe: Distribution, habitat, usage and threats. Luxembourg: University of Bern.
15
Connor S. E. (2011). A promethean legacy: Late quaternary vegetation history of southern Georgia, the Caucasus. Louvain, Belgium: Peeters.
16
Daniel F. Microsoft Corporation Weston S. Tenenbaum D. (2022a). doParallel: Foreach parallel adaptor for the ‘parallel’ package (R package version 1.0.17). CRAN. doi: 10.32614/CRAN.package.doParallel
17
Daniel F. Ooi H. Calaway R. Microsoft Weston S. (2022b). foreach: Provides Foreach looping construct (R package version 1.5.2). CRAN. doi: 10.32614/CRAN.package.foreach
18
Di Filippo A. Piovesan G. Romagnoli M. Helle G. Gaertner H. (2014). Proceedings of the DENDROSYMPOSIUM 2013: May 8th - 11th, 2013 in Viterbo, Italy. Potsdam: Deutsches GeoForschungsZentrum.
19
Dolukhanov A. (2010). Forest vegetation of Georgia. Tbilisi: Georgia.
20
Domisch T. Martz F. Repo T. Rautio P. (2018). Winter survival of scots pine seedlings under different snow conditions. Tree Physiol.38, 602–616. doi: 10.1093/treephys/tpx111
21
Dormann C. F. Elith J. Bacher S. Buchmann C. Carl G. Carré G. et al . (2013). Collinearity: a review of methods to deal with it and a simulation study evaluating their performance. Ecography36, 27–46. doi: 10.1111/j.1600-0587.2012.07348.x
22
Fonti P. García-González I. (2004). Suitability of chestnut earlywood vessel chronologies for ecological studies. New Phytol.163, 77–86. doi: 10.1111/j.1469-8137.2004.01089.x
23
Garcia-Barreda S. Sangüesa-Barreda G. Madrigal-Gonz´ alez J. Seijo F. de Andr’es E. Camarero J. J. (2021). Reproductive phenology determines the linkages between radial growth, fruit production and climate in four Mediterranean tree species. Agric. For. Meteorol.307. doi: 10.1016/j.agrformet.2021.108493
24
Gärtner H. Nievergelt D. (2010). The core-microtome: a new tool for surface preparation on cores and time series analysis of varying cell parameters. Dendrochronologia28, 85–92. doi: 10.1016/j.dendro.2009.09.002
25
Gavashelishvili A. Tarkhnishvili D. (2016). Biomes and human distribution during the last ice age. Glob. Ecol. Biogeogr.25, 563–574. doi: 10.1111/geb.12437
26
Gómez-Aparicio L. García-Valdés R. Ruíz-Benito P. Zavala M. A. (2011). Disentangling the relative importance of climate, size and competition on tree growth in Iberian forests: implications for forest management under global change: neighborhood models and tree growth drivers. Glob. Change Biol.17, 2400–2414. doi: 10.1111/j.1365-2486.2011.02421.x
27
Gupta L. Dixit J. (2024). Investigating the spatial distribution of flood inundation and landforms using topographic position index (TPI) and geomorphon-based automated landform classification methods. J. Earth Syst. Sci.133:126. doi: 10.1007/s12040-024-02343-x
28
Hayakawa Y. S. Oguchi T. Lin Z. (2008). Comparison of new and existing global digital elevation models: ASTER G-DEM and SRTM-3. Geophys. Res. Lett.35:2008GL035036. doi: 10.1029/2008GL035036
29
Inouye D. W. (2000). The ecological and evolutionary significance of frost in the context of climate change. Ecol. Lett.3, 457–463. doi: 10.1046/j.1461-0248.2000.00165.x
30
Jarman R. Moir A. K. Webb J. Chambers F. M. (2017). Sweet chestnut (Castanea sativa mill.) in Britain: its dendrochronological potential. Arboric. J.39, 100–124. doi: 10.1080/03071375.2017.1339478
31
Karger D. N. Conrad O. Böhner J. Kawohl T. Kreft H. Soria-Auza R. W. et al . (2017). Climatologies at high resolution for the earth’s land surface areas. Sci Data4:170122. doi: 10.1038/sdata.2017.122
32
Keleş S. Ö. Ünal S. Akan S. Karadeniz M. (2024). Chestnut blight (Cryphonectria parasitica (Murr.) Barr) disease incidence and its effect on the morphological and anatomical features of Castanea sativa trees. For. Pathol.54:e12843. doi: 10.1111/efp.12843
33
Klisz M. Jevšenak J. Prokopuk Y. Gil W. Mohytych V. Puchałka R. (2022). Coping with central European climate – xylem adjustment in seven non-native conifer tree species. Dendrobiology88, 105–123. doi: 10.12657/denbio.088.008
34
Konstantinidis P. Tsiourlis G. Xofis P. Buckley G. P. (2008). Taxonomy and ecology of Castanea sativa mill. Forests in Greece. Plant Ecol.195, 235–256. doi: 10.1007/s11258-007-9323-8
35
Kovács L. (2024). Feature selection algorithms in generalized additive models under concurvity. Comput. Stat.39, 461–493. doi: 10.1007/s00180-022-01292-7
36
Krebs P. Conedera M. Pradella M. Torriani D. Felber M. Tinner W. (2004). Quaternary refugia of the Sweet chestnut (Castanea sativa mill.): an extended palynological approach. Veg. Hist. Archaeobotany13, 145–160. doi: 10.1007/s00334-004-0041-z
37
Kvaratskhelia R. Gavashelishvili A. (2025). Common yew (Taxus baccata) as a climate archive: reconstructing 200 years of temperature change in Georgia (Caucasus). Dendrochronologia89:126285. doi: 10.1016/j.dendro.2024.126285
38
Lebourgeois F. Aussenac R. Lemaire J. Nequier T. Righi J.-M. (2013). Croissance de la chataigneraie ˆ limousine et climat. R’eflexion sur la place du Chataignier ˆ dans les prochaines d’ecennies. Rev. For. Fr.54, 751–760. doi: 10.4267/2042/51113
39
Marini F. Battipaglia G. Manetti M. C. Corona P. Romagnoli M. (2019). Impact of climate, stand growth parameters, and management on isotopic composition of tree rings in chestnut coppices. Forests10. doi: 10.3390/f10121148
40
Metreveli V. Kreft H. Akobia I. Janiashvili Z. Nonashvili Z. Dzadzamia L. et al . (2023). Potential distribution and suitable habitat for chestnut (Castanea sativa). Forests14:2076. doi: 10.3390/f14102076
41
Metreveli V. Kreft H. Gavashelishvili A. (2024). Environmental covariates of chestnut blight (Cryphonectria parasitica) in Georgia (Caucasus). For. Ecol. Manag.569:122153. doi: 10.1016/j.foreco.2024.122153
42
Midolo G. Wellstein C. Faurby S. (2021). Individual fitness is decoupled from coarse-scale probability of occurrence in north American trees. Ecography44, 789–801. doi: 10.1111/ecog.05446
43
Ministry of Environmental Protection and Agriculture of Georgia (2023). First national forest inventory in Georgia. Georgia: Tbilisi Available online at: https://mepa.gov.ge/Ge/Reports?page=3&pageSize=9.
44
Nakhutsrishvili G. (2013). The vegetation of Georgia (South Caucasus). Berlin, Heidelberg: Springer Berlin Heidelberg.
45
Newbigin M. I. (1928). Man and the forest in Europe: the pre-industrial period. Empire Forestry Journal7, 209–224.
46
Nguyen Quang M. Thu N. T. H Pham Quoc K. Hien Phu L. Tien Bui D. (2024). Impacts of resampling and downscaling digital elevation model and its morphometric factors: A comparison of Hopfield neural network, bilinear, bicubic, and kriging interpolations. Remote Sensing16:819. doi: 10.3390/rs16050819
47
Ortega Rodriguez D. R. Sánchez-Salguero R. Hevia A. Granato-Souza D. Cintra B. B. L. Hornink B. et al . (2023). Climate variability of the southern Amazon inferred by a multi-proxy tree-ring approach using Cedrela fissilis Vell. Sci. Total Environ.871:162064. doi: 10.1016/j.scitotenv.2023.162064
48
Ouimet R. Moore J.-D. (2015). Effects of fertilization and liming on tree growth, vitality and nutrient status in boreal balsam fir stands. For. Ecol. Manag.345, 39–49. doi: 10.1016/j.foreco.2015.02.032
49
Poggio L. De Sousa L. M. Batjes N. H. Heuvelink G. B. M. Kempen B. Ribeiro E. et al . (2021). SoilGrids 2.0: producing soil information for the globe with quantified spatial uncertainty. Soil7, 217–240. doi: 10.5194/soil-7-217-2021
50
Pretzsch H. (2009). Forest dynamics, growth and yield, vol. 684. Berlin: Springer.
51
Prospero S. Lutz A. Tavadze B. Supatashvili A. Rigling D. (2013). Discovery of a new gene pool and a high genetic diversity of the chestnut blight fungus Cryphonectria parasitica in Caucasian Georgia. Infect. Genet. Evol.20, 131–139. doi: 10.1016/j.meegid.2013.08.009
52
R Core Team (2016). R: A Language and Environment for Statistical Computing. Vienna, Austria: R Foundation for Statistical Computing.
53
Rashid M. H. U. Li Y. Farooq T. H. Ahmad I. Nawaz M. F. Sohail M. et al . (2024). Influence of cambium mechanism in plants in relation to different environmental stresses. Pol. J. Environ. Stud.33, 503–514. doi: 10.15244/pjoes/171578
54
Reinmann A. B. Susser J. R. Demaria E. M. C. Templer P. H. (2019). Declines in northern forest tree growth following snowpack decline and soil freezing. Glob. Change Biol.25, 420–430. doi: 10.1111/gcb.14420
55
Rigling D. Prospero S. (2018). Cryphonectria parasitica, the causal agent of chestnut blight: invasion history, population biology and disease control. Mol. Plant Pathol.19, 7–20. doi: 10.1111/mpp.12542
56
Romagnoli M. Nocetti M. Sarlatto M. Evangelistella L. (2004). Dendrochronological assessment of chestnut (Castanea sativa mill.) for dating purposes in Central Italy. Dendrochronologia21, 117–130. doi: 10.1078/1125.7865.00048
57
Rozas V. (2005). Dendrochronology of pedunculate oak (Quercus robur L.) in an old-growth pollarded woodland in northern Spain: tree-ring growth responses to climate. Ann. For. Sci.62, 209–218. doi: 10.1051/forest:2005012
58
Schober P. Boer C. Schwarte L. A. (2018). Correlation coefficients: appropriate use and interpretation. Anesth. Analg.126, 1763–1768. doi: 10.1213/ANE.0000000000002864
59
Serra-Diaz J. M. Keenan T. F. Ninyerola M. Sabaté S. Gracia C. Lloret F. (2013). Geographical patterns of congruence and incongruence between correlative species distribution models and a process-based ecophysiological growth model. J. Biogeogr.40, 1928–1938. doi: 10.1111/jbi.12142
60
Sillett S. C. Van Pelt R. Koch G. W. Ambrose A. R. Carroll A. L. Antoine M. E. et al . (2010). Increasing wood production through old age in tall trees. For. Ecol. Manag.259, 976–994. doi: 10.1016/j.foreco.2009.12.003
61
Simpson G. L. (2022). gratia: Graceful ggplot-based graphics and other functions for GAMs fitted using mgcv (R package version 0.7.3). CRAN. doi: 10.32614/CRAN.package.gratia
62
Solla A. Dorado F. J. González R. Giraldo-Chaves L. B. Cubera E. Rocha G. et al . (2024). Chestnut trees (Castanea sativa mill.) for climate change. Acta Hortic.1400, 273–282. doi: 10.17660/ActaHortic.2024.1400.32
63
Spina S. Romagnoli M. (2010). Characterization of ring shake defect in chestnut (Castanea sativa mill.) wood in the Lazio region (Italy). Forestry83, 315–327. doi: 10.1093/forestry/cpq014
64
Suvanto S. Henttonen H. M. Nöjd P. Helama S. Repo T. Timonen M. et al . (2017). Connecting potential frost damage events identified from meteorological records to radial growth variation in Norway spruce and scots pine. Trees31, 2023–2034. doi: 10.1007/s00468-017-1590-y
65
Tarkhnishvili D. Gavashelishvili A. Mumladze L. (2012). Palaeoclimatic models help to understand current distribution of Caucasian forest species: modeling west Asian forest refugia. Biol. J. Linn. Soc.105, 231–248. doi: 10.1111/j.1095-8312.2011.01788.x
66
Thomas S. C. (2011). “Age-related changes in tree growth and functional biology: the role of reproduction” in Size- and age-related changes in tree structure and function, tree physiology. eds. MeinzerF. C.LachenbruchB.DawsonT. E. (Dordrecht: Springer Netherlands), 33–64.
67
Tielidze L. G. Wheate R. D. (2018). The greater Caucasus glacier inventory (Russia, Georgia and Azerbaijan). Cryosphere12, 81–94. doi: 10.5194/tc-12-81-2018
68
Velizarova E. (2015). Physico-chemical and morphological properties of soils in chestnut (Castanea sativa mill.) habitats of Belasitsa Mountain. Silva Balcanica, 60–70.
69
Verburg P. H. Neumann K. Nol L. (2011). Challenges in using land use and land cover data for global change studies. Glob. Change Biol.17, 974–989. doi: 10.1111/j.1365-2486.2010.02307.x
70
Vlachou M. Kakavas K. Birbilis D. Chavenetidou M. (2024). Dendrochronology and genetic diversity through climate change: a critical review of sweet chestnut. E3S Web Conf.585:03002. doi: 10.1051/e3sconf/202458503002
71
Wagenmakers E. J. Farrell S. (2004). AIC model selection using Akaike weights. Psychon. Bull. Rev.11, 192–196. doi: 10.3758/BF03206482
72
Waldboth M. Oberhuber W. (2009). Synergistic effect of drought and chestnut blight (Cryphonectria parasitica) on growth decline of European chestnut (Castanea sativa). For. Pathol.39, 43–55. doi: 10.1111/j.1439-0329.2008.00562.x
73
Warnes G. R. Bolker B. Lumley T. Magnusson A. Venables B. Ryodan G. et al . (2021). gtools: Various R programming tools (R package version 3.9.5). CRAN. Available online at: https://CRAN.R-project.org/package=gtools
74
Weise K. van der Maaten-Theunissen M. Seitz G. Keller T. van der Maaten E. (2025). Future suitability of Sweet chestnut (Castanea sativa mill.) is limited by susceptibility to drought. Dendrochronologia90:126299. doi: 10.1016/j.dendro.2025.126299
75
Wood S. N. (2011). Fast stable restricted maximum likelihood and marginal likelihood estimation of semiparametric generalized linear models. J. R. Stat. Soc. Ser. B Stat Methodol.73, 3–36. doi: 10.1111/j.1467-9868.2010.00749.x
76
Wood S. N. (2017). Generalized additive models: An introduction with R (2nd ed.). Boca Raton, FL: Chapman and Hall/CRC.
77
Wood S. N. Pya N. Säfken B. (2016). Smoothing parameter and model selection for general smooth models. J. Am. Stat. Assoc.111, 1548–1563. doi: 10.1080/01621459.2016.1180986
78
Yates L. A. Aandahl Z. Richards S. A. Brook B. W. (2023). Cross validation for model selection: a review with examples from ecology. Ecol. Monogr.93:e1557. doi: 10.1002/ecm.1557
79
Yılmaz H. (2015). Weather response of sweet chestnut (Castanea sativa mill.) radial growth increment in Belgrad forest. Fresenius Environ. Bull.24, 2490–2495.
80
Ziaco E. biondi F. Rossi S. Deslauriers A. (2016). Environmental drivers of cambial phenology in Great Basin bristlecone pine. Tree Physiol.36, 818–831. doi: 10.1093/treephys/tpw006
Summary
Keywords
Castanea sativa , dendrochronology/dendrochronological, generalized additive models, climate change, tree growth dynamics, Caucasus region
Citation
Metreveli V, Kreft H, Javakhishvili Z, Mdivani S, Chikorashvili G, Akobia I and Gavashelishvili A (2025) On the relationship between environment and growth of Sweet chestnut (Castanea sativa) in the Caucasus. Front. For. Glob. Change 8:1670459. doi: 10.3389/ffgc.2025.1670459
Received
21 July 2025
Accepted
18 September 2025
Published
02 October 2025
Volume
8 - 2025
Edited by
Alireza Rahemi, Morehead State University, United States
Reviewed by
Dragan Galic, University of Guelph, Canada
Segun Adeyemo, Mendocino and Humboldt Redwood Companies, United States
Etienne Robert, Université du Québec à Montréal, Canada
Updates
Copyright
© 2025 Metreveli, Kreft, Javakhishvili, Mdivani, Chikorashvili, Akobia and Gavashelishvili.
This is an open-access article distributed under the terms of the Creative Commons Attribution License (CC BY). The use, distribution or reproduction in other forums is permitted, provided the original author(s) and the copyright owner(s) are credited and that the original publication in this journal is cited, in accordance with accepted academic practice. No use, distribution or reproduction is permitted which does not comply with these terms.
*Correspondence: Vasil Metreveli, vasil.metreveli.1@iliauni.edu.ge
Disclaimer
All claims expressed in this article are solely those of the authors and do not necessarily represent those of their affiliated organizations, or those of the publisher, the editors and the reviewers. Any product that may be evaluated in this article or claim that may be made by its manufacturer is not guaranteed or endorsed by the publisher.