 Ruiwu Zhou
 Guojing Wen2*†
- 1School of Geography and Land Engineering, Yuxi Normal University, Yuxi, China
- 2Yuanjiang Savanna Ecosystem Observation and Research Station of Yunnan Province, Yuanjiang, China
Introduction: Vegetation phenology serves as a sensitive indicator of terrestrial ecosystem responses to climate change. Over the past few decades, research on phenological changes, especially in forest ecosystems, has expanded substantially.
Methods: This study conducts a systematic bibliometric analysis of global literature on vegetation phenology and climate change from 1995 to 2024, based on 599 publications retrieved from the Web of Science Core Collection and Scopus. Using VOSviewer, CiteSpace, Bibliometrix (R package), and SciMAT, we examined publication trends, geographic distribution, institutional collaboration, author contributions, and thematic evolution.
Results: Results reveal a rapid rise in research since 2012, with peaks in 2022 and 2024. China leads in publication volume, whereas the United States dominates in total and average citations, reflecting greater academic influence. The University of the Chinese Academy of Sciences and Beijing Normal University emerge as leading institutions. Collaboration networks highlight four major international clusters, with China and the United States at the core. Keyword co-occurrence analysis identifies central topics such as “climate change,” “spring phenology,” “NDVI,” and “remote sensing,” while new themes emerging after 2017 include “urban vegetation phenology,” “grassland ecosystems,” and “extreme climate events.” Thematic evolution indicates a shift from foundational topics such as “MODIS” and “plant growth” toward more integrated themes such as “climate impacts,” “phenological modeling,” and “ecosystem responses.” Co-citation analysis identifies 13 research clusters, including “temperate forest phenology,” “winter wheat,” and “urban spring vegetation phenology.” Recent clusters emphasize high-resolution data sources and urbanization effects, reflecting a transition toward finer-scale and application-oriented research.
Discussion: Influential works by Richardson, Piao, and others form the intellectual foundation of the field and continue to shape its development. Overall, this study provides a comprehensive overview of the evolution and trajectory of vegetation phenology research under climate change. The findings underscore the growing integration of interdisciplinary approaches, finer-scale observations, and an increasing focus on climate-vegetation feedbacks, offering guidance for future research and strategies to enhance ecosystem adaptation.
1 Introduction
Vegetation, as one of the most important components of terrestrial ecosystems, connects ecological elements such as hydrology, soil, and atmosphere, and provides strong support for natural ecosystems and human well-being (Foley et al., 2000; Zhang et al., 2013). Vegetation phenology, which refers to the seasonal biological life stages driven by environmental factors, is regarded as a sensitive and accurate indicator of climate change (Menzel and Fabian, 1999; Piao et al., 2006). Changes in vegetation phenology have significant impacts on land surface and atmospheric processes and are key to understanding terrestrial ecosystem responses and feedbacks to climate change (Shen M. et al., 2024). In addition, phenological changes affect ecosystem functioning and services, ecological and evolutionary interactions, and regional and global cycles of carbon, water, nutrients, and energy, with resulting social implications (Schwartz, 1998; Peñuelas and Filella, 2001; Barichivich et al., 2013; Richardson et al., 2018a, 2018b; Zhou, 2022). The phenological phases of vegetation are highly sensitive to climatic conditions, and studying their changes and responses is crucial for clarifying the relationship between vegetation and climate change (Piao et al., 2011; Richardson et al., 2013; Shen et al., 2018; Shen M. et al., 2022; Zhang Q. et al., 2017).
Climate change is profoundly altering the phenological processes of forest vegetation, particularly by advancing the start of the growing season in spring (SOS) and delaying its end in autumn (EOS), thereby extending the length of the growing season (LOS). Numerous studies have demonstrated that spring warming has resulted in earlier phenological events across most regions worldwide. For example, flowering time has advanced for 58.5% of species in the Southern Hemisphere and 81.6% in the Northern Hemisphere, with SOS in Northern Hemisphere forests advancing by 1.2–4.0 days and EOS being delayed by 1.4–2.8 days per decade (Richardson et al., 2006; Piao et al., 2007; Everingham et al., 2022). These phenological shifts directly affect forest carbon cycling. On one hand, earlier SOS can expand the window for photosynthesis and enhance carbon uptake. On the other hand, delayed EOS, while extending the growing season, may increase ecosystem respiration and thereby offset part of the carbon gain. In high-latitude regions, late-season respiration has been found to outweigh early-season photosynthetic carbon gains, resulting in net carbon loss (Piao et al., 2008). Moreover, the advancement of SOS plays a critical role in boosting carbon uptake in temperate and boreal forests, as increases in photosynthesis often exceed those in respiration, thus enhancing terrestrial carbon sinks overall (Wu et al., 2012; Richardson et al., 2013). However, Responses to climate-induced phenological changes vary significantly across vegetation types and regions. In deciduous broadleaf forests, advanced SOS strongly correlates with increased carbon sequestration and extended LOS. In contrast, in northern coniferous forests, the carbon gain from longer LOS is often offset by concurrent increases in ecosystem respiration (Dragoni et al., 2011; Keenan et al., 2014b). In Europe, LOS extension by 1 day can increase net ecosystem production (NEP) in mixed forests by approximately 3.5 gC·m−2, while each one-day advancement in SOS can enhance NEP by 2–4 gC·m−2 (Richardson et al., 2010). Similar patterns are observed in grassland ecosystems. For instance, studies in northern China and the Tibetan Plateau suggest that net primary productivity (NPP) is more sensitive to SOS than to EOS, and while delayed EOS can slightly increase gross primary productivity (GPP), the effect is limited (Wang et al., 2020; Cheng et al., 2021). In addition to forests, various other vegetation types have exhibited clear phenological responses to climate change. For instance, in croplands, SOS and EOS advanced by 0.5 days and 1.38 days per year, respectively (Sisheber et al., 2023). In temperate grasslands, the EOS showed a significant delay driven by summer precipitation and autumn temperatures (Ma et al., 2022), while in marsh ecosystems, preseason warming led to a delayed EOS at a rate of 4.1 days per decade (Shen X. et al., 2024). These findings underscore the diverse ways in which vegetation phenology is responding to climatic changes across different ecosystems. Moreover, interannual variations in spring and autumn phenology are also critical factors influencing forest carbon sink dynamics (Piao et al., 2007). Although there is broad consensus that climate warming drives phenological changes and current findings remain inconsistent due to variations in data sources, observation scales, study periods, and vegetation types. Therefore, it is necessary to comprehensively and quantitatively analyze the development of vegetation phenology as a concept, which would help scholars to make effective decisions about future research. A bibliometric analysis is ideal for a more wide-ranging review and to fully grasp the current status of vegetation phenology research.
Bibliometric analysis, as a quantitative research method combining big data, statistical techniques, and computational tools, has been widely applied across various academic fields, including social sciences, biology, medicine, and environmental science (Ranjbari et al., 2023; Tan et al., 2023; Zhao et al., 2023; Kumar, 2025). Compared with traditional systematic reviews, bibliometric analysis is particularly suitable for research topics with a limited number of publications, offering valuable insights into research gaps and assessing national and global scientific contributions (Møller and Myles, 2016; Ellegaard and Wallin, 2015). In recent years, some studies have applied this method to investigate the impact of climate change on vegetation, focusing on factors such as high temperatures, drought, and increased ozone concentrations across different spatial scales (Verrall and Pickering, 2020; Jimenez-Montenegro et al., 2021; Idris et al., 2022). However, comprehensive global bibliometric analyses specifically evaluating the effects of climate change on vegetation phenology remain scarce. Existing studies have explored vegetation phenology responses to climate change through regional analyses or reviews of research trends prior to 2013 (Yang et al., 2013; Chen et al., 2023; Singh et al., 2024). Although many reviews exist, most are region-specific, qualitative, or limited in temporal scope and they do not provide a systematic global quantitative assessment. To address this gap, we analyzes literature from 1995 to 2024 to examine the global development of research on forest vegetation phenology under climate change. Using four mainstream visualization tools-HistCite, VOSviewer, CiteSpace, and the Bibliometrix package in R-this study aims to: (1) map the development trajectory and evolving trends of the field; (2) identify current research hotspots and key topics; and (3) provide strategic guidance for future research and policy-making, supporting more effective resource allocation and responses to climate challenges.
2 Materials and methods
2.1 Research design
We adopted a bibliometric approach to quantitatively analyze research output, collaboration patterns, and thematic evolution on climate change impacts on vegetation phenology from 1995 to 2024. Bibliometrics combines statistical and network analyses to evaluate publication trends, identify influential authors and institutions, and map research hotspots (Ninkov et al., 2022). This study integrates multiple visualization and analysis tools: CiteSpace (Chen, 2004), VOSviewer (van Eck and Waltman, 2010), SciMAT (Cobo et al., 2012), Scimago Graphica (Hassan-Montero et al., 2022), and the Bibliometrix R package (Aria and Cuccurullo, 2017). Analyses included: Annual publication trends and citation metrics; International and institutional collaboration networks; Keyword co-occurrence mapping; Thematic evolution across four time periods; Co-citation and cluster analysis to reveal intellectual foundations.
2.2 Data collection
This study relies on Web of Science Core Collection (WoSCC) and Scopus because they provide authoritative, high-quality, and standardized bibliographic records that are widely recognized in bibliometric research. In contrast, Google Scholar, though broader in coverage, includes non-peer-reviewed materials and lacks standardized metadata, which may compromise data reliability and compatibility with bibliometric tools. While the exclusion of Google Scholar may omit some relevant works, the combined use of WoSCC and Scopus minimizes bias and ensures both data quality and analytical robustness. WoSCC includes over 20,000 journals across 250 disciplines (Chen et al., 2024; Jing et al., 2024), while Scopus covers 36,377 journals from 11,678 publishers, including 34,346 peer-reviewed titles (Burnham, 2006). The study focuses on literature from 1995 to 2024, limited to English-language original articles and reviews. Search terms such as “vegetation phenology,” “climate change,” and “impact” were used to construct search formulas. In WoSCC, subject, title, and abstract searches yielded 723 records, narrowed to 456 after excluding irrelevant fields. In Scopus, 496 records were retrieved, with 133 unrelated articles removed, resulting in 363. After removing duplicates and incomplete records, a total of 599 valid articles (588 originals and 11 reviews) were included for analysis. The search process is illustrated in Figure 1, and detailed formulas are provided in Supplementary Tables S1, S2.
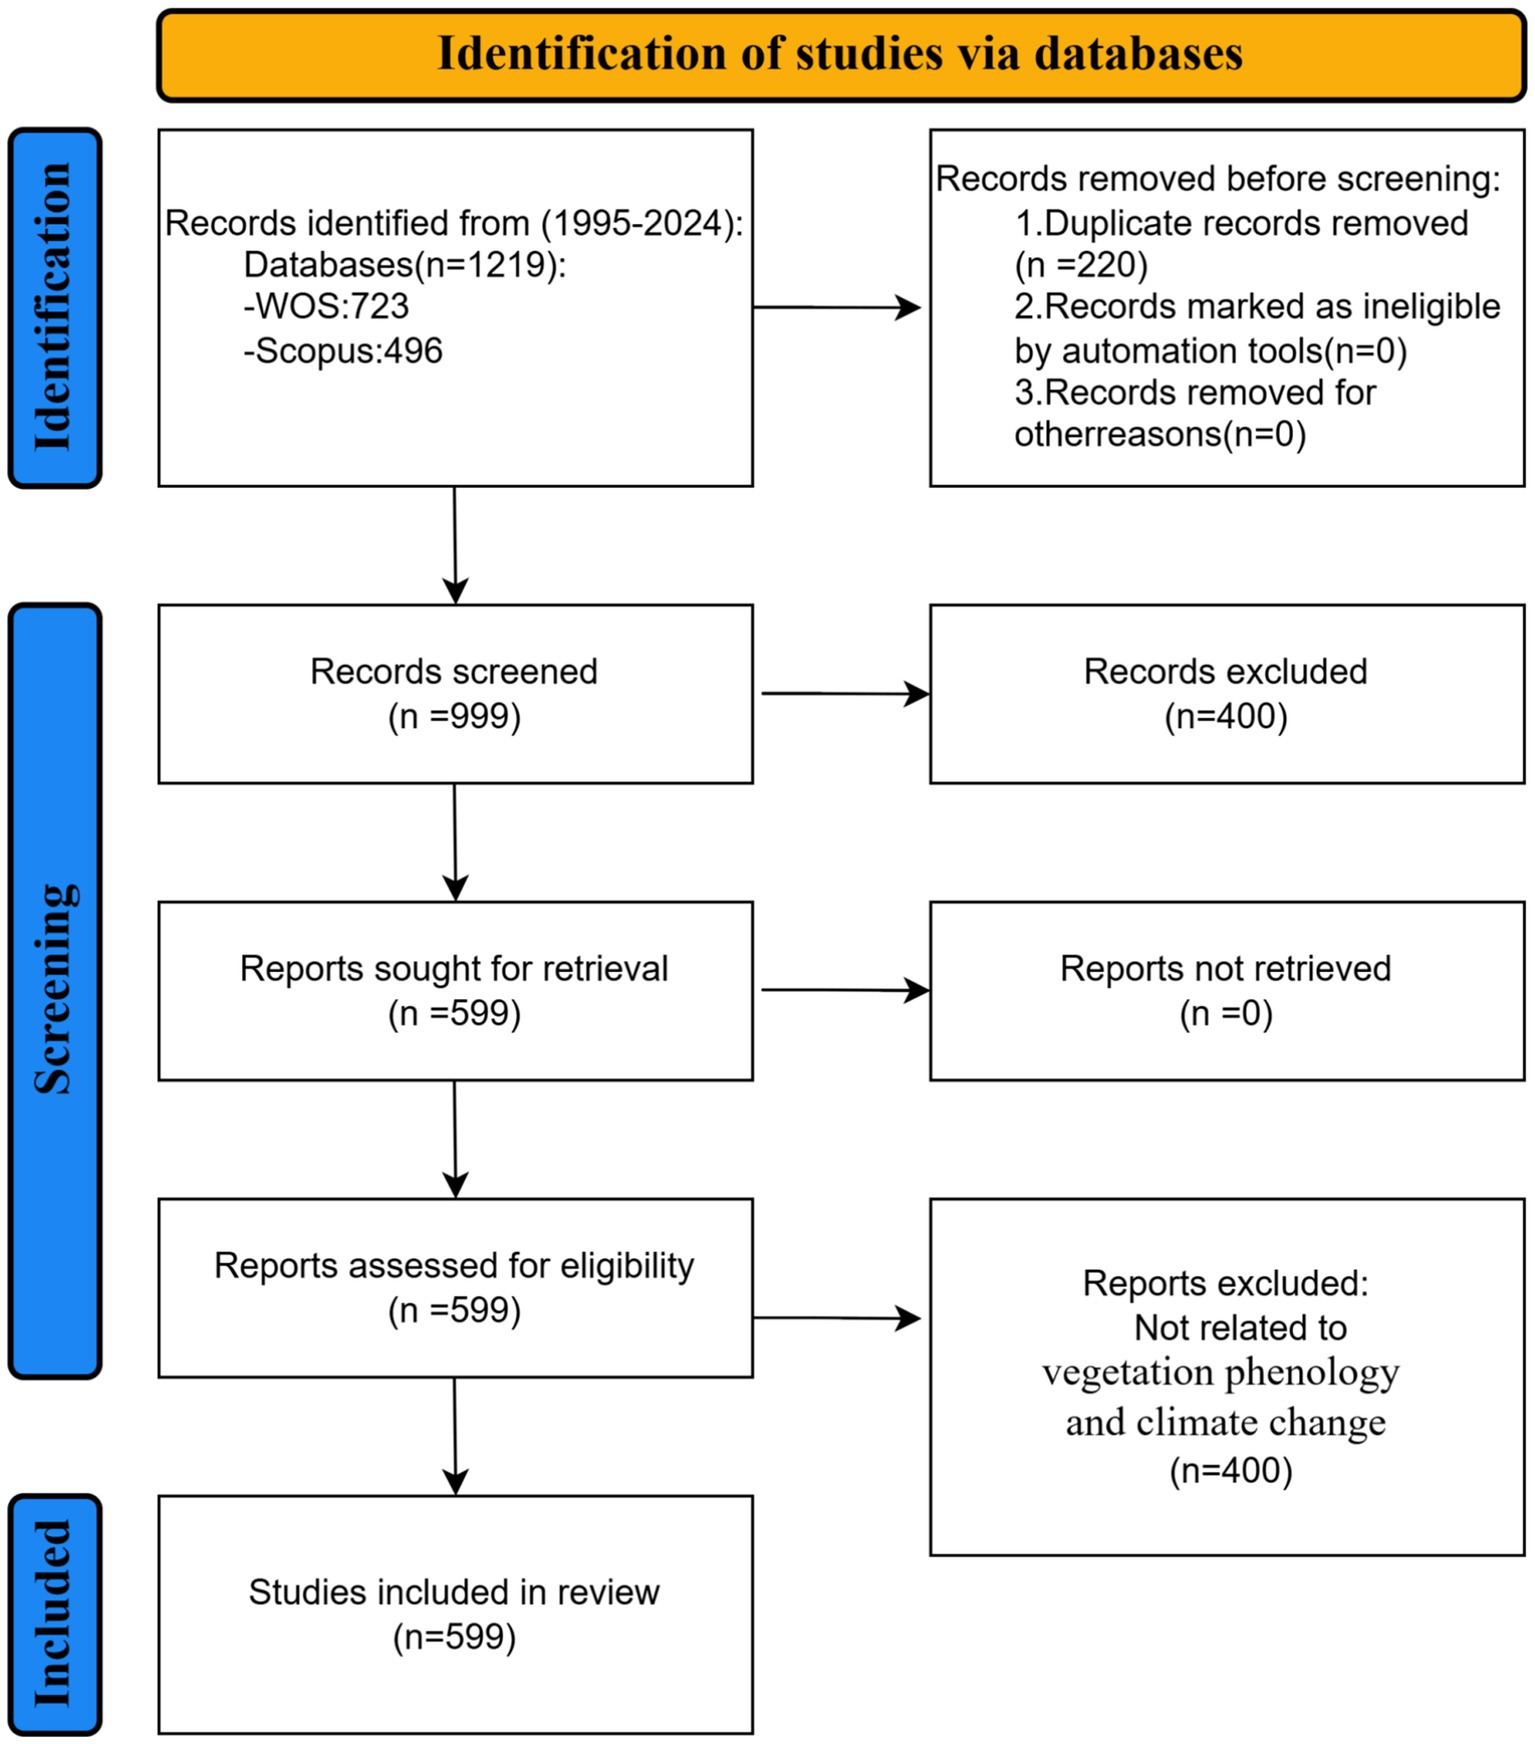
Figure 1. PRISMA flowchart of literature retrieval and screening for bibliometric analysis of vegetation phenology and climate change (1995–2024).
2.3 Bibliometric analysis
This study integrates bibliometric analysis, network analysis, and data visualization techniques to systematically examine the knowledge structure, research hotspots, and evolutionary trends in the field of climate change impacts on forest vegetation phenology (Araújo et al., 2020; Mora et al., 2017). Bibliometric methods are effective for revealing the frequency and network relationships among keywords, authors, institutions, and countries (De las Heras et al., 2021), and are widely used to assess research landscapes. Over 30 free tools have been developed for bibliometric mapping and visualization (Li et al., 2020), among these, VOSviewer-developed by van Eck and Waltman (2010), is one of the most widely adopted. It supports five major modules: co-authorship, co-occurrence, bibliographic coupling, citation, and co-citation analysis (van Eck and Waltman, 2020), with its core algorithms and visualization techniques well documented (Li et al., 2021). In this study, we employed Bibliometrix, VOSviewer, Scimago Graphica, and CiteSpace to perform descriptive analyses of the retrieved literature, including annual publication trends, citation frequencies, international collaborations, key authors and institutions, and major journals, thereby outlining the developmental trajectory and collaboration landscape of the field. Keyword co-occurrence analysis was then conducted to extract high-frequency terms and construct co-word networks and temporal keyword maps, which helped identify key research themes and interdisciplinary linkages. Building on this, thematic evolution analysis was performed using SciMAT (Gibbin et al., 2023), where co-occurrence matrices and clustering algorithms were applied to generate strategic diagrams and thematic networks, identifying evolving research hotspots across four time periods: 1995–2012, 2013–2016, 2017–2020, and 2021–2024. Four bibliometric tools were employed in this study to ensure a comprehensive and robust analysis. Bibliometrix (R package, version 4.2.2) was used with default parameters to generate descriptive statistics. VOSviewer (version 1.6.20) was utilized to construct and visualize co-authorship, co-occurrence, and citation networks; to minimize noise, thresholds were set to a minimum of 5 occurrences for keywords and 10 publications for authors or institutions. CiteSpace (version 6.2. R7) was applied to identify co-citation clusters, detect citation bursts, and analyze thematic evolution, with the time slicing configured to one-year intervals, node selection based on the G-index (k = 25), and pruning conducted using the Pathfinder algorithm. Scimago Graphica (version 1.0.35) was employed to produce interactive and customizable visualizations of international collaboration using default clustering and layout settings. To enhance methodological transparency, all parameter selections adhered to well-established practices in bibliometric research. The G-index (k = 25) was chosen to achieve a balance between incorporating highly cited and emerging publications, thereby improving the robustness and interpretability of the findings (Chen, 2004; Chen et al., 2010). A betweenness centrality threshold of 0.1 was applied to identify structurally pivotal nodes that connect distinct research clusters, consistent with conventional co-citation analysis protocols (Chen, 2004). The complementary integration of these tools-encompassing statistical profiling, structural and dynamic network mapping, and advanced visualization—ensured that the results were both comprehensive and reliable. These intervals were selected based on trends in publication volume, and the G-index, Jaccard index, and Inclusion index were used to evaluate the influence and continuity of research themes (Latorre Medina, 2025). Finally, co-citation and cluster analyses were conducted using CiteSpace to identify the intellectual foundations and emerging frontiers of the field. By constructing co-citation cluster timelines and calculating SIGMA burst values, we captured the temporal dynamics and scholarly influence of key publications, offering a comprehensive overview of the knowledge structure and research evolution in this domain (Chen et al., 2010). Collectively, this integrated analytical framework provides valuable visual insights and lays a solid foundation for guiding future research directions and prioritizing thematic developments.
3 Result
3.1 Documents characteristic analysis
3.1.1 Analysis of article publication
From 1995 to 2024, a total of 599 articles on climate change impacts on vegetation phenology were published. Output remained below 10 papers annually before 2012, then increased steadily, exceeding 70 papers per year by 2022. Peak output occurred in 2022 (91 papers) and 2024 (76 papers by October), suggesting sustained research growth (Figure 2). The rapid growth of publications after 2012 may be attributed to the increasing availability of long-term and high-resolution remote sensing products, the release of global climate datasets, and the recognition of vegetation phenology as a key indicator in global change research frameworks. These developments provided both methodological tools and scientific motivation that accelerated research outputs in this field. It should be noted that the data for 2024 were collected up to October; therefore, publications from November and December are not included. This may result in a slight underestimation of the total output for 2024.
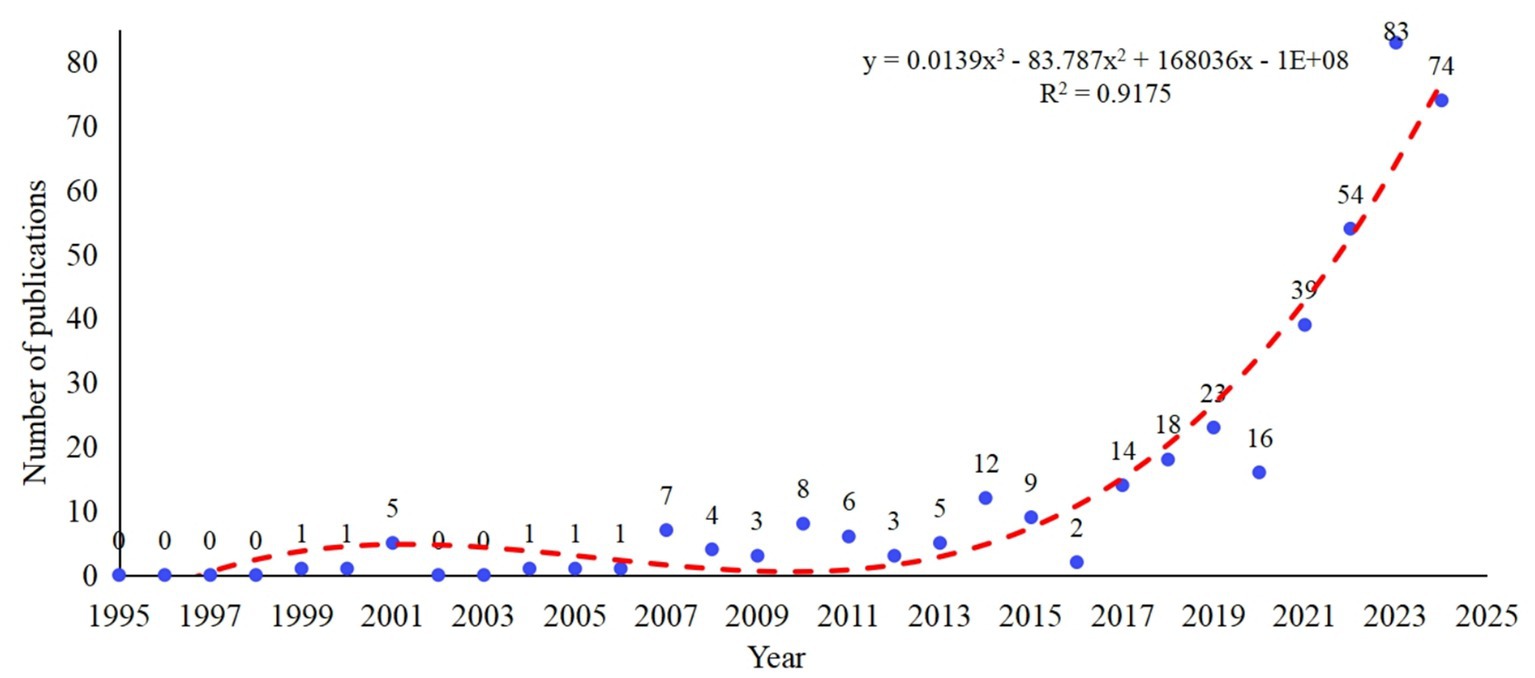
Figure 2. Annual publications on vegetation phenology (1995–2024) from WoSCC and Scopus.
The top 10 most-cited articles from 1995 to 2024 are listed in Table 1. The most influential is Richardson AD’s “Climate Change, Phenology, and Phenological Control of Vegetation Feedbacks to the Climate System” (1,635 citations), followed by Piao SL’s “Variations in Satellite-Derived Phenology in China’s Temperate Vegetation” (757 citations) and Keenan TF’s “Net Carbon Uptake Has Increased Through Warming-Induced Changes in Temperate Forest Phenology” (681 citations). Further details are provided in Table 1.
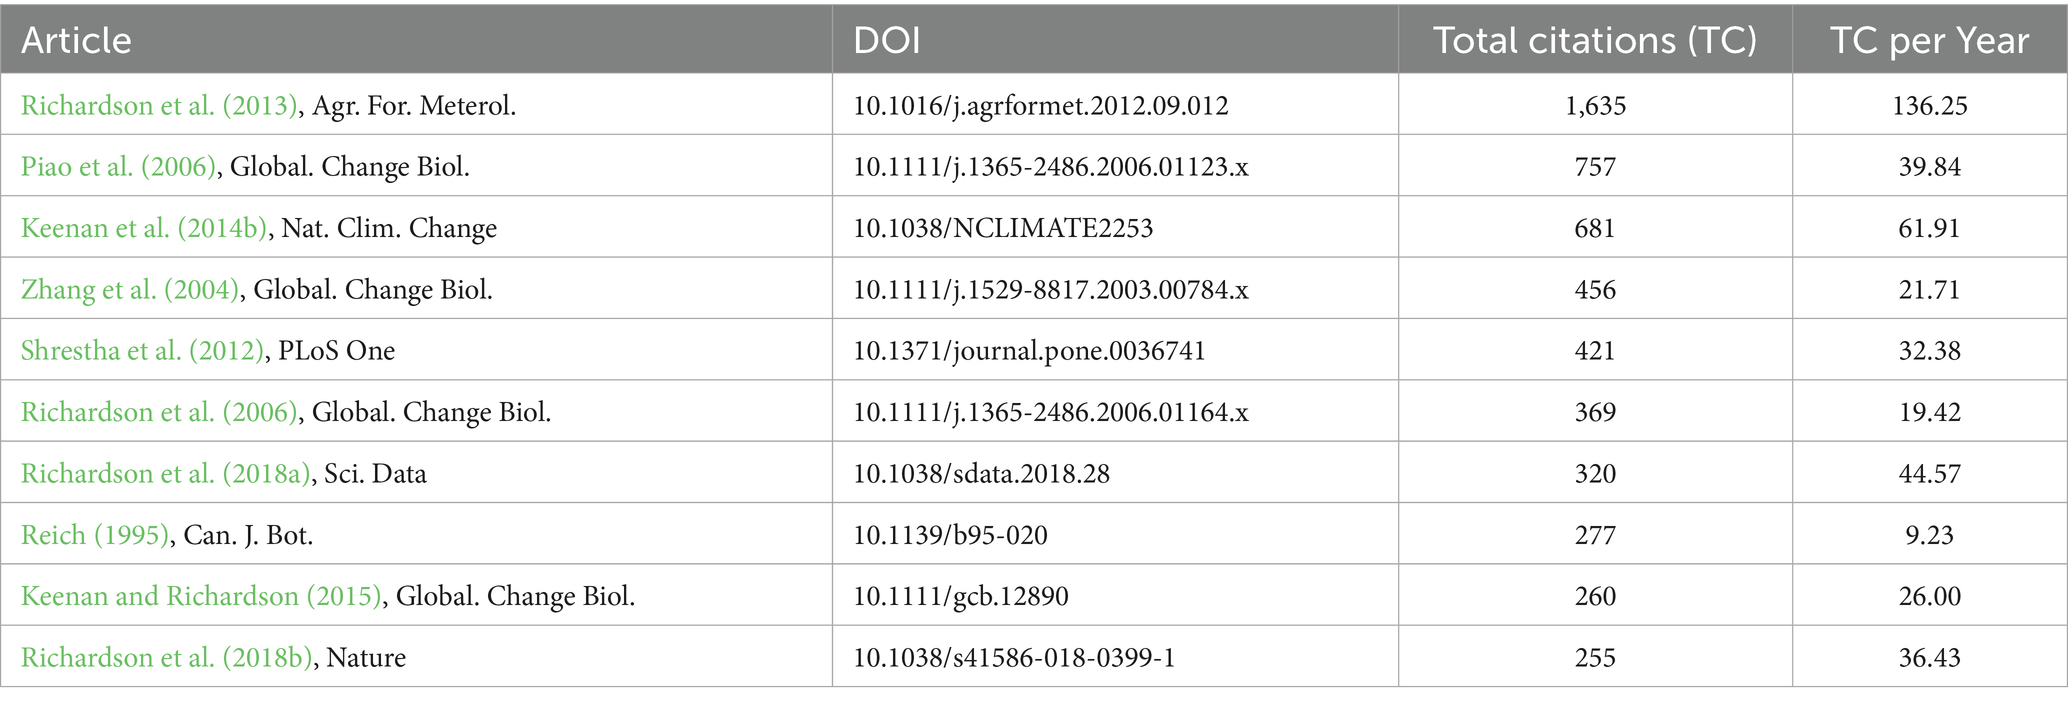
Table 1. Top 10 most-cited articles in the field (1995–2024).
3.1.2 Analysis of countries, institutions, author
Four distinct collaboration clusters were identified. The different colors represent clusters automatically identified by VOSviewer using a modularity-based clustering algorithm. Countries shown in the same color form a group with relatively stronger co-authorship collaboration compared with countries in other clusters. The primary clusters include the blue cluster comprising China, Australia, Japan, Finland, and Brazil; the purple cluster consisting of the United Kingdom, United States, and India; the orange cluster of Canada, Spain, and South Africa; and the green cluster of Italy, South Korea, and Germany (Figure 3a). Here, the intensity of national collaborations is defined as the total number of co-authored publications between a country and all other countries, with higher values indicating stronger international research linkages. The intensity of national collaborations, ranked in the following order: China, the United States, Canada, and Australia (Figure 3b). China leads in publication volume, followed by the United States and Australia, while the top three countries in total citation count are the United States, China, and Canada. Italy, Canada, and France rank highest in terms of the average number of citations per article (Table 2). The strong collaboration between China and the United States may reflect both countries’leading roles in funding, data resources, and global change programs, which have enabled them to attract international partners and foster large-scale research networks.
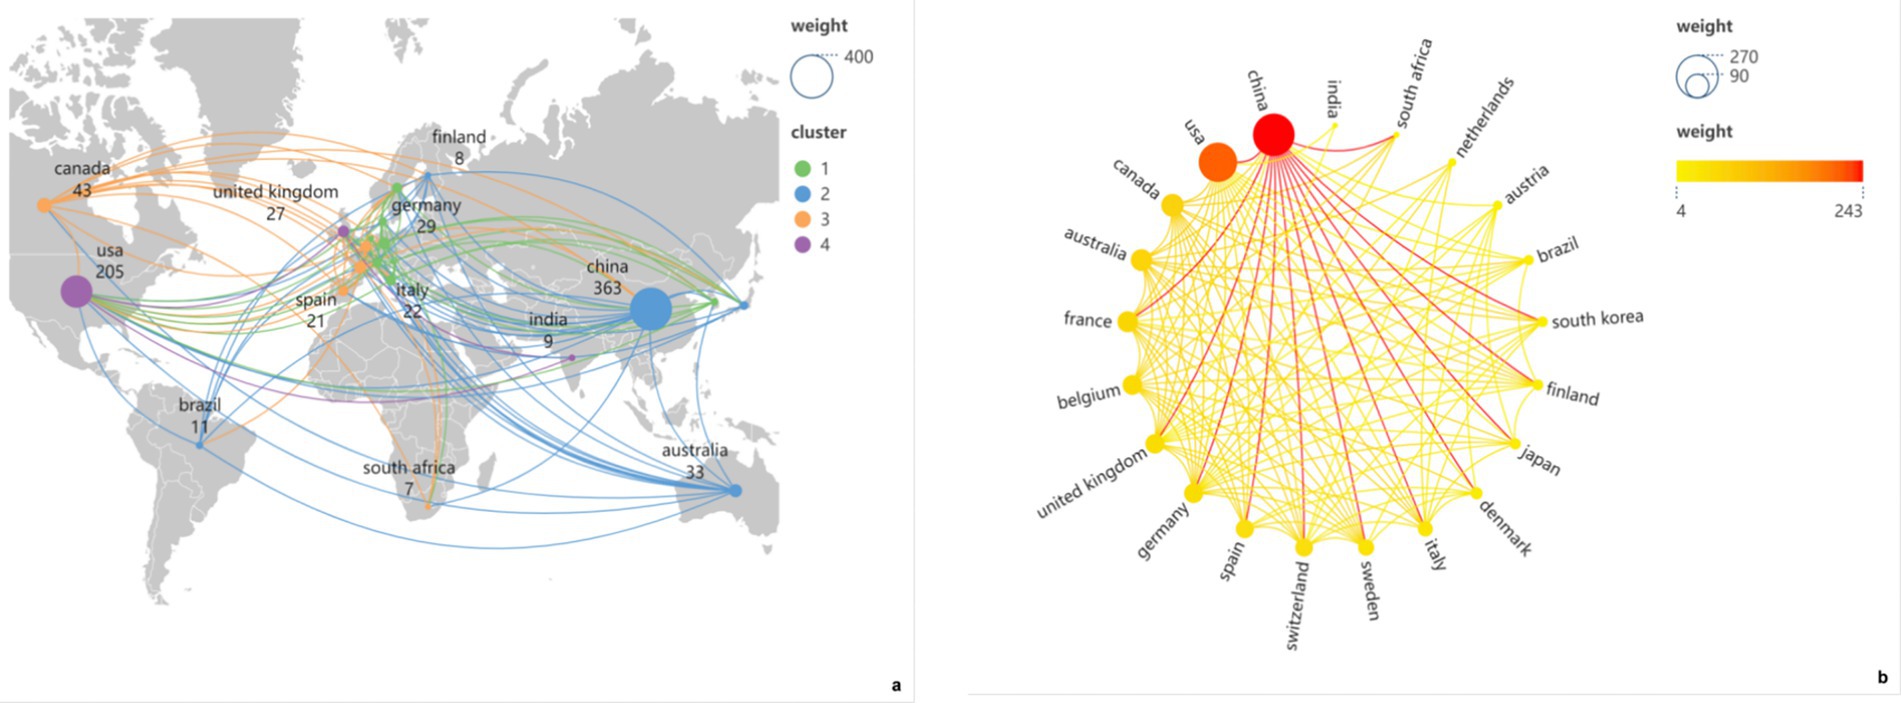
Figure 3. (a) The network of cooperation between countries in vegetation phenology research (1995–2024), circle size indicates the number of articles, colors represent cluster types, and the thickness of the line describes the frequency of co-authorship cooperation with each country; (b) The cooperation intensity between countries in vegetation phenology research (1995–2024), circle size indicates the intensity of national collaborations, colors represent weight.
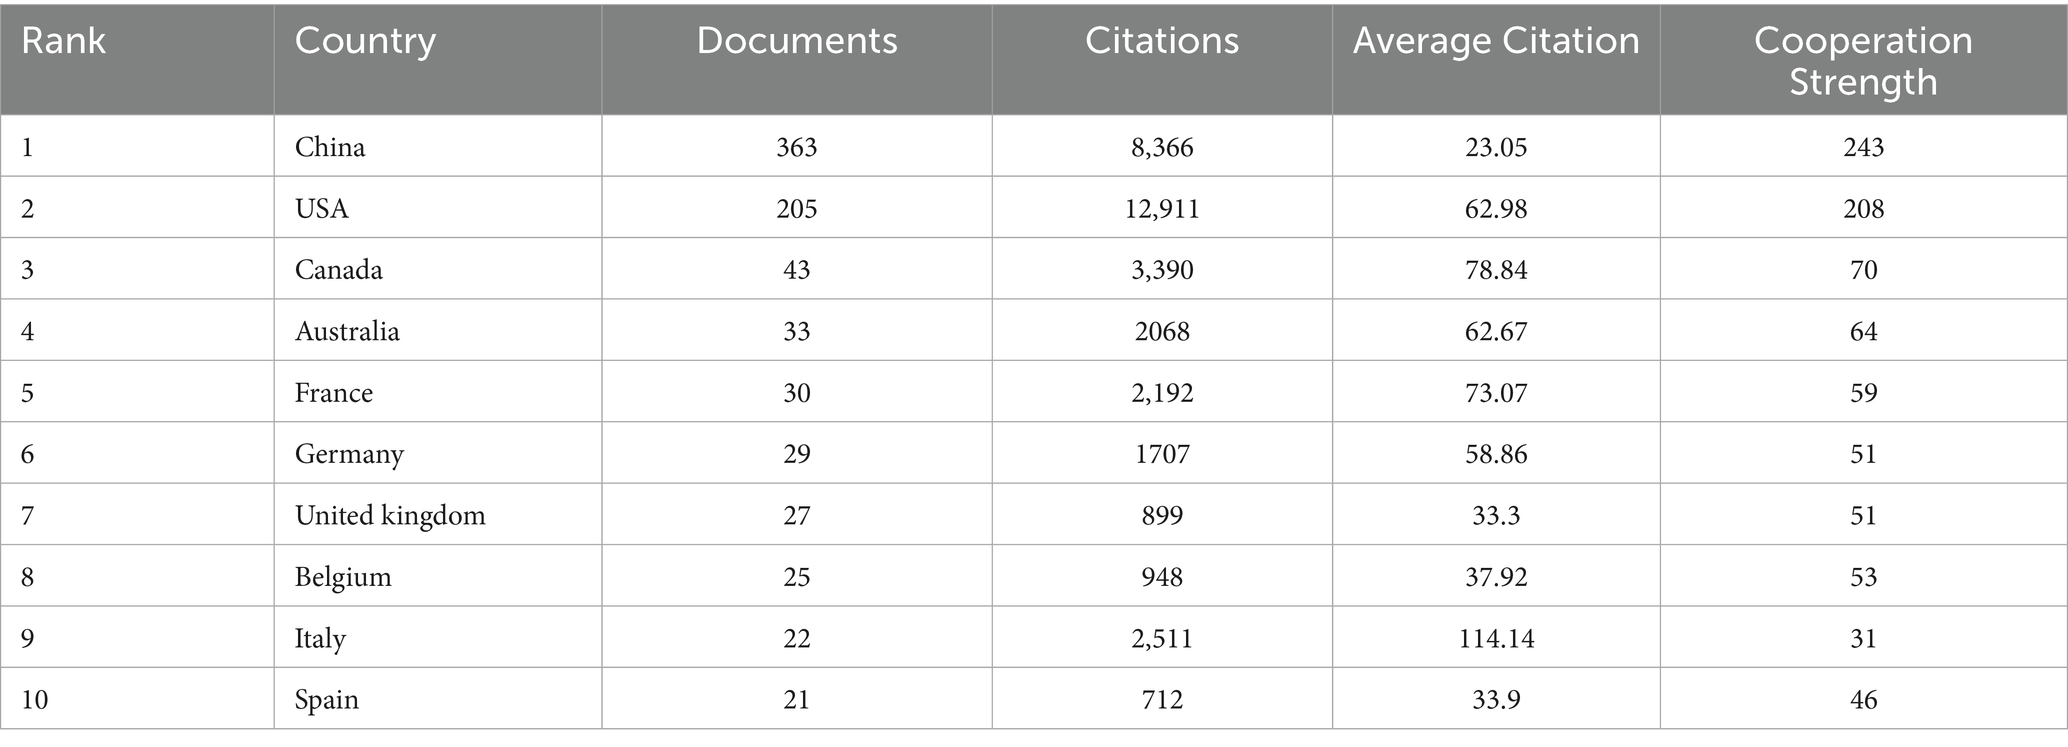
Table 2. Top 10 countries with the most articles publication.
Authors have formed four relatively stable collaborative networks, such as the network led by the University of Chinese Academy of Sciences and the network led by Beijing Normal University (Figure 4). The top five institutions in terms of publication volume are the University of Chinese Academy of Sciences, Beijing Normal University, Peking University, Sun Yat-sen University, and Lanzhou University. The top three institutions by total citation count are the University of Chinese Academy of Sciences, Harvard University, and Boston University. The top three institutions based on the average number of citations per article are the University of Chinese Academy of Sciences, Harvard University, and Peking University (Figure 4; Table 3). Notably, Harvard University and Boston University recorded the highest average citation rates (Table 3).
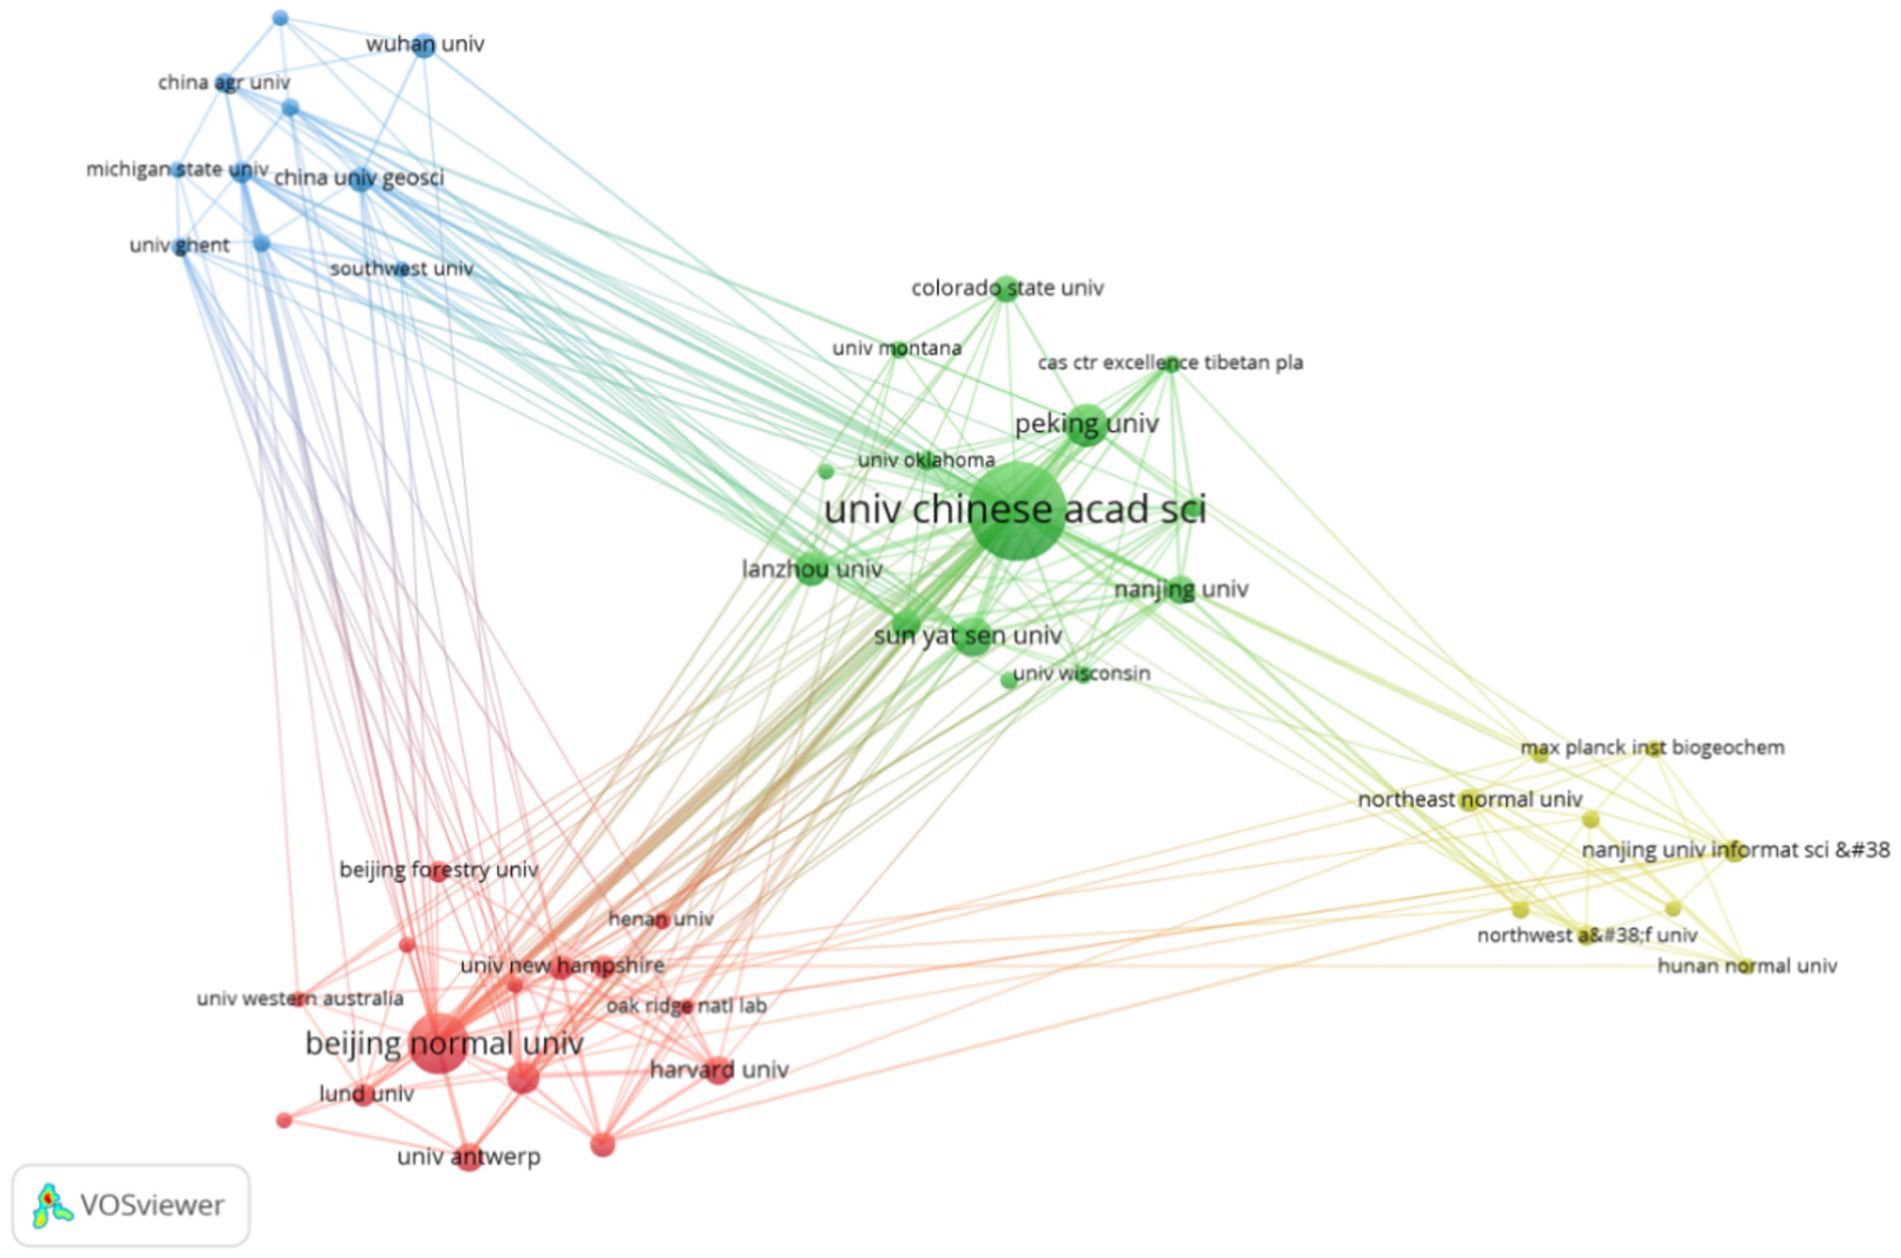
Figure 4. Cooperation network of institutions undertaking vegetation phenology research (1995–2024).
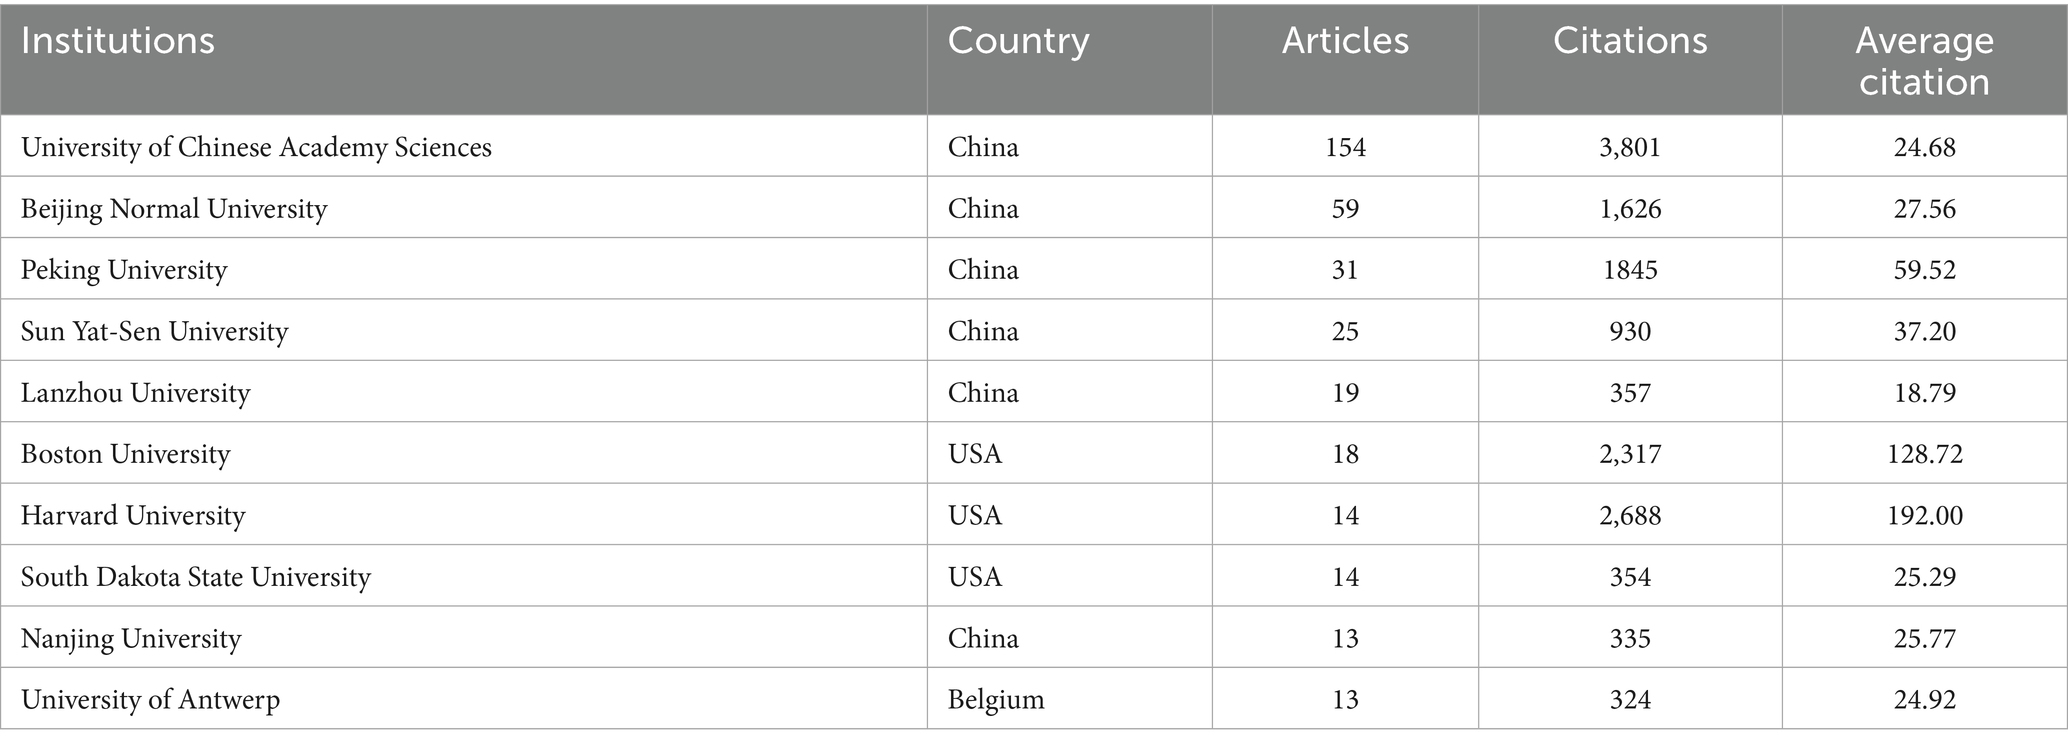
Table 3. Top 10 institutions by publication volume and citation metrics.
Authors have established eight relatively stable collaborative networks, including those led by Richardson, A. D., and Friedl, M. A., as well as those led by Wu, C. Y., and Wang, X. Y. (Figure 5). The top five authors in terms of publication output are Fu, Y. S. H., Wu, C. Y., Richardson, A. D., Wang, X. Y., and Zhang, X. Y. The five most-cited authors are Richardson, A. D., Friedl, M. A., Ciais, P., Hufkens, K., and Zhang, X. Y. (Figure 5). The authors with the highest average citations per article rank in the same order as those based on total citation count. The institutions with the highest publication volumes in vegetation phenology include Beijing Normal University, the University of Chinese Academy Sciences, and Northern Arizona University (Table 4).
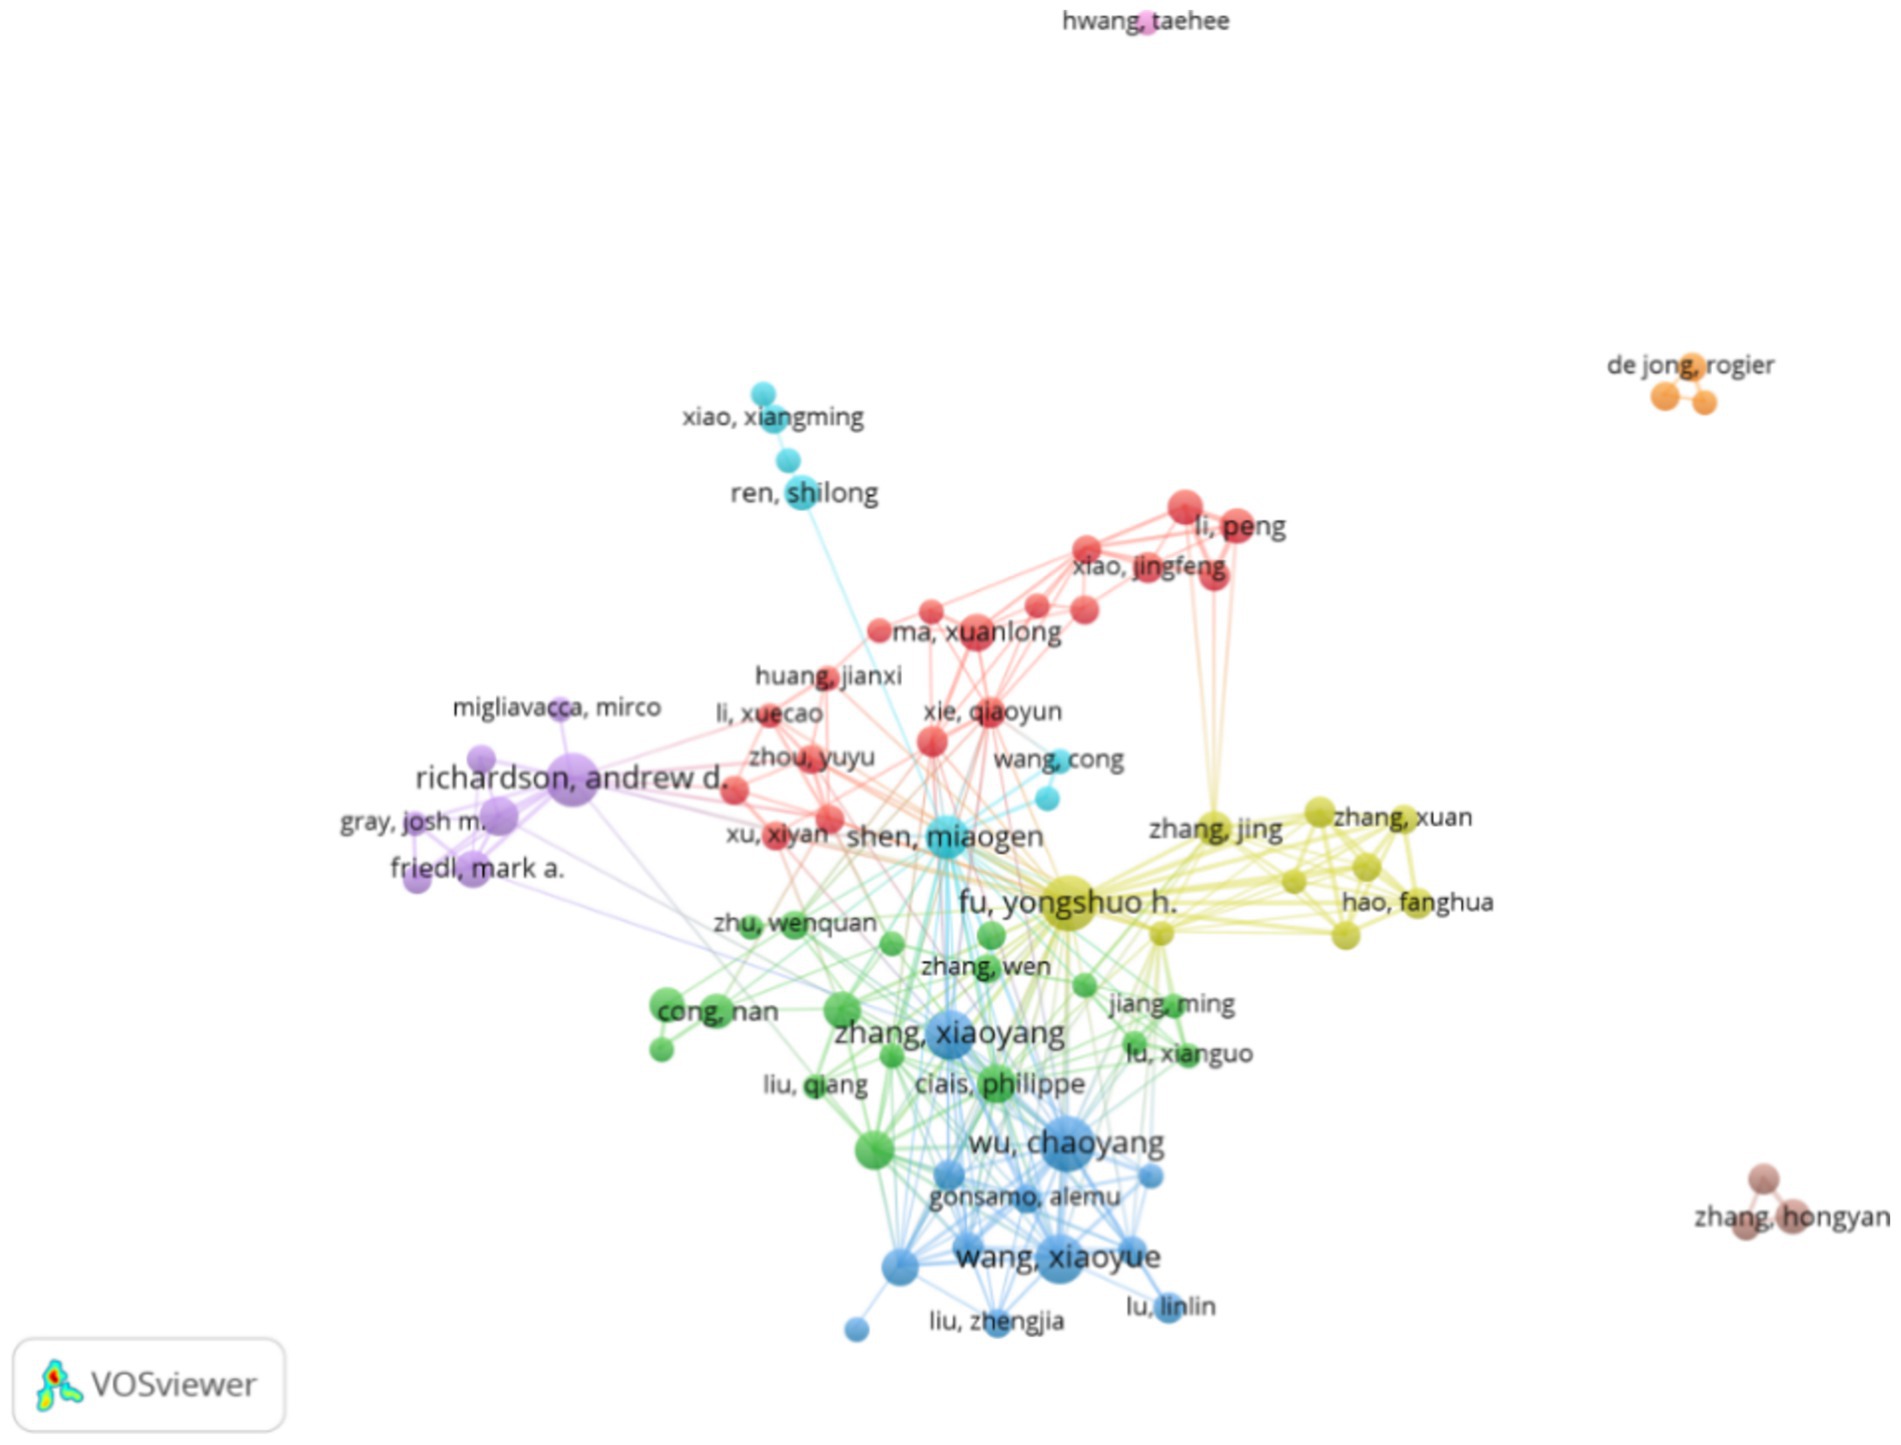
Figure 5. The co-authorship network of publication on vegetation phenology (1995–2024).
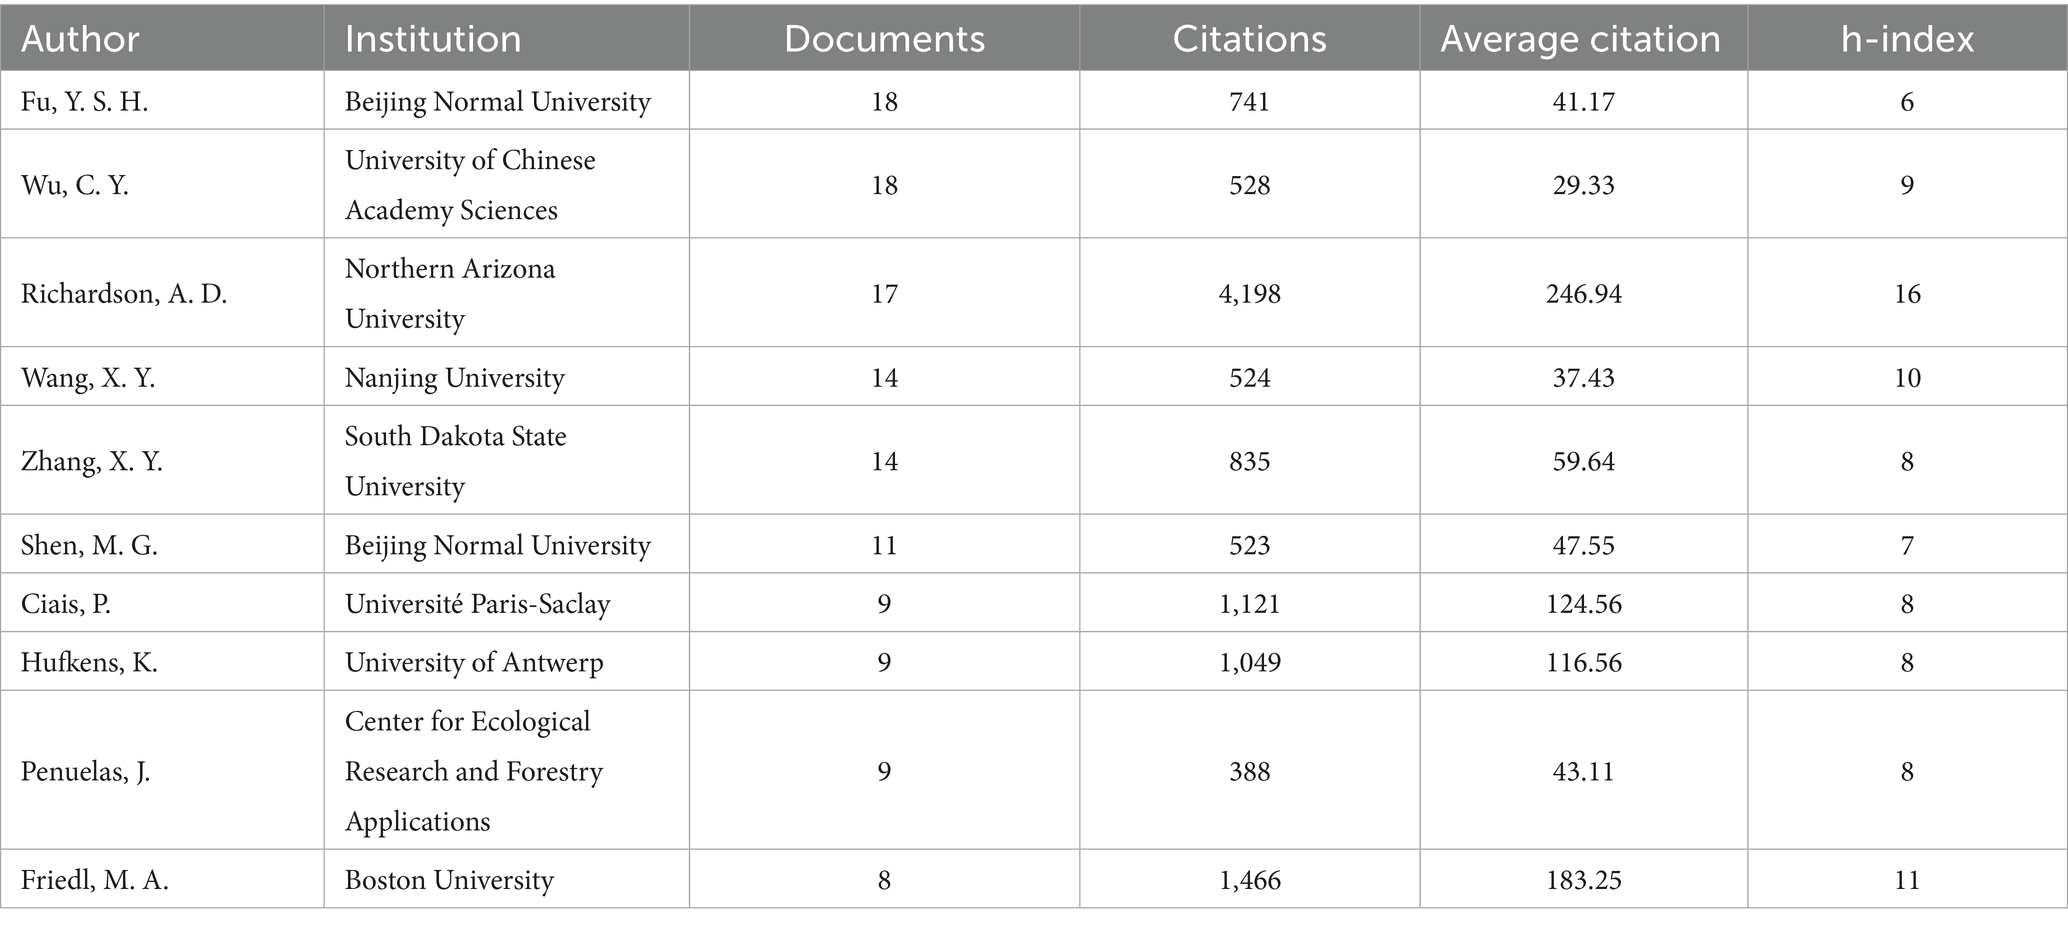
Table 4. Top 10 authors with the most articles publication on vegetation phenology (1995–2024).
3.1.3 Analysis of journal publication
Among the top 10 journals in the field, Remote Sensing leads in publication volume with 92 articles, accumulating 1,332 citations, an average of 14.48 citations per article, an h-index of 21, and an impact factor of 4.2. Global Change Biology has the highest citation count and average citations per article, with 21 articles, 2,579 citations, an average of 122.81 citations per article, an h-index of 15, and an impact factor of 10.8. Remote Sensing of Environment has the highest h-index and impact factor, publishing 30 articles, garnering 2,395 citations, averaging 79.83 citations per article, with an h-index of 23 and an impact factor of 11.1 (Figure 6a; Table 5). While Remote Sensing has the highest number of publications, Global Change Biology and Remote Sensing of Environment show much higher average citations, indicating that journals with fewer papers may exert stronger academic influence. The journal indicators reported in this study correspond to values available in 2023, which was the most recent year at the time of data retrieval. According to Bradford’s Law, if journals in a specific field are ranked by publication volume in descending order, the ratio of core journals to other journals follows a pattern of 1: a: a2, dividing journals into core, related, and peripheral zones, each containing an equal number of articles (Brookes, 1985). Using this principle, Bibliometrix was applied to identify five core journals in the field: Remote Sensing, Science of the Total Environment, Remote Sensing of Environment, Agricultural and Forest Meteorology, and Environmental Research Letters (Figure 6b). The concentration of publications in a few core journals such as Remote Sensing and Global Change Biology may be due to their strong disciplinary relevance and high visibility in both ecological and remote sensing communities. This pattern reflects the interdisciplinary nature of vegetation phenology research under climate change, which often requires integration of ecological theory with advanced observation technologies.
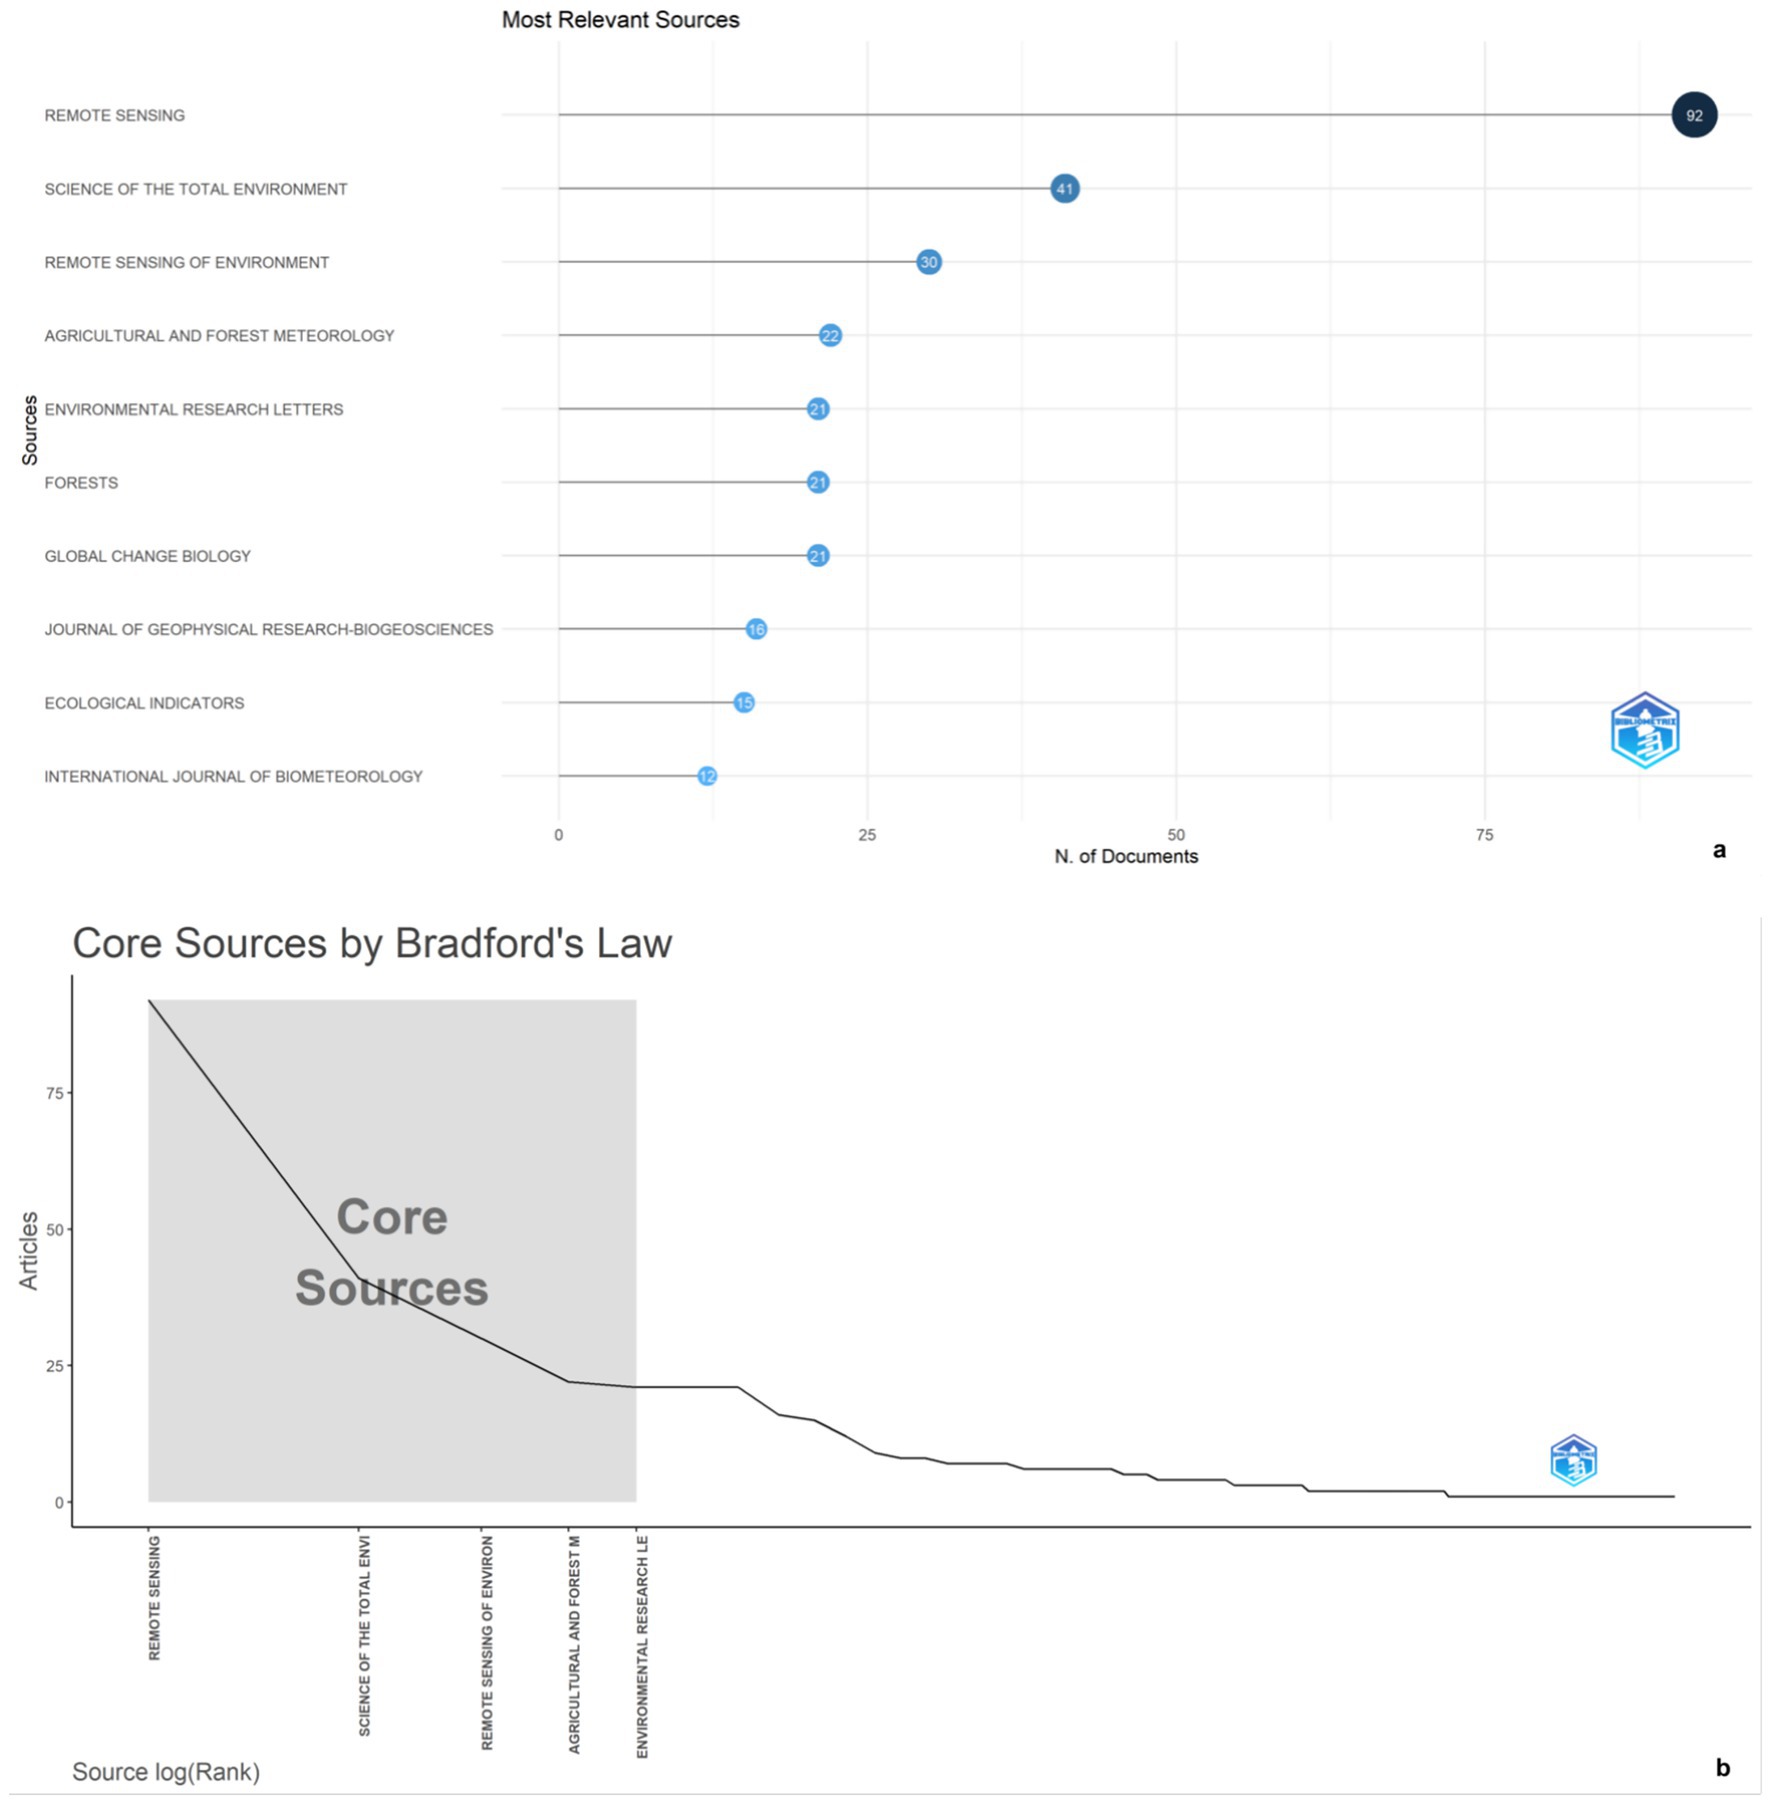
Figure 6. (a) Most relevant journals; (b) Core sources by Bradford’s Law.
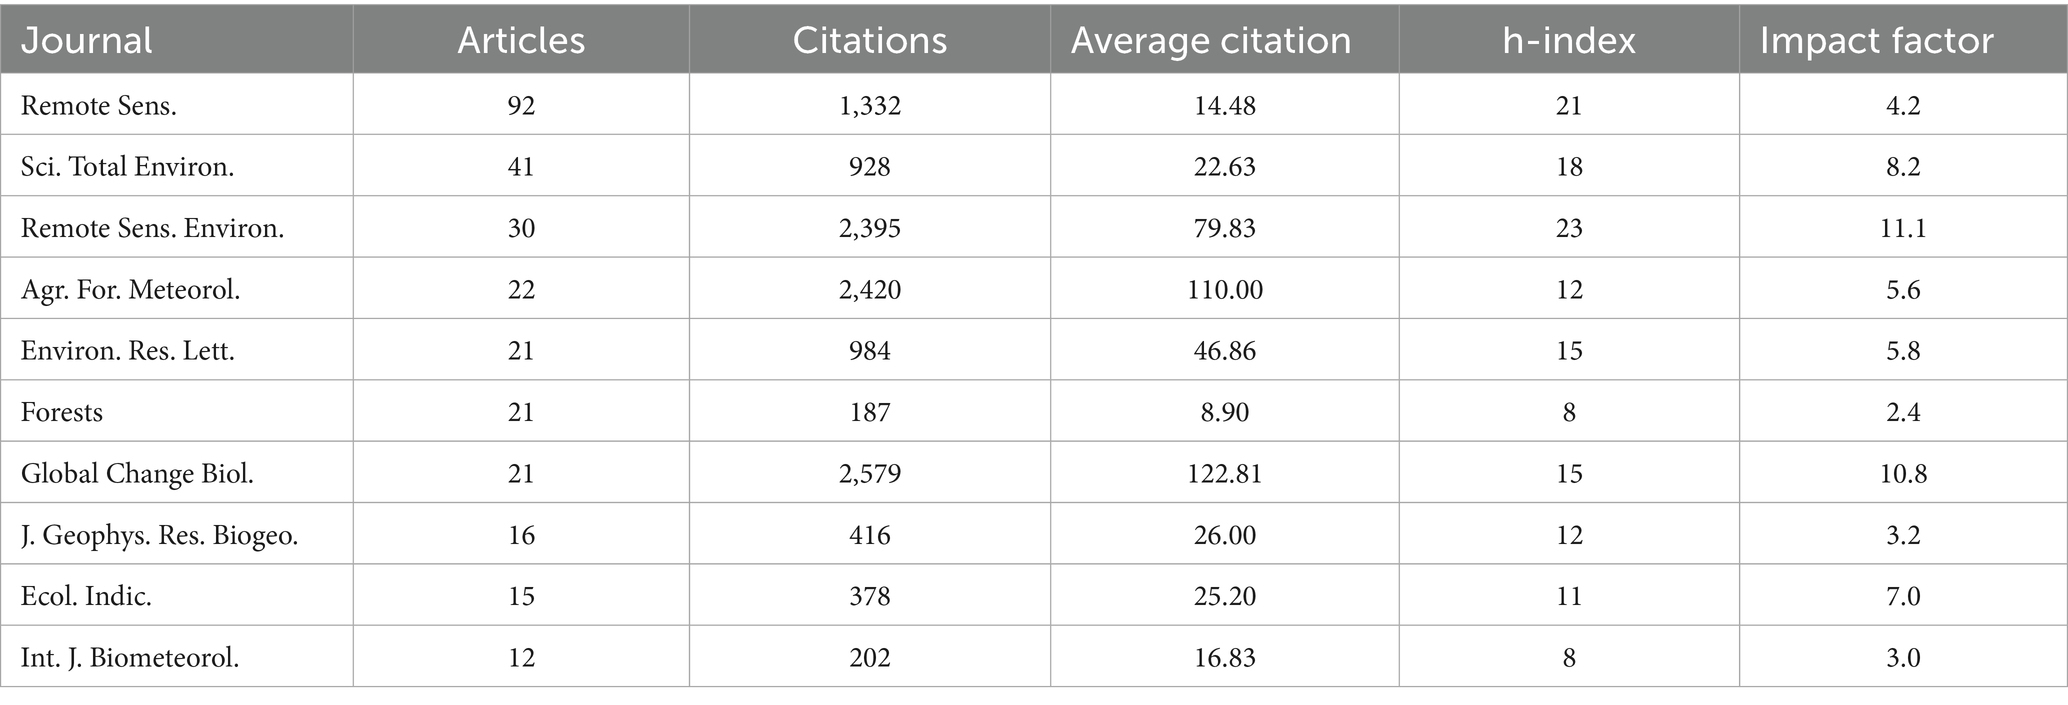
Table 5. Top 10 journals with the most articles publication.
The citation relationships between journals reveal two prominent citation pathways, both represented by blue paths. The upper blue path illustrates citation flows from journals in the fields of ecology, earth, and ocean sciences to journals in the domains of geophysics, earth sciences, and geography. The lower blue path shows citation flows from journals in ecology, earth, and ocean sciences to those in plant science, ecology, and zoology (Figure 7).
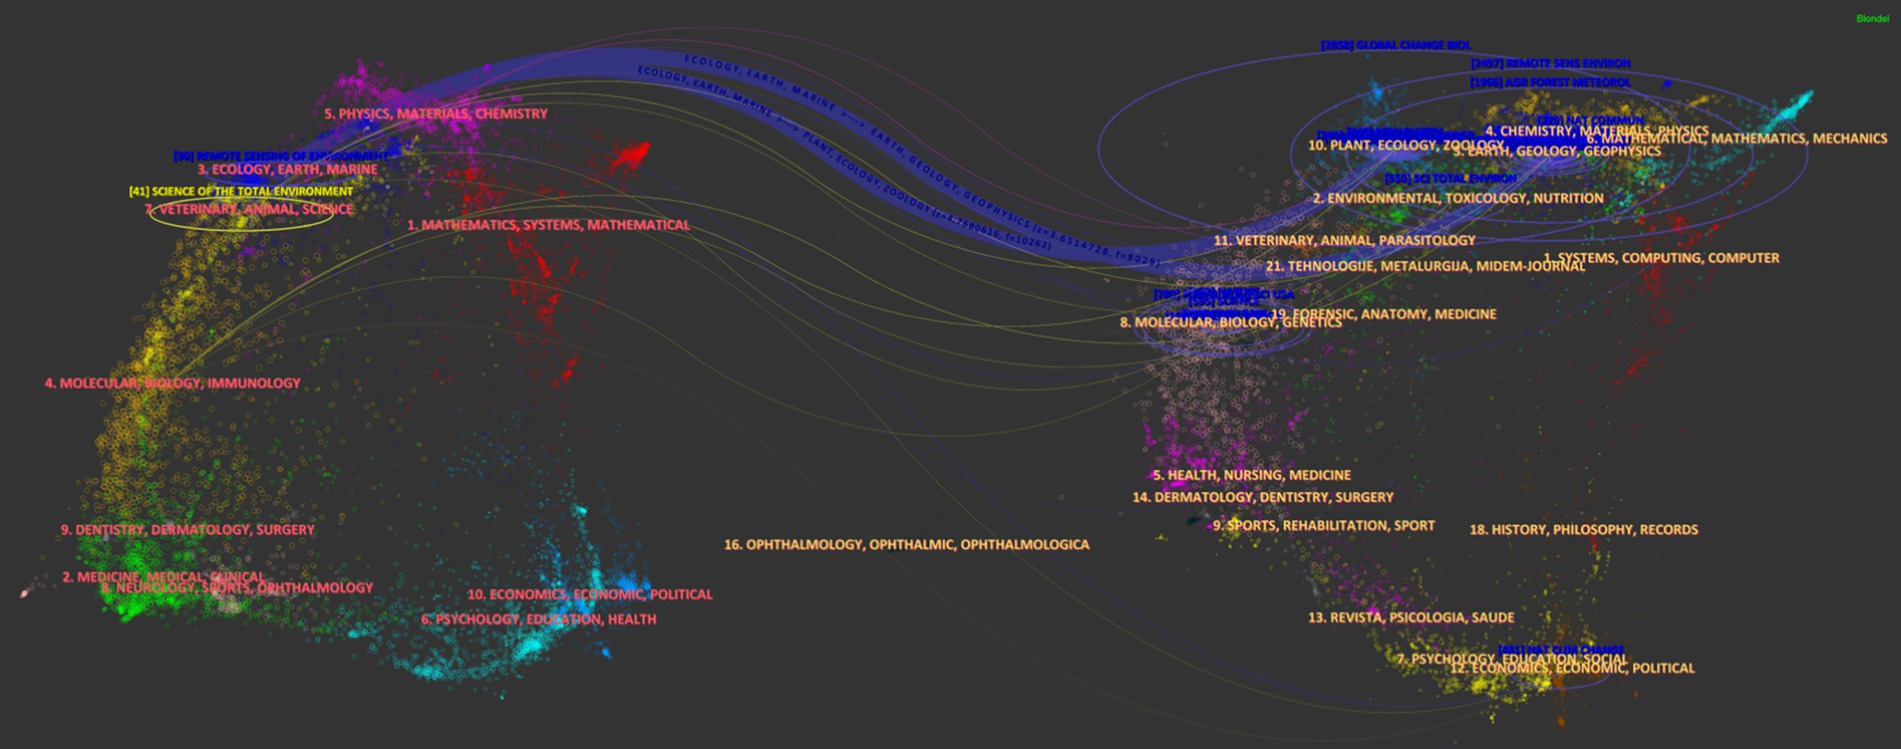
Figure 7. Overlay dual-map of journals. Citing journals (targets) are positioned on the left, while cited journals (sources) are positioned on the right. The colored pathways represent the citation flows.
3.2 Keyword analysis
256 keywords were extracted from 599 articles using a co-occurrence frequency threshold of 5. Synonymous keywords were merged, such as “climate-change” and “climate change.” After merging 30 keywords, the analysis was rerun and visualized. In the co-occurrence network, each node represents a keyword, with its size proportional to frequency. The network formed three clusters: red, green, and blue (Figure 8). The top 10 keywords in each cluster are: Climate change, Phenology, NDVI, Remote sensing, China, Vegetation, Forest, Ecosystem, Drought, Grassland (Red cluster); Spring phenology, Temperature, Land-surface phenology, Growing season, Responses, Plant phenology, Qinghai-Tibetan Plateau, Precipitation, Green-up, Green-up date (Blue cluster); Vegetation phenology, Time-series, MODIS, Climate-change impacts, Dynamics, Vegetation growth, Trends, Satellite data, Variability, Model (Green cluster) (Table 6). Node color transitions from blue to yellow, indicating keyword emergence during 2017–2021 (Figure 9).
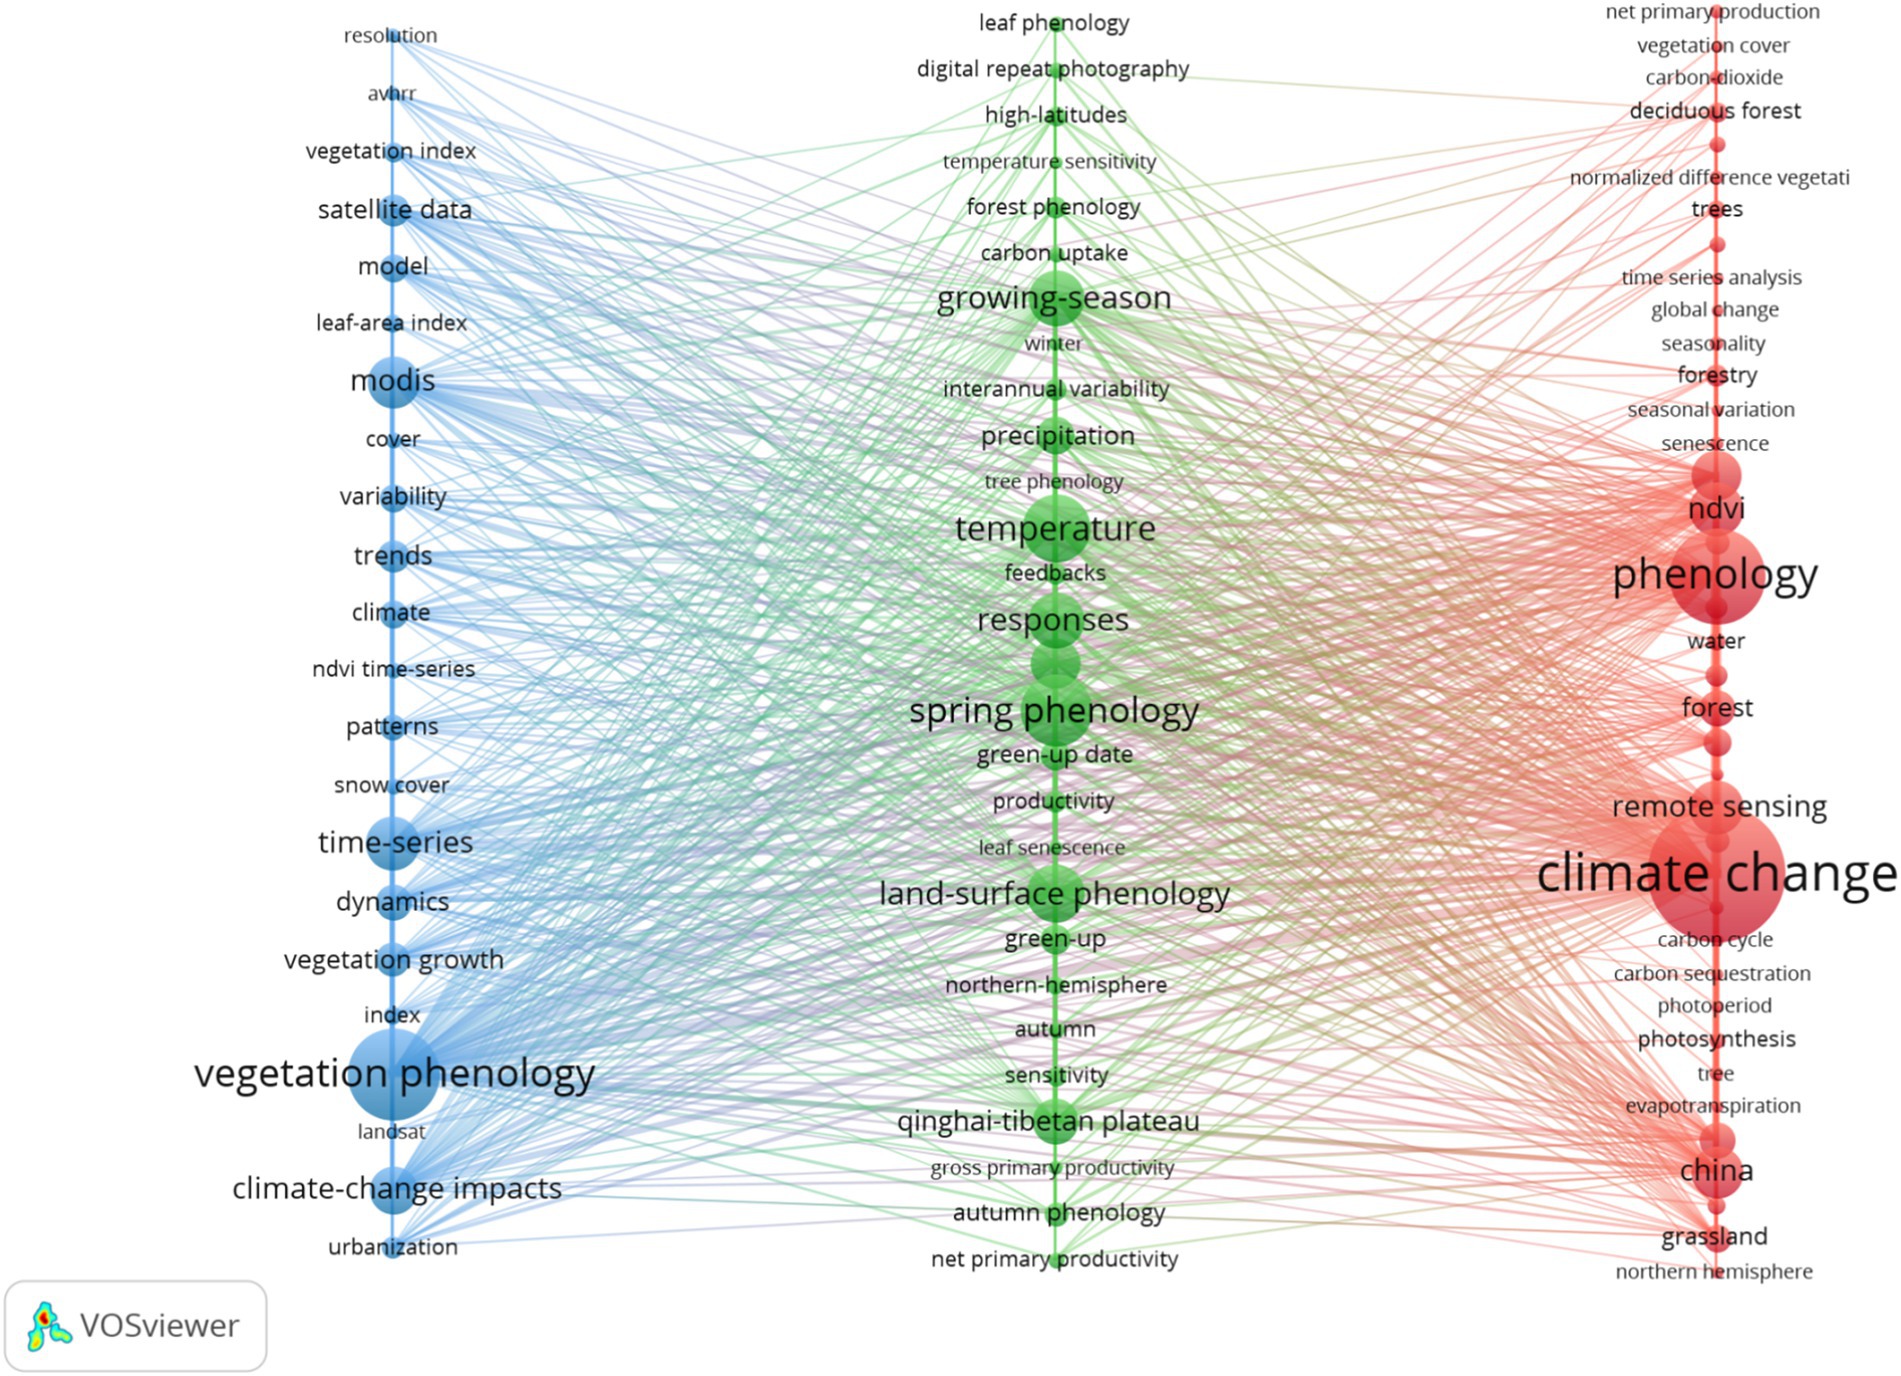
Figure 8. Co-occurrence keywords network visualization undertaking vegetation phenology research (1995–2024).
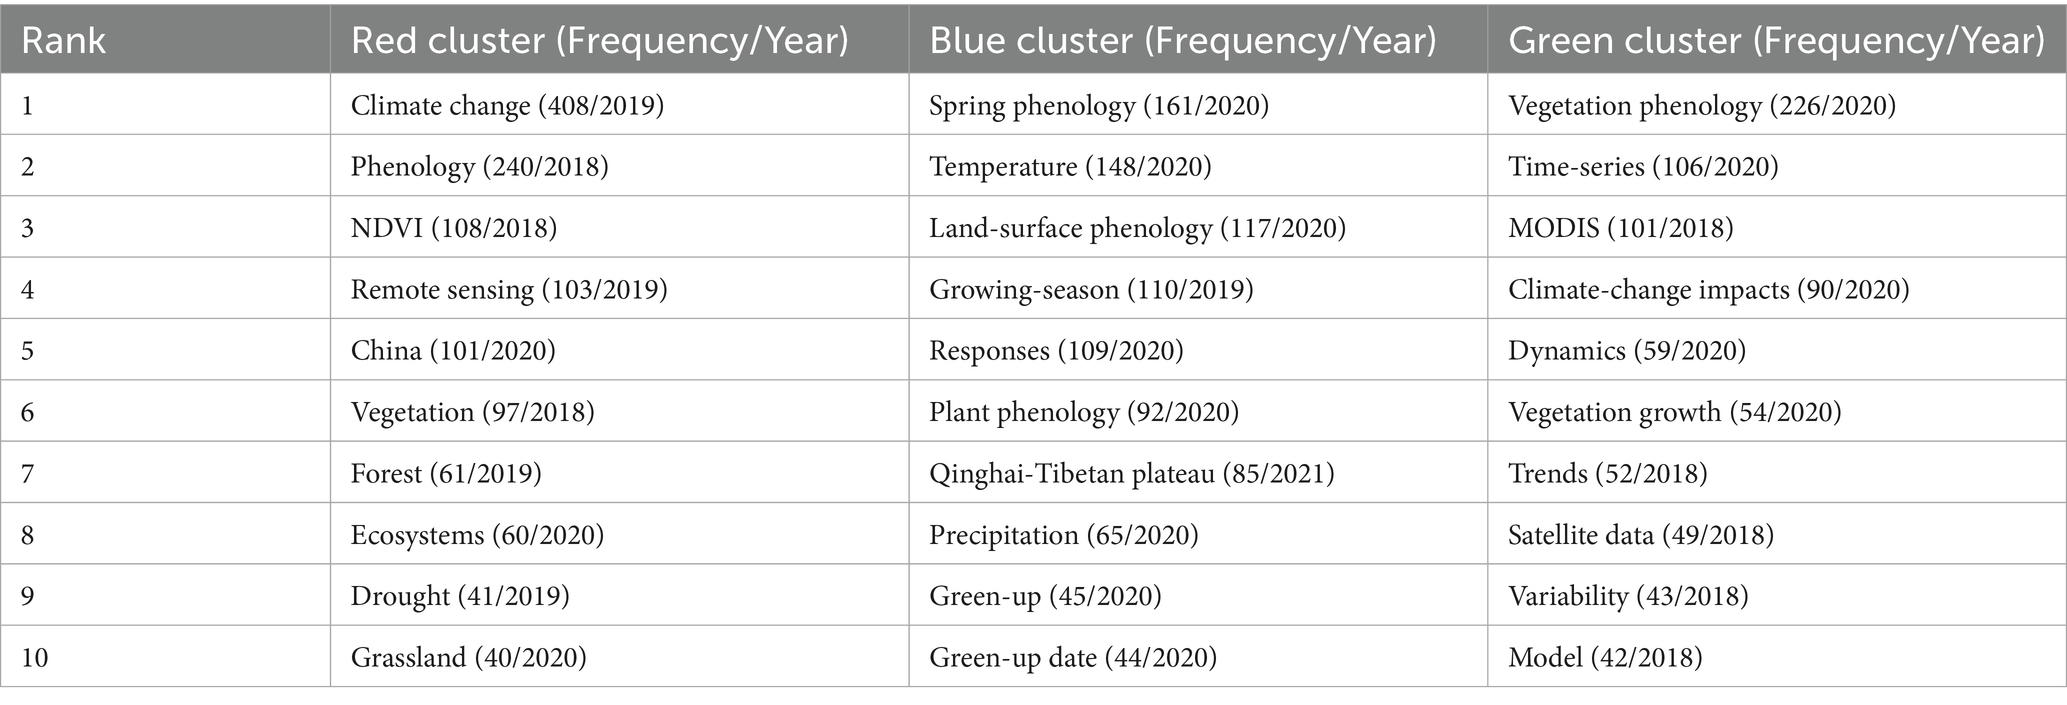
Table 6. Top 10 keywords with the most articles publication.
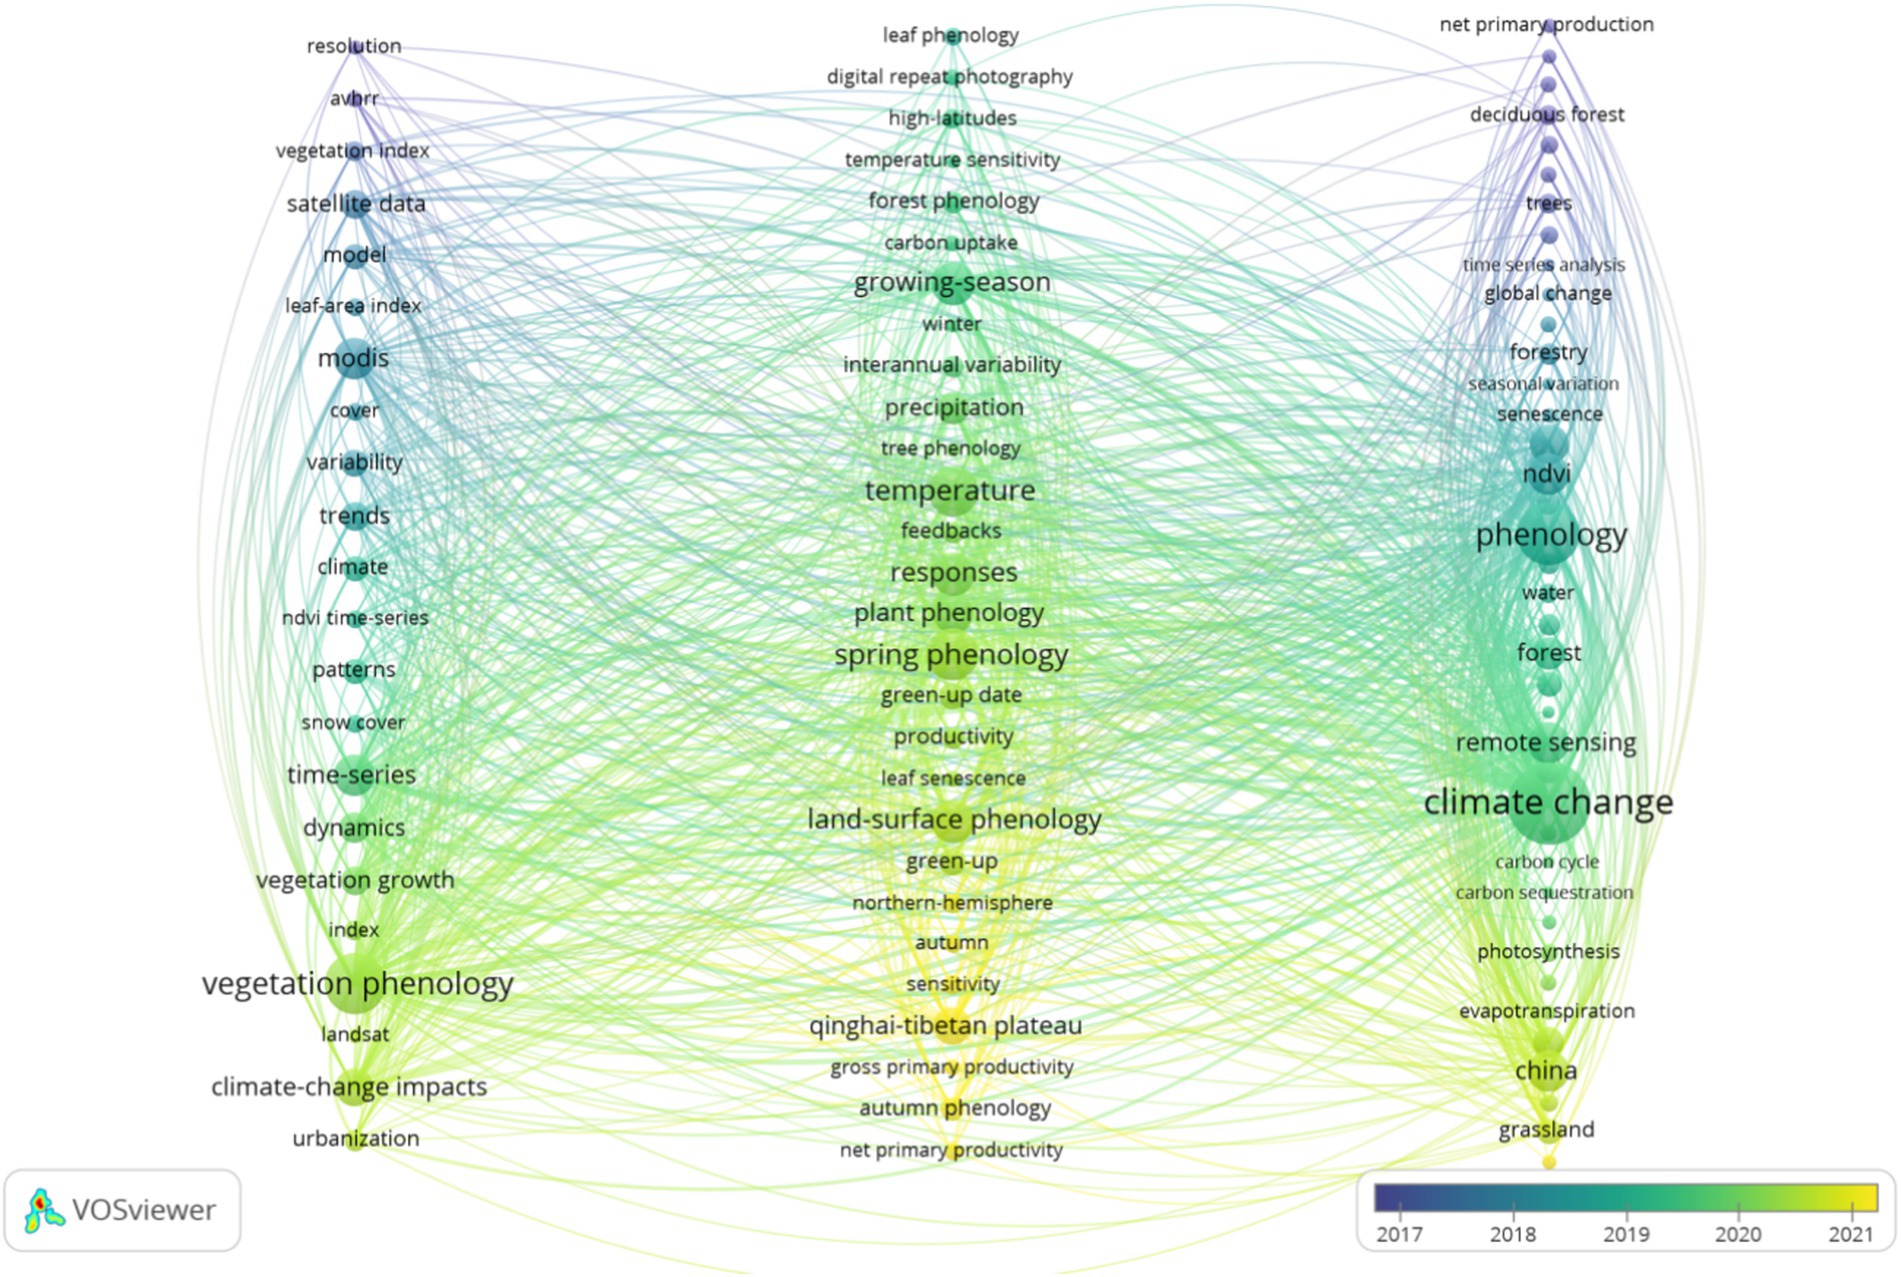
Figure 9. Co-occurrence keywords time visualization.
3.3 Theme evolutionary analysis
3.3.1 The thematic overlapping map
The thematic evolution in this research field is shown from left to right across four intervals: 1995–2012, 2013–2016, 2017–2020, and 2021–2024. From 1995 to 2012, 51 themes emerged, 14 of which faded, yielding a retention rate of 73% (37 themes). In 2013–2016, 84 themes were identified, including 47 new and 16 obsolete ones, with 68 themes (81%) carried forward. During 2017–2020, 116 themes appeared, 48 were new, 22 dropped, and 94 (81%) continued. From 2021 to 2024, the total increased to 125 themes, with 31 newly introduced (Figure 10).
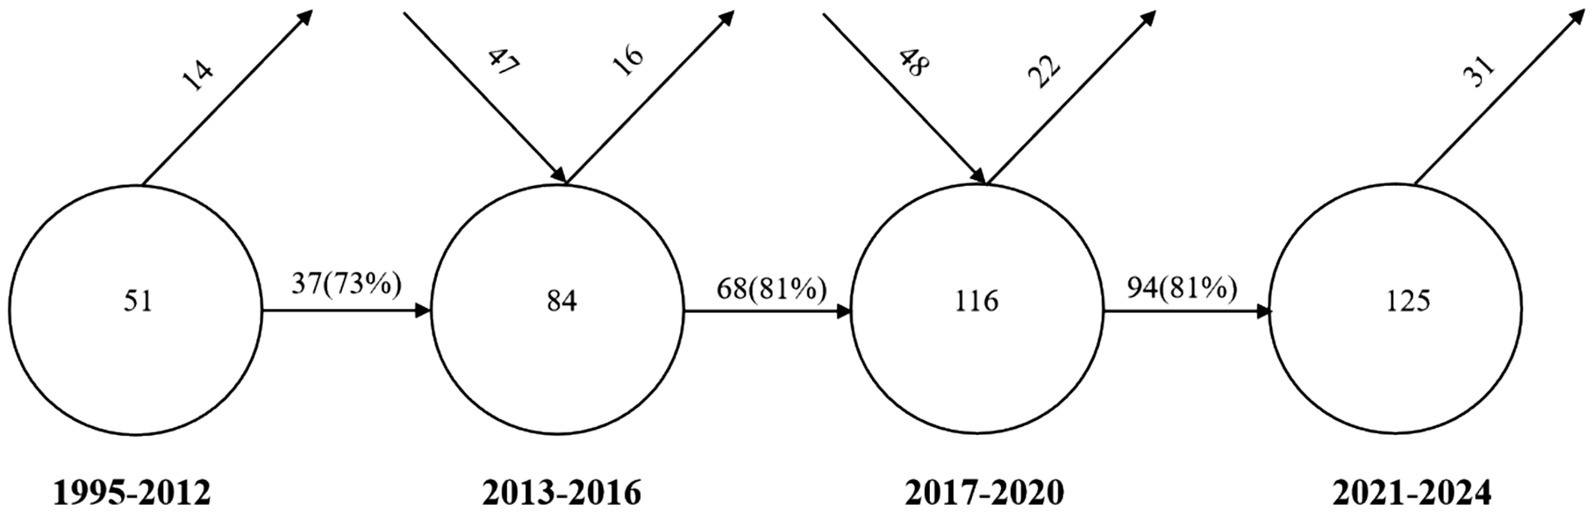
Figure 10. The thematic overlapping map. The downward arrows mark emerging topics for this period, while upward arrows highlight declining topics. Horizontal arrows indicate topics persisting from one stage to the next, with accompanying numbers. The proportions of retained topics relative to the total topics for each period are shown in parentheses.
3.3.2 Thematic evolution map
The evolutionary paths of themes indicate that a significant number of new thematic terms emerged in all four intervals. The seven most prominent thematic evolution pathways are as follows: (1) “Plant, MODIS, Energy Flux, Tree, Growth” → “NDVI, Soil, Climate Change Impacts, Climate” → “Climate Change, Season, Growth” → “Climate change”; (2) “Plant, Tree, Growth” → “Soil” → “Color Indexes” → “Savanna”; (3) “Plant, MODIS, Energy Flux, Tree, Growth” → “Soil, Radiometers, Environmental Factor” → “Grassland, Watersheds, Extreme Event, End of Growing Season” → “Grassland”; (4) “Plant, MODIS, Energy Flux, Growth” → “NDVI, Climate Change Impacts” → “Climate Change” → “Vegetation Green-Up”; (5) “Plant, Tree, Growth” → “Soil, Radiometers” → “Grassland” → “Global Warming”; (6) “Plant, MODIS, Energy Flux” → “NDVI, Climate Change Impacts, Climate” → “Growth, Boreal Regions” → “Patterns”; (7) “Plant, Energy Flux” → “Environmental Factors” → “Extreme Event” → "Environmental Factor” (Figure 11).
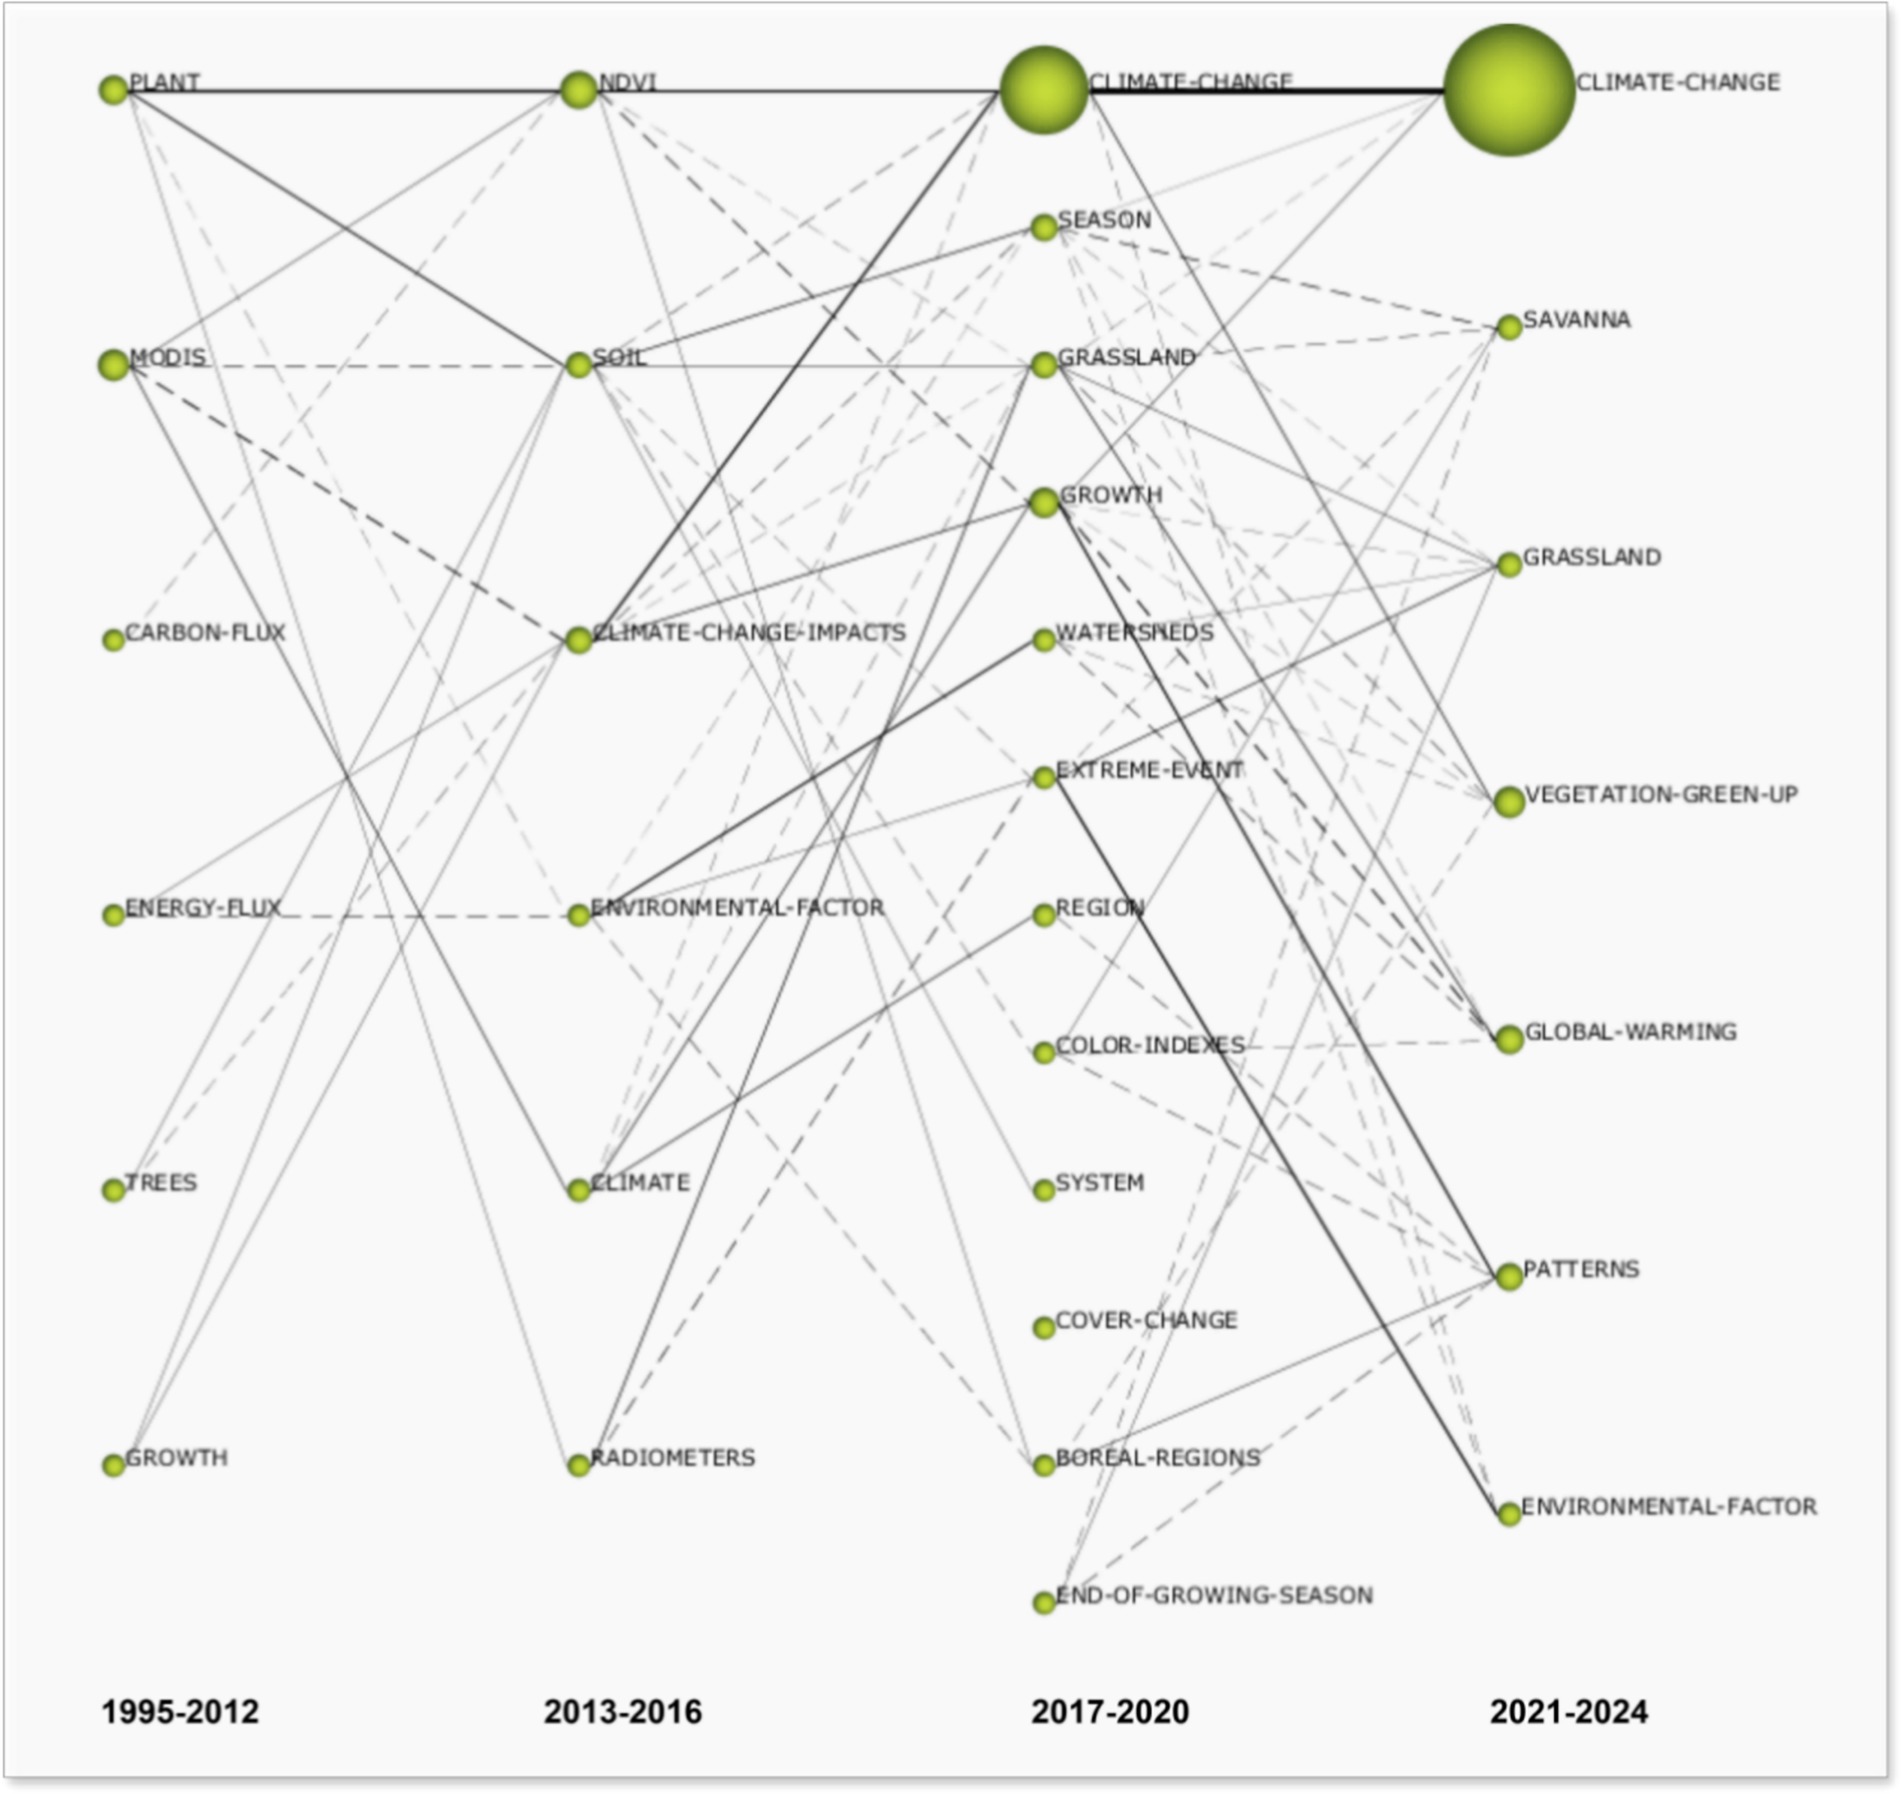
Figure 11. The thematic evolution map. Nodes represent clustered themes, with their size reflecting the volume of related literature. Solid lines between nodes in adjacent periods indicate shared primary (core) keywords, representing mainstream evolution paths, while dashed lines indicate shared secondary keywords, representing minor evolutionary paths. The color and thickness of the lines correspond to theme similarity-darker and thicker lines indicate stronger associations and greater evolutionary potential. Isolated nodes represent themes unique to a specific period, with no connection to themes before or after.
3.3.3 Strategic coordinate diagram
From 1995–2012, key topics were “Plant” and “MODIS,” with “Growth” and “Trees” emerging. In 2013–2016, “Soil,” “NDVI,” and “Radiometers” led, while “Climate Change Impacts” showed potential. Between 2017 and 2020, “Watersheds,” “Grassland,” “Extreme Event,” and “Climate Change” were central themes, with “Season,” “Growth,” and “Region” emerging. From 2021–2024, “Savanna,” “Grassland,” and “Climate Change” remained dominant themes, and “Global Warming” emerged as a promising topic (Figure 12). The results show that driving and emerging topics vary by period.
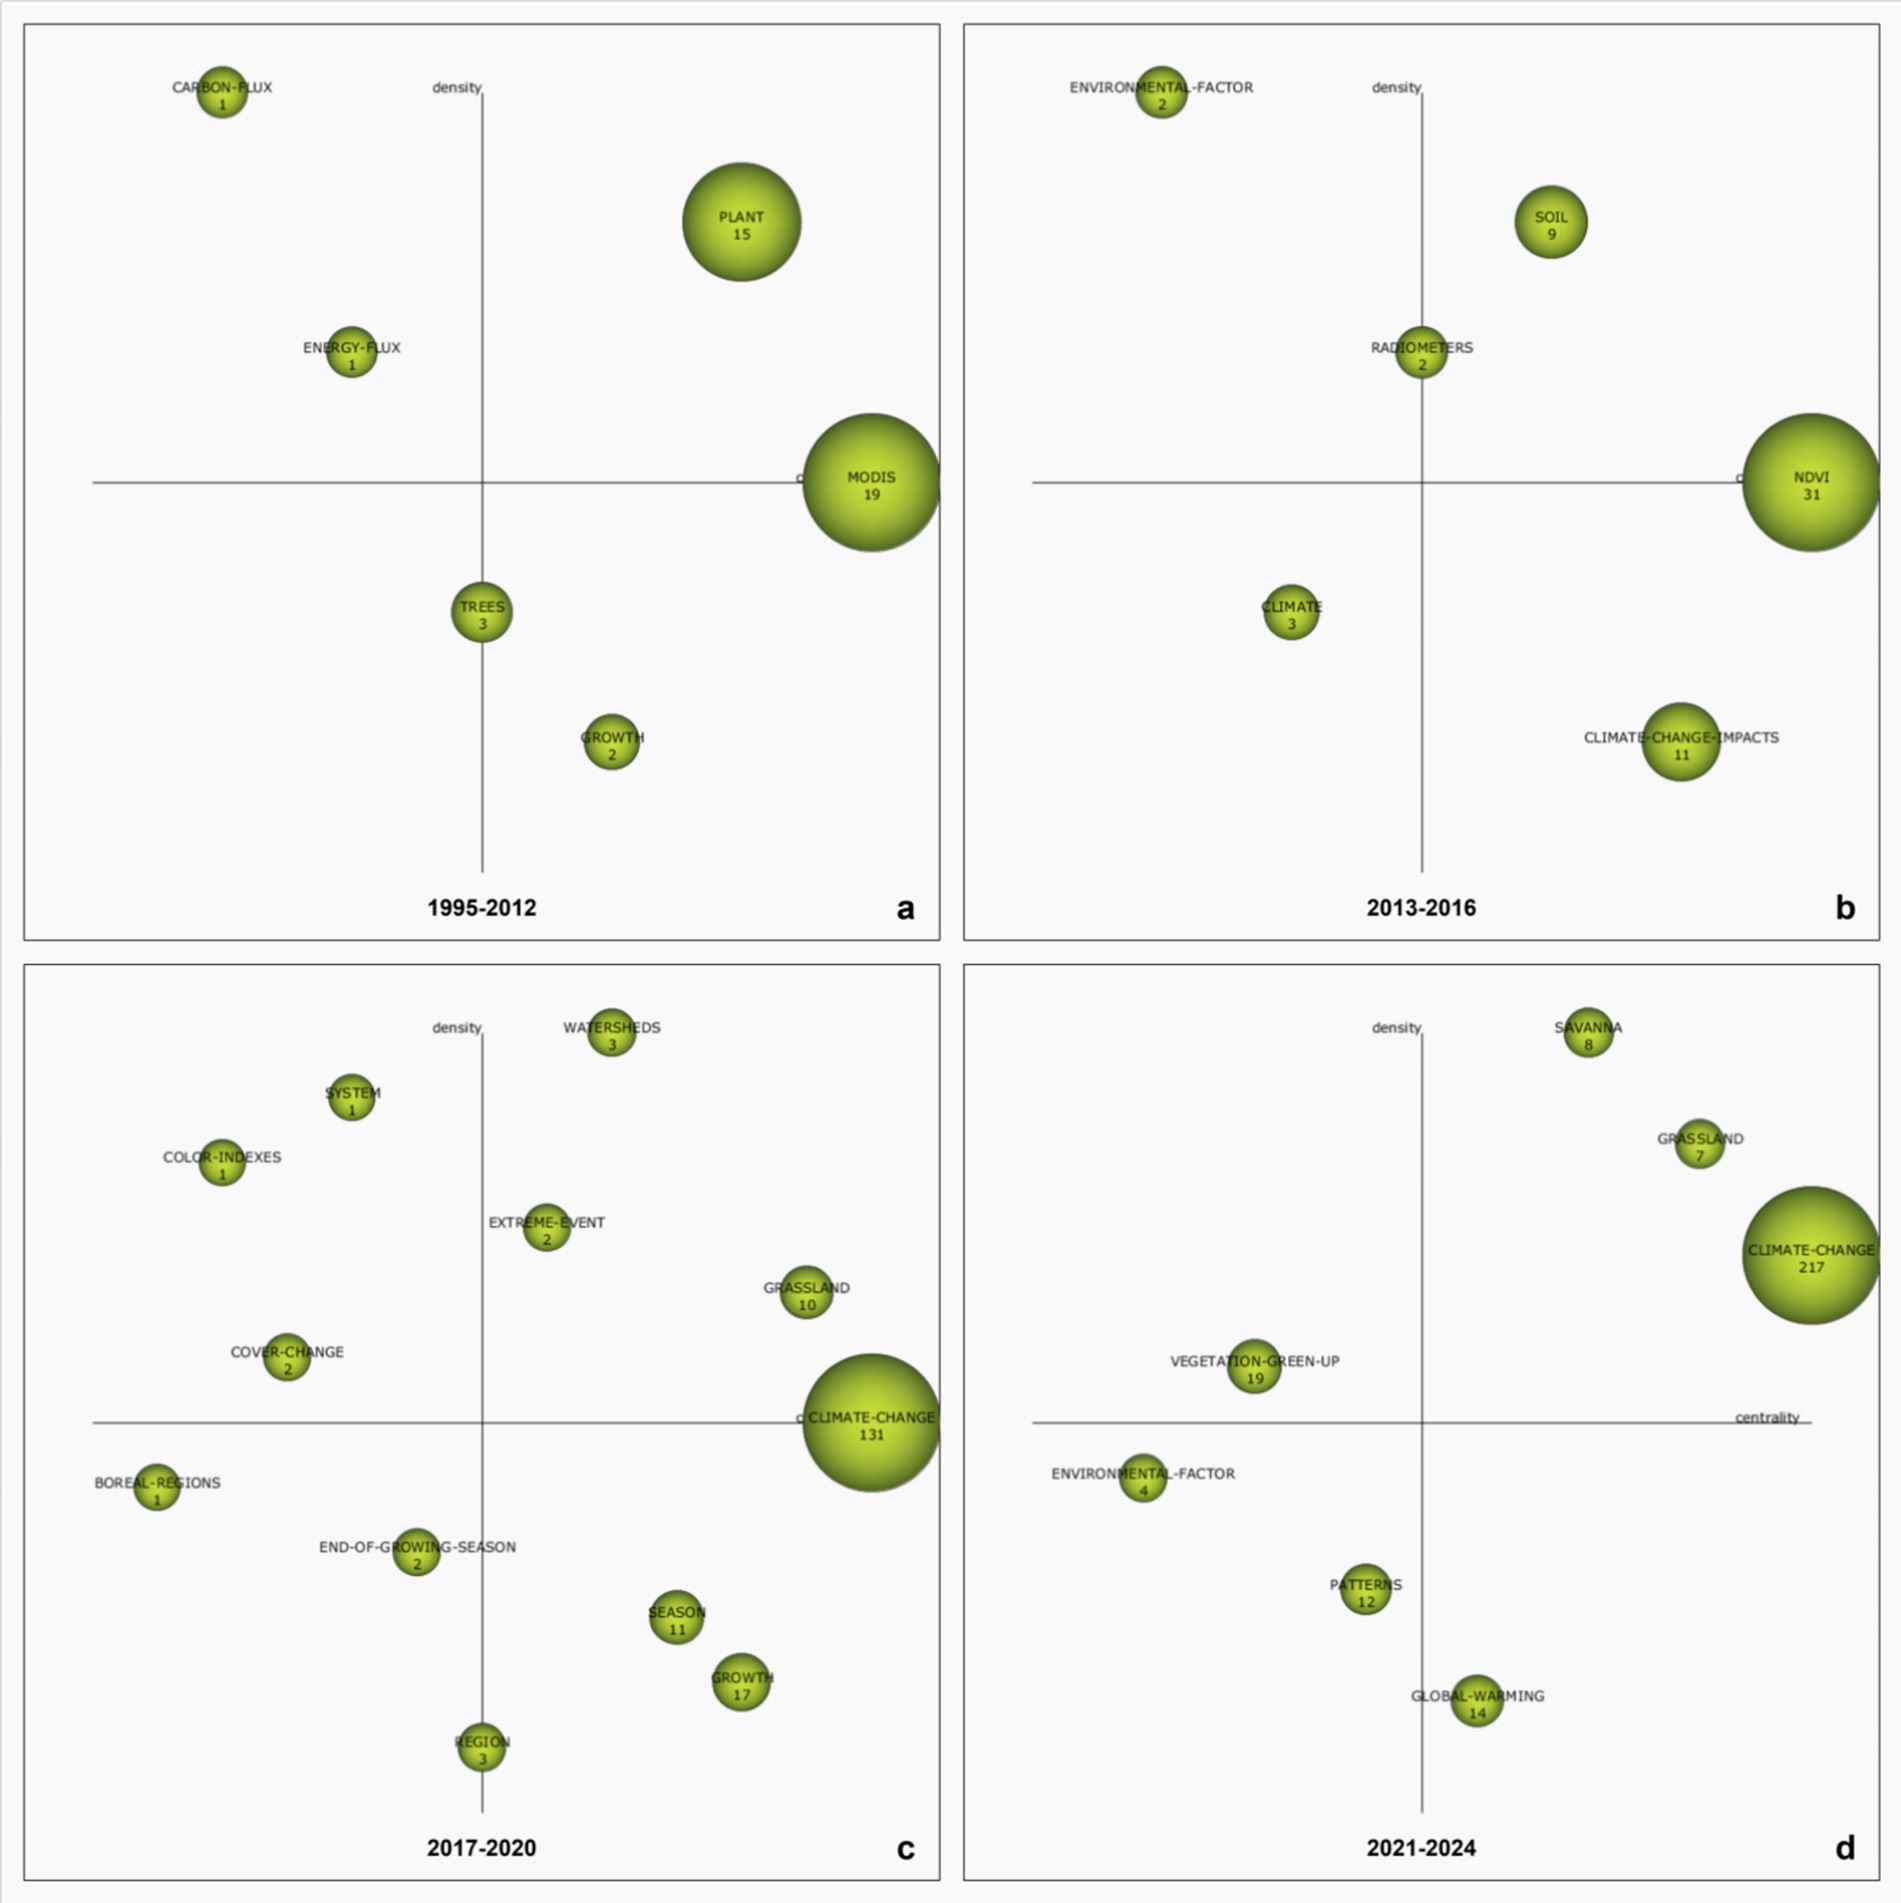
Figure 12. Strategic coordinate diagrams generated by SciMAT. (a) 1995–2012; (b) 2013–2016; (c) 2017–2020; (d) 2021–2024. Nodes represent research topics, with larger nodes indicating higher research activity. The horizontal axis shows topic relevance, while the vertical axis reflects maturity. The upper-left quadrant includes mature but isolated topics, the lower-left shows emerging or declining ones, the upper-right highlights core and influential topics, and the lower-right indicates underdeveloped areas with potential for future research.
3.4 Co-citation and cluster analysis
3.4.1 Citing articles and cited references
This study set the G-index at k = 25 to ensure a balance between including highly cited references and capturing emerging but less-cited works, following common practice in bibliometric studies. Based on this standard, 25,028 citations were extracted from 599 papers, identifying 13 major clusters with 870 nodes. The network modularity (Q = 0.7254) and average Silhouette score (S = 0.8845) indicate strong and coherent clustering. Clusters 0 (vegetation phenology), 1 (temperate forest phenology), and 2 (winter wheat) show high internal consistency and importance. Clusters 1 and 5 (urban spring vegetation phenology) are relatively recent, emerging around 2019, while clusters 4 (deciduous broadleaf forest) and 10 (digital photography) appeared earlier (Figure 13; Table 7).
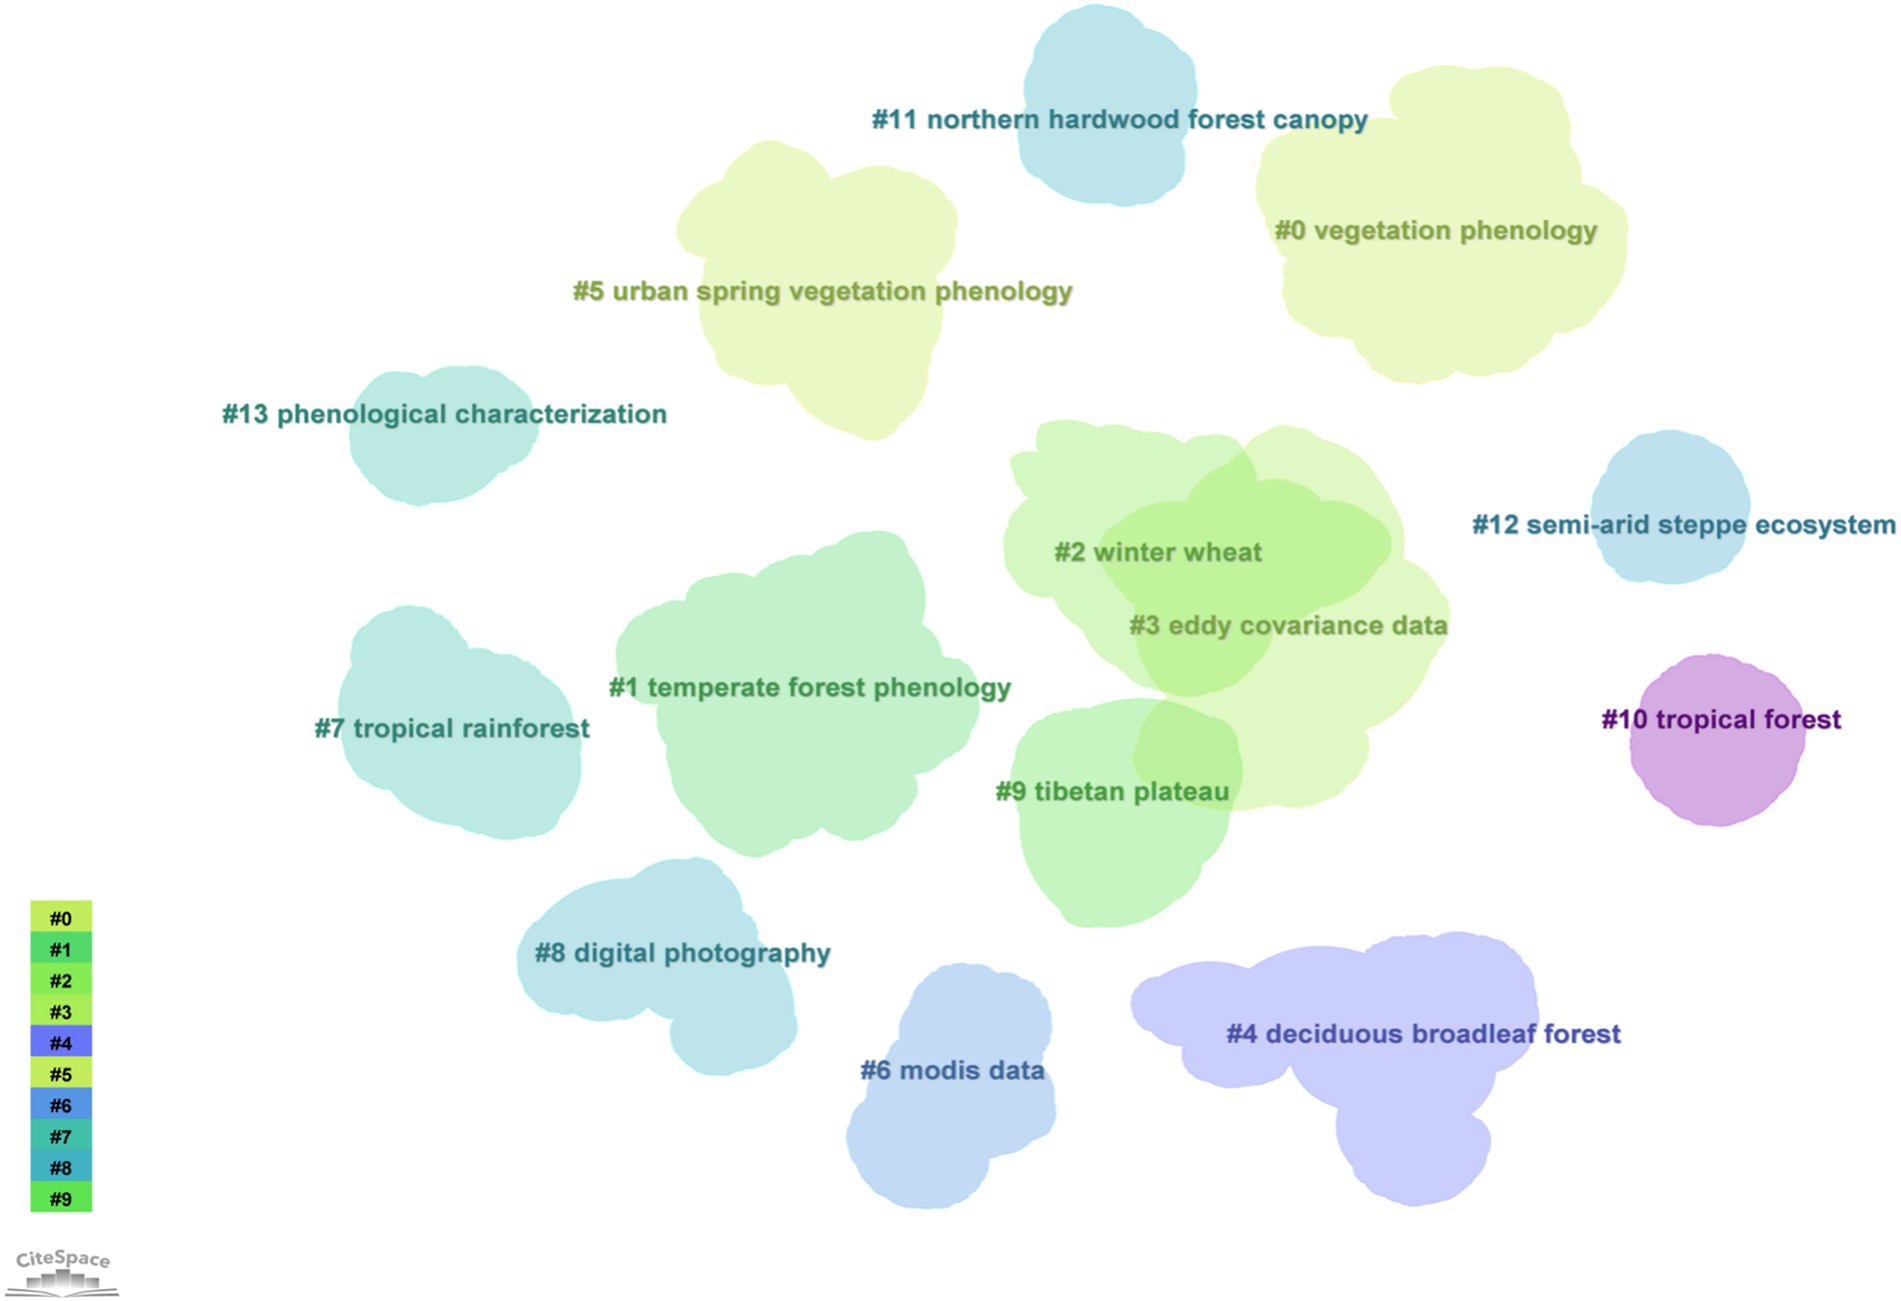
Figure 13. Co-citation clusters in vegetation phenology research (1995–2024).
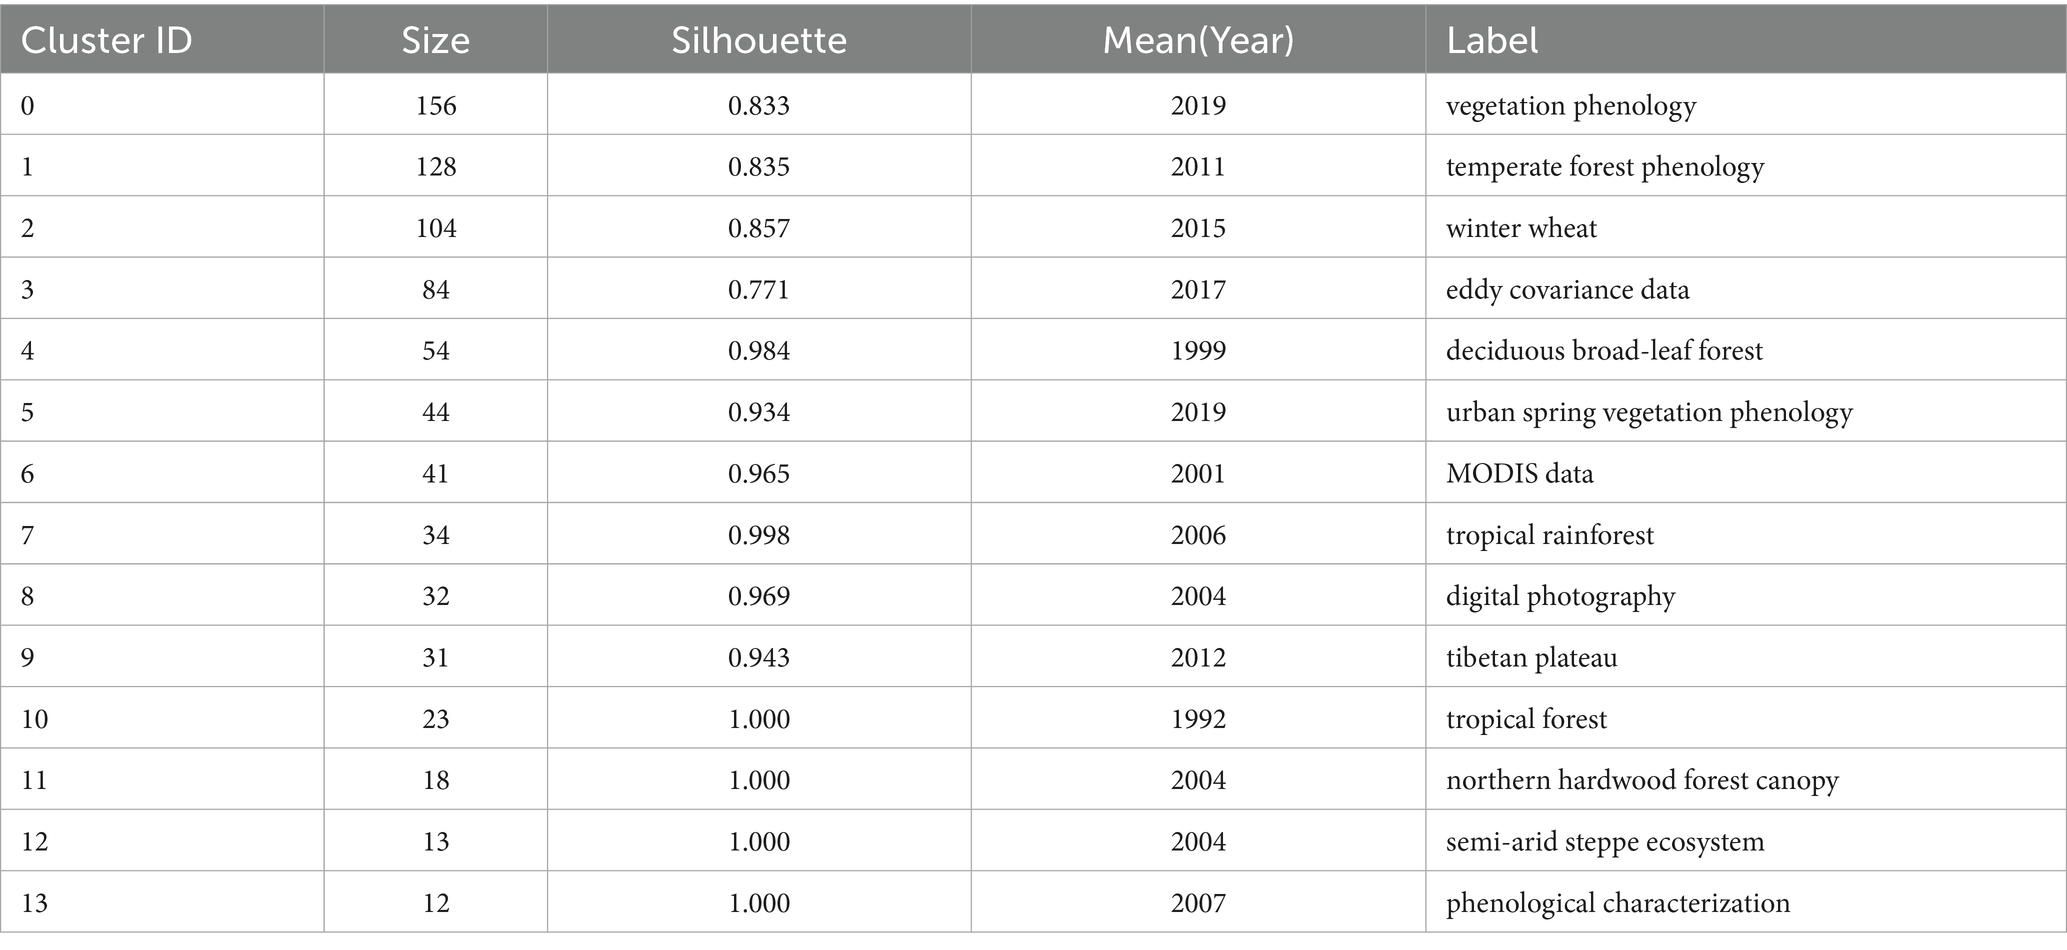
Table 7. The size, silhouette and label of 13 co-citation clusters in vegetation phenology research (1995–2024).
Clusters 4, 6, 7, and 8 emerged earlier in the timeline. Cluster 1 has the longest duration, spanning from 2005 to 2023. Clusters 0, 1, 2, 3, and 5 have relatively long duration and have remained active in recent years (Figure 14). These clusters also contain papers with high citation counts, suggesting that the articles within these clusters represent recent research hotspots.
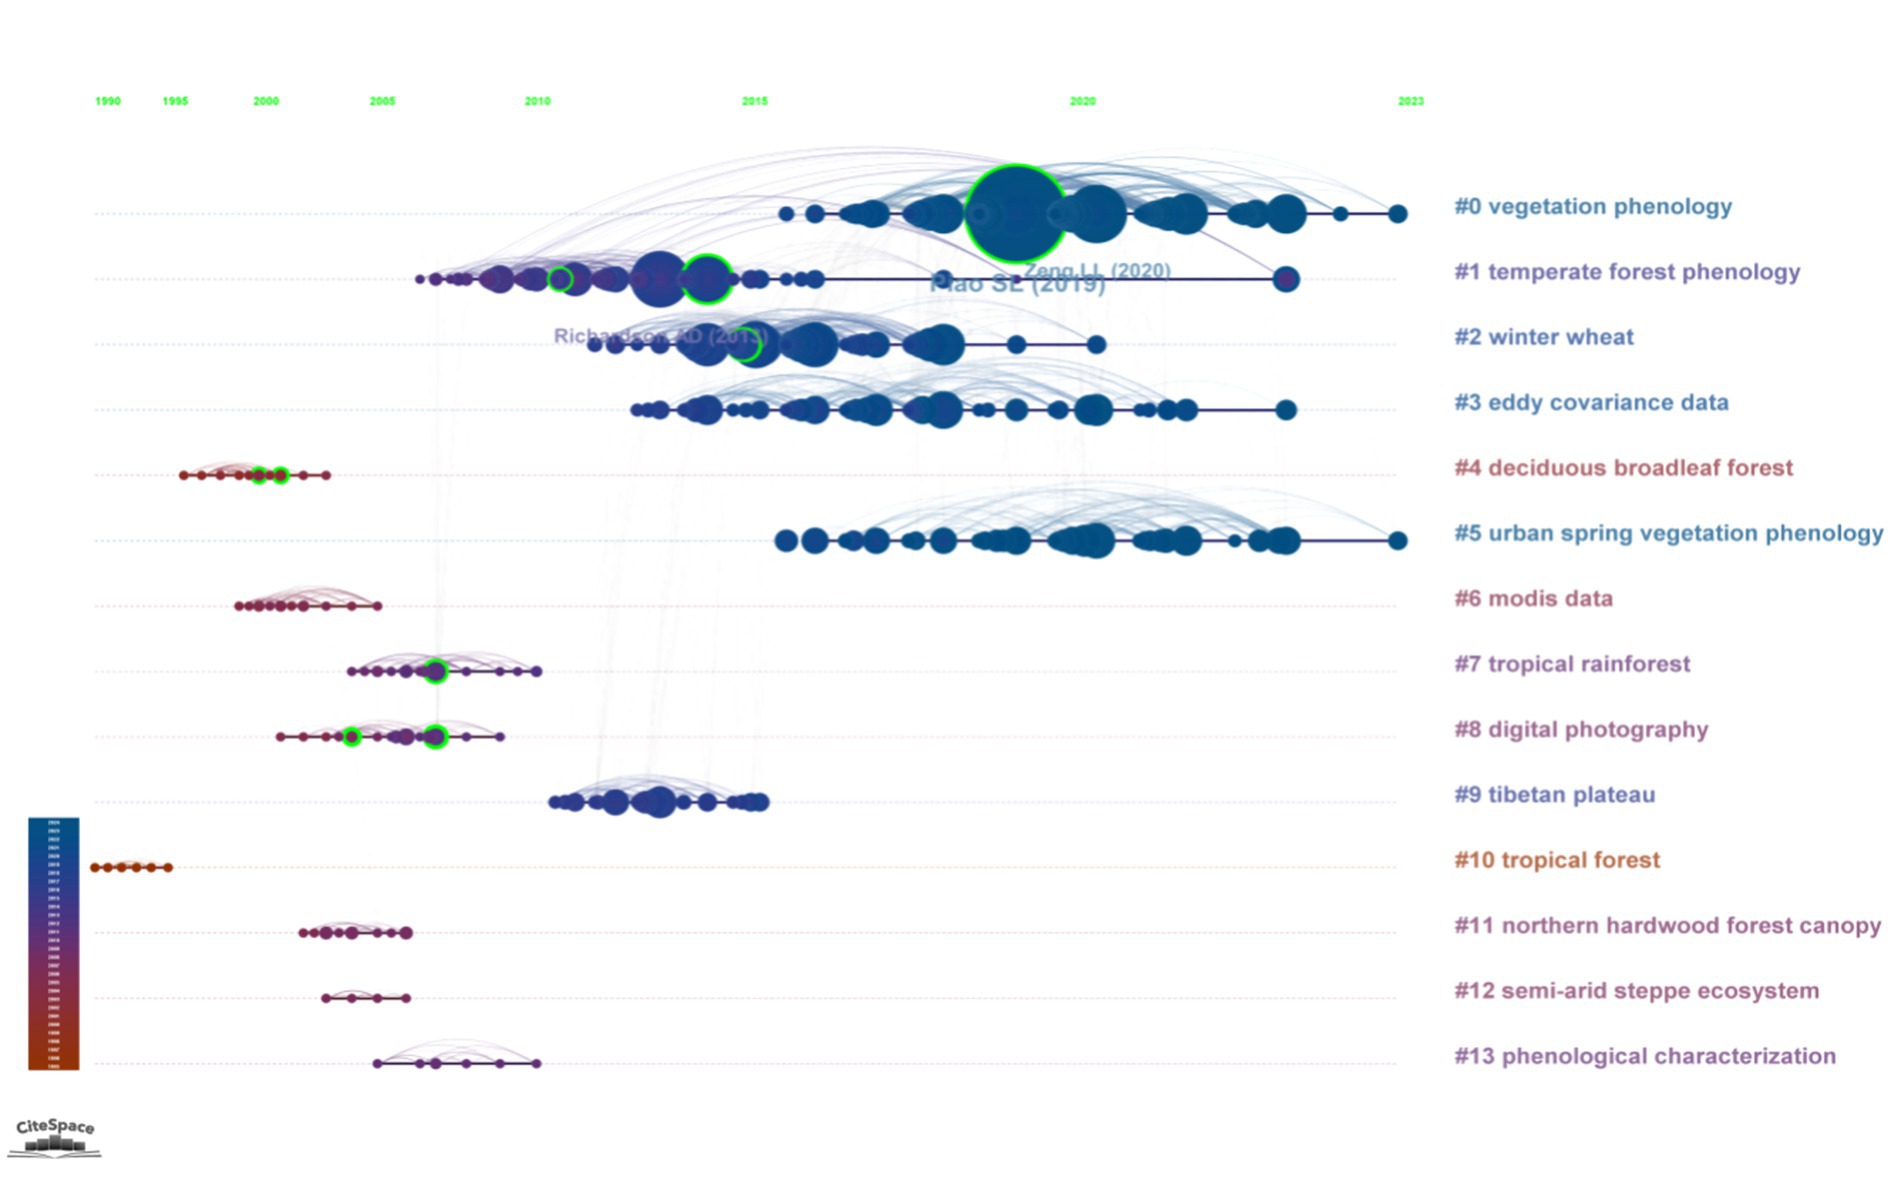
Figure 14. The timelines of co-citation clusters in vegetation phenology research (1995–2024). The size of the nodes represents the number of citations of the papers, and the edges indicate the co-citation relationships between the papers.
Citing Articles represent the research frontiers, Coverage shows how many references from the cluster are cited by an article, Cited References indicate the cluster’s foundational literature, and Cites reflect how often a paper is cited. For the five most active clusters in recent years (Clusters #0, #1, #2, #3, and #5), the top five results for both Citing Articles and Cited References are as follows:
Cluster #0, “vegetation phenology,” is the largest cluster in this research domain. The most closely related studies to this cluster include works by Piao et al. (2019), Zeng et al. (2020), Shen et al. (2018), Wu et al. (2021), and Wang L. et al. (2022), which are the most frequently cited and represent the foundational research in this field. The top five citing authors in this area, who represent the current research frontier, include Shen X. et al. (2022), Zhang J. et al. (2022), Yin et al. (2024), Yang and Zhao (2023), and Peng et al. (2024) (Table 8).
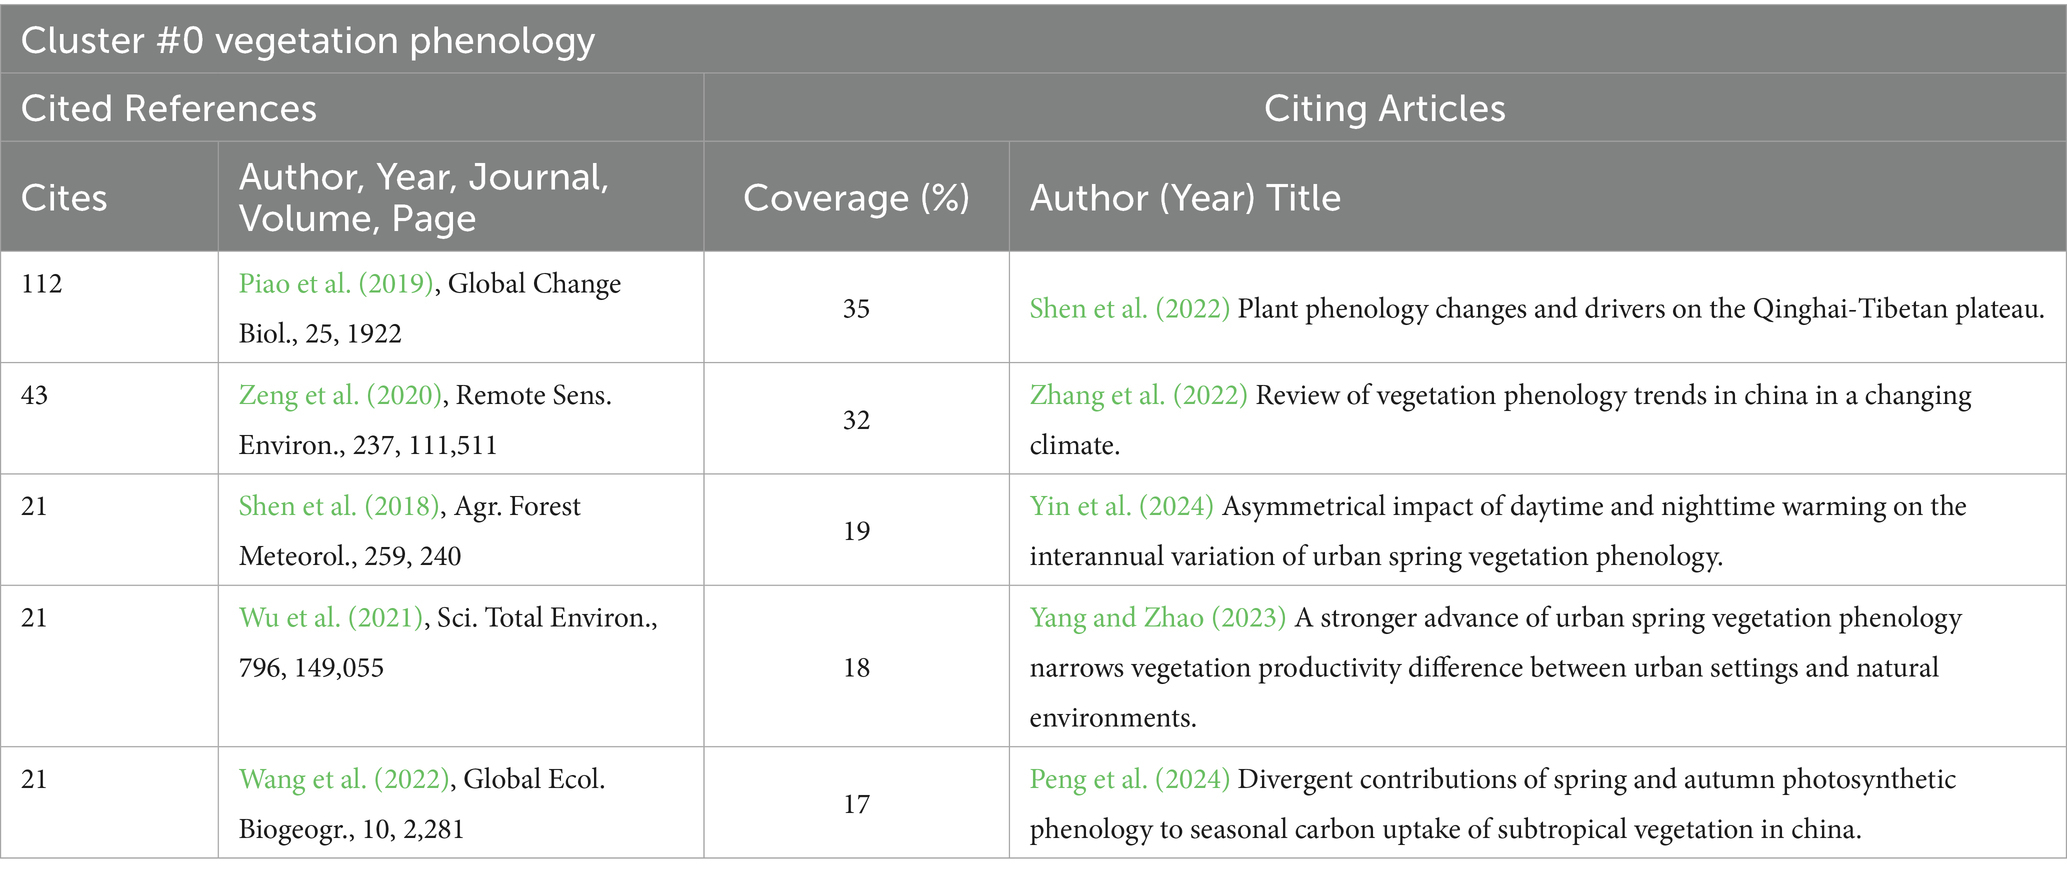
Table 8. Cited references and citing articles of Cluster #0 vegetation phenology.
Cluster #1, “temperate forest phenology,” is the longest-lasting cluster in the field of research. Among the most closely related literature to this cluster, the works of Richardson et al. (2013), Shen et al. (2014), Jeong et al. (2011), White et al. (2009), and Sonnentag et al. (2012) have the highest citation frequencies and represent the foundational research in this field. The top five Citing Articles in this cluster, which represent the current research frontier, are those by Cong, et al., (2017), Forkel et al. (2014), Keenan et al. (2014b), Yang et al. (2012), and Keenan et al. (2014a) (Table 9).
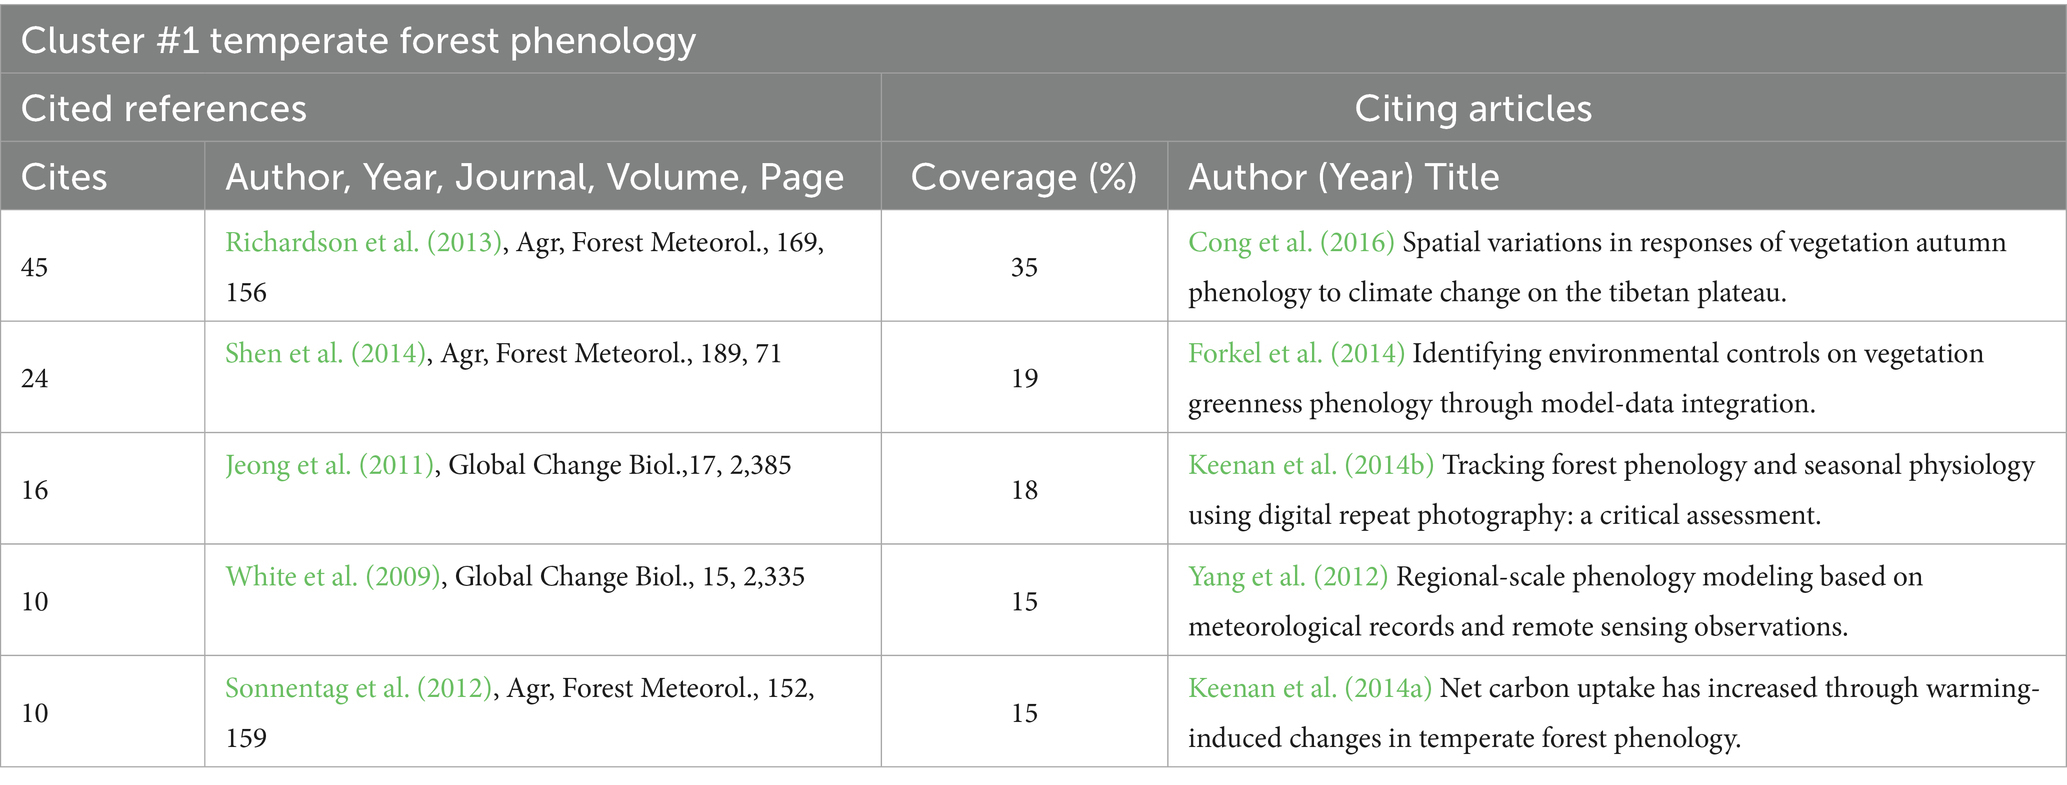
Table 9. Cited references and citing articles of Cluster #1 temperate forest phenology.
Cluster #2, “winter wheat,” is one of the most prominent clusters in recent years within the field of research. Among the literature most closely associated with this cluster, the works of Liu et al. (2016a), Piao et al. (2015), Fu et al. (2015), and Keenan et al. (2014a) have the highest citation frequencies and represent the foundational research in this area. The top five Citing Articles for this cluster, which reflect the current research frontier, are those by Cong, et al., (2017), Yang et al. (2017), Yuan et al. (2020), Caparros-Santiago et al. (2021), and Wu et al. (2018) (Table 10).
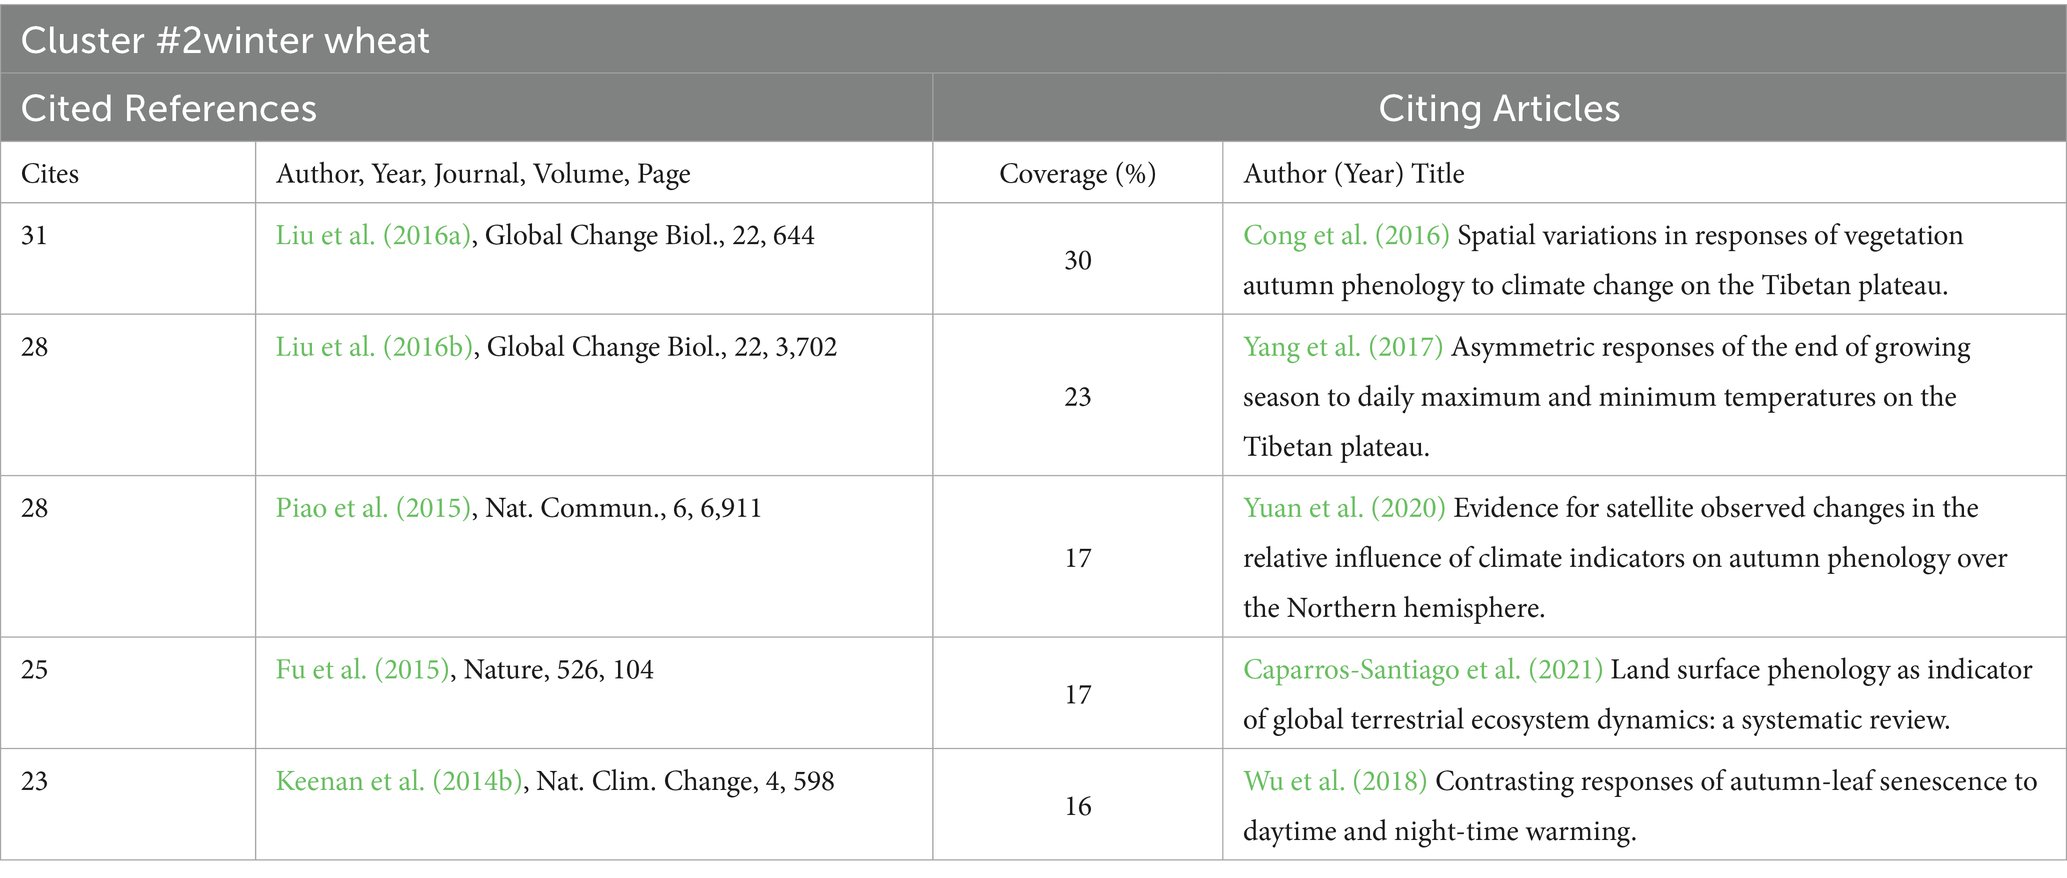
Table 10. Cited references and citing articles of Cluster #2 winter wheat.
Cluster #3, “eddy covariance data,” is a highly active and emerging research cluster in recent years within this field. The most closely related studies to this cluster, including works by Richardson et al. (2018a), Bolton et al. (2020), Bórnez et al. (2020), Klosterman et al. (2018), and Zhang X. et al. (2017), are the most frequently cited and represent the foundational research in this area. The top five citing authors, who are at the forefront of this field, include Richardson et al. (2018b), Caparros-Santiago et al. (2021), Gray and Ewers (2021), Zhang et al. (2022), and Uphus et al. (2021) (Table 11).
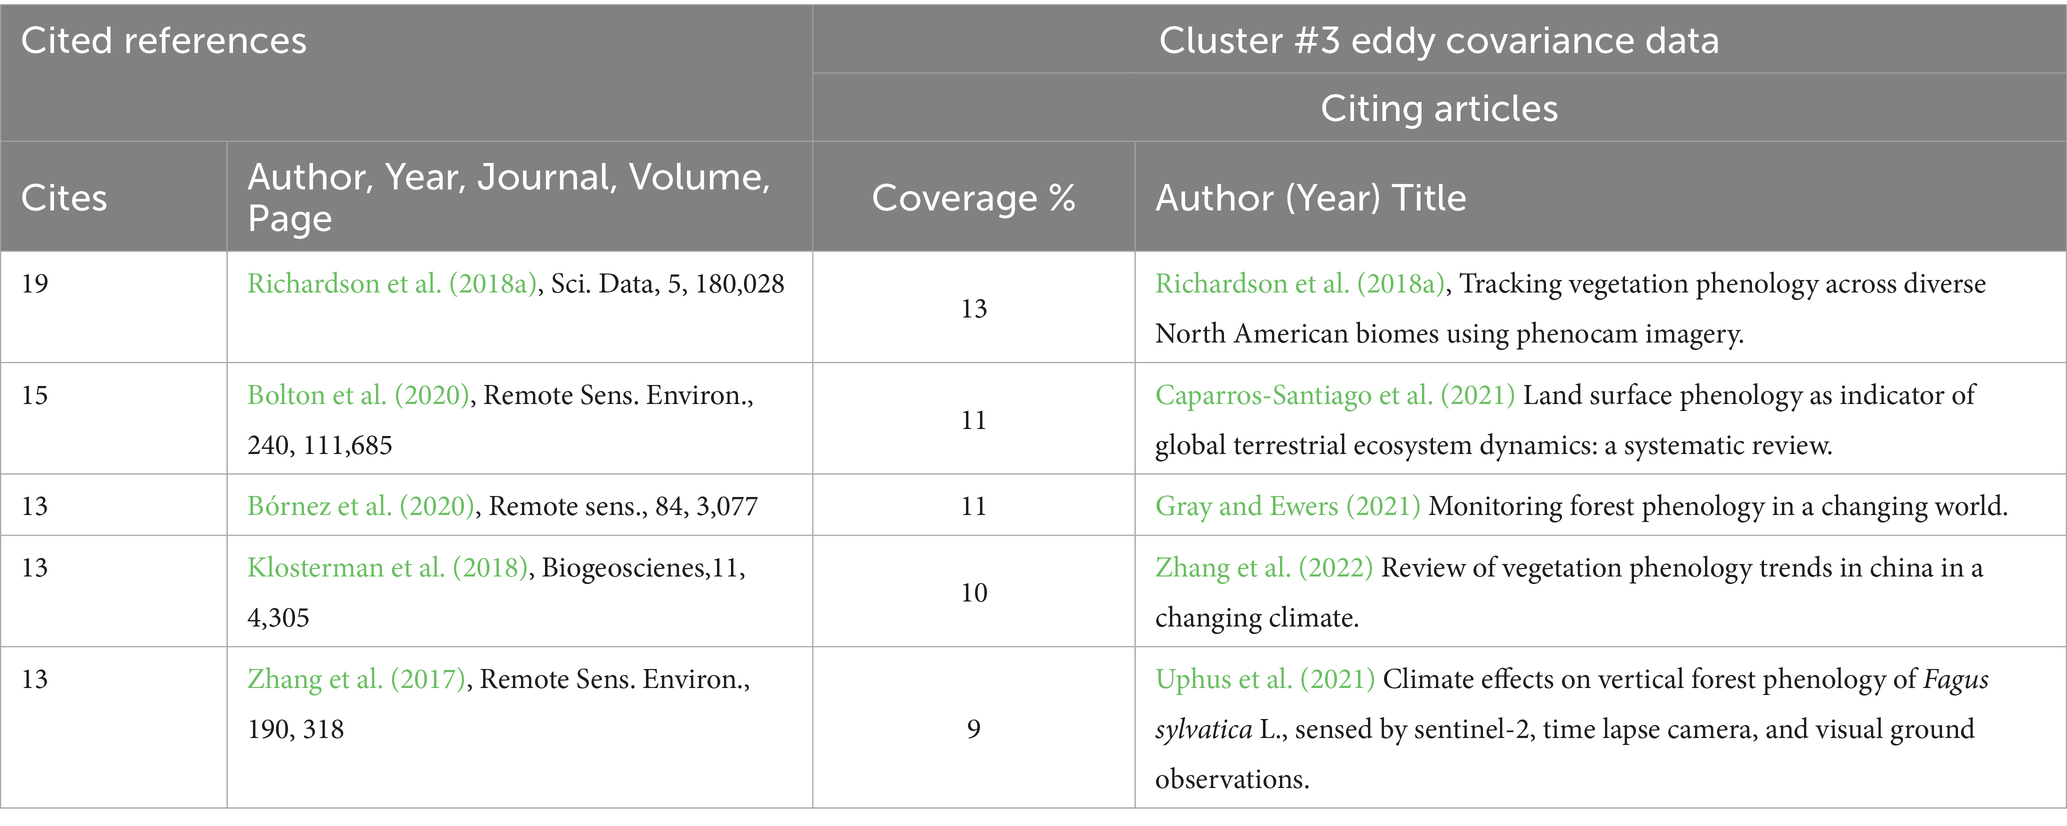
Table 11. Cited references and citing articles of Cluster #3 eddy covariance data.
Cluster #4, “urban spring vegetation phenology,” has emerged as a highly active research cluster in recent years within this field. The most frequently cited studies closely associated with this cluster include works by Meng et al. (2020), Fu et al. (2020), Jia et al. (2021), Li et al. (2017), and Wang M. et al. (2022), which represent the foundational research in this area. The top five citing authors, at the forefront of this research, are Yin et al. (2024), Dang et al. (2023a), Li et al. (2024), and Ji et al. (2023) (Table 12).
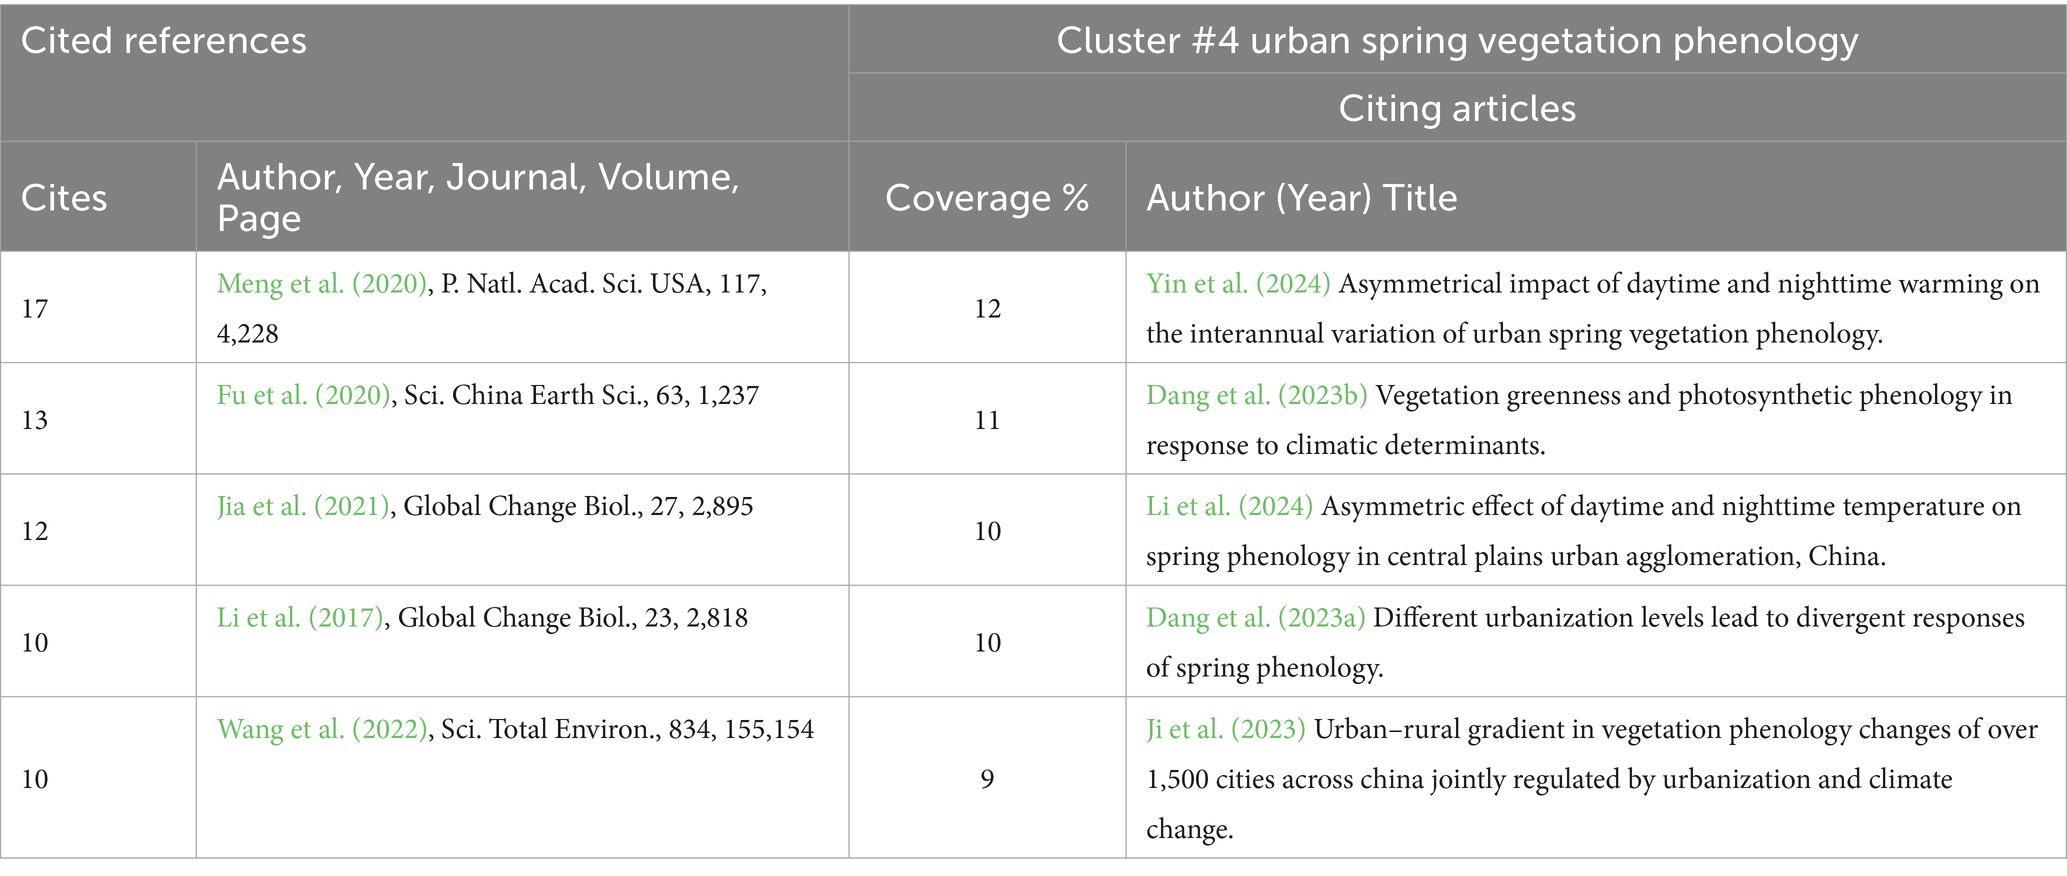
Table 12. Cited references and citing articles of Cluster #4 urban spring vegetation phenology.
3.4.2 Betweenness centrality and highly cited articles
The most cited paper is by Piao, S. L. (2019) published in Global Change Biology, with 112 citations (Figure 15a; Table 13). A threshold of 0.1 for betweenness centrality is commonly used in bibliometric studies to identify publications that act as bridges across different clusters. Values above 0.1 indicate articles with relatively high structural importance in the knowledge network, highlighting their role in connecting research fronts (Chen, 2004; Chen et al., 2010). Nine papers exceed a centrality score of 0.1, including works by Cleland et al. (2007), Badeck et al. (2004), Schwartz and Reiter (2000), Fitzjarrald et al. (2001), Shen et al. (2014), Piao et al. (2019), Polgar and Primack (2011), Fisher et al. (2007), and Keenan et al. (2014a) (Figure 15b; Table 14). These works represent major contributions to research on climate impacts on vegetation phenology.
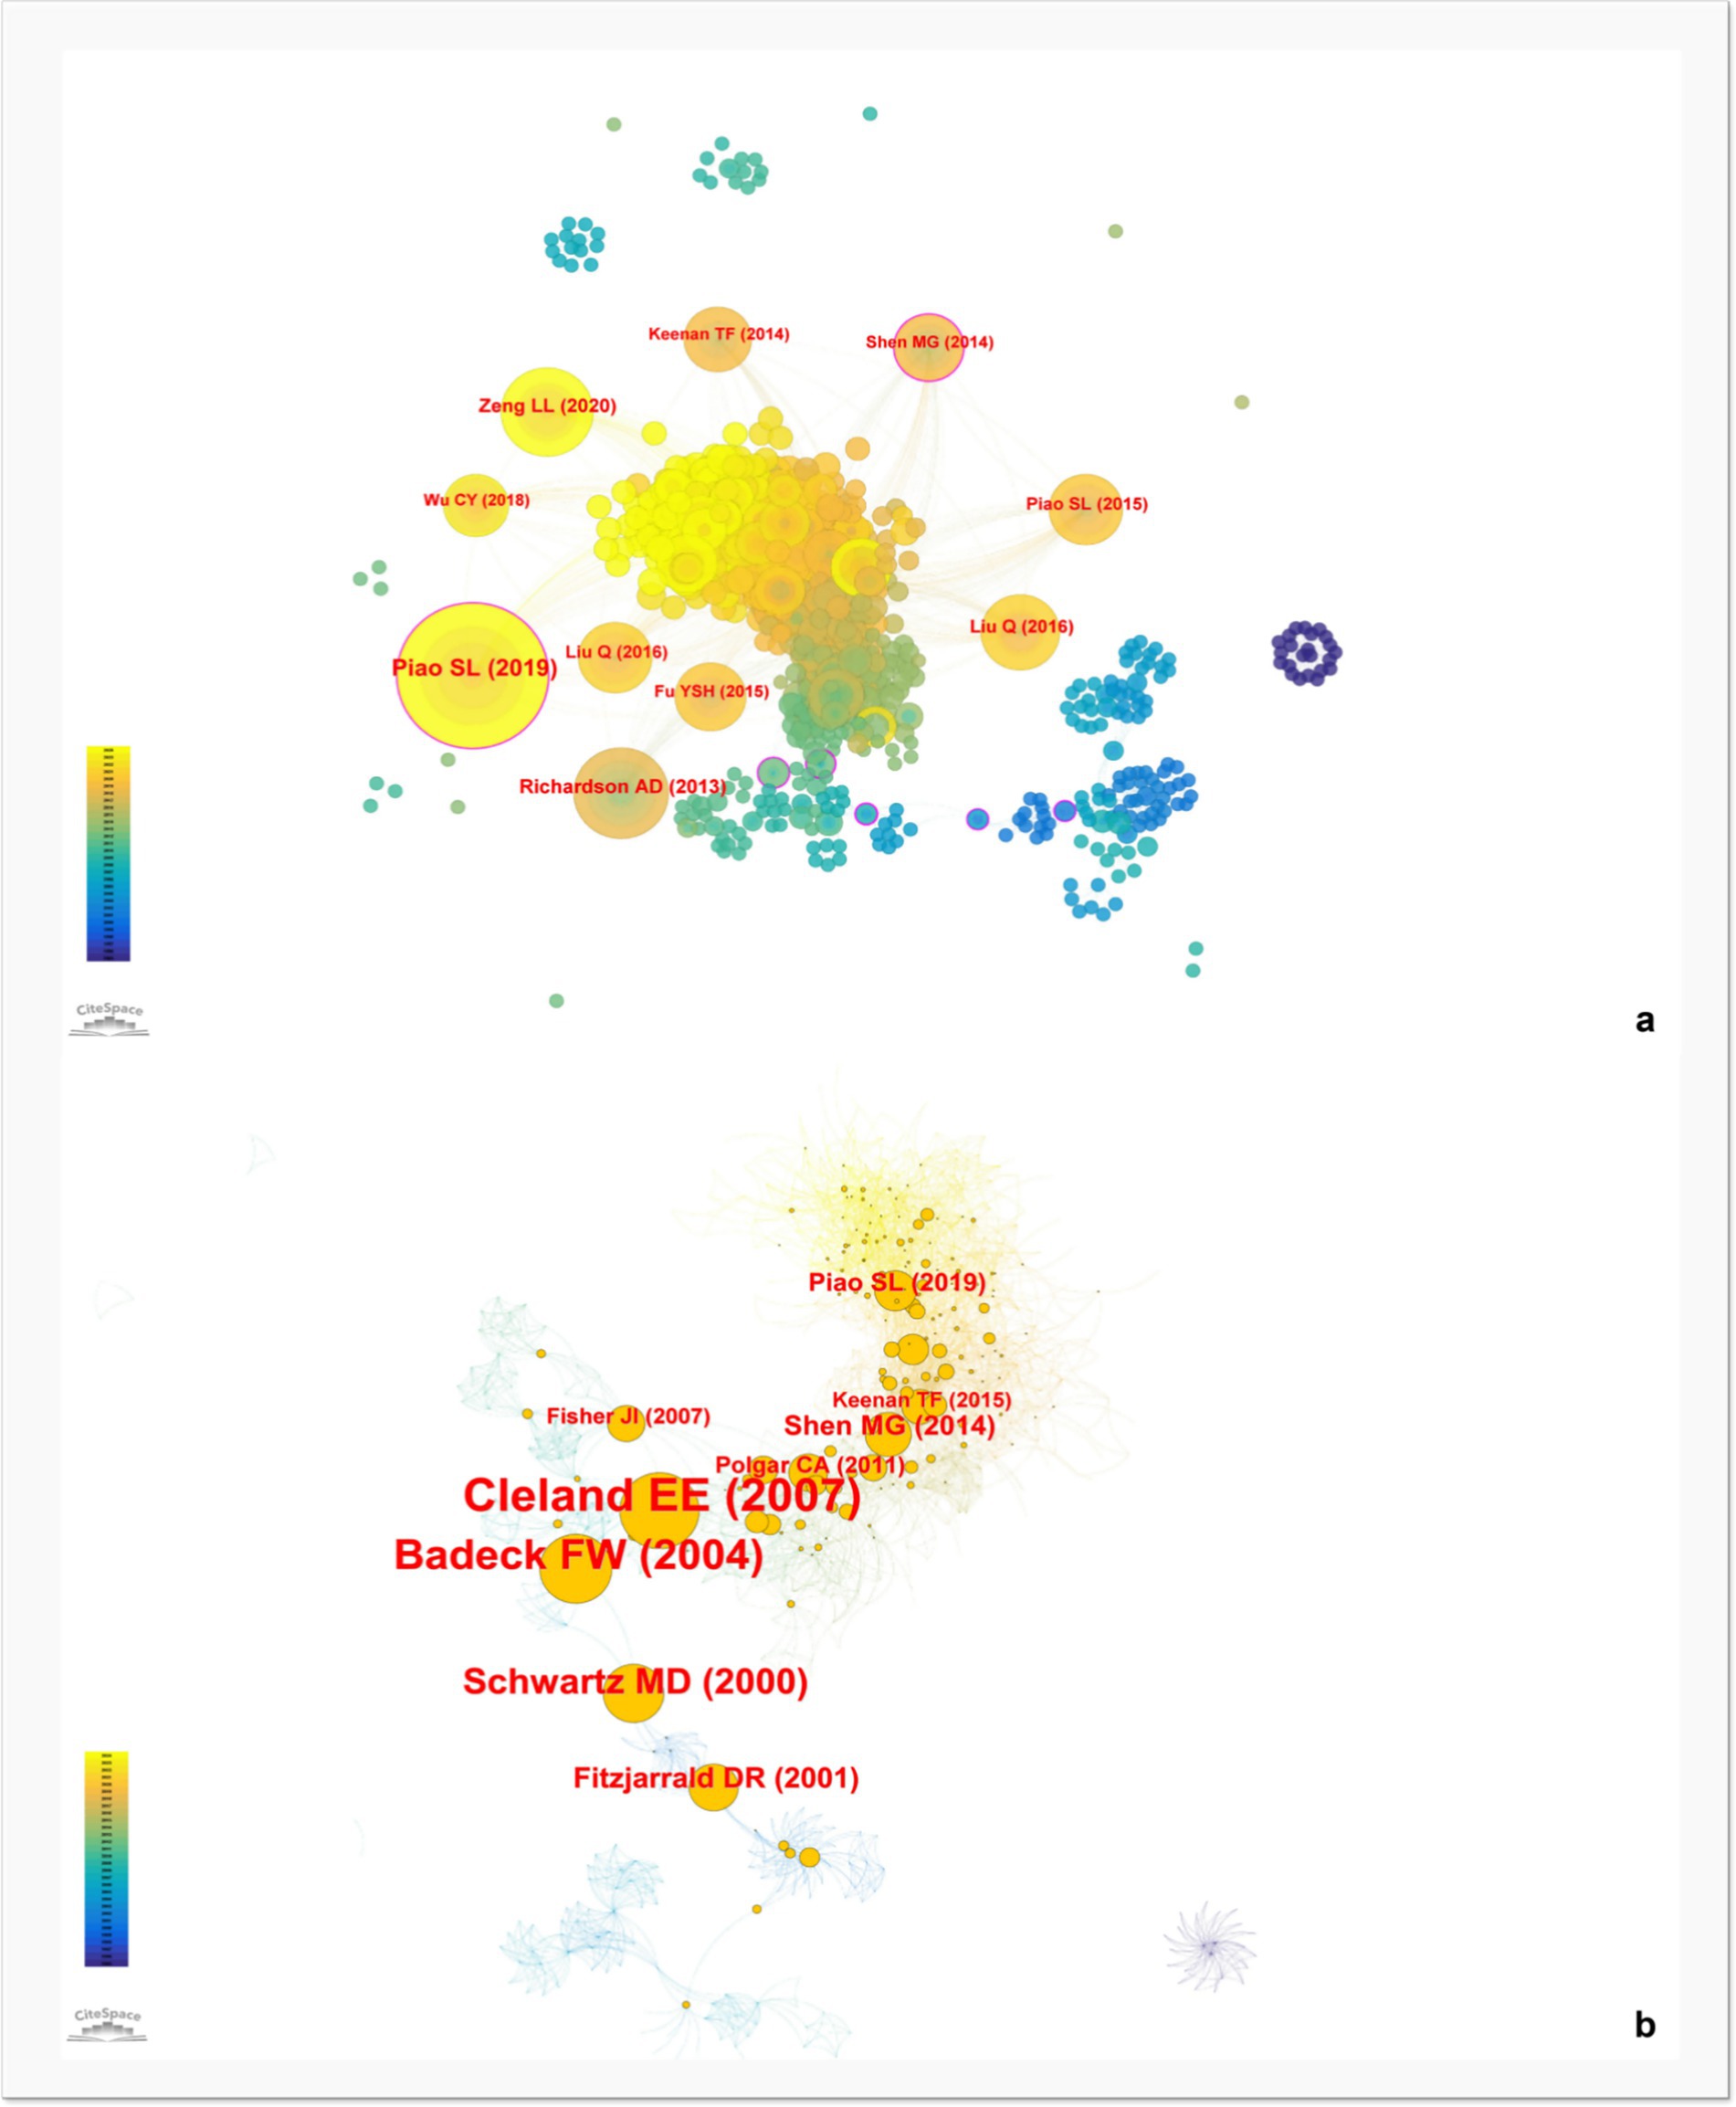
Figure 15. (a) Highly cited articles visualization; (b) centrality visualization.
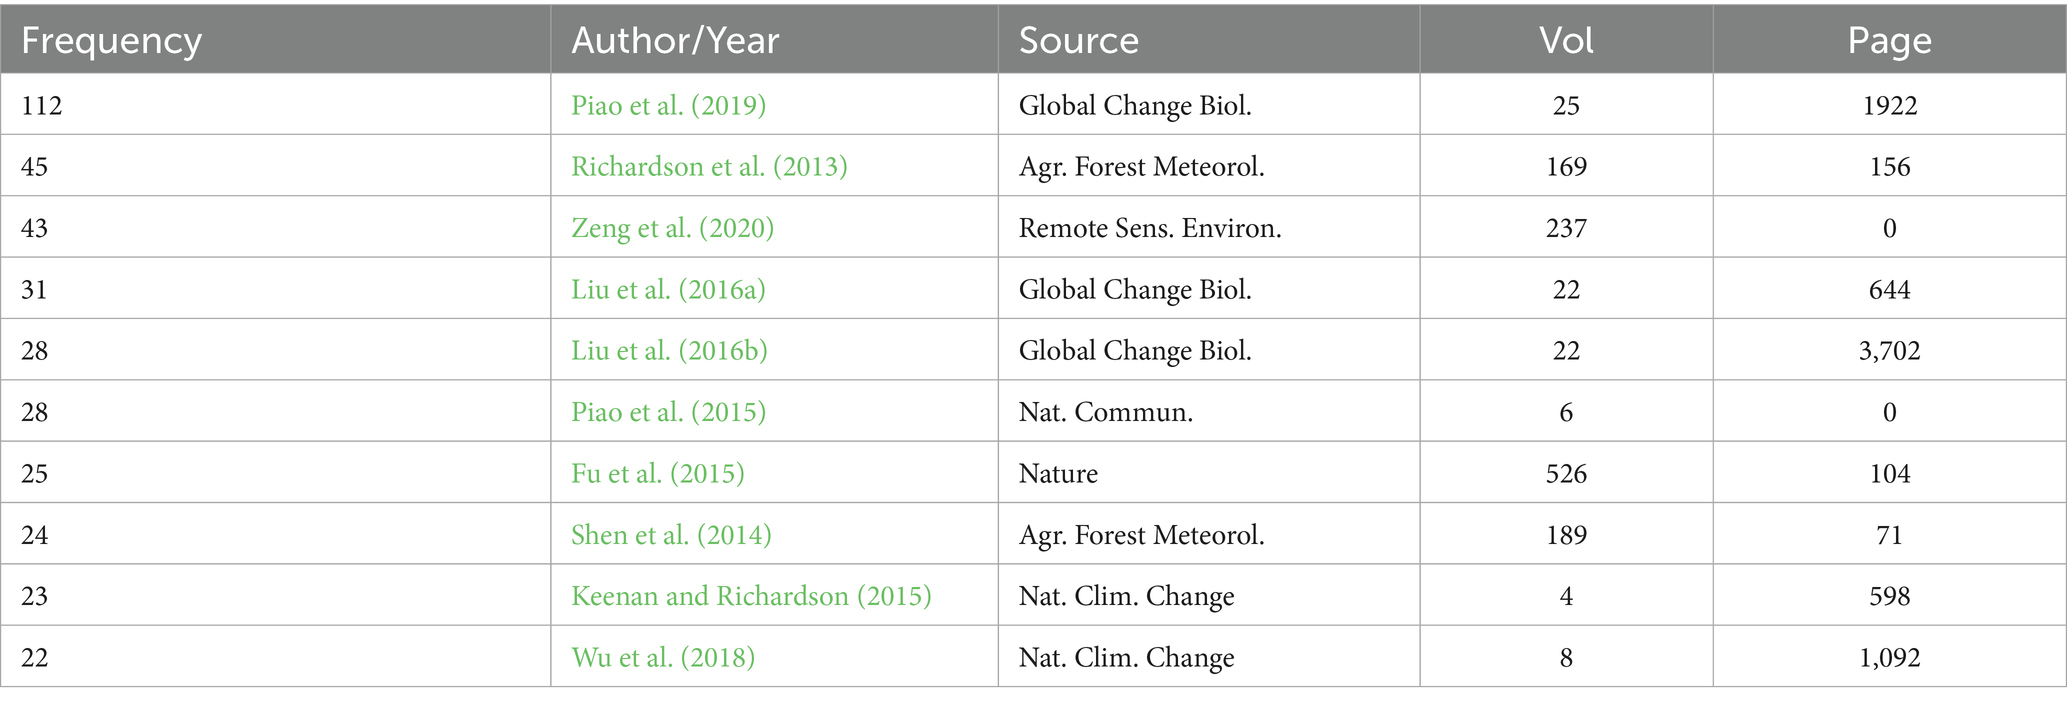
Table 13. The frequencies of 10 cited papers in vegetation phenology research (1995–2024).
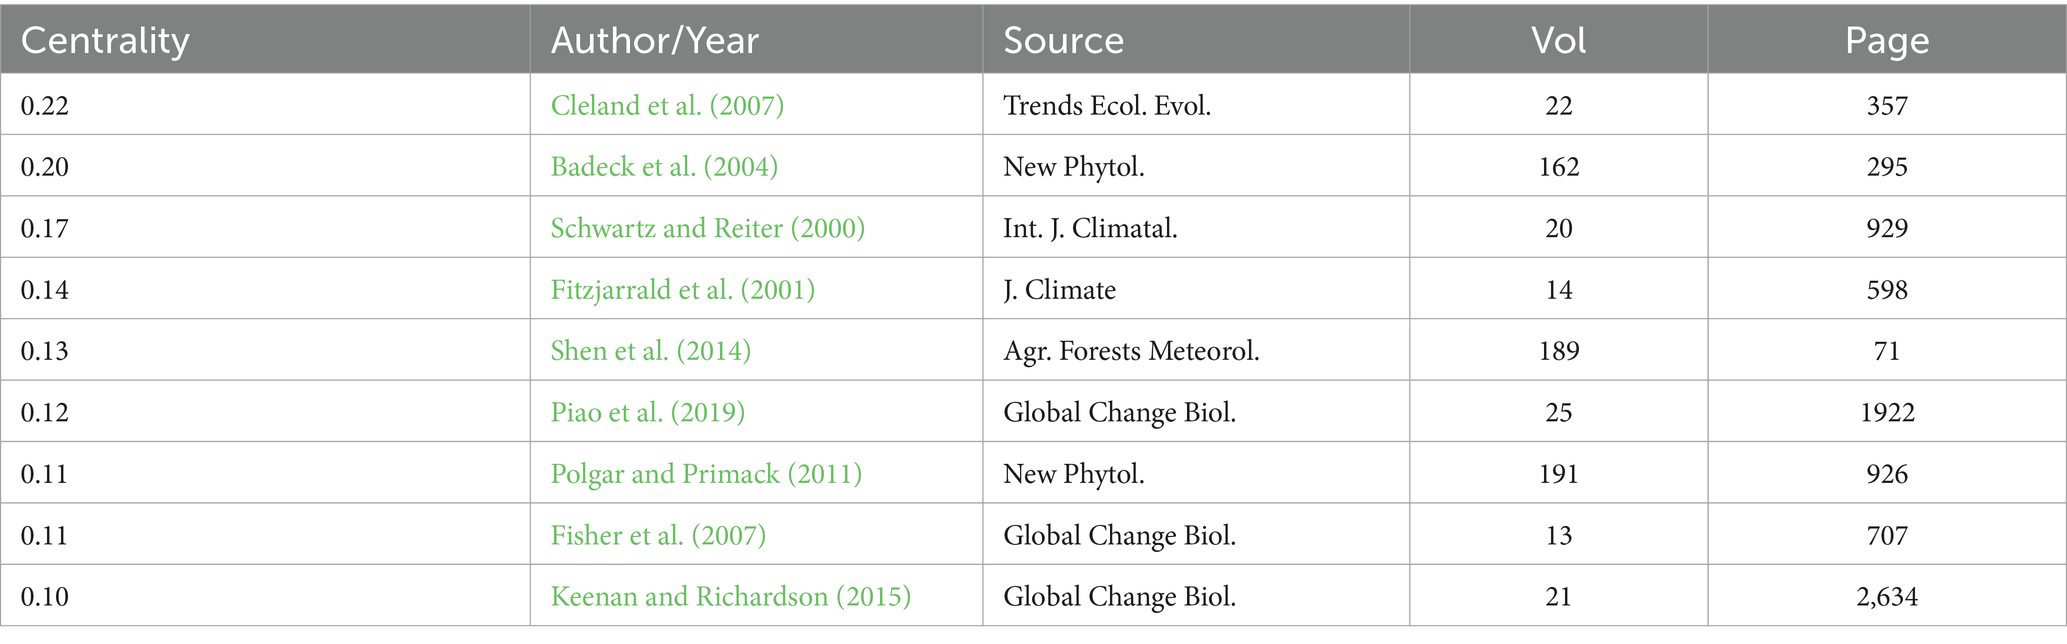
Table 14. Structurally and temporally significant references. (Betweenness Centrality > 0.1).
3.4.3 Citation bursts
Citation bursts indicate a sharp rise in a paper’s co-citations over a period, signaling its emergence as a research hotspot. Table 15 lists the top 10 papers with the highest burst values; 8 occurred between 2014 and 2020, and 2 after 2020. The strongest burst was observed for Richardson et al. (2013).
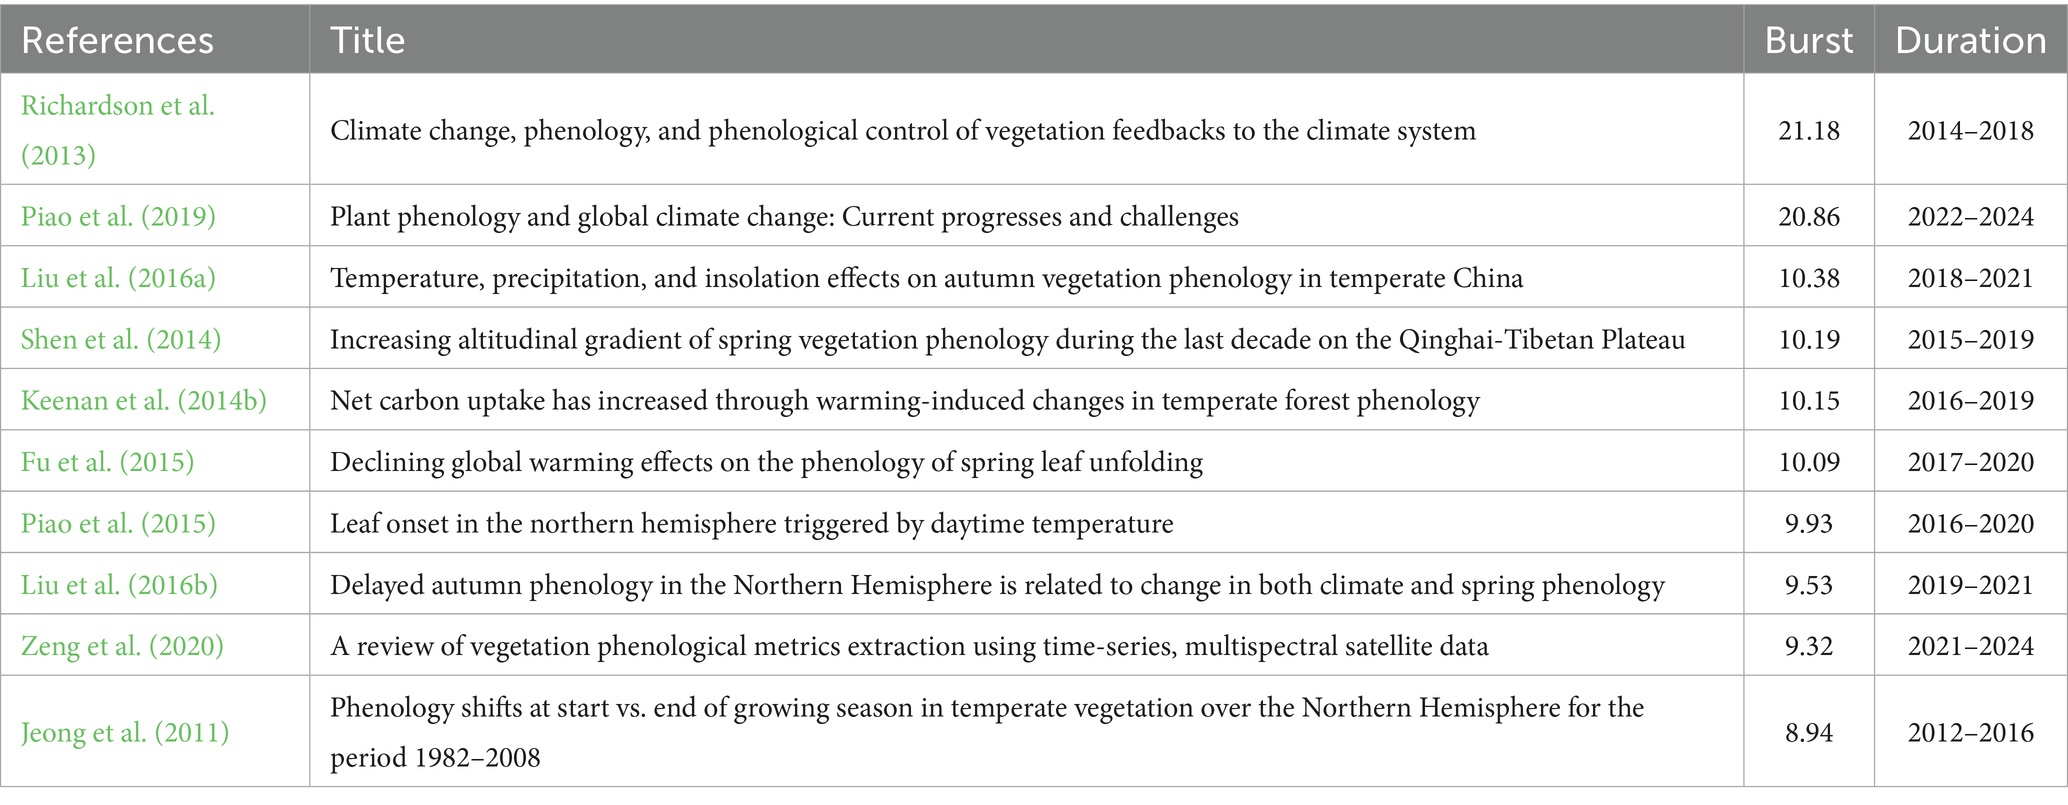
Table 15. Top 10 references with the strongest citation bursts in vegetation phenology research (1995–2024).
4 Discussion
4.1 Global trends and collaboration in vegetation phenology research
Climate change has a significant impact on the efficiency of ecosystems, and vegetation phenology is highly sensitive to these changes. The rapid progression of global climate change has rekindled scientific interest in vegetation phenology. Globally, climate change poses major threats to the environment, economies, and human well-being (McElwee et al., 2023). Against this backdrop, the study of vegetation phenology has increasingly established its scientific value and research significance over the past few decades (De Beurs and Henebry, 2013). The objective of this study is to define the research scope and trace the developmental trajectory of vegetation phenology patterns under the influence of climate change. Using analytical tools such as VOSviewer and Bibliometrix, a bibliometric analysis was conducted on 599 articles retrieved from the Scopus database. It is widely acknowledged that fluctuations in publication volume serve as an important indicator of overall research trends in a given field (Peng et al., 2020). Prior to 2012, studies on vegetation phenological responses to climate change progressed slowly, with low annual publication rates. Since 2013, research activity has gradually increased, and after 2018, the number of publications per year exceeded 17, with an overall annual growth rate of 13.90%, indicating a marked rise in scholarly interest in this field. A total of 599 publications from 1995 to 2024 were included in this study, covering 21 countries, illustrating that the impact of climate change on vegetation phenology has drawn global academic attention. Among the top two contributing countries-China and the United States-more than 500 publications were produced, accounting for over 94% of the total. Six of the top 10 most prolific research institutions are based in China, highlighting Chinese scholars’ strong engagement with this issue. While China ranks first in publication volume, the United States leads in total citations, indicating its dominant influence in the field. In terms of international collaboration, China and the United States play leading roles. Economically advanced countries, with their technological capacity, human resources, and financial support, are better equipped to help other nations respond to climate change (Adenle et al., 2015). This may explain the strong international partnerships formed by these nations, which are able to attract global researchers and provide stable infrastructure and funding for scientific research. Bibliometric evidence further confirms that China and the United States not only have the highest publication output in climate change research globally, but also participate extensively in international collaborations (Klingelhöfer et al., 2020). It is noteworthy that the contribution of developing countries to vegetation phenology research remains limited. This may be explained by constraints such as insufficient research funding, limited access to high-resolution remote sensing data, and weaker international collaboration networks. Previous studies have also highlighted regional disparities in climate change and ecological research capacity, particularly between developed and developing countries (Haunschild et al., 2016; Bornmann et al., 2016). Addressing these disparities will require enhanced data-sharing initiatives, targeted funding programs, and stronger capacity-building efforts to integrate developing countries into the global research landscape.
4.2 Thematic shifts and emerging trends in vegetation phenology research
The keyword co-occurrence analysis reveals the intellectual structure and thematic evolution of vegetation phenology research in the context of climate change. Based on the analysis of 599 articles, a total of 256 keywords (with a minimum co-occurrence frequency of five) were identified, forming three major thematic clusters. First, keywords such as “climate change,” “NDVI,” “remote sensing,” and “China” reflect a strong emphasis on remote sensing applications and regional studies, particularly in East Asia. Second, keywords like “spring phenology,” “temperature,” “growing season,” and “Qinghai-Tibetan Plateau” highlight the growing research interest in high-altitude environments and temperature-driven phenological changes. Lastly, terms such as “MODIS,” “time-series,” “satellite data,” and “model” indicate the increasing sophistication of data-driven approaches and modeling techniques. According to the temporal visualization, the color transition of keywords from blue to yellow between 2017 and 2021 (Figure 9) suggests that topics such as vegetation responses, climate change impacts, and phenological modeling have become emerging research hotspots in recent years. Overall, the clustering patterns and temporal trends jointly demonstrate that this field is not only advancing in technological capacity but also diversifying in its ecological focus.
The thematic evolution analysis provides valuable insights into the dynamic development of vegetation phenology research under the influence of climate change. According to shifts in research themes revealed by thematic analysis, together with noticeable changes in publication trends, the research timeline was divided four distinct periods (1995–2012, 2013–2016, 2017–2020, and 2021–2024), the analysis shows a clear trajectory of thematic diversification and consolidation. Early research (1995–2012) was dominated by foundational topics such as “Plant,” “MODIS,” and “Growth,” highlighting an initial focus on vegetation monitoring through satellite data and basic phenological observations. The retention rate of 73% (Figure 10) from this period suggests a relatively stable but narrowly defined field. In subsequent years, particularly from 2013 onward, there was a marked emergence of new themes such as “NDVI,” “Soil,” and “Climate Change Impacts,” reflecting a shift toward integrative approaches that link vegetation dynamics with biophysical and climatic drivers-a trend echoed in studies like De Beurs and Henebry (2008), who emphasized the growing role of earth observation data in long-term vegetation monitoring. During the 2017–2020 period, themes like “Watersheds,” “Extreme Events,” and “Grassland” gained prominence, signifying an increased interest in ecosystem-level responses to climatic variability and disturbances. The emergence of “extreme events” as a research hotspot reflects growing concerns about the impacts of climate extremes such as heatwaves, droughts, and late frosts on vegetation phenology, which are increasingly recognized as critical drivers of ecosystem vulnerability and resilience (Anderegg et al., 2020). The thematic evolution map further illustrates how earlier core themes such as “Plant” and “Energy Flux” transitioned into more specific ecological and climatic concerns like “Vegetation Green-Up,” “Boreal Regions,” and “Patterns,” suggesting growing specialization and regional differentiation. This aligns with recent findings by Piao et al. (2019), who highlighted the sensitivity of high-latitude and high-altitude ecosystems to warming. The strategic diagram for 2021–2024 shows “Savanna,” “Grassland,” and “Climate Change” as central and mature research areas, while the emergence of “Global Warming” as a developing topic suggests renewed attention to large-scale climatic processes. The co-occurrence of “Extreme Events” and “Environmental Factors” also reflects a paradigm shift from steady-state phenological responses to more event-based and threshold-driven dynamics, a concept supported by Jentsch et al. (2007) in their work on ecological responses to climatic extremes. Overall, the thematic evolution analysis demonstrates that the field of vegetation phenology is moving beyond descriptive studies to encompass mechanistic, modeling-based, and ecosystem-specific research. The increasing number of newly introduced themes across each period, coupled with high retention rates (over 80% after 2013), indicates both intellectual continuity and thematic innovation. These findings not only map the conceptual landscape of the field but also highlight potential directions for future research, including integrative modeling, regional vulnerability assessments, and the role of extreme climatic events in shaping phenological processes.
4.3 Research foundations and hotspots in vegetation phenology research
Co-citation and cluster analysis provide a comprehensive picture of the intellectual structure and emerging trends in vegetation phenology research under the background of climate change. The clustering results show high modularity (Q = 0.7254) and silhouette coefficient (S = 0.8845), indicating a clearly structured field with distinct thematic divisions (Table 7). Thirteen co-citation clusters were identified, among which “vegetation phenology” (Cluster 0), “temperate forest phenology” (Cluster 1), and “winter wheat” (Cluster 2) emerged as the most robust and frequently cited. These clusters encompass foundational studies such as Piao et al. (2019) and Richardson et al. (2013), which play a key role in revealing the relationships between phenological changes and climate factors across different ecological zones. For instance, Piao et al. (2019) emphasize the regional heterogeneity of phenological responses and the challenges in modeling these changes at large scales-a theme also reflected in studies like Shen M. et al. (2022) and Zhang X. et al. (2017), which focus on the Qinghai-Tibetan Plateau and broader patterns in China. Cluster 1 spans the longest period (2005–2023), reflecting continued academic interest in the carbon sink function of forest ecosystems. Key studies such as Richardson et al. (2013) and Jeong et al. (2011) support in-depth modeling of phenology in temperate forests, especially regarding temperature sensitivity and phenocam image validation (Forkel et al., 2016; Keenan et al., 2014a). Recent clusters reflect shifting research frontiers, particularly in the fields of “urban spring vegetation phenology” (Cluster 5) and “eddy covariance data” (Cluster 3). Cluster 5 appeared after 2019 and shows strong citation activity, indicating increasing concern with the effects of human activity on phenological cycles in urban environments, especially the significant disturbances in vegetation timing caused by asymmetric warming patterns in cities (Liang et al., 2024). This aligns with broader discussions on urban–rural phenological divergence (Ji et al., 2023; Ren et al., 2018). Cluster 3 highlights the application of eddy covariance techniques in vegetation phenology research, demonstrating the capability of this method to observe real-time, ecosystem-scale carbon cycle dynamics (Hadley et al., 2009). These tools serve as a bridge between satellite observations and plant and vegetation physiological processes, driving a methodological shift in phenological research paradigms (Tian et al., 2021).
Analyses of betweenness centrality and citation bursts reveal key publications that act as intellectual bridges and accelerators of knowledge. Central works such as Cleland et al. (2007) and Badeck et al. (2004) reflect foundational efforts to conceptualize phenological responses at multiple scales. Meanwhile, Richardson et al. (2013) stands out with the strongest citation burst, underscoring its role in framing vegetation-climate feedback theory. Notably, the ongoing burst of Piao et al. (2019) since 2022 suggests its continuing influence in shaping current research directions. The observed thematic maturity and diversification across clusters further underscore the transition from early studies focused on specific ecosystems (e.g., deciduous and tropical forests) to more integrative and application-oriented research, including modeling, remote sensing data analysis, and human-environment interaction studies. In summary, co-citation and cluster analysis not only uncover the historical foundations of vegetation phenology research but also presents an expanding and increasingly dynamic scholarly landscape. The field is increasingly integrating complex modeling techniques, multi-source data, and socio-ecological contexts. The sustained attention to core topics, along with the emergence of new research frontiers such as urban ecology and eddy covariance, indicates a transition from observational research to predictive, system-level studies-offering crucial scientific support for climate resilience planning.
5 Conclusion
This bibliometric study provides a comprehensive overview of the evolution and current state of research on the vegetation phenology responses to climate change from 1995 to 2024. Our findings show a significant increase in research output, particularly after 2012, with China emerging as the leading contributor. The field has gradually shifted from broad conceptual explorations to highly specialized themes such as remote sensing applications, phenological asymmetries, and urban–rural differences. “climate change,” “spring phenology,” and “NDVI” have been central keywords, indicating a persistent focus on temperature-driven phenological changes and the application of satellite data. The results highlight the field’s increasing complexity, the emergence of interdisciplinary approaches, and the need for enhanced international collaboration. This study not only maps the intellectual landscape of vegetation phenology responses to climate change research but also provides valuable guidance for scholars and policymakers aiming to support adaptive vegetation and ecosystem management in a warming world.
6 Future opportunities and limitations
Future research on forest vegetation phenology under climate change presents several promising directions. Integrating multidisciplinary approaches-including remote sensing, ground-based observations, and ecological modeling-offers opportunities to better understand complex, nonlinear relationships between phenological shifts and ecosystem carbon dynamics. Urbanization effects, especially the influence of human-induced changes such as urban heat islands, deserve increased attention as urban areas become critical zones for studying anthropogenic impacts on vegetation phenology. The rise of “urbanization” is linked to the expanding urban heat island effect, altered land cover, and the societal need to understand phenological changes in urban green spaces that directly affect biodiversity, ecosystem services, and human well-being (Buyantuyev and Wu, 2010; Qiu et al., 2017). Additionally, there is a pressing need to explore phenological responses in ecologically vulnerable and understudied regions like tropical forests, arid zones, and high-altitude plateaus, which may hold key insights into global vegetation dynamics. Forecasting phenological trends under future climate scenarios, including the role of extreme events, will be vital for informing adaptive ecosystem management strategies. However, this study also faces several limitations. It is based solely on English-language publications from Web of Science and Scopus, which may exclude significant non-English or regional research, and Google Scholar, which covers a wider range of topics. Citation lag introduces temporal bias, as newer studies may not yet reflect their full scholarly impact. Moreover, current bibliometric tools, while powerful, have limitations in processing interdisciplinary or heterogeneous data, and thematic clustering may involve subjective interpretation. Lastly, the study’s scope is focused on forest vegetation, limiting generalizability to other important vegetation types such as crops, grasslands, and agricultural ecosystems.
Data availability statement
The original contributions presented in the study are included in the article/Supplementary material, further inquiries can be directed to the corresponding authors.
Author contributions
RZ: Conceptualization, Funding acquisition, Methodology, Project administration, Resources, Software, Supervision, Validation, Visualization, Writing – original draft, Writing – review & editing. GW: Conceptualization, Investigation, Methodology, Software, Validation, Visualization, Writing – original draft. HL: Methodology, Software, Visualization, Writing – original draft. SZ: Methodology, Software, Visualization, Writing – original draft. YL: Data curation, Software, Visualization, Writing – original draft. XW: Methodology, Resources, Software, Validation, Visualization, Writing – original draft.
Funding
The author(s) declare that financial support was received for the research and/or publication of this article. This study was supported by the National Natural Science Foundation of China (32301352), the Open Funding From CAS Key Laboratory of Tropical Forest Ecology, the Yunnan Fundamental Research Projects (202101AU070142), the College Students’ Innovation and Entrepreneurship Training Program Project of Yuxi Normal University (2024A014, S202411390035, 202511390003, and 202511390014), the Basic Education Teaching Reform Research Project of Yuxi Normal University (2023jc01), and the Teaching Quality and Teaching Reform Project of Yuxi Normal University (2022kc13.
Acknowledgments
The authors thank all the participants of the College Students’ Innovation and Entrepreneurship Training Program Project for data collection and the CiteSpace development team for providing the application.
Conflict of interest
The authors declare that the research was conducted in the absence of any commercial or financial relationships that could be construed as a potential conflict of interest.
Generative AI statement
The authors declare that no Gen AI was used in the creation of this manuscript.
Any alternative text (alt text) provided alongside figures in this article has been generated by Frontiers with the support of artificial intelligence and reasonable efforts have been made to ensure accuracy, including review by the authors wherever possible. If you identify any issues, please contact us.
Publisher’s note
All claims expressed in this article are solely those of the authors and do not necessarily represent those of their affiliated organizations, or those of the publisher, the editors and the reviewers. Any product that may be evaluated in this article, or claim that may be made by its manufacturer, is not guaranteed or endorsed by the publisher.
Supplementary material
The Supplementary material for this article can be found online at: https://www.frontiersin.org/articles/10.3389/ffgc.2025.1688384/full#supplementary-material
References
Adenle, A. A., Azadi, H., and Arbiol, J. (2015). Global assessment of technological innovation for climate change adaptation and mitigation in developing world. J. Environ. Manag. 161, 261–275. doi: 10.1016/j.jenvman.2015.05.040
Anderegg, W. R. L., Trugman, A. T., Badgley, G., Anderson, C. M., Bartuska, A., Ciais, P., et al. (2020). Climate-driven risks to the climate mitigation potential of forests. Science 368:eaaz7005. doi: 10.1126/science.aaz7005
Araújo, A. G., Pereira Carneiro, A. M., and Palha, R. P. (2020). Sustainable construction management: a systematic review of the literature with meta-analysis. J. Clean. Prod. 256:120350. doi: 10.1016/j.jclepro.2020.120350
Aria, M., and Cuccurullo, C. (2017). Bibliometrix: an R-tool for comprehensive science mapping analysis. J. Informetr. 11, 959–975. doi: 10.1016/j.joi.2017.08.007
Badeck, F. W., Bondeau, A., Böttcher, K., Doktor, D., Lucht, W., Schaber, J., et al. (2004). Responses of spring phenology to climate change. New Phytol. 162, 295–309. doi: 10.1111/j.1469-8137.2004.01059.x
Barichivich, J., Briffa, K. R., Myneni, R. B., Osborn, T. J., Melvin, T. M., Ciais, P., et al. (2013). Large-scale variations in the vegetation growing season and annual cycle of atmospheric CO₂ at high northern latitudes from 1950 to 2011. Glob. Change Biol. 19, 3167–3183. doi: 10.1111/gcb.12283
Bolton, D. K., Gray, J. M., Melaas, E. K., Moon, M., Eklundh, L., and Friedl, M. A. (2020). Continental-scale land surface phenology from harmonized Landsat 8 and Sentinel-2 imagery. Remote Sens. Environ. 240:111685. doi: 10.1016/j.rse.2020.111685
Bórnez, K., Richardson, A. D., Verger, A., Descals, A., and Peñuelas, J. (2020). Evaluation of VEGETATION and PROBA-V phenology using PhenoCam and Eddy covariance data. Remote Sens 12:3077. doi: 10.3390/rs12183077
Bornmann, L., Haunschild, R., and Marx, W. (2016). Policy documents as sources for measuring societal impact: how often is climate change research mentioned in policy-related documents? Scientometrics 109, 1477–1495. doi: 10.1007/s11192-016-2115-y
Brookes, B. C. (1985). "sources of information on specific subjects" by S.C. Bradford. J. Inf. Sci. 10, 173–175. doi: 10.1177/016555158501000
Burnham, J. F. (2006). Scopus database: a review. Biomed. Digit. Libr. 3, 1–8. doi: 10.1186/1742-5581-3-1
Buyantuyev, A., and Wu, J. (2010). Urban heat islands and landscape heterogeneity: linking spatiotemporal variations in surface temperatures to land-cover and socioeconomic patterns. Landsc. Ecol. 25, 17–33. doi: 10.1007/s10980-009-9402-4
Caparros-Santiago, J. A., Rodriguez-Galiano, V., and Dash, J. (2021). Land surface phenology as indicator of global terrestrial ecosystem dynamics: a systematic review. ISPRS J. Photogramm. Remote Sens. 171, 330–347. doi: 10.1016/j.isprsjprs.2020.11.019
Chen, C. (2004). Searching for intellectual turning points: progressive knowledge domain visualization. Proc. Natl. Acad. Sci. U. S. A. 101, 5303–5310. doi: 10.1073/pnas.0307513100
Chen, C., Ibekwe-SanJuan, F., and Hou, J. (2010). The structure and dynamics of cocitation clusters: a multiple-perspective cocitation analysis. J. Am. Soc. Inf. Sci. Technol. 61, 1386–1409. doi: 10.1002/asi.21309
Chen, J., Liu, Y., Zhu, K., and Wang, C. (2024). The development and evolution of the research topic on the mental health of college students: a bibliometric review based on CiteSpace and VOSviewer. Heliyon 10:e29477. doi: 10.1016/j.heliyon.2024.e29477
Chen, H., Zhao, L. P., Chen, B., Wang, Y. M., Niu, W. L., and Sun, H. Y. (2023). Hotspots and trends of phenology studies in Qinghai-Tibet plateau: visual analysis based on Citespace. J. Hebei Norm. Univ. (Nat. Sci.) 47, 1–10. doi: 10.13763/j.cnki.jhebnu.nse.202305001
Cheng, M., Jin, J., and Jiang, H. (2021). Strong impacts of autumn phenology on grassland ecosystem water use efficiency on the Tibetan plateau. Ecol. Indic. 126:107682. doi: 10.1016/j.ecolind.2021.107682
Cleland, E. E., Chuine, I., Menzel, A., Mooney, H. A., and Schwartz, M. D. (2007). Shifting plant phenology in response to global change. Trends Ecol. Evol. 22, 357–365. doi: 10.1016/j.tree.2007.04.003
Cobo, M. J., López-Herrera, A. G., Herrera-Viedma, E., and Herrera, F. (2012). SciMAT: a new science mapping analysis software tool. J. Am. Soc. Inf. Sci. Technol. 63, 1609–1630. doi: 10.1002/asi.22688
Cong, N., Shen, M., and Piao, S. (2016). Spatial variations in responses of vegetation autumn phenology to climate change on the Tibetan plateau. J. Plant Ecol. 10, 744–752. doi: 10.1093/jpe/rtw084
Dang, C., Shao, Z., Huang, X., Cheng, G., and Qian, J. (2023a). Different urbanization levels Lead to divergent responses of spring phenology. Photogramm Eng. Rem. S. 89, 639–651. doi: 10.14358/PERS.23-00008R2
Dang, C., Shao, Z., Huang, X., Zhuang, Q., Cheng, G., and Qian, J. (2023b). Vegetation greenness and photosynthetic phenology in response to climatic determinants. Front. For. Glob. Change 6:1172220. doi: 10.3389/ffgc.2023.1172220
de Beurs, K. M., and Henebry, G. M. (2008). Northern annular mode effects on the land surface phenologies of northern Eurasia. J. Clim. 21, 4257–4279. doi: 10.1175/2008JCLI2074.1
De Beurs, K. M., and Henebry, G. M. (2013). “Vegetation phenology in global change studies” in Phenology: An integrative environmental science. ed. M. D. Schwartz (Dordrecht: Springer), 483–502.
De Las Heras, A., Relinque-Medina, F., Zamora-Polo, F., and Luque-Sendra, A. (2021). Analysis of the evolution of the sharing economy towards sustainability. Trends and transformations of the concept. J. Clean. Prod. 291:125227. doi: 10.1016/j.jclepro.2020.125227
Dragoni, D., Schmid, H. P., Wayson, C. A., Potter, H., Grimmond, C. S. B., and Randolph, J. C. (2011). Evidence of increased net ecosystem productivity associated with a longer vegetated season in a deciduous forest in south-Central Indiana, USA. Glob. Change Biol. 17, 886–897. doi: 10.1111/j.1365-2486.2010.02281.x
Ellegaard, O., and Wallin, J. A. (2015). The bibliometric analysis of scholarly production: how great is the impact? Scientometrics 105, 1809–1831. doi: 10.1007/s11192-015-1645-z
Everingham, S. E., Blick, R. A. J., Sabot, M. E. B., Slavich, E., and Moles, A. T. (2022). Southern hemisphere plants show more delays than advances in flowering phenology. J. Ecol. 111, 380–390. doi: 10.1111/1365-2745.13828
Fisher, J. I., Richardson, A. D., and Mustard, J. F. (2007). Phenology model from surface meteorology does not capture satellite-based Greenup estimations. Glob. Change Biol. 13, 707–721. doi: 10.1111/j.1365-2486.2006.01311.x
Fitzjarrald, D. R., Acevedo, O. C., and Moore, K. E. (2001). Climatic consequences of leaf presence in the eastern United States. J. Clim. 14, 598–614. doi: 10.1175/1520-0442(2001)014<0598:CCOLPI>2.0.CO;2
Foley, J. A., Levis, S., Costa, M. H., Cramer, W., and Pollard, D. (2000). Incorporating dynamic vegetation cover within global climate models. Ecol. Appl. 10, 1620–1632. doi: 10.1890/1051-0761(2000)010[1620:IDVCWG]2.0.CO;2
Forkel, M., Carvalhais, N., Rödenbeck, C., Keeling, R., Heimann, M., Thonicke, K., et al. (2016). Enhanced seasonal CO2 exchange caused by amplified plant productivity in northern ecosystems. Science 351, 696–699. doi: 10.1126/science.aac497
Forkel, M., Carvalhais, N., Schaphoff, S., Bloh, W., Migliavacca, M., Thurner, M., et al. (2014). Identifying environmental controls on vegetation greenness phenology through model–data integration. Biogeosciences 11, 7025–7050. doi: 10.5194/bg-11-7025-2014
Fu, Y., Li, X., Zhou, X., Geng, X., Guo, Y., and Zhang, Y. (2020). Progress in plant phenology modeling under global climate change. Sci. China Earth Sci. 63, 1237–1247. doi: 10.1007/s11430-019-9622-2
Fu, Y. H., Zhao, H., Piao, S., Peaucelle, M., Peng, S., Zhou, G., et al. (2015). Declining global warming effects on the phenology of spring leaf unfolding. Nature 526, 104–107. doi: 10.1038/nature15402
Gibbin, R. V., Sigahi, T. F. A. C., Pinto, J. D. S., Rampasso, I. S., and Anholon, R. (2023). Thematic evolution and trends linking sustainability and project management: scientific mapping using SciMAT. J. Clean. Prod. 414:137753. doi: 10.1016/j.jclepro.2023.137753
Gray, R. E. J., and Ewers, R. M. (2021). Monitoring forest phenology in a changing world. Forests 12:297. doi: 10.3390/f12030297
Hadley, J. L., O’Keefe, J., Munger, J. W., Hollinger, D. Y., and Richardson, A. D. (2009). “Phenology of forest-atmosphere carbon exchange for deciduous and coniferous forests in southern and northern New England” in Phenology of ecosystem processes. ed. A. Noormets (New York: Springer), 119–141.
Hassan-Montero, Y., De-Moya-Anegón, F., and Guerrero-Bote, V. (2022). Scimago graphica: a new tool for exploring and visually communicating data. Prof. Inform. 31:e310502. doi: 10.3145/epi.2022.sep.02
Haunschild, R., Bornmann, L., and Marx, W. (2016). Climate change research in view of bibliometrics. PLoS One 11:e0160393. doi: 10.1371/journal.pone.0160393
Idris, O. A., Opute, P., Orimoloye, I. R., and Maboeta, M. S. (2022). Climate change in Africa and vegetation response: a bibliometric and spatially based information assessment. Sustainability 14:4974. doi: 10.3390/su14094974
Jentsch, A., Kreyling, J., and Beierkuhnlein, C. (2007). A new generation of climate-change experiments: events, not trends. Front. Ecol. Environ. 5, 365–374. doi: 10.1890/1540-9295(2007)5[365:ANGOCE]2.0.CO;2
Jeong, S. J., Ho, C. H., Gim, H. J., and Brown, M. E. (2011). Phenology shifts at start vs. end of growing season in temperate vegetation over the northern hemisphere for the period 1982-2008. Glob. Change Biol. 17, 2385–2399. doi: 10.1111/j.1365-2486.2011.02397.x
Ji, Y., Zhan, W., Du, H., Wang, S., Li, L., Xiao, J., et al. (2023). Urban-rural gradient in vegetation phenology changes of over 1500 cities across China jointly regulated by urbanization and climate change. ISPRS J. Photogramm. Remote Sens. 205, 367–384. doi: 10.1016/j.isprsjprs.2023.10.015
Jia, W., Zhao, S., Zhang, X., Liu, S., Henebry, G. M., and Liu, L. (2021). Urbanization imprint on land surface phenology: the urban–rural gradient analysis for Chinese cities. Glob. Change Biol. 27, 2895–2904. doi: 10.1111/gcb.15602
Jimenez-Montenegro, L., Lopez-Fernandez, M., and Gimenez, E. (2021). Worldwide research on the ozone influence in plants. Agronomy 11:1504. doi: 10.3390/agronomy11081504
Jing, Y., Wang, C., Chen, Z., Shen, S., and Shadiev, R. (2024). A bibliometric analysis of studies on technology-supported learning environments: hot topics and frontier evolution. J. Comput. Assist. Learn. 40, 1185–1200. doi: 10.1111/jcal.12934
Keenan, T. F., Darby, B., Felts, E., Sonnentag, O., Friedl, M. A., Hufkens, K., et al. (2014a). Tracking forest phenology and seasonal physiology using digital repeat photography: a critical assessment. Ecol. Appl. 24:1478. doi: 10.1890/13-0652.1
Keenan, T. F., Gray, J., Friedl, M. A., Toomey, M., Bohrer, G., Hollinger, D. Y., et al. (2014b). Net carbon uptake has increased through warming-induced changes in temperate forest phenology. Nat. Clim. Chang. 4, 598–604. doi: 10.1038/nclimate2253
Keenan, T. F., and Richardson, A. D. (2015). The timing of autumn senescence is affected by the timing of spring phenology: implications for predictive models. Glob. Change Biol. 21, 2634–2641. doi: 10.1111/gcb.12890
Klingelhöfer, D., Müller, R., Braun, M., Brüggmann, D., and Groneberg, D. A. (2020). Climate change: does international research fulfill global demands and necessities? Environ. Sci. Eur. 32:137. doi: 10.1186/s12302-020-00419-1
Klosterman, S., Melaas, E., Wang, J. A., Martinez, A., Frederick, S., O’Keefe, J., et al. (2018). Fine-scale perspectives on landscape phenology from unmanned aerial vehicle (UAV) photography. Agric. For. Meteorol. 248, 397–407. doi: 10.1016/j.agrformet.2017.10.015
Kumar, R. (2025). Bibliometric analysis: comprehensive insights into tools, techniques, applications, and solutions for research excellence. Spectr. Eng. Manag. Sci. 3, 45–62. doi: 10.31181/sems31202535k
Latorre Medina, M. J. (2025). What is the interest in research on challenging schools? A literature review with scientific mapping. Policy Futur. Educ. 23, 316–336. doi: 10.1177/147821032412788
Li, J., Goerlandt, F., and Reniers, G. (2020). Mapping process safety: a retrospective scientometric analysis of three process safety related journals (1999-2018). J. Loss Prev. Process Ind. 65:104141. doi: 10.1016/j.jlp.2020.104141
Li, J., Goerlandt, F., and Reniers, G. (2021). An overview of scientometric mapping for the safety science community: methods, tools, and framework. Saf. Sci. 134:105093. doi: 10.1016/j.ssci.2020.105093
Li, J., Liu, L., Zheng, J., Han, W., Tian, R., and Yu, X. (2024). Asymmetric effect of daytime and nighttime temperature on spring phenology in Central Plains urban agglomeration, China. Urban Clim. 56:102070. doi: 10.1016/j.uclim.2024.102070
Li, X., Zhou, Y., Asrar, G. R., Mao, J., Li, X., and Li, W. (2017). Response of vegetation phenology to urbanization in the conterminous United States. Glob. Change Biol. 23, 2818–2830. doi: 10.1111/gcb.13562
Liang, H., Zhao, H., Cheng, W., Lu, Y., Chen, Y., Li, M., et al. (2024). Accelerating urban warming effects on the spring phenology in cold cities but decelerating in warm cities. Urban For. Urban Gree. 102:128585. doi: 10.1016/j.ufug.2024.128585
Liu, Q., Fu, Y. H., Zeng, Z., Huang, M., Li, X., and Piao, S. (2016a). Temperature, precipitation, and insolation effects on autumn vegetation phenology in temperate China. Glob. Change Biol. 22, 644–655. doi: 10.1111/gcb.13081
Liu, Q., Fu, Y. H., Zhu, Z., Liu, Y., Liu, Z., Huang, M., et al. (2016b). Delayed autumn phenology in the northern hemisphere is related to change in both climate and spring phenology. Glob. Change Biol. 22, 3702–3711. doi: 10.1111/gcb.13311
Ma, R., Shen, X., Zhang, J., Xia, C., Liu, Y., Wu, L., et al. (2022). Variation of vegetation autumn phenology and its climatic drivers in temperate grasslands of China. Int. J. Appl. Earth Obs 114:103064. doi: 10.1016/j.jag.2022.103064
McElwee, P. D., Carter, S. L., Hyde, K. J. W., West, J. M., Akamani, K., Babson, A. L., et al. (2023). “Ecosystems, ecosystem services, and biodiversity” in Fifth National Climate Assessment. eds. A. R. Crimmins, C. W. Avery, D. R. Easterling, K. E. Kunkel, B. C. Stewart, and T. K. Maycock (Washington, DC: U.S. Global Change Research Program).
Meng, L., Mao, J., Zhou, Y., Richardson, A. D., Lee, X., Thornton, P. E., et al. (2020). Urban warming advances spring phenology but reduces the response of phenology to temperature in the conterminous United States. Proc. Natl. Acad. Sci. USA 117, 4228–4233. doi: 10.1073/pnas.1911117117
Menzel, A., and Fabian, P. (1999). Growing season extended in Europe. Nature 397, –659. doi: 10.1038/17709
Møller, A. M., and Myles, P. S. (2016). What makes a good systematic review and meta-analysis? Br. J. Anaesth. 117, 428–430. doi: 10.1093/bja/aew264
Mora, L., Roberto, B., and Deakin, M. (2017). The first two decades of smart-city research: a bibliometric analysis. J. Urban Technol. 24, 3–27. doi: 10.1080/10630732.2017.1285123
Ninkov, A., Frank, J. R., and Maggio, L. A. (2022). Bibliometrics: methods for studying academic publishing. Perspect. Med. Educ. 11, 173–176. doi: 10.1007/s40037-021-00695-4
Peng, C., He, M., Cutrona, S. L., Kiefe, C. I., Liu, F., and Wang, Z. (2020). Theme trends and knowledge structure on mobile health apps: bibliometric analysis. JMIR Mhealth Uhealth 8:e18212. doi: 10.2196/18212
Peng, Y., Li, P., Zhou, X., Luo, Y., Zhang, C., Wang, L., et al. (2024). Divergent contributions of spring and autumn photosynthetic phenology to seasonal carbon uptake of subtropical vegetation in China. J. Geogr. Sci. 34, 1280–1296. doi: 10.1007/s11442-024-2248-5
Peñuelas, J., and Filella, I. (2001). Responses to a warming world. Science 294, 793–795. doi: 10.1126/science.106686
Piao, S., Ciais, P., Friedlingstein, P., Peylin, P., Reichstein, M., Luyssaert, S., et al. (2008). Net carbon dioxide losses of northern ecosystems in response to autumn warming. Nature 451, 49–52. doi: 10.1038/nature06444
Piao, S., Cui, M., Chen, A., Wang, X., Ciais, P., Liu, J., et al. (2011). Altitude and temperature dependence of change in the spring vegetation green-up date from 1982 to 2006 in the Qinghai-Xizang plateau. Agric. For. Meteorol. 151, 1599–1608. doi: 10.1016/j.agrformet.2011.06.016
Piao, S., Fang, J., Zhou, L., Ciais, P., and Zhu, B. (2006). Variations in satellite-derived phenology in China's temperate vegetation. Glob. Change Biol. 12, 672–685. doi: 10.1111/j.1365-2486.2006.01123.x
Piao, S., Friedlingstein, P., Ciais, P., Viovy, N., and Demarty, J. (2007). Growing season extension and its impact on terrestrial carbon cycle in the northern hemisphere over the past 2 decades. Glob. Biogeochem. Cycles 21:888. doi: 10.1029/2006GB002888
Piao, S., Liu, Q., Chen, A., Janssens, I. A., Fu, Y., Dai, J., et al. (2019). Plant phenology and global climate change: current progresses and challenges. Glob. Change Biol. 25, 1922–1940. doi: 10.1111/gcb.14619
Piao, S., Tan, J., Chen, A., Fu, Y. H., Ciais, P., Liu, Q., et al. (2015). Leaf onset in the northern hemisphere triggered by daytime temperature. Nat. Commun. 6:6911. doi: 10.1038/ncomms7911
Polgar, C. A., and Primack, R. B. (2011). Leaf-out phenology of temperate woody plants: from trees to ecosystems. New Phytol. 191, 926–941. doi: 10.1111/j.1469-8137.2011.03803.x
Qiu, T., Song, C., and Li, J. (2017). Impacts of urbanization on vegetation phenology over the past three decades in Shanghai, China. Remote Sens 9:970. doi: 10.3390/rs9090970
Ranjbari, M., Shams Esfandabadi, Z., Gautam, S., Ferraris, A., and Scagnelli, S. D. (2023). Waste management beyond the COVID-19 pandemic: bibliometric and text mining analyses. Gondwana Res. 114, 124–137. doi: 10.1016/j.gr.2021.12.015
Reich, P. B. (1995). Phenology of tropical forests: patterns, causes, and consequences. Canad. J. Bot. 73, 164–174. doi: 10.1139/b95-020
Ren, Q., He, C., Huang, Q., and Zhou, Y. (2018). Urbanization impacts on vegetation phenology in China. Remote Sens 10:1905. doi: 10.3390/rs10121905
Richardson, A. D., Ameyschenck, B., Elleng, D., Cwayne, M., and John, O. (2006). Phenology of a northern hardwood forest canopy. Glob. Change Biol. 12, 1174–1188. doi: 10.1111/j.1365-2486.2006.01164.x
Richardson, A. D., Black, T. A., Ciais, P., Delbart, N., Friedl, M. A., Gobron, N., et al. (2010). Influence of spring and autumn phenological transitions on forest ecosystem productivity. Philos. Trans. R. Soc. Lond. Ser. B Biol. Sci. 365, 3227–3246. doi: 10.1098/rstb.2010.0102
Richardson, A. D., Hufkens, K., Milliman, T., Aubrecht, D. M., Chen, M., Gray, J. M., et al. (2018a). Tracking vegetation phenology across diverse north American biomes using PhenoCam imagery. Sci Data 5:180028. doi: 10.1038/sdata.2018.28
Richardson, A. D., Hufkens, K., Milliman, T., Aubrecht, D. M., Furze, M. E., Seyednasrollah, B., et al. (2018b). Ecosystem warming extends vegetation activity but heightens vulnerability to cold temperatures. Nature 560, 368–371. doi: 10.1038/s41586-018-0399-1
Richardson, A. D., Keenan, T. F., Migliavacca, M., Ryu, Y., Sonnentag, O., and Toomey, M. (2013). Climate change, phenology, and phenological control of vegetation feedbacks to the climate system. Agric. For. Meteorol. 169, 156–173. doi: 10.1016/j.agrformet.2012.09.012
Schwartz, M. D., and Reiter, B. E. (2000). Changes in north American spring. Int. J. Climatol. 20, 929–932. doi: 10.1002/1097-0088(20000630)20:8<929::AID-JOC557>3.0.CO;2-5
Shen, X., Liu, B., Henderson, M., Wang, L., Jiang, M., and Lu, X. (2022). Vegetation greening, extended growing seasons, and temperature feedbacks in warming temperate grasslands of China. J. Clim. 35, 5103–5117. doi: 10.1175/JCLI-D-21-0325.1
Shen, X., Liu, B., Henderson, M., Wang, L., Wu, Z., Wu, H., et al. (2018). Asymmetric effects of daytime and nighttime warming on spring phenology in the temperate grasslands of China. Agric. For. Meteorol. 259, 240–249. doi: 10.1016/j.agrformet.2018.05.006
Shen, X., Shen, M., Wu, C., Peñuelas, J., Ciais, P., Zhang, J., et al. (2024). Critical role of water conditions in the responses of autumn phenology of marsh wetlands to climate change on the Tibetan plateau. Glob. Chang. Biol. 30:e17097. doi: 10.1111/gcb.17097
Shen, M., Wang, S., Jiang, N., Sun, J., Cao, R., Ling, X., et al. (2022). Plant phenology changes and drivers on the Qinghai-Tibetan plateau. Nat. Rev. Earth Environ. 3, 633–651. doi: 10.1038/s43017-022-00317-5
Shen, M., Zhang, G., Cong, N., Wang, S., Kong, W., and Piao, S. (2014). Increasing altitudinal gradient of spring vegetation phenology during the last decade on the Qinghai-Tibetan plateau. Agric. For. Meteorol. 189–190, 71–80. doi: 10.1016/j.agrformet.2014.01.003
Shen, M., Zhao, W., Jiang, N., Liu, L., Cao, R., Yang, W., et al. (2024). Challenges in remote sensing of vegetation phenology. Innov. Geosci. 2:100070. doi: 10.59717/j.xinn-geo.2024.100070
Shrestha, U. B., Gautam, S., and Bawa, K. S. (2012). Widespread climate change in the Himalayas and associated changes in local ecosystems. PLoS One 7:e36741. doi: 10.1371/journal.pone.0036741
Singh, P., Gargi, B., Semwal, P., and Verma, S. (2024). Global research and research progress on climate change and their impact on plant phenology: 30 years of investigations through bibliometric analysis. Theor. Appl. Climatol. 155, 4909–4923. doi: 10.1007/s00704-024-04919-5
Sisheber, B., Marshall, M., Mengistu, D., and Nelson, A. (2023). Detecting the long-term spatiotemporal crop phenology changes in a highly fragmented agricultural landscape. Agric. For. Meteorol. 340:109601. doi: 10.1016/j.agrformet.2023.109601
Sonnentag, O., Hufkens, K., Teshera-Sterne, C., Young, A. M., Friedl, M., Braswell, B. H., et al. (2012). Digital repeat photography for phenological research in forest ecosystems. Agric. For. Meteorol. 152, 159–177. doi: 10.1016/j.agrformet.2011.09.009
Tan, Y., Yiew, T. H., Habibullah, M. S., Chen, J., Mat Kamal, S. N. I., and Saud, N. A. (2023). Research trends in biodiversity loss: a bibliometric analysis. Environ. Sci. Pollut. Res. 30, 2754–2770. doi: 10.1007/s11356-022-22211-9
Tian, F., Cai, Z., Jin, H., Hufkens, K., Scheifinger, H., Tagesson, T., et al. (2021). Calibrating vegetation phenology from Sentinel-2 using eddy covariance, PhenoCam, and PEP725 networks across Europe. Remote Sens. Environ. 260:112456. doi: 10.1016/j.rse.2021.112456
Uphus, L., Lüpke, M., Yuan, Y., Benjamin, C., Englmeier, J., Fricke, U., et al. (2021). Climate effects on vertical forest phenology of Fagus sylvatica L., sensed by sentinel-2, time lapse camera, and visual ground observations. Remote Sens 13:3982. doi: 10.3390/rs13193982
van Eck, N. J., and Waltman, L. (2010). Software survey: VOSviewer, a computer program for bibliometric mapping. Scientometrics 84, 523–538. doi: 10.1007/s11192-009-0146-3
Van Eck, N. J., and Waltman, L. (2020). VOSviewer Manual. Leiden: Universiteit Leiden Available online at: https://www.vosviewer.com/documentation/Manual_VOSviewer_1.6.13.pdf.
Verrall, B., and Pickering, C. M. (2020). Alpine vegetation in the context of climate change: a global review of past research and future directions. Sci. Total Environ. 748:141344. doi: 10.1016/j.scitotenv.2020.141344
Wang, L., De Boeck, H. J., Chen, L., Song, C., Chen, Z., McNulty, S., et al. (2022). Urban warming increases the temperature sensitivity of spring vegetation phenology at 292 cities across China. Sci. Total Environ. 834:155154. doi: 10.1016/j.scitotenv.2022.155154
Wang, C., Jiang, Q., Deng, X., Lv, K., and Zhang, Z. (2020). Spatio-temporal evolution, future trend and phenology regularity of net primary productivity of forests in Northeast China. Remote Sens 12:3670. doi: 10.3390/rs12213670
Wang, M., Li, P., Peng, C., Xiao, J., Zhou, X., Luo, Y., et al. (2022). Divergent responses of autumn vegetation phenology to climate extremes over northern middle and high latitudes. Glob. Ecol. Biogeogr. 31, 2281–2296. doi: 10.1111/geb.13583
White, M. A., de Beurs, K. M., Didan, K., Inouye, D. W., Richardson, A. D., Jensen, O. P., et al. (2009). Intercomparison, interpretation, and assessment of spring phenology in North America estimated from remote sensing for 1982-2006. Glob. Change Biol. 15, 2335–2359. doi: 10.1111/j.1365-2486.2009.01910.x
Wu, C., Chen, J. M., Gonsamo, A., Price, D. T., Black, T. A., and Kurz, W. A. (2012). Interannual variability of net carbon exchange is related to the lag between the end-dates of net carbon uptake and photosynthesis: evidence from long records at two contrasting forest stands. Agric. For. Meteorol. 164, 29–38. doi: 10.1016/j.agrformet.2012.05.002
Wu, L., Ma, X., Dou, X., Zhu, J., and Zhao, C. (2021). Impacts of climate change on vegetation phenology and net primary productivity in arid Central Asia. Sci. Total Environ. 796:149055. doi: 10.1016/j.scitotenv.2021.149055
Wu, C. Y., Wang, X. Y., Wang, H. J., Ciais, P., Peñuelas, J., Myneni, R. B., et al. (2018). Contrasting responses of autumn-leaf senescence to daytime and night-time warming. Nat. Clim. Chang. 8, 1092–1098. doi: 10.1038/s41558-018-0346-z
Yang, X., Mustard, J. F., Tang, J., and Xu, H. (2012). Regional-scale phenology modeling based on meteorological records and remote sensing observations. J. Geophys. Res. Biogeosciences 117:1977. doi: 10.1029/2012JG001977
Yang, Z., Shen, M., Jia, S., Guo, L., Yang, W., Wang, C., et al. (2017). Asymmetric responses of the end of growing season to daily maximum and minimum temperatures on the Tibetan plateau. J. Geophys. Res.-Atmos. 122, 13,278–213,287. doi: 10.1002/2017JD027318
Yang, H., Shu, B., Huang, Y., and Xian, J. (2013). Bibliometrical analysis of research advances on international vegetation phenology. Guihaia 33, 717–722. doi: 10.3969/j.issn.1000-3142.2013.05.024
Yang, L., and Zhao, S. (2023). A stronger advance of urban spring vegetation phenology narrows vegetation productivity difference between urban settings and natural environments. Sci. Total Environ. 868:161649. doi: 10.1016/j.scitotenv.2023.161649
Yin, P., Li, X., and Pellikka, P. (2024). Asymmetrical impact of daytime and nighttime warming on the interannual variation of urban spring vegetation phenology. Earths Future 12:e2023EF004127. doi: 10.1029/2023EF004127
Yuan, H., Wu, C., Gu, C., and Wang, X. (2020). Evidence for satellite observed changes in the relative influence of climate indicators on autumn phenology over the northern hemisphere. Glob. Planet. Change 187:103131. doi: 10.1016/j.gloplacha.2020.103131
Zeng, L., Wardlow, B. D., Xiang, D., Hu, S., and Li, D. (2020). A review of vegetation phenological metrics extraction using time-series, multispectral satellite data. Remote Sens. Environ. 237:111511. doi: 10.1016/j.rse.2019.111511
Zhang, J., Chen, S., Wu, Z., and Fu, Y. H. (2022). Review of vegetation phenology trends in China in a changing climate. Prog. Phys. Geogr. 46, 829–845. doi: 10.1177/03091333221114737
Zhang, X., Friedl, M. A., Schaaf, C. B., and Strahler, A. H. (2004). Climate controls on vegetation phenological patterns in northern mid-and high latitudes inferred from MODIS data. Glob. Change Biol. 10, 1133–1145. doi: 10.1111/j.1529-8817.2003.00784.x
Zhang, Q., Kong, D., Shi, P., Singh, V. P., and Sun, P. (2017). Vegetation phenology on the Qinghai-Tibetan plateau and its response to climate change (1982-2013). Agr. For. Meteorol. 248, 407–417. doi: 10.1016/j.agrformet.2017.10.026
Zhang, X., Wang, J., Gao, F., Liu, Y., Schaaf, C., Friedl, M., et al. (2017). Exploration of scaling effects on coarse resolution land surface phenology. Remote Sens. Environ. 190, 318–330. doi: 10.1016/j.rse.2017.01.001
Zhang, G., Zhang, Y., Dong, J., and Xiao, X. (2013). Green-up dates in the Tibetan plateau have continuously advanced from 1982 to 2011. Proc. Natl. Acad. Sci. U. S. A. 110, 4309–4314. doi: 10.1073/pnas.1210423110
Zhao, L., Yang, M., Wang, Z., and Michelson, G. (2023). Trends in the dynamic evolution of corporate social responsibility and leadership: a literature review and bibliometric analysis. J. Bus. Ethics 182, 135–157. doi: 10.1007/s10551-022-05035-y
Keywords: vegetation phenology, climate change, bibliometric analysis, research trends, thematic evolution
Citation: Zhou R, Wen G, Li H, Zhu S, Li Y and Wang X (2025) Evolution of vegetation phenology research under climate change: a comprehensive bibliometric study. Front. For. Glob. Change. 8:1688384. doi: 10.3389/ffgc.2025.1688384
Edited by:
Xiongqing Zhang, Chinese Academy of Forestry, ChinaReviewed by:
Xiangjin Shen, Chinese Academy of Sciences (CAS), ChinaShouzhi Chen, Beijing Normal University, China
Copyright © 2025 Zhou, Wen, Li, Zhu, Li and Wang. This is an open-access article distributed under the terms of the Creative Commons Attribution License (CC BY). The use, distribution or reproduction in other forums is permitted, provided the original author(s) and the copyright owner(s) are credited and that the original publication in this journal is cited, in accordance with accepted academic practice. No use, distribution or reproduction is permitted which does not comply with these terms.
*Correspondence: Ruiwu Zhou, emhvdXJ1aXd1QHl4bnUuZWR1LmNu; Guojing Wen, d2VuZ3VvamluZ0B4dGJnLmFjLmNu
†These authors share first authorship