 Konstantin Schutjajew
 Runyu Yan
 Markus Antonietti1
 Martin Oschatz
- 1Department of Colloid Chemistry, Max Planck Institute of Colloids and Interfaces, Potsdam, Germany
- 2Institute for Chemistry and Biochemistry, Freie Universität Berlin, Berlin, Germany
Recent research on ionic liquid electrolyte-based supercapacitors indicated the contribution of phase transitions of the electrolytes at high cell voltages to the energy stored. This mechanism can be exploited to significantly increase the energy density of supercapacitors, which up to now remains their major drawback. It was found that these ordering transitions require the presence of mesopores within the carbon electrode materials and that porosity in general is a key factor to trigger them, but details of the mechanism remains unexplained. To get a more profound understanding of this phenomenon, carbon materials with different pore diameters and volumes were synthesized and the effect of those properties on the phase transitions in the ionic liquids was studied by means of cyclic voltammetry. A clear correlation between the peak current and the mesopore volume is revealed and an optimal pore diameter was determined, exceeding which does not improve the phase transition behavior. These findings are useful as guidelines for the rational design of carbon mesopores in order to utilize the new energy storage modes which are neither fully capacitive, nor redox-based.
Introduction
The progressing integration of modern technology into daily life has led to an ever increasing energy demand, causing the exploitation of already scarce fossil fuel resources close to their exhaustion and consequently causing extensive damage to the environment. Therefore, renewable energy sources moved into focus as an alternative for a sustainable energy supply on the long run ranging from low energy systems such as communication and individual mobility up to the electric grid mains. The integration of renewables into daily life, especially for public and personal transportation or mobile consumer electronics is a particular challenge. Although the development of the lithium ion battery with high energy storage capacity has led to its widespread application, some inherent drawbacks such as safety issues and environmental concerns raise the demand for safer and more sustainable solutions (Choi et al., 2012; Manthiram, 2017).
The electrical double layer capacitor (EDLC) is a possible supplement to the lithium-ion battery (Simon and Gogotsi, 2008, 2013; González et al., 2016; Salanne et al., 2016). The energy in such devices is traditionally stored via electrostatic adsorption of electrolyte ions to the electrode surface, which results in very high power density and exceptionally long cycle life. On the other hand, EDLCs can only reach about a tenth of the energy density of lithium-ion batteries. Significant efforts have been invested in increasing the energy density of capacitors by tuning electrolytes, electrode materials, or even coupling the double layer formation to reversible surface redox reactions, but the capacity of battery technology still remains out of reach (Béguin et al., 2014; Borchardt et al., 2014).
More recently, the utilization of so called room-temperature ionic liquids (RTILs) as electrolytes has opened a prospect to solve the problem of the supercapacitors' low energy density (Merlet et al., 2012; Brandt et al., 2013; Macfarlane et al., 2014; Salanne, 2017). This special class of “molten salts” has electrochemical stability windows of more than 4 V, which is very beneficial as the energy stored in a capacitor generally is strongly related to the applied voltage. RTILs are also non-flammable and can be regarded as environmentally less damaging than common solvent-based organic electrolytes. Even more importantly, theoretical, and experimental studies showed that the energy storage mechanism is likely different than the compression double layer present in solvent based electrolytes, because the overall ion density is nearly constant in such electrolytes. They further showed the possibility of a change in coordination geometry of RTILs when confined in a porous carbon environment, triggered by an applied electric potential (Tazi et al., 2010; Kiyohara et al., 2011; Fedorov and Kornyshev, 2014; Rotenberg and Salanne, 2015; Futamura et al., 2017; Yan et al., 2018). These phase transitions may play a crucial role for the conservation of electroneutrality and thus for energy storage in RTIL-based EDLCs (Antonietti et al., 2018). This new mode of energy storage was recently proposed based on a series of experiments on porous carbon materials and the presence of mesopores with diameters as large as the dimensions of a few RTIL ion layers was found to play a particularly important role (Antonietti et al., 2018; Lai et al., 2018; Yan et al., 2018). However, the influence of carbon pore structure and structure of the RTIL on this phenomenon remains still poorly understood.
To address some of those questions, an established hard-templating approach has been employed to synthesize a series of carbon materials with varying porosities (Jun et al., 2000; Postnov et al., 2013). They were employed as electrode materials for cyclic voltammetry experiments within different RTIL electrolytes, namely 1-ethyl-3-methylimidazolium tetrafluoroborate (EMImBF4), 1-butyl-3-methylimidazolium tetrafluoroborate (BMImBF4), and 1-ethyl-3-methylimidazolium bis(trifluoromethylsulfonyl)imide (EMImTFSI). It turned out that irrespectively of the RTIL used the phase transformation was more pronounced in smaller mesopores. Even more, there is a direct correlation between mesopore volume and peak current, corroborating the idea of a phase transition taking place inside the carbon mesopores. This systematic investigation provides profound experimental insights into this mechanism and improves our understanding of the underlying principles.
Materials and Methods
Synthesis of the Carbon Materials
Aerosil®n-m carbons were synthesized by an incipient wetness impregnation approach using fumed silica Aerosil® 90 and Aerosil® 380 (Evonik Industries AG) as hard templates. A comparable method has previously been described by Jun et al. (2000) and the template has been employed by Postnov et al. (2013). The two template materials are composed of spherical primary particles and differ mainly in particle size, enabling control over pore size in the carbon replicas. The pore volume was adjusted by changing the mass ratio of silica to carbon precursor (sucrose) from 1:1 to 1:2 and 1:4. The variable n in the sample name denotes the template type, while the variable m represents the sucrose/silica mass ratio. In a typical synthesis the corresponding mass of silica precursor was impregnated with a solution of 2 g sucrose and 0.2 g concentrated sulphuric acid in 10 ml water. The mixture was heated at 100°C for 6 h and the temperature was increased to 160°C for another 6 h. The dark brown to black compound was transferred into a porcelain boat and carbonized at 900°C for 2 h at a heating rate of 60 K h−1 in a horizontal tube furnace under nitrogen flow. Removal of the template was accomplished by heating the solid to 120°C in 5 M sodium hydroxide aqueous solution overnight under reflux, followed by filtration and washing with ~2 L water in the cases of carbons Aerosil n-2 and Aerosil n-4. For carbons with a 1:1 sucrose/silica ratio the template was removed by stirring the carbonization product in 500 ml of a 4 M [NH4][F2H] aqueous solution for 3 days, followed by filtration and subsequent washing with a 1:1 ethanol/water mixture and another stirring procedure in [NH4][F2H] solution. After a similar filtration and washing sequence a residual template mass as low as 4 % was achieved as indicated by thermogravimetric analysis.
Structural Characterization
N2 and CO2 physisorption experiments have been carried out on a Quadrasorb apparatus (Quantachrome Instruments) at −196 and 0°C, respectively. Before each measurement, 40-70 mg of the sample have been degassed under vacuum at 150°C for 20 h. Specific surface areas have been calculated from the N2 physisorption measurements using the multipoint BET-method (p/p0 = 0.05–0.20). Pore volumes and pore size distributions have been calculated from the adsorption branch of the N2 isotherms using the quenched solid density functional theory (QSDFT) for N2 on carbon assuming cylindrical and slit-shaped pores. Pores with a diameter smaller than 1.5 nm have been analyzed by CO2 adsorption experiments at 0°C, where the pore size distribution was calculated by means of the non-local density functional theory (NLDFT) for CO2 adsorbed on carbon surfaces.
Thermogravimetric Analysis (TGA) was carried out on a Netzsch TG 209 F1 Iris device in a temperature range between room temperature and 1,000°C at a heating rate of 5 K min−1. Samples were placed in a platinum crucible and subjected to a constant synthetic air flow. Elemental Analysis (EA) was done on a vario microcube CHNS analyzer by Elementar Analysensysteme GmbH.
Raman spectra were measured on a Witec Raman microscope at an excitation wavelength of 532 nm with a power of 4.0 mW. After the substraction of background noise the D, D2, A and G bands are fitted with a Lorentz function.
X-ray diffraction measurements were performed on a Bruker D8 in Bragg-Brentano geometry in a 2θ range of 10°-70° with a resolution of 0.03°. CuKα radiation (λ = 1.54 Å) and a NaI scintillation detector were used and the sample was placed horizontally on a silicon single crystal sample holder.
Transmission electron microscopy (TEM) characterization was carried out using an EM 912 microscope (Omega/Carl-Zeiss Oberkochen) operating at 120 kV. The samples were prepared by dispersion in ethanol in an ultrasonic bath for 10 min. The dispersion was dropwise applied onto a carbon-coated copper TEM grid and dried at room temperature.
Electrochemical Measurements
The carbon materials were fabricated into free-standing electrodes by mixing them with a polytetrafluoroethylene solution (PTFE, 60% in water, Sigma-Aldrich) in a mass ratio of carbon to PTFE of 9:1. The mixture was dispersed in ethanol and homogenized for several minutes using an ultrasonic bath. The dispersion was poured on a glass plate and mixed with razor blades under air atmosphere, so that upon evaporation of the solvent a substance of a rubber-like consistency was obtained. It was dried for 4 h at 60°C, then placed on an aluminum foil and rolled to a sheet of ~120 μm thickness (measured with a micrometer caliper) using a commercially available roll mill. Finally, the sheet was punched into freestanding circular electrodes of 10 mm diameter, which were dried at 60°C overnight. The mass of each electrode was determined before each electrochemical measurement.
Cyclic voltammetry (CV) measurements were performed in two-electrode configuration on a Biologic® MPG-2 potentiostat using Swagelok® type cells where the carbon electrodes and the separator (Dreamweaver® Silver 25, 13~mm diameter) were sandwiched between two platinum current collectors. The areal loading can be found in Table 1. The cells were assembled inside a glove box with oxygen and moisture contents below 0.1 ppm. The CV measurements were carried out in potential ranges of 0-5.0 V vs. counter electrode potential at a scan rate of ν = 2 mV s−1 after the cell resistance was determined by means of electrochemical impedance spectroscopy. In the CV curves the mass specific differential capacitance Cd was plotted instead of the current, which is calculated as follows.
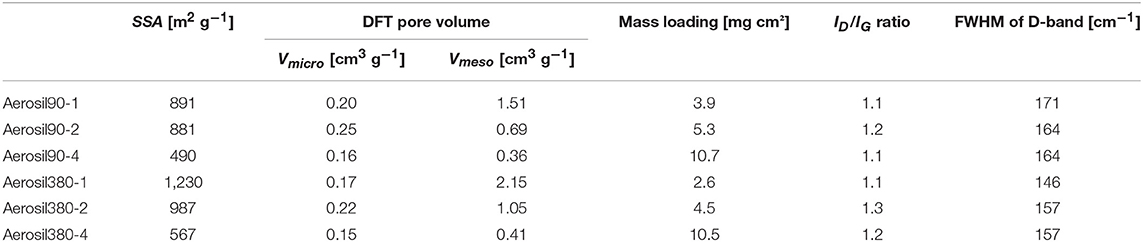
Table 1. BET specific surface area (SSA), total pore volume (Vtot), micro-, and mesopore volumes from DFT (Vmicro and Vmeso), and Raman data of the Aerosil® templated carbons.
Here I is the measured current in A, μ is the mass of the carbon in one electrode in g, and ν is the scan rate in V s−1. The factor of 2 for the capacitance calculations is left out for the three-electrode measurements. As the electrolytes 1-ethyl-3-methylimidazolium tetrafluoroborate (EMImBF4, >98%, IoLiTec GmbH), 1-butyl-3-methylimidazolim tetrafluoroborate (BMImBF4, >98%, IoLiTec GmbH), and 1-ethyl-3-methylimidazolium bis(trifluoromethylsulfonyl)imide (EMImTFSI, >98%, IoLiTec GmbH) were employed. The RTILs were stored over a molecular sieve (4 Å) in a glove box prior to usage.
Three-electrode cyclic voltammograms were obtained using a custom-built cell, similar to a T-shaped Swagelok cell (see Figure S1). The counter electrode consisted of a piece of the same carbon as the working electrode, which was oversized by two to three times. The quasi-reference electrode was prepared by coating a superP-carbon/PTFE solution similar to the one used to fabricate the electrode sheets on a piece of a metal rod following the method of Weingarth et al. The reference potential was 190 ± 10 mV vs. Fc/Fc+ (Weingarth et al., 2014). To investigate the possible influence of contaminations of the electrolyte, the three-electrode measurements were performed in RTILs of the highest available purity grade (EMImBF4 99%, BMImBF4 99%, EMImTFSI 99.5%, all IoLiTec GmbH) which were additionally purified by vacuum drying followed by stirring over previously activated molecular sieve (3 Å) at 60°C for 72 h, according to the method of Gnahm and Kolb (2011).
Results and Discussion
Characterization of the Carbon Materials
Mesoporous carbon materials were synthesized using a hard templating approach with Aerosil® 90 and Aerosil® 380 as silica templates (Figure 1). Those commercially available fumed silicas consist of spherical primary particles that differ in size as well as extent of agglomeration. Aerosil® 90 consists of larger primary particles and has lower specific surface area than Aerosil® 380. The Aerosil® particle size and shape has a significant impact on the resulting carbon pore size, while the template loading influences the pore volume. X-ray diffraction patterns of the carbon samples consist only of two broad peaks at 2θ = 24° and 44°, demonstrating their weakly ordered structure with only minor graphitic stacking which is typical for hard-templated carbon prepared from sucrose under comparable conditions (Oschatz et al., 2014). Only in the cases of Aerosil380-1 and Aerosil90-1 small additional peaks are present at 2θ = 18° (Supplementary Information, Figure S2). TGA analysis under air atmosphere shows an ash content of 2–4 wt% for all samples at temperatures above 600°C (Figure S3), indicating only minor amounts of residual template. The amount of heteroatoms such as nitrogen or sulfur is negligibly low according to elemental analysis (Table S1). The Raman spectra (Figure S4) show a D-band close to 1,340 cm−1 originating from the breathing mode of the six-fold sp2-hybridized carbon rings due to the presence of disorder and defects. The width of the D-band allows conclusions about the structural order and extent of these sp2 rings. The wide D-bands (FWHM between 146 and 171 cm−1) are caused by the abundance of structurally disordered sections. Furthermore, the ordering of the carbons can be evaluated from the ratio of the D- to the G-band (ID/IG), which is proportional to the amount of six-membered rings. Its value is similar in all samples between 1.1 and 1.3 and does not show any trend throughout the series. Hence a comparable microstructure (thus also surface chemistry and electric conductivity) of the carbons can be assumed (Osswald et al., 2012; Pawlyta et al., 2015; Oschatz et al., 2016). This result is reasonable in view of the similar carbonization temperatures and carbon precursors applied for the synthesis of all samples.

Figure 1. Schematic representation of the silica templating procedure using Aerosil® silica.
The porosity was assessed by nitrogen physisorption at −196°C (Table 1 and Figure 2). The shape of the isotherms (Figure 2A) can be described as type IV(a) with a H4 type hysteresis according to the IUPAC classification (Thommes et al., 2015). The hysteresis is located at higher relative pressures for Aerosil®-90-templated carbons (0.7 < p/p0 < 1.0) than for Aerosil®-380-templated ones (0.7 < p/p0 < 0.9). This indicates larger mesopores in carbons templated with Aerosil® 90 than in those templated with Aerosil® 380, which is in good accordance with the silica primary particle size. As expected, the pore volume increased with decreasing sucrose loading, while different silica templates led to a comparable pore volume at similar loading. There is a drastic increase of adsorbed nitrogen at relative pressures approaching 1 in the case of Aerosil90-1 and Aerosil380-1, indicating the presence of a high volume of large meso- and macropores. This is because the amount of sucrose is very low compared to that of the template, which prevents the carbon precursor to fully encapsulate the silica and finally leaves the carbons with a high fraction of macropores and external surface area. This is further supported by TEM images (Figure 3), where a sponge-like structure with spherical holes corresponding to the size of the silica primary particles can be seen in Aerosil90-1 as well as in Aerosil380-1, and to some extent also in Aerosil90-2 and Aerosil380-2. In contrast, the decreasing template content gives rise to the denser morphology of Aerosil90-4 and Aerosil380-4. In agreement with the gas physisorption experiments, no indications for pore blocking or closed pores are observable in the electron microscopy images of the carbon materials.
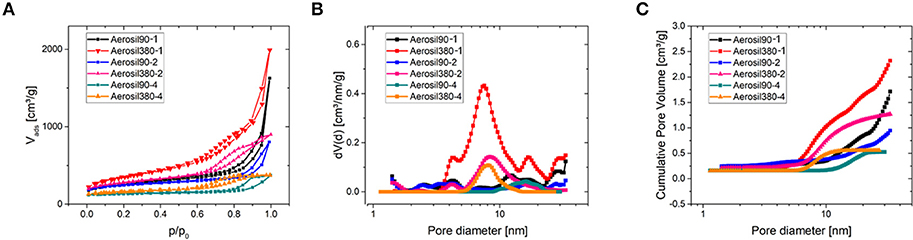
Figure 2. N2 physisorption measurements at −196°C (A) and corresponding differential (B) and cumulative (C) pore size distributions of Aerosil®-templated carbons.
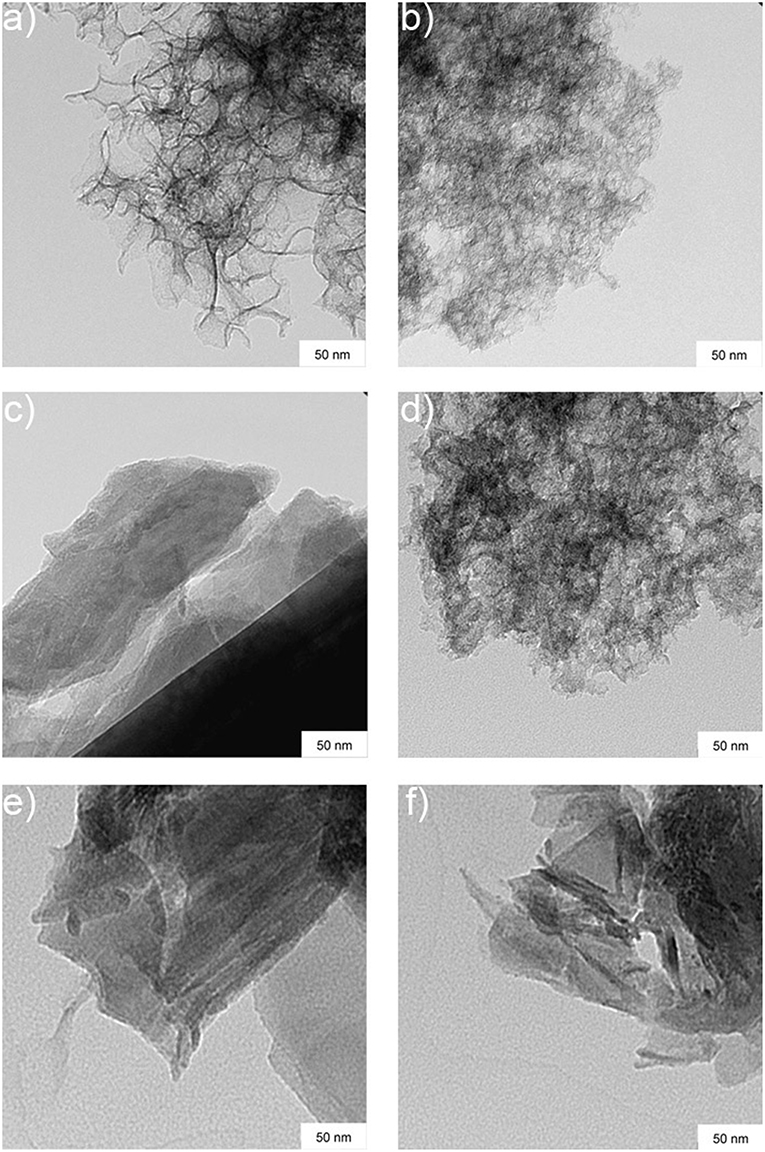
Figure 3. TEM-images of Aerosil®-templated carbons. (a) Aerosil90-1, (b) Aerosil380-1, (c) Aerosil90-2, (d) Aerosil380-2, (e) Aerosil90-4, and (f) Aerosil380-4.
As can be seen from the differential PSD of the materials (Figure 2B), the mesopore diameters of Aerosil®-380- and Aerosil®-90-templated carbons are centered at around 8 nm and 16 nm, respectively. The cumulative pore volume plot (Figure 2C) reveals an increase of the mesopore volume with increasing template content at similar primary particle size. In general, the mesopore volume increases with the increase of the template content, and is comparable for the different kinds of templates, while the micropore (pore diameter <2 nm) volume remains low.
The microporosity of the carbon materials was investigated using CO2 physisorption at 0°C (Figure 4). The isotherms of carbons with similar sucrose/silica ratios are practically identical. Carbons with a silica/sucrose ratio of two feature the highest amount of gas adsorbed, while those with a ratio of four show the lowest, with Aerosiln-1 carbons in between. In consequence, the same trend can be perceived from the cumulative pore volume plot of the pore size distribution obtained by fitting the isotherms to a NLDFT-kernel. Although the volume of narrow micropores obviously depends on the template content during the synthesis, it is vanishingly low in all samples, so the influence of micropores on the following CV measurements is expected to be negligible.
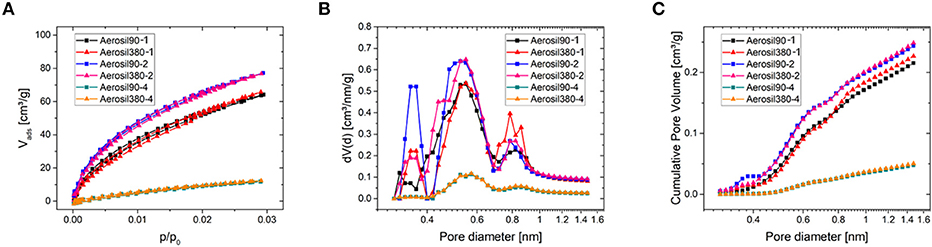
Figure 4. CO2 physisorption measurements at 0°C (A) and corresponding differential (B) and cumulative (C) pore size distributions of Aerosil®-templated carbons.
Investigations of Cooperative Ordering Transitions of Ionic Liquids in Carbon Mesopores With Cyclic Voltammetry
The structure of the electrical double layer in RTILs is fundamentally different from that of a solvent-based electrolyte. In the latter cases an applied potential causes a gathering of ions as “mirror charges” on the surface of the respective electrode and an increasing thickness and compression of the double layer with progressing potential ramp. This mechanism cannot be applied to RTIL-based electrolytes, as they are solely composed of ions without a surrounding dielectric medium (Antonietti et al., 2018). Therefore, the ions exhibit an intrinsic local structuring called coulombic ordering, where each ion is surrounded by a shell of counterions and the local density of ions has to be nearly the same on the electrode surface and within the bulk electrolyte. Hence, the charge storage must proceed via local ordering transitions, where ions switch their positions to conform to the applied potential. Those processes are known as overscreening at lower voltages, i.e., the overcompensation of the potential due to coulombic ordering, and crowding, i.e., the formation of multiple coion layers at the electrode/electrolyte interface due to very high voltages (Bazant et al., 2011; Kondrat et al., 2011). These and related mechanisms are widely accepted in the case of planar metallic electrodes (Fedorov and Kornyshev, 2014; Elbourne et al., 2015; Wen et al., 2015) as well as for microporous systems (Largeot et al., 2008; Futamura et al., 2017). Although they have been proposed also for mesoporous materials (in terms of ordering transitions that can propagate deep into the bulk of the electrolyte instead of being limited to the surface of the electrode materials), detailed understanding is still lacking (Antonietti et al., 2018; Yan et al., 2018).
To deduce a general relationship between the phase transition mechanism and basic mesopore properties such as their diameter and volume, the synthesized carbon materials were subjected to cyclic voltammetry using three different RTILs as electrolytes. The chosen ionic liquids are stable in a voltage window of more than 4.3 V (Zhang et al., 2018) and their decomposition is generally observed upon exceeding this voltage. However, another process seems to overlay with the degradation of the ionic liquid, which is manifested as a peak beginning at ~3.9 V, for Aerosil90-1 and Aerosil380-1 in EMImTFSI electrolyte (Figure 5A). It has recently been shown that the presence of this peak strongly depends on the presence of mesopores (Antonietti et al., 2018; Yan et al., 2018). As a consequence, there is a significant increase in current observable for the highly mesoporous Aerosil®-templated carbon materials. For samples Aerosiln-1 and Aerosiln-2 the use of different template particle sizes leads to significant differences in the maximum current of the peaks and higher mesopore volumes lead to higher peak currents (Figures 5A,B, Figures S5, S6). For both pore sizes (i.e., for the Aerosil-90-m and the Aerosil-380-m series) it can be clearly seen that the maximum peak current scales with the pore volume becoming smaller for materials with higher sucrose content and thus lower pore volume. On the contrary, for samples Aerosiln-4 with no apparent difference in mesopore volume the peak height remains rather comparable (Figure 5C). In the case of Aerosiln-1 carbons with the largest mesopore volumes, the peaks are identical with respect to onset and peak potentials. The same observations hold for the reverse peaks. In Aerosiln-2 carbons the peak is sharper and higher for smaller pores, but the area remains approximately the same. The reverse peak is smeared out and does not lie completely within the measurement range for Aerosil90-2.
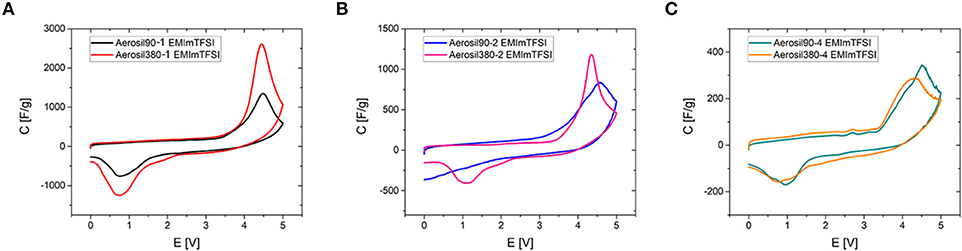
Figure 5. Comparison of cyclic voltammograms of Aerosil®-templated carbons in EMImTFSI depending on pore sizes and pore volumes (0 – 5.0 V, ν = 2 mV s−1). (A) Aerosiln-1, (B) Aerosiln-2, and (C) Aerosiln-4.
The onset potential and the peak area are of particular interest here, as the former is related to the enthalpy released or taken up during a physical process and the latter gives an indication about the number of units participating. While no explicit correlation between onset potential and pore diameter can be observed, the peak is generally larger in smaller mesopores. This means that even if the phenomenon behind the peak is not necessarily energetically more favored in smaller pores, it proceeds inside them to a greater extent.
In order to fix the potential at which the peak occurs, CV-measurements were conducted in a three-electrode setup with activated carbon as the quasi-reference electrode. Before each measurement the open circuit potential (OCP) of the cell was measured and was determined to be close to 0 V. Deviations in the order of a few tens of mVs may be due to the different dimensions of counter and working electrode. To rule out the influence of residues of halide ions and water traces, RTILs of the highest available quality were employed after an additional purification step. The forward peak is located at potentials of 2–3 V vs. activated carbon (AC) in all three investigated RTILs and can be therefore attributed to a phenomenon at the positive electrode (Figure 6). The differential capacitance of the peak is significantly higher and narrower with three electrodes due to the precise control of the potential. The reverse peak is furthermore better resolved in the three-electrode measurements and consists of two separate smaller peaks located at +1 and −1 V vs. AC. As the OCP is known to be approximately at 0 V it can be stated that the former peak appears at a positive and the latter at a negative polarization of the working electrode. Note that even the combined current of both small reverse peaks does not reach that of the large forward peak, which is most probably due to the fact that in a two-electrode measurement the sum of the currents of the processes at the positive and negative electrodes are recorded. This problem is tackled by the employment of a three-electrode cell in order to avoid any interferences arising from the counter electrode. Except for the deviation of the reverse peak, the two- and three-electrode experiments are in excellent agreement as can be seen for example in Figure 7 or Figure S7, where the CVs from two-and three-electrode setups are shown, which are essentially superimposable. To finally rule out effects of decomposition and to study the behavior at negative polarization, the initial voltage window was extended to negative potentials instead of positive ones (Figure S8). The combined results of the study of the working electrode as both the anode and the cathode contain information similar to the measurements of van Aken et al. (2015), in our case considering explicitly the working electrode. It is evident that upon negative polarization rapid and obvious decomposition takes place inherently, which has nothing in common with the processes at positive potentials. Now, that the connection between two- and three-electrode measurements is hereby established most of the further study relies on the results from two-electrode measurements, because the simplicity and practical reliability of the two-electrode cell outweighs the advantages of the three-electrode setup.
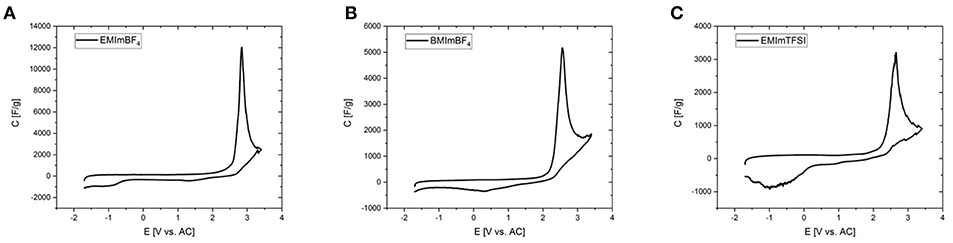
Figure 6. Cyclic voltammograms of the investigated RTILs with Aerosil90-2 as the electrodes in a three-electrode setup (0 – 5.0 V, ν = 2 mV s−1). (A) EMImBF4, (B) BMImBF4, and (C) EMImTFSI.
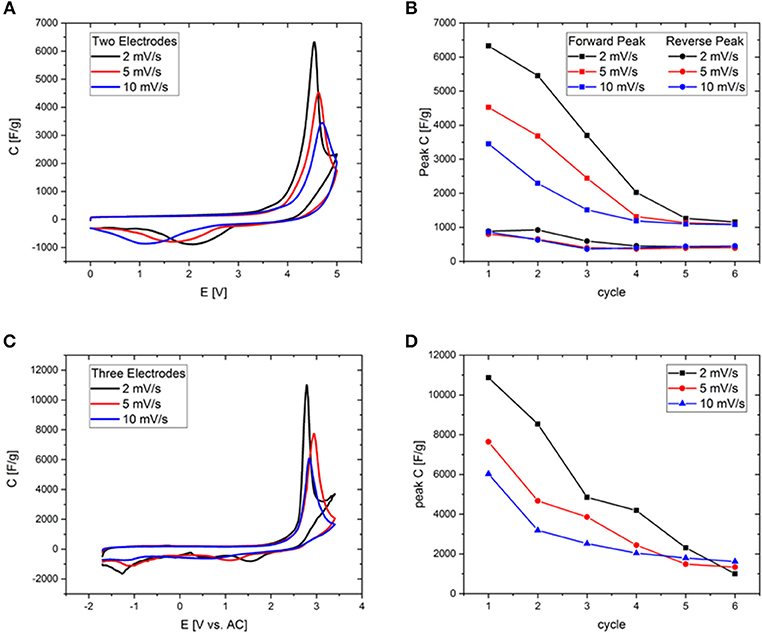
Figure 7. (A,C) Cyclic voltammograms of Aerosil380-1 in EMImBF4 in a potential range of 0–5 V at scan rates of 2, 5, and 10 mV s−1. (B,D) Comparison of forward peak current evolution during cycling at different scan rates. (A,B) Measured in two-electrode-, (C,D) in three-electrode setup.
Although these ordering transitions would be able to make a significant contribution to the increase of the energy density of supercapacitors, the overlap of the potential at which they significantly contribute to the capacitance with the onset potential of electrochemical electrolyte/electrode degradation currently limits the reversibility of this process. The first seven CV cycles in a potential range of 0-5 V have been measured for Aerosil380-4 with EMImBF4 and EMImTFSI as the electrolyte (Figure 8). In the first cycle the CVs are generally of a similar appearance, featuring a constant differential specific capacitance of around 100 F g−1 until ~3.3 V, which is typical for a predominantly mesoporous supercapacitor electrode material operated in such electrolytes. The current and thus differential capacitance then increases drastically to yield a signal with a peak at ~4.4 V. The peak is obviously found in addition to the degradation of the electrolyte. On the reverse scan another peak can be measured at a cell voltage of 1.5–1.0 V with a slightly lower peak current. During the following cycles, decay in peak current can be observed in the forward and backward scans (Figure 8C). Additionally the peak potential of the backward peak is shifted toward lower voltages in the case of EMImBF4. For EMImTFSI both peaks are much smaller in current and exhibit a significantly different behavior during cycling. The forward signal splits into two peaks in the second cycle, where one appears at lower and one at higher potential by ~0.5 V. The same happens to the reverse peak. During the subsequent cycles both signals diminish and are no longer present in the seventh iteration. The same CV profiles are observed for the RTILs independent of the pore diameter and volume of the carbon electrode. The comparable peak current of the respective forward and reverse peaks pleads for an at least partial reversibility of the process, while the unusually large peak separation of several volts further count against a classical redox reaction as the origin of the signal. This reversible character shows that it might indeed be possible to use the contribution of these ordering transitions for energy storage also in real world supercapacitor devices. For the phase transitions to be applicable in practice, their occurrence must be decoupled from the unwanted degradation of the electrolyte. In an attempt to study the processes separately from each other, two- and three-electrode measurements have been carried out at different scan rates with Aerosil380-1 in EMImBF4 as the electrolyte. Due to the most probably different reaction rates of the decomposition and phase transition, the two mechanisms should respond in a distinct fashion. The graphs have again been normalized to the scan rate (Figures 7A,C) and the results are discussed in terms of differential capacitances. With increasing scan rate the peak height of the forward scan diminishes and the potential is slightly shifted toward more positive values. The large reverse peak is again not observed in the three electrode measurement, but the two small ones can be found in all three CVs and appear at more negative potentials. The behavior of the forward peak during cycling is as well remarkable (Figure S7). After the first four cycles at 2 mV s−1 the peak differential capacitance already has significantly diminished. While in the two-electrode measurements the peak potential does not alter much, already at the fifth and sixth cycles the peak is shifted by almost 1 V to lower potentials in the three electrode setup. At 5 mV s−1 already in the second cycle the peak splits in two and at 10 mV s−1 the signals maximum monotonously decreases throughout the experiment. If the peak differential capacitances vs. cycle number are compared it becomes apparent that for higher scan rates the decay is less steep and those measurements finally retain slightly higher peak capacitances (Figures 7B,D). The reverse peak in the two electrode measurements diminishes and remains constant almost irrespective of the scan rate. Therefore, it is finally necessary to find a way to shift the onset potential of the phase transition to lower values by influencing the nucleation process via the RTIL-surface interactions either by porosity or surface chemistry of the electrode material or by adjusting the properties of the ionic liquid itself.
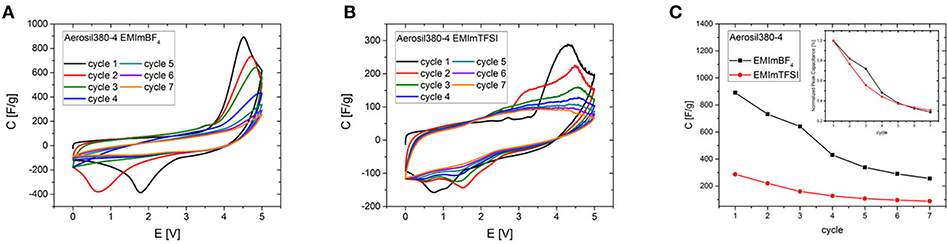
Figure 8. First seven CV cycles of Aerosil380-4 (A) in EMImBF4 and (B) in EMImTFSI (0-5.0 V, ν = 2 mV s−1) and (C) comparison of peak currents during cycling.
The analogy to capillary condensation in gas adsorption can be considered here for illustrative purposes with the adsorption potential here corresponding to the electrochemical potential on the electrode surface (Figure 9). While on a flat surface the newly formed high-potential RTIL phase (provided that the formation of such a phase is favorable outside of a porous environment) would propagate semi-infinitely into the bulk of the electrolyte, in a porous system the electrode surface at a certain distance is opposed by the other side of the pore wall. Therefore, after the new phase nucleates at the electrode surface, the phase transition proceeds from both pore walls into the center of the pore. The newly formed phase meets somewhere in between the walls, which happens at lower potentials in smaller mesopores. By these means the conversion of the regular RTIL phase into the high-potential phase can be achieved faster in smaller mesopores at equal pore volumes. These results thereby imply that making mesopores even larger will probably not result in a better utilization of the discussed structural rearrangement for energy storage, as the potential required to induce the ordering transitions is apparently independent of the pore size. On the basis of the carbon materials used in the present and in prior studies, the optimum is most likely located between ~4 and 10 nm. The reason for the existence of a lower limit of the mesopore size for the phase transition is that a certain amount of RTIL bulk must be accommodated inside of the pore to enable bulk effects.
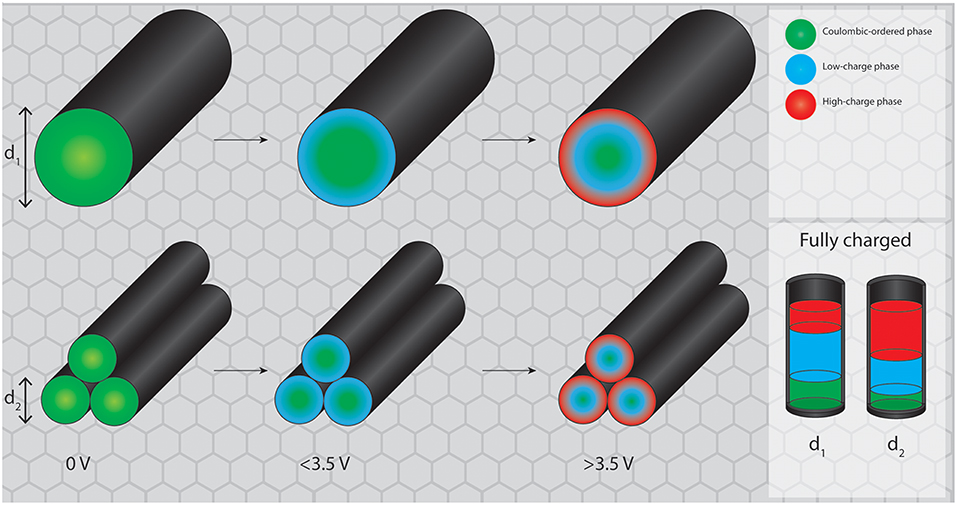
Figure 9. Proposed mechanism for potential induced phase transitions in larger and smaller mesopores. While the total pore volume remains equal for both systems, the fraction of RTIL reorganized into the high charge state is higher in smaller mesopores.
To emphasize the interplay of pore volume and different RTILs, the CV curves in different RTIL electrolytes are compared (Figure 10). The peak obviously scales up with the mesopore volume in all cases and is broader for the same RTIL for the Aerosil-90®-templated carbons which is likely to be a consequence of their broader pore size distribution. This clear correlation between the mesopore volume and the discussed CV peak indicates that the phase transition takes place inside the carbon mesopores. A notable observation can be made in the supercapacitors operated with EMImBF4 electrolyte and Aerosil380-1 and Aerosil-380-2 carbons as the electrode materials (Figure 10B). In these cases a clear local minimum in current is observed between the peak caused by the ordering transitions and the current caused by electrolyte degradation which further proves the presence of two overlapping processes in this potential range. Comparing different RTILs in similar materials, the peak is smaller for BMImBF4 (Figures 10C,D) as compared to EMImBF4 (Figures 10A,B) for both template sizes. Comparing EMImBF4 (Figures 10A,B) and EMImTFSI (Figures 10E,F), the former is showing higher peak currents. As mentioned above, the peak area indicates the number of chemical events or, in other words, the number of RTIL ions participating in the ordering transitions in the limited mesopore volume. It appears thus logical that RTILs with smaller ions lead to higher peak areas and maximum peak currents. Finally, it should also be pointed out that from the data shown here it becomes apparent that the current caused by electrolyte decomposition also scales with mesoporosity and surface area. As expected, high mesoporosity will not only allow for an increase of the number of ordering transitions within the bulk of the electrolyte, but also speeds up electrolyte degradation on the carbon electrode surface. The same trend can be observed, when purified RTIL is employed in a three-electrode cell (Figure S9).
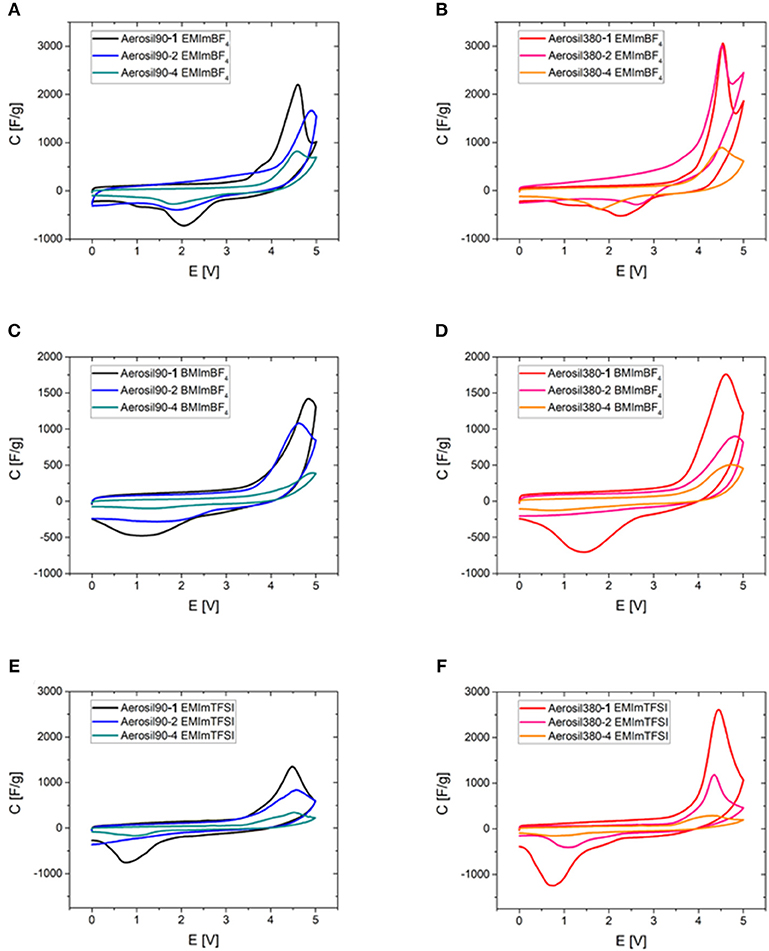
Figure 10. Cyclic voltammograms of Aerosil®-templated carbons of different pore sizes depending on their pore volume in all three investigated ionic liquids (0–5.0 V, ν = 2 mV s−1). (A) Aerosil90-m EMImBF4, (B) Aerosil380-m EMImBF4, (C) Aerosil90-m BMImBF4, (D) Aerosil380-m BMImBF4, (E) Aerosil90-m EMImTFSI, and (F) Aerosil380-m EMImTFSI.
Conclusion
Carbon materials with two prevailing mesopore diameters were synthesized with different mesopore volumes by using silica templates with different primary particle sizes and different ratios between carbon precursor and template. They were used as supercapacitor electrodes to investigate the influence of mesopore structure on the potential-dependent liquid phase transition of RTILs under practically relevant conditions. This phenomenon takes place at the positive electrode of the cell and has obvious similarities with the capillary condensation which is widely known from the field of gas adsorption in mesoporous materials. It is found that the phase-transition peak current is more prominent for carbons with smaller mesopores centered at 8 nm, therefore the rearrangement is concluded to propagate from the pore walls into the bulk electrolyte. A clear correlation to the carbon mesopore volume was found. Higher mesopore volume clearly leads to higher peak areas and currents, indicating that the origin of the peak must indeed be a process inside of the mesopores of the electrode. Because the charge flow is the higher the more ions undergo a phase transition, there is an obvious correlation of peak height and the size of the involved electrolyte ions. These phase transitions are reversible, but as the potential range in which they significantly contribute to capacitance overlaps with the potential range in which electrolyte/electrode system decomposition occurs, decreasing contribution of the phase transition and generally decreased performance of the supercapacitors is observed upon continued cycling. Indications toward the competition between decomposition and the phase transition process have been found and more importantly, the two mechanisms can be separated by application of different scan rates, where the RTIL rearrangement is amplified at higher rates. This property could be beneficial for further applications.
These findings support the presence and contribution of RTIL phase transitions to the energy storage mechanism in supercapacitors and encourage the systematic design of mesopores rather than micropores to enhance the energy density of such devices, by incorporation of new energy storage terms. It is our belief that it is possible to shift the potential needed to utilize this phase change to lower values in order to utilize it more efficiently without electrolyte degradation by controlling the nucleation process of the non-equilibrium phase of the electrolyte by either the properties of RTIL ions or the textural and/or chemical properties of the carbon electrodes.
Author Contributions
KS and RY designed and carried out synthetic experiments, analyzed and discussed data, and wrote the paper. MA, CR, and MO designed experiments, discussed data, and wrote the paper.
Funding
Financial support by the Max Planck Society is gratefully acknowledged. RY acknowledges financial support from China Scholarship Council.
Conflict of Interest Statement
The authors declare that the research was conducted in the absence of any commercial or financial relationships that could be construed as a potential conflict of interest.
Acknowledgments
The authors thankfully acknowledge Antje Völkel for the careful conduction of the thermal analysis and Heike Runge for the assistance during the TEM measurements. The authors would also like to thank Qing Qin for measuring Raman Spectra.
Supplementary Material
The Supplementary Material for this article can be found online at: https://www.frontiersin.org/articles/10.3389/fmats.2019.00065/full#supplementary-material
References
Antonietti, M., Chen, X., Yan, R., and Oschatz, M. (2018). Storing electricity as chemical energy: beyond traditional electrochemistry and double-layer compression. Energy Environ. Sci. 11, 3069–3074. doi: 10.1039/C8EE01723A
Bazant, M. Z., Storey, B. D., and Kornyshev, A. A. (2011). Double layer in ionic liquids: overscreening versus crowding. Phys. Rev. Lett. 106:046102. doi: 10.1103/PhysRevLett.106.046102
Béguin, F., Presser, V., Balducci, A., and Frackowiak, E. (2014). Carbons and electrolytes for advanced supercapacitors. Adv. Mater. 26, 2219–2251. doi: 10.1002/adma.201304137
Borchardt, L., Oschatz, M., and Kaskel, S. (2014). Tailoring porosity in carbon materials for supercapacitor applications. Mater. Horiz. 1, 157–168. doi: 10.1039/C3MH00112A
Brandt, A., Pohlmann, S., Varzi, A., Balducci, A., and Passerini, S. (2013). Ionic liquids in supercapacitors. MRS Bull. 38, 554–559. doi: 10.1557/mrs.2013.151
Choi, N.-S., Chen, Z., Freunberger, S. A., Ji, X., Sun, Y.-K., Amine, K., et al. (2012). Challenges Facing Lithium Batteries and Electrical Double-Layer Capacitors. Angew. Chem. Int. Ed. 51, 9994–10024. doi: 10.1002/anie.201201429
Elbourne, A., Mcdonald, S., Voïchovsky, K., Endres, F., Warr, G. G., and Atkin, R. (2015). Nanostructure of the ionic liquid–graphite stern layer. ACS Nano 9, 7608–7620. doi: 10.1021/acsnano.5b02921
Fedorov, M. V., and Kornyshev, A. A. (2014). Ionic liquids at electrified interfaces. Chem. Rev. 114, 2978–3036. doi: 10.1021/cr400374x
Futamura, R., Iiyama, T., Takasaki, Y., Gogotsi, Y., Biggs, M. J., Salanne, M., et al. (2017). Partial breaking of the Coulombic ordering of ionic liquids confined in carbon nanopores. Nat. Mater. 16, 1225–1232. doi: 10.1038/nmat4974
Gnahm, M., and Kolb, D. M. (2011). The purification of an ionic liquid. J. Electr. Chem. 651, 250–252. doi: 10.1016/j.jelechem.2010.11.019
González, A., Goikolea, E., Barrena, J. A., and Mysyk, R. (2016). Review on supercapacitors: technologies and materials. Renew. Sustain. Energy Rev. 58, 1189–1206. doi: 10.1016/j.rser.2015.12.249
Jun, S., Joo, S. H., Ryoo, R., Kruk, M., Jaroniec, M., Liu, Z., et al. (2000). Synthesis of new, nanoporous carbon with hexagonally ordered mesostructure. J. Am. Chem. Soc. 122, 10712–10713. doi: 10.1021/ja002261e
Kiyohara, K., Sugino, T., and Asaka, K. (2011). Phase transition in porous electrodes. J. Chem. Phys. 134:154710. doi: 10.1063/1.3578468
Kondrat, S., Georgi, N., Fedorov, M. V., and Kornyshev, A. A. (2011). A superionic state in nano-porous double-layer capacitors: insights from Monte Carlo simulations. Phys. Chem. Chem. Phys. 13, 11359–11366. doi: 10.1039/c1cp20798a
Lai, F., Feng, J., Yan, R., Wang, G.-C., Antonietti, M., and Oschatz, M. (2018). Breaking the limits of ionic liquid-based supercapacitors: mesoporous carbon electrodes functionalized with manganese oxide nanosplotches for dense, stable, and wide-temperature energy storage. Adv. Funct. Mater. 28:1801298. doi: 10.1002/adfm.201801298
Largeot, C., Portet, C., Chmiola, J., Taberna, P.-L., Gogotsi, Y., and Simon, P. (2008). Relation between the ion size and pore size for an electric double-layer capacitor. J. Am. Chem. Soc. 130, 2730–2731. doi: 10.1021/ja7106178
Macfarlane, D. R., Tachikawa, N., Forsyth, M., Pringle, J. M., Howlett, P. C., Elliott, G. D., et al. (2014). Energy applications of ionic liquids. Energy Environ. Sci. 7, 232–250. doi: 10.1039/C3EE42099J
Manthiram, A. (2017). An outlook on lithium ion battery technology. ACS Central Sci. 3, 1063–1069. doi: 10.1021/acscentsci.7b00288
Merlet, C., Rotenberg, B., Madden, P. A., Taberna, P.-L., Simon, P., Gogotsi, Y., et al. (2012). On the molecular origin of supercapacitance in nanoporous carbon electrodes. Nat. Mater. 11, 306–310. doi: 10.1038/nmat3260
Oschatz, M., Boukhalfa, S., Nickel, W., Lee, J. T., Klosz, S., Borchardt, L., et al. (2014). Kroll-carbons based on silica and alumina templates as high-rate electrode materials in electrochemical double-layer capacitors. J. Mater. Chem. A 2, 5131–5139. doi: 10.1039/c3ta14815g
Oschatz, M., Pr,é, P., Dörfler, S., Nickel, W., Beaunier, P., Rouzaud, J.-N., et al. (2016). Nanostructure characterization of carbide-derived carbons by morphological analysis of transmission electron microscopy images combined with physisorption and Raman spectroscopy. Carbon N. Y. 105, 314–322. doi: 10.1016/j.carbon.2016.04.041
Osswald, S., Chmiola, J., and Gogotsi, Y. (2012). Structural evolution of carbide-derived carbons upon vacuum annealing. Carbon N. Y. 50, 4880–4886. doi: 10.1016/j.carbon.2012.06.016
Pawlyta, M., Rouzaud, J.-N., and Duber, S. (2015). Raman microspectroscopy characterization of carbon blacks: spectral analysis and structural information. Carbon N. Y. 84, 479–490. doi: 10.1016/j.carbon.2014.12.030
Postnov, V. N., Peretrukhina, Y. V., and Novikov, A. G. (2013). A porous carbon material prepared by template synthesis using Aerosil. Russian J. Appl. Chem. 86, 662–666. doi: 10.1134/S1070427213050091
Rotenberg, B., and Salanne, M. (2015). Structural transitions at ionic liquid interfaces. J. Phys. Chem. Lett. 6, 4978–4985. doi: 10.1021/acs.jpclett.5b01889
Salanne, M. (2017). Ionic liquids for supercapacitor applications. Top. Curr. Chem. 375:63. doi: 10.1007/s41061-017-0150-7
Salanne, M., Rotenberg, B., Naoi, K., Kaneko, K., Taberna, P. L., Grey, C. P., et al. (2016). Efficient storage mechanisms for building better supercapacitors. Nat. Energy 1:16070. doi: 10.1038/nenergy.2016.70
Simon, P., and Gogotsi, Y. (2008). Materials for electrochemical capacitors. Nat. Mater. 7, 845–854. doi: 10.1038/nmat2297
Simon, P., and Gogotsi, Y. (2013). Capacitive energy storage in nanostructured carbon–electrolyte systems. Acc. Chem. Res. 46, 1094–1103. doi: 10.1021/ar200306b
Tazi, S., Salanne, M., Simon, C., Turq, P., Pounds, M., and Madden, P. A. (2010). Potential-induced ordering transition of the adsorbed layer at the ionic liquid/electrified metal interface. J. Phys. Chem. B 114, 8453–8459. doi: 10.1021/jp1030448
Thommes, M., Kaneko, K., Neimark, A. V., Olivier, J. P., Rodriguez-Reinoso, F., Rouquerol, J., et al. (2015). Physisorption of gases, with special reference to the evaluation of surface area and pore size distribution (IUPAC Technical Report). Pure Appl. Chem. 87, 1051–1069. doi: 10.1515/pac-2014-1117
van Aken, K. L., Beidaghi, M., and Gogotsi, Y. (2015). Formulation of ionic-liquid electrolyte to expand the voltage window of supercapacitors. Angew. Chem. Int. Ed. Engl. 54, 4806–4809. doi: 10.1002/anie.201412257
Weingarth, D., Zeiger, M., Jäckel, N., Aslan, M., Feng, G., and Presser, V. (2014). Graphitization as a universal tool to tailor the potential-dependent capacitance of carbon supercapacitors. Adv. Energy Mater. 4:1400316. doi: 10.1002/aenm.201400316
Wen, R., Rahn, B., and Magnussen, O. M. (2015). Potential-dependent adlayer structure and dynamics at the ionic Liquid/Au(111) interface: a Molecular-Scale in situ Video-STM study. Angew. Chem. Int. Ed. 54, 6062–6066. doi: 10.1002/anie.201501715
Yan, R., Antonietti, M., and Oschatz, M. (2018). Toward the experimental understanding of the energy storage mechanism and ion dynamics in ionic liquid based supercapacitors. Adva. Energy Mater. 8:1800026. doi: 10.1002/aenm.201800026
Keywords: supercapacitors, porous carbon, energy storage, ionic liquids, ordering transitions
Citation: Schutjajew K, Yan R, Antonietti M, Roth C and Oschatz M (2019) Effects of Carbon Pore Size on the Contribution of Ionic Liquid Electrolyte Phase Transitions to Energy Storage in Supercapacitors. Front. Mater. 6:65. doi: 10.3389/fmats.2019.00065
Received: 23 January 2019; Accepted: 01 April 2019;
Published: 24 April 2019.
Edited by:
Diego Cazorla-Amoros, University of Alicante, SpainReviewed by:
Emilia Morallon, University of Alicante, SpainMarta Sevilla, Instituto Nacional del Carbón (INCAR), Spain
Copyright © 2019 Schutjajew, Yan, Antonietti, Roth and Oschatz. This is an open-access article distributed under the terms of the Creative Commons Attribution License (CC BY). The use, distribution or reproduction in other forums is permitted, provided the original author(s) and the copyright owner(s) are credited and that the original publication in this journal is cited, in accordance with accepted academic practice. No use, distribution or reproduction is permitted which does not comply with these terms.
*Correspondence: Martin Oschatz, martin.oschatz@mpikg.mpg.de