 Gabriela Pinget1,2,3†
 Jian Tan1,2,3,4†
 Bartlomiej Janac1,2
 Nadeem O. Kaakoush5
 Alexandra Sophie Angelatos1,2
 John O'Sullivan6Yen Chin Koay6
 Frederic Sierro4Joel Davis4Shiva Kamini Divakarla3,7Dipesh Khanal3,7
 Robert J. Moore8
 Dragana Stanley9
 Wojciech Chrzanowski3,7*†
 Laurence Macia1,2,3*†
- 1The Charles Perkins Centre, The University of Sydney, Sydney, NSW, Australia
- 2Faculty of Medicine and Health, School of Medical Sciences, The University of Sydney, Sydney, NSW, Australia
- 3Sydney Nano Institute, The University of Sydney, Sydney, NSW, Australia
- 4Human Health, Nuclear Science & Technology and Landmark Infrastructure (NSTLI), Australian Nuclear Science and Technology Organisation, Sydney, NSW, Australia
- 5School of Medical Sciences, University of New South Wales, Sydney, NSW, Australia
- 6Department of Cardiology, Charles Perkins Centre, Royal Prince Alfred Hospital, Heart Research Institute, University of Sydney, Sydney, NSW, Australia
- 7Sydney Pharmacy School, The University of Sydney, Sydney, NSW, Australia
- 8School of Science, RMIT University, Bundoora, VIC, Australia
- 9School of Health, Medical and Applied Sciences, Central Queensland University, Rockhampton, QLD, Australia
The interaction between gut microbiota and host plays a central role in health. Dysbiosis, detrimental changes in gut microbiota and inflammation have been reported in non-communicable diseases. While diet has a profound impact on gut microbiota composition and function, the role of food additives such as titanium dioxide (TiO2), prevalent in processed food, is less established. In this project, we investigated the impact of food grade TiO2 on gut microbiota of mice when orally administered via drinking water. While TiO2 had minimal impact on the composition of the microbiota in the small intestine and colon, we found that TiO2 treatment could alter the release of bacterial metabolites in vivo and affect the spatial distribution of commensal bacteria in vitro by promoting biofilm formation. We also found reduced expression of the colonic mucin 2 gene, a key component of the intestinal mucus layer, and increased expression of the beta defensin gene, indicating that TiO2 significantly impacts gut homeostasis. These changes were associated with colonic inflammation, as shown by decreased crypt length, infiltration of CD8+ T cells, increased macrophages as well as increased expression of inflammatory cytokines. These findings collectively show that TiO2 is not inert, but rather impairs gut homeostasis which may in turn prime the host for disease development.
Introduction
Bacterial species that inhabit the colon interact with the host, promoting the development and function of immune cells locally and systemically. These interactions are mediated by bacterially derived metabolites such as short-chain fatty acids (SCFAs), which have been identified as critical inducers of immune subsets (1–3) key for protecting mice from disease development (2–5), emphasizing the role of the microbiota in gut homeostasis and host health.
The colonic epithelium acts as a physical barrier between the host and the gut microbiota. The secretion of mucus by goblet cells provides a barrier to microbial infiltration. Further, Paneth cells release antimicrobial peptides that protect against pathogen invasion as well as regulate gut microbiota composition (6). Expression of tight junction proteins by enterocytes also limits bacterial penetration. Epithelial function can be regulated by the gut microbiota via SCFAs, by stimulating mucus production (7) and tight junction assembly (8). In contrast, dysbiosis, marked by detrimental changes in gut microbiota composition, triggers increased gut permeability and gut inflammation (9). Alterations in antimicrobial peptide production, mucus layer thickness and/or epithelial permeability have been implicated in the development of a broad range of diseases such as colitis and colorectal cancer (10). These diseases have also been linked to abnormal interactions between the host epithelium and the gut microbiota through the formation of biofilm. Biofilms consist of aggregates of adherent and planktonic bacteria protected by an extracellular matrix and have been observed in the proximal colon of patients diagnosed with such diseases (11). The mechanisms behind the formation and the role of biofilm in the gut are not fully understood, but biofilm formation has been shown to impact both disease development and resolution. Both in a colitis rat model and in humans, biofilm in the colon has been shown to facilitate pathobiont adherence to the epithelium and translocation to the host (12, 13). In human inflammatory bowel disease, biofilm formation at the site of epithelial wound healing has been shown to negatively affect healing by impairing epithelialization and tissue repair (14). Finally, a recent study has shown that inoculation of germ-free mice with biofilm positive human colon inocula was carcinogenic (15).
The identification of environmental factors that can affect gut homeostasis is thus a critical first step in preventing the development of so-called “western lifestyle diseases,” encompassing autoimmune, allergic and metabolic diseases. A broad range of environmental factors can affect gut homeostasis, with diet composition being the major driver (16). Western-like diets enriched in fat and simple carbohydrates and deficient in dietary fiber have been shown to trigger dysbiosis, increases gut permeability and inflammation (16). While the impact of these macronutrients on gut homeostasis has been extensively studied (17), the role of food additives prevalent in processed food remains poorly defined. Food additives are used to improve the texture, preservation and aesthetics of food. Food grade titanium dioxide (TiO2) or E171, is a whitening agent present in over 900 commonly consumed food products. The average adult consumes between 0.7 and 5.9 mg of TiO2 per kg of body weight (BW) per day throughout their life and children are the most exposed, consuming up to 32.4 mg TiO2/kg BW/day in maximally exposed individuals (18). Despite the fact that regulatory bodies do not define strict guidelines around its consumption, new evidence from animal studies has emerged, highlighting that TiO2 may potentiate cancer development (19) and exacerbate inflammatory bowel disease (20).
The effect of TiO2 on gut homeostasis is poorly understood yet evidence suggests that TiO2 interacts with gut epithelial cells. In vivo and in vitro studies have demonstrated the accumulation of TiO2 in the mucus layer (21) and its uptake by colonic epithelial cells (22, 23). A study in rats has shown that TiO2 affects immune cells in the Peyer's patches associated with a decreased regulatory T cell proportion (19). However, the impact of TiO2 on colonic immune cells, the site where microbiota is the densest, has never been investigated. While the impact of TiO2 on the colonic microbiota has been previously investigated in a short term study (2.5 mg TiO2/kg BW/day for 1 week) (24) and using a high dose (100 mg TiO2/kg BW/day) for up to 4 weeks (25), the impact of TiO2 on the small intestine microbiota is unknown.
The aim of the present study is to establish the effects of food grade TiO2 on gut homeostasis in vivo. We investigated the impact of physiological doses (2 and 10 mg TiO2/kg BW/day) and a high dose of TiO2 (50 mg TiO2/kg BW/day) on mouse colonic and small intestine microbiota composition and function, epithelial function and mucosal inflammation after 3–4 weeks of treatment via drinking water.
Materials and Methods
E171 Characterization
Size and Morphology
Food grade TiO2 was purchased from All Color Supplies PTY. Average hydrodynamic diameter, polydispersity index and zeta potential of the TiO2 nanoparticles dispersed in drinking water were determined with a Malvern Zetasizer Nano ZS at 25°C. The dispersion was measured 3 times for both size and zeta potential. The size distribution and shape of the TiO2 nanoparticles dispersed in mice drinking water were determined using a NanoSight NS300 (equipped with a sCMOS camera) at 25°C. The dispersion was measured 5 times (1 min per measurement). The size distribution and shape of the TiO2 nanoparticles dispersed in drinking water were further investigated using a Zeiss Ultra Plus scanning electron microscope operated at an accelerating voltage of 10 kV. A drop of the nanoparticle dispersion was allowed to dry on a stub, after which ~20 Å of platinum metal was sputter coated onto the stub under vacuum to prevent charging.
Crystal Structure and Elemental Composition
A D8 Advance Bruker diffractometer was used to conduct the X-ray powder diffraction (XRD) analysis in a flat plate geometry using Ni-filtered Cu Kα radiation and a Bruker Lynx eye detector. The XRD patterns were acquired from 10 to 100° 2θ with a step size of 0.02° and a count time of 0.1 s. Elemental composition was determined using X-ray photoelectron spectroscopy (XPS) with an Al Kα monochromator X-ray source. A survey scan was acquired at 100 eV pass energy between 0 and 1,400 eV. High resolution spectra for individual elements were collected at 100 Ca + 0.05 Ga. Elemental composition was calculated from the high-resolution spectra using CasaXPS with measurements done in triplicate.
Mice and TiO2 Dosage Information
Five to six week-old male C57BL/6JAusb mice from Australian Bio Resources were maintained under specific-pathogen-free conditions. All experimental procedures involving animals were approved by the University of Sydney Animal Ethics Committee under protocol number 2014/696. Mice were cohoused with water and food (AIN93G; Specialty Feeds) access ad libitum. Titanium dioxide (E171) was added to water and sonicated daily. TiO2 was administered in drinking water at doses of 0, 2, 10, and 50 mg TiO2/kg BW/day, which was calculated based on the water intake measured per cage. At week 4, mice were euthanized using CO2 asphyxiation.
Colonic Immune Cell Isolation and Flow Cytometry
Pieces of colon were incubated at 37°C for 40 min in Hank's Balanced Salt Solution (HBSS; Gibco) with 5 mM EDTA, 5% FBS (Gibco) and 15 mM HEPES (Gibco). Intraepithelial lymphocytes were discarded and the remaining tissue was incubated at 37°C for 1 h in HBSS (Gibco) with 6.7 mg/ml collagenase type IV (Gibco), 10% FBS (Gibco) and 15 mM HEPES (Gibco). Cells were passed through a 70 μm mesh and lymphocytes enriched via percoll gradient of 80% and 40% (GE Life Sciences). The list of antibodies used for flow cytometry is in the Supplementary Methods. Viability was determined using the LIVE/DEAD Fixable Blue Dead Cell stain kit (Invitrogen). Flow cytometry was performed on a LSRII flow cytometer (BD Biosciences) and data analysis with FlowJo software (Treestar Inc., Ashland, OR, USA).
RNA Extraction and Quantitative Real-Time PCR
Total tissue RNA was extracted using TRI Reagent (Sigma) and converted into cDNA using iScript RT Supermix (BioRad) according to both manufacturer's instructions. qPCR was performed on a LightCycler 480 (Roche) using SYBR Green (Biorad) with primer sequences listed in Supplementary Table 1.
Acetate and Trimethylamine (TMA) Quantification
Quantitative measurements of acetate and TMA in plasma were determined by nuclear magnetic resonance spectroscopy (NMR). Briefly, plasma was filtered through a 3 kDa membrane filter (Merck Millipore) and polar metabolites extracted from the aqueous phase of a water:chloroform:methanol mixture. Samples, containing 4,4-dimethyl-4-silapentane-1-sulfonic acid as an internal standard, were analyzed on a Bruker 600 MHz NMR.
Plasma Metabolomic Screening
A hydrophilic interaction chromatography LC-MS/MS method was used for choline detection in plasma as described previously (26). The LC was connected to an AB Sciex Triple Quad 5,500 mass spectrometer run in positive ion mode. Data analysis was done on software Multi-Quant 3.0 for MRM Q1/Q3 peak integration.
Nanolive Imaging
Escherichia coli K-12 MG1655 (E. coli) or Enterococcus faecalis NCTC 775 (E. faecalis) were incubated for 7 h at 37°C, 5% CO2 with Luria-Bertani (LB) broth containing E171 at indicated concentrations and then fixed in 3% formalin overnight. Cells were resuspended in PBS and visualized using a Nanolive 3D cell explorer. False colors were applied to images based on refractive index using STEVE software.
Biofilm Visualization
Biofilm Formation Assay in vitro on Cultured E. coli and E. faecalis
The in vitro biofilm formation assay was based on a previously published protocol (13). Overnight culture in quadruplicates of E. coli (low salt LB broth; Beckton Dickinson), E. faecalis (tryptone soya broth supplemented with 0.25% glucose; Sigma Aldrich) or Staphylococcus epidermidis NCTC 6512 (LB broth) was adjusted to OD of 0.5 at 600 nm and 100 μl of each bacterial culture was plated on separate round bottom 96-well tissue culture plates. A further 100 μl of appropriate media supplemented with TiO2 was added to achieve the indicated final concentrations. TiO2 at the different final concentrations in media alone was used as background controls. Plates were incubated at 37°C aerobically on a shaker (Ratek, 70 rpm) for either 24, 48, or 72 h.
Biofilm Formation Assay From Colonic Commensal Bacteria
Two hundred microliters of colon homogenates were cultured in quadruplicates in flat bottom 96-well-plates containing supplemented tryptic soy broth [sTSY: 30 g/L tryptic soy broth (Oxoid) with 5 g/L yeast extract, 5% L-cysteine, 50 mg/L hemin and 1 mg/L medanione (all from Sigma-Aldrich) to yield 0.05 mg/μl (w/v)] for 24 h, aerobically at 37°C at 70 rpm. Samples were diluted 1:100 in fresh sTSY containing TiO2 at indicated doses and incubated for 5 days. After planktonic cell removal, biofilm was stained with crystal violet (CV). Briefly, plates were washed 3 times with water, air dried and stained with 1% CV (Sigma-Aldrich) for 30 min. After 4 washes in water and air drying, 95% ethanol was added for 15 min. Absorbance was recorded at 595 nm on a microplate reader (Tecan Infinite M1000).
Resazurin Viability Assay
Biofilm formation was also quantified based on Resazurin viability assay as previously described (27). Briefly, culture media was removed and wells washed once with phosphate-buffered saline (PBS). Then, media with 10% Resazurin (Sigma-Aldrich) was added to each well. The plates were incubated in the dark at 37°C and fluorescence intensity measured every 15 min (excitation 570 nm, emission 585 nm). TiO2 only controls were used to subtract background.
Bacteria 16S rRNA Gene Amplicon Sequencing and Bioinformatics
DNA from fecal samples or entire contents of small intestine lumen were extracted by mechanical disruption using a Fastprep (MP Biomedicals) using autoclaved glass beads (G8772 and G1145; Sigma-Aldrich) in lysis buffer [500 mM NaCl, 50 mM Tris-HCl (pH 8), 50 mM EDTA, 4% SDS] followed by 15 min incubation at 95°C. DNA was precipitated in 10M ammonium acetate and isopropanol and washed with 80% ethanol. Protein and RNA were removed using the QIAamp DNA stool Minikit (Qiagen) following the manufacturer's instructions. DNA samples were amplified across the V3-V4 region (Q5 polymerase; New England Biolabs) with these primers F: 5′-ACTCCTACGGGAGGCAGCAG-3′; R: 5′-GGACTACHVGGGTWTCTAAT-3′ and sequenced on an Illumina Miseq (2 × 300 bp). Data analysis was performed using QIIME 1.9.1 (28) using default parameters as described previously (29). Briefly, demultiplexed paired end data were quality filtered and paired using the Fastq-join algorithm with no errors allowed. Operational taxonomic units (OTUs) were picked using 97% similarity with UCLUST, and taxonomy was assigned with Greengenes database. The resulting OTU table was filtered by removing OTUs with <0.01% sequences and those relating to Cyanobacteria or Chloroplast. Further analysis was performed with R software (3.4.2). For statistical analysis, abundance data was transformed using the Hellinger method. Differences between treatment groups were determined by adonis (vegan 2.5-2) with 9999 permutations, alpha 0.05 and with the phyloseq package 1.25.2 (30) and Calypso 8.78 (31).
Statistics
Mann–Whitney U-test was used for analysis of the differences between the mean of groups and Wilcoxon paired test for paired samples. For microbiota data, significant differences in the relative abundance of genus between treatment groups were determined by one-way ANOVA with post-hoc Tukey's test. Differences in overall microbial community between treatment groups were determined by adonis. p < 0.05 were considered statistically significant.
Results
Characterization of Food Grade TiO2 (E171)
We employed dynamic light scattering (DLS) to determine the hydrodynamic size of the E171 product used in this study. DLS revealed that the TiO2 nanoparticles dispersed in drinking water (5 mg/ml, pH 7.8) have an average hydrodynamic diameter of 367 nm, a polydispersity index of 0.258 and a zeta potential of −23.0 mV (±4.5 mV). We also employed nanoparticle tracking analysis (NTA) and scanning electron microscopy (SEM) to further investigate the size and shape of the TiO2 nanoparticles dispersed in drinking water. NTA (Supplementary Figure 1A) showed that the TiO2 nanoparticles are roughly spherical in shape and range in diameter from 28 to 1,158 nm. On a number basis, the particle size distribution has a mean of 202 nm and a mode of 138 nm and, on a weight basis, the particle size distribution has a mean of 363 nm and a mode of 428 nm. The average particle diameter determined by NTA on a weight basis (363 nm) is in good agreement with that determined by DLS (367 nm). SEM (Supplementary Figure 1B) confirmed that the TiO2 nanoparticles are roughly spherical in shape and revealed that they can be classified into essentially four groups (based on diameter)−300, 150–200, 100, and 30–50 nm—which is consistent with the particle size distribution (on a number basis) obtained by NTA. TiO2 was predominantly in anatase form as per manufacturer's description. This was verified using X-ray powder diffraction (data not shown).
Impact of Oral Administration of Food Grade TiO2 on Gut Microbiota Composition
We first determined whether exposure to TiO2 over a range of physiologically relevant doses impacted gut bacterial communities in vivo. To achieve this, mice were administered TiO2 via drinking water at doses of either 0, 2, 10, or 50 mg TiO2/kg BW/day for 3 weeks. Sequencing of the 16S rRNA gene from fecal samples revealed that TiO2 had limited effects on bacterial diversity as determined by Inverse Simpson and Shannon analyses (Figures 1A,B) nor bacterial richness (Figure 1C), evenness (Figure 1D) or Faith's diversity (Supplementary Figure 2A) at these doses. However, there was still a trend toward decrease in mice treated with physiological doses of TiO2 (2 and 10 mg TiO2/kg BW/day). On the other hand, both weighted (Supplementary Figure 2B) and unweighted UniFrac (Supplementary Figure 2C) principal coordinate analysis (PCoA) showed some clustering of bacterial composition in control vs. TiO2 treated mice. To test this further, we performed canonical correspondence analysis (CCA) constrained to the 4 distinct TiO2 concentrations used, which revealed significant clustering in bacterial composition driven by 2 mg TiO2/kg BW/day (p = 0.0011) and 50 mg TiO2/kg BW/day (p = 0.0123) TiO2 treatment (Figure 1E). We also performed CCA with TiO2 as a continuous variable, which reveals a dose dependent effect of TiO2 on microbiota composition (Supplementary Figure 2D). Treatment with TiO2 significantly affected gut microbiota composition independently of the cage effect (with overall treatment effect: F-value = 8.2407, R2 = 0.31644, Df = 3, p < 0.001 and impact of treatment corrected for the cage effect: F-value = 5.8511, R2 = 0.2996, Df = 3, p < 0.001 both by adonis). We then determined the impact of TiO2 at deeper levels and found significant changes at the genus level. Parabacteroides were significantly elevated in TiO2 treated mice, at a dose of 50 mg TiO2/kg BW/day (Figure 1F) while Lactobacillus and Allobaculum were significantly elevated at all doses tested (Figures 1G,H). On the other hand, Adlercreutzia (Figure 1I) and Unclassified Clostridiaceae (Figure 1J) were significantly decreased in the groups treated with TiO2 at the doses of 10 and 50 mg TiO2/kg BW/dayrelative to the untreated group. These results suggest that TiO2 had a minor impact on microbiota composition in vivo, while affecting few taxa at the genus level. The gut microbiota composition in the small intestine was also analyzed to determine whether TiO2 might have a greater effect here than in the colon. Bacterial diversity indices (Richness, evenness, Shannon, Inverse Simpson and Faith's diversity) were not significantly affected at doses of 10 and 50 mg TiO2/kg BW/day (Supplementary Figure 2E), although these trended toward decrease with increasing dose of TiO2. Unlike in the colon, TiO2 did not significantly alter the small intestine bacterial composition (p > 0.05 by adonis) and weighted and unweighted UniFrac PCoA analysis revealed no obvious clustering (Supplementary Figures 2F,G). Overall, TiO2 did not appear to dramatically impact on small intestinal microbiota composition. We also performed co-occurrence analysis by examining microbial interactions from mice treated with either 0, 2, 10, or 50 mg TiO2/kg BW/day. We found that certain genera are consistently associated with each other regardless of TiO2 treatment (Ruminococcus, Desulfovibrio, and Oscillospira are positively connected). Increasing TiO2 intake, especially at the dose of 10 and 50 mg/kg BW/day resulted in more significant connections within the network, as well as increased number of genera with significant contributions. For example, while Akkermansia was not significantly involved in the microbial network of mice administered 0, 2, or 10 mg TiO2/kg BW/day, it is involved at a dose of 50 mg/kg involving numerous co-exclusion relationships. These co-occurrence graphs are presented in Supplementary Figures 2H–K. These results were verified using the deblur pipeline (32) which resolves amplicon sequences much more accurately (Supplementary Figures 3A–F).
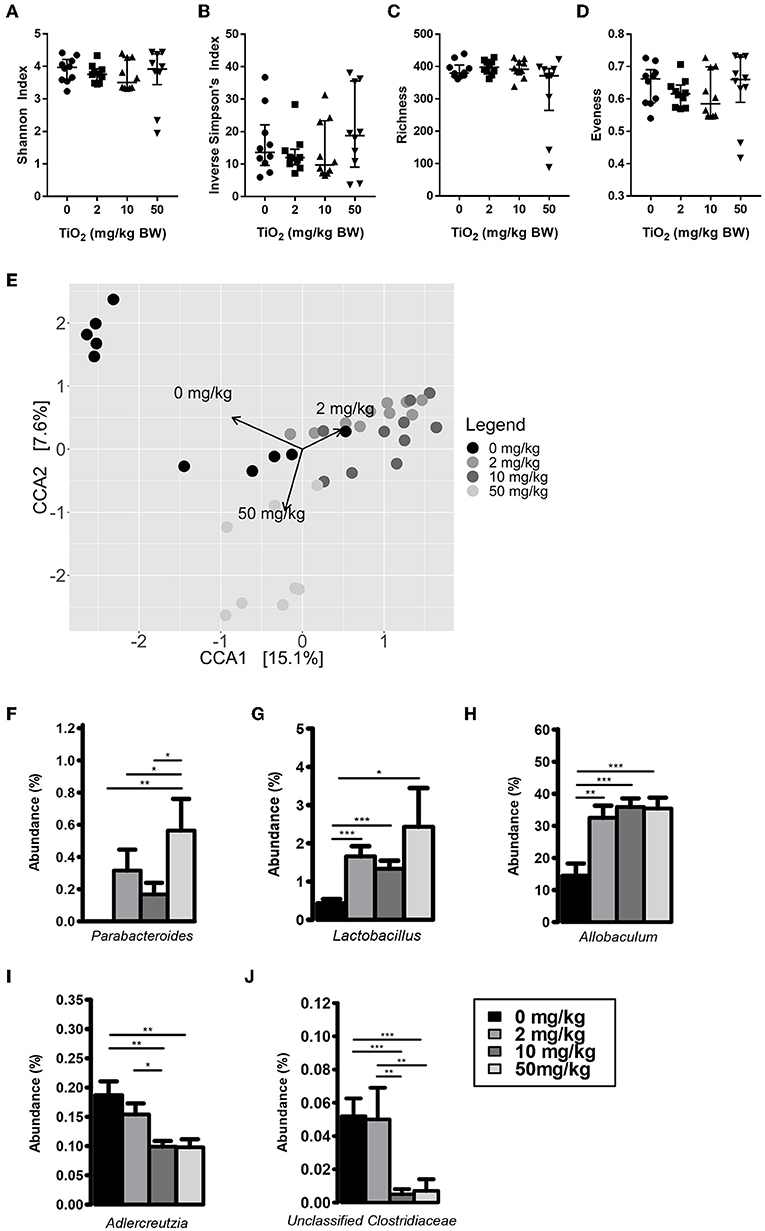
Figure 1. Impact of TiO2 on colonic microbiota composition. (A–D) Diversity of colonic microbiota composition of mice administered 0, 2, 10, or 50 mg TiO2/kg BW/day in drinking water was determined by (A) Shannon index, (B) Inverse Simpson's index, (C) richness, and (D) evenness (n = 10 mice per group from 2 cages of 5 mice). (E) Canonical correspondence analysis ordination of Bray-Curtis dissimilarity of colonic microbiota compositions of mice administered 0, 2, 10, or 50 mg TiO2/kg BW/day in drinking water. Ordination was constrained by dose of TiO2 and the arrows represent the doses of TiO2 driving the differences in microbiota composition observed. Composition differences between groups were significant as determined by adonis (p = 0.0012 for 0 vs. 2 mg TiO2/kg BW/day, p = 0.0006 for 0 vs. 10 mg TiO2/kg BW/day and p = 0.0105 for 0 vs. 50 mg TiO2/kg BW/day) (n = 10 mice per group from 2 cages of 5 mice). (F–J) Relative abundance of (F) Parabacteroides (G) Lactobacillus, (H) Allobaculum, (I) Adlercreutzia, and (J) Unclassified Clostridiaceae observed in colonic microbiota of mice administered 0, 2, 10, or 50 mg TiO2/kg BW/day in drinking water. *p < 0.05, **p < 0.01, ***p < 0.005 as determined by one-way ANOVA with post-hoc Tukey's test on Hellinger-transformed data (n = 10 mice per group from 2 cages of 5 mice).
Food Grade TiO2 Modulates Commensal Bacterial Activity
We and others have shown that gut bacterial metabolites such as SCFAs can have a dramatic impact on host immune function and disease development (1–5, 33, 34). Mice treated with 50 mg TiO2/kg BW/day had a significant decrease in the SCFA, acetate, in the plasma, suggesting a possible impact of TiO2 on host-bacterial interaction (Figure 2A). Such effects on bacterial metabolites were not limited to SCFAs as TMA, a bacterial product associated with development of atherosclerosis (35), was increased at doses of 10 and 50 mg TiO2/kg BW/day (Figure 2B). TMA is a product of conversion of choline, which was also found to be decreased at 50 mg TiO2/kg BW/day (Figure 2C), suggesting that increased TMA was not due to a change in the substrate availability but potentially changes in bacterial activity.
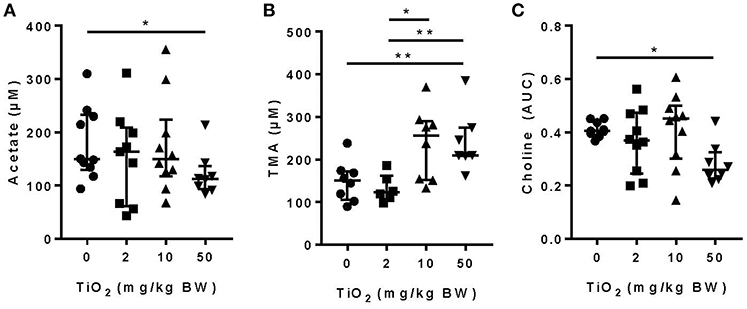
Figure 2. Impact of TiO2 treatment on gut bacterial metabolites. (A,B) Concentrations of (A) the SCFA acetate and (B) TMA were determined NMR on the serum of mice administered 0, 2, 10, or 50 mg TiO2/kg BW/day in drinking water. Data is represented as median ± interquartile range (IQR). *p < 0.05 as determined by Mann–Whitney U-test (n = 10 mice per group). (C) Concentration of choline was determined by liquid-chromatography mass spectrometry in plasma of fasted mice treated with 0, 2, 10, or 50 mg TiO2/kg BW/day in drinking water. Concentration is represented as area under curve (AUC). Data are represented as median ± IQR. *p < 0.05 as determined by Mann–Whitney U-test (n = 10 mice per group). **p < 0.01.
Food Grade TiO2 Promotes the Cluster of Commensal Bacteria and Biofilm Formation
Bacteria also communicate with the host via direct interactions. Studies have shown that attachment of biofilm on the colonic epithelium was correlated with colorectal cancer, a disease in which TiO2 has aggravating effects (36). To explore the possibility that TiO2 might promote biofilm formation, we incubated two types of commensal bacteria, E. coli and E. faecalis, in the presence of TiO2. Nanolive imaging revealed the clustering effect of TiO2 on both E. coli (Figure 3A) and E. faecalis (Figure 3B) in vitro in a dose dependent manner. To determine whether the cluster of bacteria was due to biofilm formation, we performed in vitro culture of either E. faecalis or E. coli in the presence of 2, 10, or 50 μg/ml of TiO2 for 24 or 72 h, respectively. Using the resazurin viability assay (Figure 3C), we found that TiO2 treatment significantly increased biofilm formation in both subsets of bacteria (Figures 3D,E) but not in Staphylococcus epidermidis, a strain known for its inability to form biofilm (Supplementary Figure 4). We confirmed by confocal microscopy that TiO2 treatment increased biofilm formation in both E. coli and E. faecalis (Supplementary Figure 5). To determine whether such effects were applicable to bacteria in the complex environment of the gut microbiota, we incubated commensal bacteria derived from mouse colons anaerobically for 5 days with doses of 2, 10, and 50 μg/ml of TiO2. Both the doses of 10 and 50 μg/ml TiO2 significantly promoted biofilm formation by commensal bacteria (Figure 3F). These data highlight that TiO2 can affect the spatial organization of the gut microbiota and thus its potential interaction with the host.
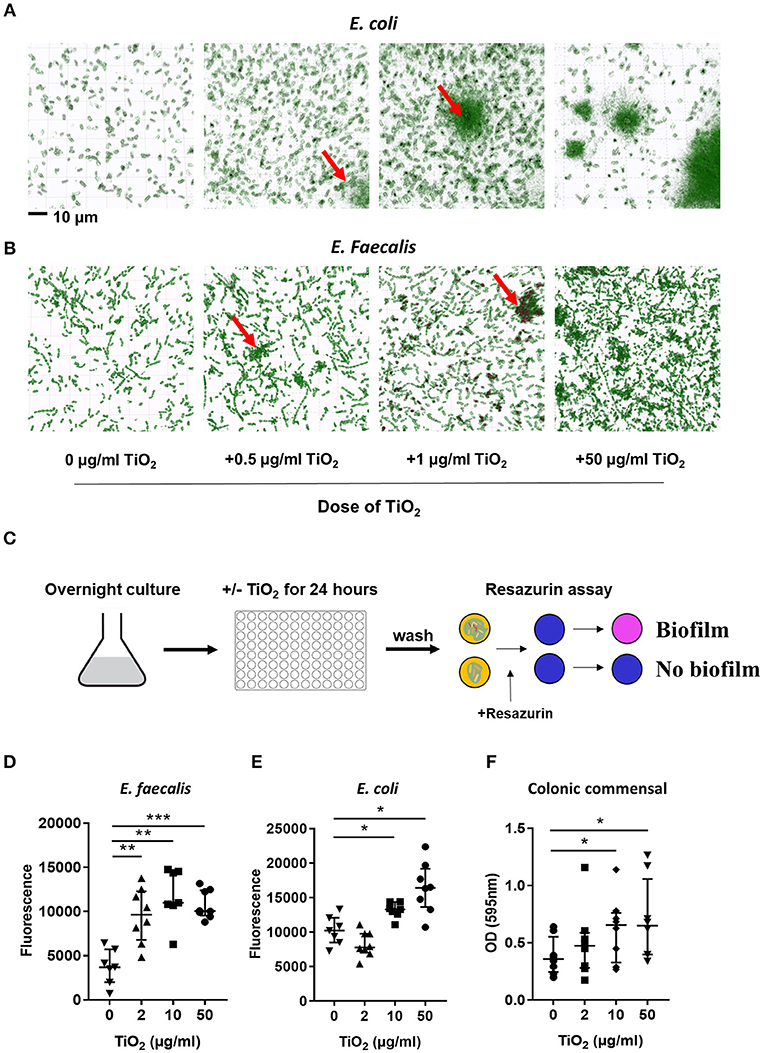
Figure 3. TiO2 triggers biofilm formation by commensal bacteria. (A,B) The clustering effect of TiO2 on (A) E. coli and (B) E. faecalis in vitro was visualized by Nanolive imaging in the presence of 0, 0.5, 1, or 50 μg/ml TiO2 after 24 h incubation. False-coloring was applied to images based on refractive index, where black represents the refractive index of TiO2 and green represents bacteria. (C) Schematic representation of biofilm formation assay and resazurin viability assay to assess biofilm formation in vitro. (D,E) The ability of E. faecalis and E. coli to form biofilm in vitro in the presence of 0, 2, 10, or 50 μg/ml TiO2 in culture (24 and 72 h, respectively) was assessed by the resazurin viability assay (n = 8 replicates). (F) Colonic bacteria were isolated and biofilm formation assessed in the presence of 0, 2, 10, or 50 μg/ml TiO2 in culture after 5 days (n = 6 mice per group). Data are represented as median ± IQR. *p < 0.05, **p < 0.01; ***p < 0.001 as determined by Wilcoxon paired test compared to non-treated group.
TiO2 Affects Colonic Epithelial Function
While the impact of biofilm formation on the host is unclear, impaired mucus production has been correlated with the presence of bacterial biofilms (11). To determine whether TiO2 might impact the mucus layer, we examined colonic Muc2 gene expression in the colon. We found that both 10 and 50 mg TiO2/kg BW/day decreased Muc2 expression, suggesting a detrimental impact of TiO2 on the mucus layer (Figure 4A). While biofilm formation has been reported in colitis and colorectal cancer (36), these diseases have also been linked to increased gut permeability (37). To test whether TiO2 affects gut permeability, we studied the expression of Tjp1 (encoding for zonula occludens 1), which was unchanged by TiO2 treatment (Figure 4B), suggesting no impact of TiO2 on gut permeability. The other major mechanism of bacterial exclusion is through the release of antimicrobial peptides. Beta defensin is expressed predominantly in the colon and we found that Defb3 (encoding for beta-defensin-3) was elevated by treatment at doses of both 10 and 50 mg TiO2/kg BW/day (Figure 4C). Expressions of other antimicrobial peptides such as granzyme B (Figure 4D), cathelin-related antimicrobial peptide (CRAMP), regenerating islet-derived protein 3 gamma (REG3 gamma) and p-lysozyme (PLYz) (Supplementary Figure 6) were unchanged. Therefore, TiO2 treatment impairs the expression of key colonic epithelial factors involved in gut homeostasis.
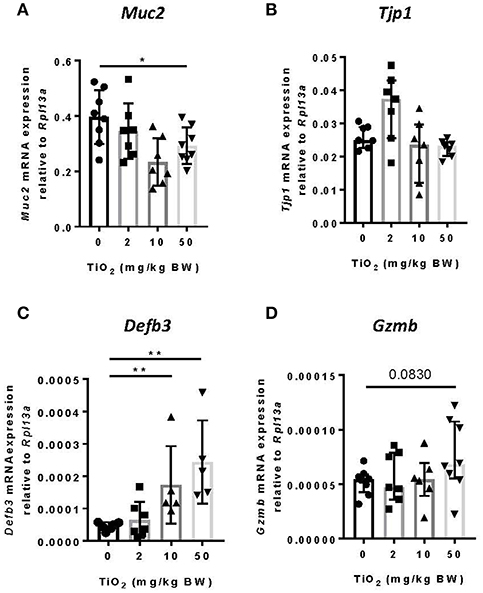
Figure 4. TiO2 impairs colonic epithelial function. (A–D) The impact of TiO2 on colonic epithelial function was determined by comparison of gene expression of key markers (A) Muc2, (B) Tjp1, (C) Defb3, and (D) Gzmb in colonic tissue of mice administered 0, 2, 10, or 50 mg TiO2/kg BW/day in drinking water (n = 5–8 mice per group). Data are represented as median ± IQR. *p < 0.05, **p < 0.01 as determined by Mann–Whitney U-test.
TiO2 Contributes to Increased Colonic Macrophages and Associated Cytokines
Decreased Muc2 has been correlated with inflammation and MUC2 deficiency leads to spontaneous colitis (38). To test whether TiO2 might affect innate immune cells in the colon, we studied myeloid immune cell populations by flow cytometry. While neutrophils (CD45+Ly6g+CD11b+) (Figure 5A) and dendritic cells (CD45+I-ab+Ly6g−F4/80−CD11c+) were unchanged (Figure 5B), macrophages (CD45+F4/80+CD8−Ly6g−I-ab+CD11b+ CD103−) were significantly increased by TiO2 at 10 and 50 mg TiO2/kg BW/day (Figure 5C). This change was not due to an increased recruitment of total monocytes (CD45+CD8−Ly6G−Ly6C+CD11b+I-ab−) (Figure 5D), suggesting a potential in situ proliferation of macrophages (gating strategies shown in Supplementary Figure 7). Colonic macrophages are a major source of IL-6, TNF-alpha and IL-10, cytokines, which were also upregulated in the colon of TiO2 treated mice (Figures 5E–G). We also observed a significant reduction in colonic crypt length by histological analysis of mice treated with 50 mg TiO2/kg BW/day (Figure 5H) while colon length was unchanged (data not shown). Thus, TiO2 treatment triggers changes in the colonic myeloid compartment as well as structural changes in the colon.
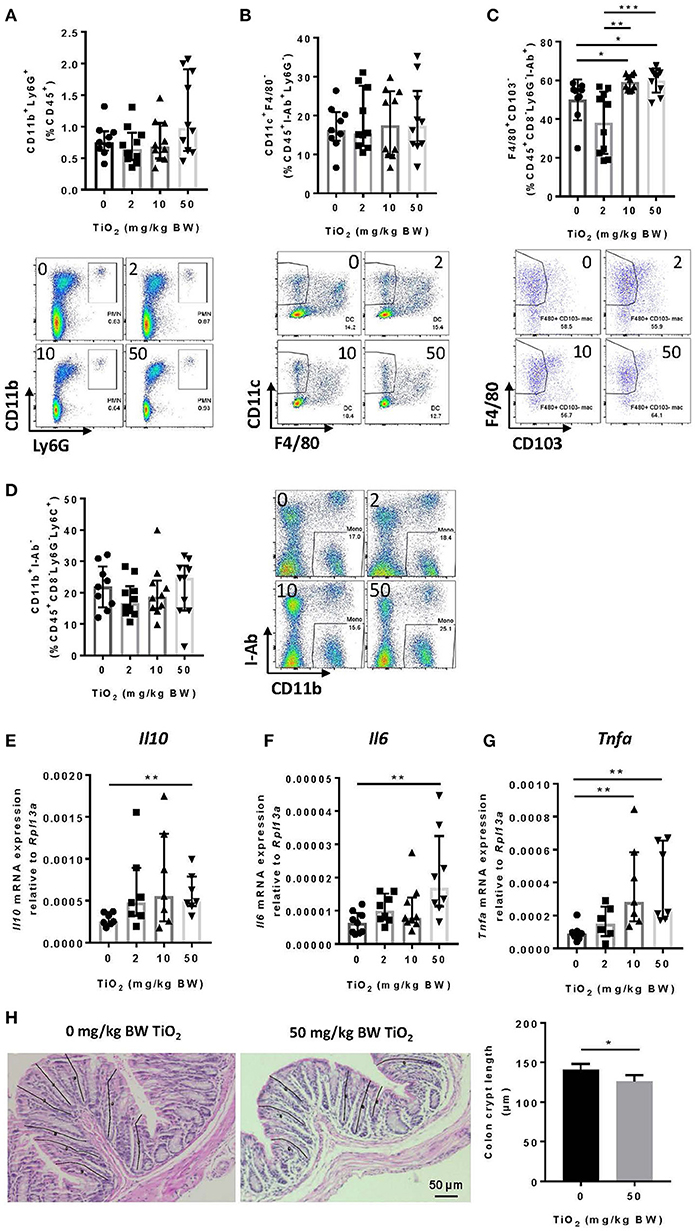
Figure 5. TiO2 promotes colonic inflammation. (A–D) Proportion of the colonic immune subsets (A) neutrophils (B) dendritic cells, (C) macrophages, and (D) monocytes in mice administered 0, 2, 10, or 50 mg TiO2/kg BW/day in drinking water, were determined by flow cytometric analysis (n = 8–10 mice per group). (E–G) Expression of genes encoding for (E) IL-10, (F) IL-6, and (G) TNF-α was determined by qPCR from colonic tissue of mice treated with 0, 2, 10, or 50 mg TiO2/kg BW/day in drinking water (n = 10 mice per group). (H) (Left—images) H&E stained colonic tissue section was evaluated for crypt length changes in 0 vs. 50 mg TiO2/kg BW/day. Representative histology images are shown for each group, black lines represent representative crypt length measurements (n = 5 mice per group). (Right—Graph) Quantification of colonic crypt length in untreated mice vs. mice treated with 50 mg TiO2/kg BW/day. Data are represented as median ± IQR. *p < 0.05, **p < 0.01 as determined by Mann–Whitney U-test. ***p < 0.001.
TiO2 Promotes Increased CD8+ T Cell Infiltration in the Colon and Increased Inflammatory Cytokines
Other cell subsets can produce TNF-alpha, particularly CD8+ T cells (39). By flow cytometry analysis, we found that CD8+ T cells were significantly increased from 10 mg TiO2/kg BW/day treatment (Figure 6A), as was expression of interferon-gamma in this cell subset (Figure 6B). Increased proportions of both macrophages and CD8+ T cells suggest a state of colonic inflammation in TiO2 treated mice which is consistent with the increased proportion of colonic Th17 cells (p = 0.0556) (Figure 6C) as well as significantly increased expression of IL-17A (Figure 6D). On the other hand, neither regulatory T cells (Figure 6E) nor TGF-beta (Figure 6F) were affected by TiO2 treatment. Gating strategies for flow cytometry analysis are shown in Supplementary Figure 8. These findings show that TiO2 treatment impairs immune homeostasis in the colon and promotes an inflammatory environment.
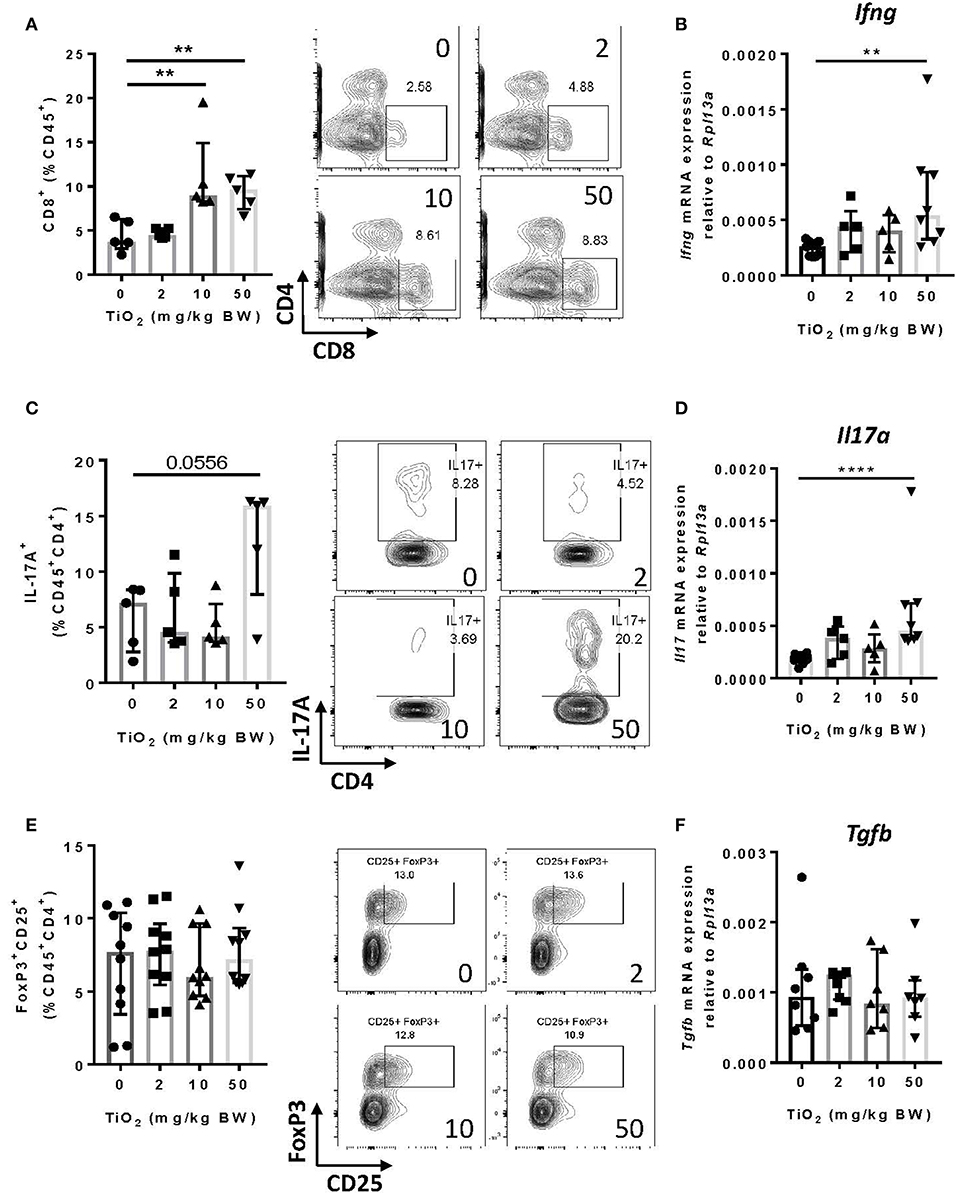
Figure 6. TiO2 treatment results in adaptive immune cell infiltration into the colon. (A) Proportion of colonic CD8+ T cells was quantified by flow cytometric analysis on mice treated with 0, 2, 10, or 50 mg TiO2/kg BW/day in drinking water (left); representative gating is shown (right) (n = 5 mice per group). (B) Expression of the gene encoding for IFN-γ was determined by qPCR on colon tissue of mice treated with 0, 2, 10, or 50 mg TiO2/kg BW/day in drinking water (n = 6–8 mice per group). (C) Proportion of IL-17A producing CD4 T cells from the colon was determined by flow cytometric analysis on mice treated with 0, 2, 10, or 50 mg TiO2/kg BW/day in drinking water (left); representative gating is shown (right) (n = 5 mice per group). (D) Expression of the gene encoding for IL-17A was determined by qPCR on colon tissue of mice treated with 0, 2, 10, or 50 mg TiO2/kg BW/day in drinking water (n = 6–8 mice per group). (E) Proportion of colonic regulatory T cells was determined by flow cytometric analysis on mice treated with 0, 2, 10, or 50 mg TiO2/kg BW/day in drinking water (left); representative gating is shown (right) (n = 8 mice per group). (F) Expression of the gene encoding for TGF-beta was determined by qPCR on colon tissue of mice treated with 0, 2, 10 or 50 mg TiO2/kg BW/day in drinking water (n = 6–8 mice per group). Data are represented as median ± IQR. **p < 0.01, ****p < 0.001 as determined by Mann–Whitney U-test.
Discussion
The ubiquitous use and daily consumption of TiO2 by the general population warrants investigation into its potential impact on health. After only a few weeks of daily TiO2 consumption, we observed that colonic homeostasis was significantly impaired in mice. While TiO2 impacted bacterial function by causing changes in bacterial metabolites (acetate and TMA) and by promoting biofilm formation by commensal bacteria, TiO2 had minimal impact on gut microbiota composition. One of the major mechanisms of physical separation between host and gut bacteria was impaired by TiO2, as shown by decreased Muc2 expression and increased Defb3 expression in colonic epithelial cells. We also observed increased macrophages, CD8+ T cells and Th17 T cells as well as increased inflammatory cytokines in the colon. This increased inflammation was associated with decreased colonic crypt length, as reported in inflammatory bowel diseases (40). Disruption of gut homeostasis due to chronic exposure to TiO2 may thus prime the host for conditions such as inflammatory bowel diseases or colorectal cancer.
Consumption of TiO2 had no impact on microbiota diversity in either the small intestine or colon. Using a constrained analysis, we found that microbiota composition in the small intestine was unchanged while some colonic microbiota changes were driven by 2 and 50 mg TiO2/kg BW/day. However, only a few taxa at the genus level were significantly altered in the colon, suggesting that TiO2 consumption is associated with minor changes in bacterial communities. Similarly, TiO2 might not dramatically reshape the human microbiota in vivo which would confirm previous in vitro findings in a model of simplified human microbiota (41, 42). However, treatment with TiO2 over a longer period of time, as previously done by treating mice for 12 weeks with emulsifiers polysorbate-80 (P80) and carboxylmethyl cellulose (CMC), might have a more dramatic impact (43).
The impact of TiO2 on gut microbiota at the genus level shared some similarities with this study on emulsifiers in which mice treated with CMC had a significant increase in Lactobacillus and Allobacullum (43). The increase in Lactobacillus is particularly interesting as these bacteria are a major biofilm producer, suggesting that TiO2 might favor the growth of biofilm producing bacteria. Another study suggests that TiO2 may enhance the growth of Lactobacillus (44). Previous studies have shown that TiO2 could either bind onto the surface of bacteria or bacteria could uptake TiO2 (45), which might trigger a defense mechanism contributing to biofilm formation as we observed in vitro. We also found that TiO2 mediated changes in the gut environment, such as decreased Muc2 expression, which have been shown to favor biofilm formation. Since bacterially derived SCFAs have been shown to promote mucus layer thickness, decreased acetate at the dose of TiO2 of 50 mg TiO2/kg BW/day could partially explained changes in mucus gene expression in mice treated at this dose of TiO2. TiO2 might also directly affect the function of mucus-producing goblet cells, as a previous report suggests an efficient uptake of TiO2 by goblet cells in vitro (46). The mucus layer is an efficient physical barrier preventing bacterial attachment to the epithelium and so its impairment by TiO2 might thus favor bacterial attachment and biofilm formation in the gut. Similarly, emulsifiers have been shown to decrease the mucus layer leading to closer contact between commensal bacteria and the epithelium (43). However, whether emulsifiers might favor biofilm formation is unknown. While we did not observe any impact of TiO2 on gut permeability related genes, Defb3 was upregulated which might be a compensatory mechanism to control the interaction with the commensal bacteria.
In the colonic lamina propria, we observed a significant impact of TiO2 on both innate and adaptive immune cells with increased macrophages, Th17 and CD8+ T cells. This proinflammatory effect of TiO2 is confirmed by changes in the cytokine environment with increased IL-6, IL-17, and TNF-alpha gene expression as well as decreased colonic crypt length. The later has also been reported in rats treated for 100 days with 10 mg TiO2/kg BW/day (19). Our findings suggest that some of the changes induced by TiO2 occur after as little as 30 days of daily TiO2 treatment.
In summary, our findings demonstrate that TiO2 profoundly affects gut homeostasis in mice and that such changes can occur over a period of time significantly shorter than the exposure typical for the human population. These changes were most significant at the highest dose of 50 mg TiO2/kg BW/day, but still significant at the physiological doses of 2 and 10 mg TiO2/kg BW/day. The pro-inflammatory environment and biofilm formation induced by TiO2 predispose the host to conditions such as inflammatory bowel diseases and colorectal cancer, both of which have been shown to be aggravated by TiO2 (19, 20). The reduced SCFA production at the highest dose of TiO2 has profound health implications as acetate has been shown to provide protection from colitis, colorectal cancer, food allergy, asthma and type 1 diabetes (2–5).
Finally, this work highlights the need for further research into how TiO2, on its own and in combination with other food additives, affects human health. Such research would better inform the regulation of food additives such TiO2 and thus potentially reduce the incidence of non-communicable diseases associated with the western lifestyle.
Ethics Statement
All experimental procedures involving animals were approved by the University of Sydney Animal Ethics Committee under protocol number 2014/696.
Author Contributions
GP and JT performed most of the experiments and analysis and wrote the manuscript. BJ and NK did the experiments related to biofilm and contributed to the manuscript writing. AA did the NMR and associated analysis and did the NTA for the TiO2 characterization. JO and YK did the mass spectrometry and associated analysis. FS contributed to the animal work, immune analysis, and TiO2 characterization and provided input throughout the project. JD did the SEM for the TiO2 characterization. SD did the CLSM. DK helped with the nanolive imaging. RM did the microbiota sequencing. DS did the microbiota sequencing and bioinformatic analysis. WC conceived the idea to study the impact of TiO2 on microbiota composition, and assisted with the TiO2 characterization. LM is the chief investigator in all the funding that supported this project, conceived the idea to study the impact of TiO2 on gut homeostasis and biofilm formation, designed and supervised the project, participated in the experiments and wrote the manuscript. All authors reviewed the manuscript.
Funding
This work was funded by SMS-FEIT Biomedical Engineering Research Collaboration Scheme 2016-2017, by NHMRC APP1068890 and by ARC LP160100627. LM is an a'Beckett fellow and JT has a fellowship from ANSTO. WC, SD, and DK acknowledge The University of Sydney Nano Institute, Grand Challenge for the financial support.
Conflict of Interest Statement
The authors declare that the research was conducted in the absence of any commercial or financial relationships that could be construed as a potential conflict of interest.
Acknowledgments
We thank Prof. Stephen Simpson for his input and support throughout the project. We also thank Erin Shanahan and Mark Read for their intellectual input and Miriam Jackson for her assistance with the TiO2 characterization.
Supplementary Material
The Supplementary Material for this article can be found online at: https://www.frontiersin.org/articles/10.3389/fnut.2019.00057/full#supplementary-material
References
1. Smith PM, Howitt MR, Panikov N, Michaud M, Gallini CA, Bohlooly YM, et al. The microbial metabolites, short-chain fatty acids, regulate colonic treg cell homeostasis. Science. (2013) 341:569–73. doi: 10.1126/science.1241165
2. Tan J, McKenzie C, Vuillermin PJ, Goverse G, Vinuesa CG, Mebius RE, et al. Dietary fiber and bacterial SCFA enhance oral tolerance and protect against food allergy through diverse cellular pathways. Cell Rep. (2016) 15:2809–24. doi: 10.1016/j.celrep.2016.05.047
3. Thorburn AN, McKenzie CI, Shen S, Stanley D, Macia L, Mason LJ, et al. Evidence that asthma is a developmental origin disease influenced by maternal diet and bacterial metabolites. Nat Commun. (2015) 6:7320. doi: 10.1038/ncomms8320
4. Macia L, Tan J, Vieira AT, Leach K, Stanley D, Luong S, et al. Metabolite-sensing receptors GPR43 and GPR109A facilitate dietary fibre-induced gut homeostasis through regulation of the inflammasome. Nat Commun. (2015) 6:6734. doi: 10.1038/ncomms7734
5. Mariño E, James Richards L, Keiran McLeod H, Stanley D, Yap YA, Knight J, et al. Gut microbial metabolites limit the frequency of autoimmune T cells and protect against type 1 diabetes. Nat Immunol. (2017) 18:552–62. doi: 10.1038/ni.3713
6. Zhang L-J, Richard Gallo L. Antimicrobial Peptides. Curr Biol. (2016) 26:R14–19. doi: 10.1016/j.cub.2015.11.017
7. Willemsen LEM, Koetsier MA, van Deventer SJH, van Tol EAF. Short chain fatty acids stimulate epithelial mucin 2 expression through differential effects on prostaglandin E1 and E2 production by intestinal myofibroblasts. Gut. (2003) 52:1442–7. doi: 10.1136/gut.52.10.1442
8. Fukuda S, Toh H, Hase K, Oshima K, Nakanishi Y, Yoshimura K, et al. Bifidobacteria can protect from enteropathogenic infection through production of acetate. Nature. (2011) 469:543–7. doi: 10.1038/nature09646
9. Daïen CI, Pinget GV, Tan JK, Macia L. Detrimental impact of microbiota-accessible carbohydrate-deprived diet on gut and immune homeostasis: an overview. Front Immunol. (2017) 8:548. doi: 10.3389/fimmu.2017.00548
10. Kim JM. Antimicrobial Proteins in Intestine and Inflammatory Bowel Diseases. Intestinal Res. (2014) 12:20–33. doi: 10.5217/ir.2014.12.1.20
11. Dejea CM, Wick EC, Hechenbleikner EM, White JR, Mark Tol JL, Rossetti BJ, et al. Microbiota organization is a distinct feature of proximal colorectal cancers. Proc Natl Acad Sci U.S.A. (2014) 111:18321–6. doi: 10.1073/pnas.1406199111
12. Ellermann M, Sartor RB. Intestinal bacterial biofilms modulate mucosal immune responses. J. Immunol. Sci. (2018) 2:13–8. doi: 10.29245/2578-3009/2018/2.1122
13. Motta JP, Flannigan KL, Agbor TA, Beatty JK, Blackler RW, Workentine ML, et al. Hydrogen sulfide protects from colitis and restores intestinal microbiota biofilm and mucus production. Inflamm Bowel Dis. (2015) 21:1006–17. doi: 10.1097/MIB.0000000000000345
14. Tytgat HLP, Franklin Nobrega L, van der Oost J, de Vos WM. Bowel biofilms: tipping points between a healthy and compromised gut? Trends Microbiol. (2019) 27:17–25. doi: 10.1016/j.tim.2018.08.009
15. Tomkovich S, Dejea CM, Winglee K, Drewes JL, Chung L, Housseau F, et al. Human colon mucosal biofilms from healthy or colon cancer hosts are carcinogenic. J Clin Invest. (2019) 130:1699–712. doi: 10.1172/JCI124196
16. Thorburn AN, Macia L, Mackay CR. Diet, metabolites, and ‘western-lifestyle’ inflammatory diseases. Immunity. (2014) 40:833–42. doi: 10.1016/j.immuni.2014.05.014
17. Holmes AJ, Chew YV, Colakoglu F, Cliff JB, Klaassens E, Read MN, et al. Diet-microbiome interactions in health are controlled by intestinal nitrogen source constraints. Cell Metabol. (2017) 25:140–51. doi: 10.1016/j.cmet.2016.10.021
18. Aguilar F, Crebelli R, Di Domenico A, Dusemund B, Frutos MJ, Galtier P, et al. Re-evaluation of Titanium Dioxide (E 171) as a Food Additive. EFSA J. (2016) 14:e04545. doi: 10.2903/j.efsa.2016.4545
19. Bettini S, Boutet-Robinet E, Cartier C, Coméra C, Gaultier E, Dupuy J, et al. Food-Grade TiO2 impairs intestinal and systemic immune homeostasis, initiates preneoplastic lesions and promotes aberrant crypt development in the rat colon. Sci Rep. (2017) 7:40373. doi: 10.1038/srep40373
20. Ruiz PA, Morón B, Becker HM, Lang S, Atrott K, Spalinger MR, et al. Titanium dioxide nanoparticles exacerbate DSS-induced colitis: role of the NLRP3 inflammasome. Gut. (2017) 66:1216–24. doi: 10.1136/gutjnl-2015-310297
21. Talbot P, Joanna Radziwill-Bienkowska M, Jasper Kamphuis BJ, Steenkeste K, Bettini S, Robert V, et al. Food-grade TiO2 is trapped by intestinal mucus in vitro but does not impair mucin O-glycosylation and short-chain fatty acid synthesis in vivo: implications for gut barrier protection. J Nanobiotechnol. (2018) 16:53. doi: 10.1186/s12951-018-0379-5
22. Gitrowski C, Aliaa Al-Jubory R, Richard Handy D. Uptake of different crystal structures of TiO2 nanoparticles by Caco-2 intestinal cells. Toxicol Lett. (2014) 226:264–76. doi: 10.1016/j.toxlet.2014.02.014
23. Bannunah AM, Vllasaliu D, Lord J, Stolnik S. Mechanisms of nanoparticle internalization and transport across an intestinal epithelial cell model: effect of size and surface charge. Mol Pharmaceut. (2014) 11:4363–73. doi: 10.1021/mp500439c
24. Chen H, Zhao R, Wang B, Cai C, Zheng L, Wang H, et al. The effects of orally administered Ag, TiO2 and SiO2 nanoparticles on gut microbiota composition and colitis induction in mice. NanoImpact. (2017) 8:80–8. doi: 10.1016/j.impact.2017.07.005
25. Li J, Yang S, Lei R, Gu W, Qin Y, Ma S, et al. Oral administration of rutile and anatase TiO2 nanoparticles shifts mouse gut microbiota structure. Nanoscale. (2018) 10:7736–45. doi: 10.1039/c8nr00386f
26. O'Sullivan JF, Morningstar JE, Yang Q, Zheng B, Gao Y, Jeanfavre S, et al. Dimethylguanidino valeric acid is a marker of liver fat and predicts diabetes. J Clin Invest. (2017) 127:4394–402. doi: 10.1172/JCI95995
27. Van den Driessche F, Rigole P, Brackman G, Coenye T. Optimization of resazurin-based viability staining for quantification of microbial biofilms. J Microbiol Methods. (2014) 98:31–4. doi: 10.1016/j.mimet.2013.12.011
28. Caporaso JG, Kuczynski J, Stombaugh J, Bittinger K, Bushman FD, Costello EK, et al. QIIME allows analysis of high-throughput community sequencing data. Nat Methods. (2010) 7:335–6. doi: 10.1038/nmeth.f.303
29. Gangadoo S, Dinev I, Chapman J, Hughes RJ, Van TTH, Moore RJ, et al. Selenium nanoparticles in poultry feed modify gut microbiota and increase abundance of Faecalibacterium prausnitzii. Appl Microbiol Biotechnol. (2018) 102:1455–66. doi: 10.1007/s00253-017-8688-4
30. McMurdie PJ, Holmes S. Phyloseq: an R package for reproducible interactive analysis and graphics of microbiome census data. PLoS ONE. (2013) 8:e61217. doi: 10.1371/journal.pone.0061217
31. Zakrzewski M, Proietti C, Ellis JJ, Hasan S, Brion MJ, Berger B, et al. Calypso: a user-friendly web-server for mining and visualizing microbiome–environment interactions. Bioinformatics. (2017) 33:782–3. doi: 10.1093/bioinformatics/btw725
32. Amir A, McDonald D, Navas-Molina JA, Kopylova E, Morton JT, Zech Xu Z, et al. Deblur rapidly resolves single-nucleotide community sequence patterns. MSystems. (2017) 2:e00191–16. doi: 10.1128/mSystems.00191-16
33. Trompette A, Gollwitzer ES, Pattaroni C, Lopez-Mejia IC, Riva E, Pernot J, et al. Dietary fiber confers protection against flu by shaping Ly6c- patrolling monocyte hematopoiesis and CD8+ T cell metabolism. Immunity. (2018) 48:992–1005.e8. doi: 10.1016/j.immuni.2018.04.022
34. Trompette A, Gollwitzer ES, Yadava K, Sichelstiel AK, Sprenger N, Ngom-Bru C, et al. Gut microbiota metabolism of dietary fiber influences allergic airway disease and hematopoiesis. Nat Med. (2014) 20:159–66. doi: 10.1038/nm.3444
35. Koeth RA, Wang Z, Levison BS, Buffa JA, Org E, Sheehy BT, et al. Intestinal microbiota metabolism of L-carnitine, a nutrient in red meat, promotes atherosclerosis. Nat Med. (2013) 19:576–85. doi: 10.1038/nm.3145
36. Li S, Konstantinov SR, Smits R, Peppelenbosch MP. Bacterial biofilms in colorectal cancer initiation and progression. Trends Mol Med. (2017) 23:18–30. doi: 10.1016/j.molmed.2016.11.004
37. Landy J, Ronde E, English N, Clark SK, Hart AL, Knight SC, et al. Tight junctions in inflammatory bowel diseases and inflammatory bowel disease associated colorectal cancer. World J Gastroenterol. (2016) 22:3117–26. doi: 10.3748/wjg.v22.i11.3117
38. Van der Sluis M, De Koning BA, De Bruijn AC, Velcich A, Meijerink JP, Van Goudoever JB, et al. Muc2-deficient mice spontaneously develop colitis, indicating that MUC2 is critical for colonic protection. Gastroenterology. (2006) 131:117–29. doi: 10.1053/j.gastro.2006.04.020
39. Brehm MA, Daniels KA, Welsh RM. Rapid production of TNF-α following TCR engagement of naive CD8 T cells. J Immunol. (2005) 175:5043–49. doi: 10.4049/jimmunol.175.8.5043
40. Hendrickson BA, Gokhale R, Cho JH. Clinical aspects and pathophysiology of inflammatory bowel disease. Clin Microbiol Rev. (2002) 15:79–94. doi: 10.1128/CMR.15.1.79-94.2002
41. Waller T, Chen C, Sharon Walker L. Food and industrial grade titanium dioxide impacts gut microbiota. Environ Eng Sci. (2017) 34:537–50. doi: 10.1089/ees.2016.0364
42. Dudefoi W, Moniz K, Allen-Vercoe E, Ropers M–H., Walker KV Impact of food grade and nano-TiO2 particles on a human intestinal community. Food Chem Toxicol. 106(Pt A):242–49. doi: 10.1016/j.fct.2017.05.050
43. Chassaing B, Koren O, Goodrich JK, Poole AC, Srinivasan S, Ley RE, et al. Dietary emulsifiers impact the mouse gut microbiota promoting colitis and metabolic syndrome. Nature. (2015) 519:92–6. doi: 10.1038/nature14232
44. Radziwill-Bienkowska JM, Talbot P, Jasper Kamphuis B, Robert V, Cartier C, Fourquaux I, et al. Toxicity of food-grade TiO2 to commensal intestinal and transient food-borne bacteria: new insights using nano-SIMS and synchrotron UV fluorescence imaging. Front Microbiol. (2018) 9:794. doi: 10.3389/fmicb.2018.00794
45. Butler KS, Casey BJ, Garborcauskas GV, Dair BJ, Elespuru RK. Assessment of titanium dioxide nanoparticleeffects in bacteria: association, uptake, mutagenicity, co-mutagenicity and DNA repair inhibition. Mutat Res Genet Toxicol Environ Mutagenesis. (2014) 768:14–22. doi: 10.1016/j.mrgentox.2014.04.008
Keywords: biofilm, gut microbiota, immune cells, inflammation, titanium dioxide
Citation: Pinget G, Tan J, Janac B, Kaakoush NO, Angelatos AS, O'Sullivan J, Koay YC, Sierro F, Davis J, Divakarla SK, Khanal D, Moore RJ, Stanley D, Chrzanowski W and Macia L (2019) Impact of the Food Additive Titanium Dioxide (E171) on Gut Microbiota-Host Interaction. Front. Nutr. 6:57. doi: 10.3389/fnut.2019.00057
Received: 08 February 2019; Accepted: 12 April 2019;
Published: 14 May 2019.
Edited by:
Pinyi Lu, Biotechnology HPC Software Applications Institute (BHSAI), United StatesReviewed by:
Xi Ma, China Agricultural University, ChinaRunmin Wei, University of Hawaii Cancer Center, United States
Ivan Milos Stankovic, University of Belgrade, Serbia
Copyright © 2019 Pinget, Tan, Janac, Kaakoush, Angelatos, O'Sullivan, Koay, Sierro, Davis, Divakarla, Khanal, Moore, Stanley, Chrzanowski and Macia. This is an open-access article distributed under the terms of the Creative Commons Attribution License (CC BY). The use, distribution or reproduction in other forums is permitted, provided the original author(s) and the copyright owner(s) are credited and that the original publication in this journal is cited, in accordance with accepted academic practice. No use, distribution or reproduction is permitted which does not comply with these terms.
*Correspondence: Wojciech Chrzanowski, d29qY2llY2guY2hyemFub3dza2lAc3lkbmV5LmVkdS5hdQ==
Laurence Macia, bGF1cmVuY2UubWFjaWFAc3lkbmV5LmVkdS5hdQ==
†These authors have contributed equally to this work