 Adam Drewnowski
 Celine Richonnet
- 1Center for Public Health Nutrition, University of Washington, Seattle, WA, United States
- 2MOM Materne Mont Blanc Group, Paris, France
Background: The US Food and Drug Administration has modified its regulations on nutrient content claims by considering healthy dietary ingredients as well as nutrients.
Objective: To assess the relation between dairy and fruit as main ingredients in children's snacks and the Nutrient Rich Food (NRF8.3) nutrient density score.
Methods: Commonly consumed children's snacks in the United States, Canada, France, and the United Kingdom (n = 261) were assigned into USDA What We Eat in America (WWEI) categories. Nutrient composition data came from industry websites, open-source government databases (USDA Standard Reference SR28; CIQUAL), and back-of-pack food labels. Nutrient density was calculated using the Nutrient Rich Food Index NRF8.3. Snacks with dairy or fruit as the first listed ingredient (n = 115) were compared to those that listed neither (n = 146). Snacks that contained fruits-vegetables-nuts (FVN) (n = 88) were compared to those that did not (n = 173).
Results: NRF8.3 scores were higher for snacks listing dairy or fruit as main ingredients. Dairy or fruit when listed as the first ingredient were associated with higher percent daily values of protein, fiber, calcium, vitamin A, vitamin C, and vitamin D, lower saturated fat content and a 30-point increment in NRF8.3 scores. The presence of FVN was associated with a 22-point increment in NRF8.3 scores.
Conclusion: The correspondence between back-of-pack food ingredients and the nutrient based NRF8.3 scores suggests that ingredients can also be used to communicate the nutritional value of foods to the consumer. Dairy and fruit, when listed as first ingredients, were an important component of the NRF8.3 nutrient density score.
Introduction
Methods to assess nutrient density of foods, based on their nutrient composition, have become known as nutrient profiling (NP) (1–6). Foods contain a variety of beneficial nutrients that may include protein, fiber, and a variety of required vitamins and minerals but they can also include excessive amounts of saturated fat, sugar, and salt (7). Designed to capture each food's overall nutritional value (2, 7). NP models aim to separate foods that are energy-dense from those that are nutrient-rich. Most NP models strive to include the beneficial nutrients to encourage and to limit excessive fat, sugar, and salt (4–7).
The development of NP models in the US and in the European Union (EU] has been guided by the regulatory environment (7–9). With some exceptions (6, 10), regulatory decisions on what foods qualify as “healthy” have been for the most part nutrient-based. The US Food and Drug Administration (FDA) standards required “healthy” foods to contain adequate amounts of protein, fiber, vitamin A, vitamin C, calcium, and iron (qualifying nutrients), without exceeding the limits for fat, saturated fat, cholesterol, and sodium (disqualifying nutrients) (1, 11). The initial NRF9.3 NP model in the US was accordingly based on protein, fiber, vitamin A, vitamin C, vitamin E, calcium, iron, potassium, and magnesium. It was recently modified to include vitamin D (1, 12). Nutrients to limit were saturated fat, added sugar, and sodium (8, 9).
In 2015, the food company KIND LLC submitted a citizen petition requesting that the FDA revisit its definition of a “healthy” food (13). This was in response to an FDA Warning Letter, which requested the company remove the word “healthy” from its packaging (14). KIND bars with nuts failed to meet the implicit nutrient content claim of “healthy” because they contained >1 g of saturated fats per Reference Amount Customarily Consumed (RACC) and because >15% of energy came from saturated fats. The KIND petition argued that purely nutrient-based standards were no longer supported by science and that the inclusion of healthy ingredients was more important than was the overall saturated fat content. The KIND petition asked the FDA to allow nutrient content claims on those products that contained meaningful amounts of health promoting foods, defined as vegetables, whole fruits, whole grains, legumes, and nuts. By May 2016, FDA reversed its earlier decision and allowed KIND to use the term “healthy” on its products.
This policy shift from healthy nutrients to healthy food ingredients was in line with current research on healthy food patterns in the US (15, 16). While the US Dietary Guidelines for Americans 2015–2020 have continued to stress the importance of excess saturated fat, sugar and salt, the focus of dietary advice has shifted toward the overall quality of habitual food patterns (17). Healthy food patterns are described as those with more low-fat dairy, more fruits and vegetables, and more whole grains, legumes, and nuts (17). Consistent with the US advice, the French National Plan for Nutrition and Health (PNNS) has recommended five servings of fruits and vegetables and three servings of milk and dairy per day (18).
The likely recognition of healthy food ingredients by US federal and other agencies opens the door to new hybrid NP approaches to NP modeling (1). While milk and fruit are viewed as desirable components of children's snacks, few studies have quantified the relation between ingredients listed on back-of-pack and algorithm-based nutrient density scores (19). The present approach was to screen a selection of commonly consumed children's snacks in the US, Canada, France, and the UK using a version of the Nutrient Rich Foods (NRF8.3) model. The contribution of milk and fruit listed as first ingredients on the back-of-pack ingredient label to NRF8.3 scores was examined as was the contribution to NRF8.3 scores of fruit, vegetables, and nuts.
Materials and Methods
Nutrient Composition of Snacks
Popular children's snacks (n = 261) in the US (n = 65), Canada (n = 60), France (n = 65), and the UK (n = 71) were identified through marketing research data in respective countries. The data were informed by sales figures from consumer research conducted by Nielsen (France, Canada, US), Ipsos (France, Canada), BCG (US), and Kantar (UK) and made available to MOM Materne Mont Blanc Group. The nutrient composition of snacks and the lists of ingredients were obtained from two main sources: (1) Back-of-pack nutrition fact panels and lists of ingredients, available from product packaging or from company websites; (2) government agency nutrient composition databases, some of them with data for branded products. The databases included the branded US Department of Agriculture Standard reference database SR28, now supplemented with a list ingredients for each product and the French nutrient composition database CIQUAL maintained by the French agency for food, environmental, and occupational health safety (ANSES), the French equivalent of the FDA. Nutrients missing from the nutrition facts panels or from company websites were imputed from nearest matches in the SR-28 for US and Canada and from the CIQUAL databases for France and the UK. Data for added sugar in US and Canada came from the USDA; data for added sugar in France came from a customized version of CIQUAL used in previous studies.
The 261 snacks were categorized by major categories and subcategories used in analyses of the What We Eat in America (WWEIA) data by the US Dietary Guidelines Advisory Committee 2015–2020 (US DGAC) (20). The major DGAC categories are dairy, protein foods, mixed dishes, grains, snacks and sweets, fruit, vegetables, beverages, and condiments (20). Not surprisingly, the typical children's snacks did not include vegetables or legumes, meat, poultry or fish, or eggs, mixed dishes, or condiments. Rather, most of the best-selling snacks came from such categories as sweet grains, candy and other sweets, dairy products (milk, yogurt, sugar sweetened beverages and 100% juices, fruits snacks, nuts, and seeds.
The Nutrient Rich (NRF8.3) Model
The public-domain algorithm for the Nutrient Rich Food Index (NRFn.3) is given by NRn—LIM = NRFn.3, where n represents a variable number of nutrients to encourage and LIM represents 3 nutrients to limit (1–3). In published studies, the number of qualifying nutrients to encourage has varied from 6 (NRF 6.3) to 15 (NRF 15.3) (8, 9). The LIM score was always based on the same 3 nutrients of public health concern: saturated fat, added sugar, and sodium (8, 9). The basis of calculation was 100 kcal. The NRF score can be applied to foods, composite meals, and to total diets (12).
The present NR8 subscore was the sum of percentage daily values (%DVs) for 8 qualifying nutrients: protein, fiber, vitamins A, C, and D, calcium, iron, and potassium. Vitamin D replaced vitamin E and magnesium was omitted. The %DVs for qualifying nutrients were capped at 100%. The negative LIM sub-score was the sum of %MRVs (Maximum Recommended Values) for 3 disqualifying nutrients: saturated fat, added sugar, and sodium. Percent MRVs were also calculated for total sugar (21). Total sugars include those naturally present in fruit and/or dairy.
Nutrient density calculations are generally based on nutrient standards per reference amount of food, whether 100 kcal, 100 g, or serving size (11, 22, 23). Nutrient standards for the US and the European Union are close but not exactly the same. For ease of transnational comparisons, a single set of US-based standards was applied to snacks from all markets to assure uniformity in NP modeling.
The 8 nutrients to encourage and standard reference amounts were as follows: protein (50 g), fiber (28 g), vitamin A (800 μg), vitamin C (80 mg), vitamin D (15 μg), calcium (1,000 mg), iron (18 mg), and potassium (4,700 mg). The three nutrients to limit and maximum recommended values (MRVs) were: added sugar (50 g), saturated fat (20 g), and sodium (2,400 mg). The NRF8.3 was calculated as follows:
and
where content i is the food's content of each nutrient i, and DVi is the reference daily value (DV) for that nutrient. In NR calculation, each nutrient i is expressed in percentage of DV per 100 kcal (rather than per gram or serving). Percent DVs for nutrients to encourage were truncated at 100, so that an excessively high content of a single nutrient would not lead to excessive NRF scores.
The Back-of-Pack Ingredient List
The USDA SR28 branded nutrient composition database, developed in collaboration with ILSI North America, includes both nutrients and ingredients (24). Ingredients are also provided on the back-of-pack label alongside the nutrition facts panel and can be obtained from company websites.
While no specific amounts are provided on the ingredients list, ingredients are typically listed in the order of importance. In the US, the section 101.4, Title 21 of the Code of Federal Regulation (CFR) (25) specifies how ingredients must be designated. The current rule of the US Food and Drug Administration is that the ingredients on a product label must be listed in order of predominance, with the ingredients used in the greatest amount first, followed in descending order by those in smaller amounts.
The number of back-of-pack ingredients can vary widely, depending on local regulatory requirements and the manufacturer's own clean label policy. For example, in the US, GoGoSqueez lists “apple, apple puree concentrate, lemon juice concentrate” whereas Haagen Dazs ice cream lists “cream, skim milk, egg yolks, vanilla extract.” KIND granola bar lists “oats, tapioca syrup, semi-sweet chocolate (unsweetened chocolate, cane sugar, cocoa butter, vanilla extract), honey, canola oil, brown rice, brown rice flour, cane sugar, sorghum, sea salt, quinoa, vanilla extract, vitamin E.” The ingredients of Oreo chocolate sandwich cookies are given as “sugar, unbleached enriched flour (wheat flour, niacin, reduced iron, thiamine mononitrate [vitamin B1], riboflavin [vitamin B2], folic acid), high oleic canola and/or palm and/or canola oil, cocoa (processed with alkali), high fructose corn syrup, leavening (baking soda and/or calcium phosphate), cornstarch, salt, soy lecithin, vanillin—an artificial flavor, chocolate.”
The more recent European Commission notice 2017/C393/05 has taken this a step further by providing guidelines on the quantitative declaration of ingredients (QUID) used in the manufacture of preprocessed foods (26). QUID is required when the ingredient (or category of ingredients) is included in the name of the food and is expressed as numerical percentage by weight. At this time, the QUID requirement covers products containing fruit or dairy (e.g., strawberry yogurt) and can be found on food labels in the EU. For example, strawberry flavored yogurt from Danone lists “whole milk (59.5%), skim milk powder, sugar (8.2%), red fruit (blackberry, strawberry, raspberry 5%), raspberry (5%), strawberry (5%).
The present analyses used two sets of criteria to examine the contribution of dairy or fruit to nutrient density. The presence of dairy was counted only if milk, yogurt, or cheese were listed as the first ingredient. Milk chocolate or milk powder, skim milk powder, or modified milk solids occurring further down the ingredient list did not qualify. The presence of fruit was counted only if fruit was listed as the first ingredient. Second place following water was allowed, but not after sugar or another ingredient Ingredients lists for e.g., orange juice from concentrate often take the form of: “water, oranges.” While fruit purees were included, cakes with fruit jam, fruit pectins or fruit flavors did not qualify. Following FDA position on added sugars, concentrated fruit juices (used as sweeteners in processed foods) did not count and neither did dairy components such as dehydrated milk solids.
Second, the products were classified by the presence of fruit, vegetables, or nuts (FVN), a more common approach, already used in some NP models (10). The FVN scoring system developed for the Food Standards Agency—Office of Communications (FSA-Ofcom) in the UK was initially based on recipes provided by the manufacturers (10). However, these procedures were recently modified by Public Health England (27). In the absence of recipes, we looked for the occurrence of FVN on the ingredient list. Peanuts and seeds were included in the FVN category. Vegetables were not a frequent ingredient of popular children's snacks. Starchy vegetables (potatoes, corn) in the form of chips did not qualify for inclusion in the vegetable category.
Plan of Analysis
Nutrient content of snacks was expressed as % Daily Value (%DV) for nutrients to encourage and as % Maximum Recommended Value (%MRV) for nutrients to limit. Energy density (kcal/100 g), the NRF9.3 nutrient density scores and the LIM subscores were calculated for snacks aggregated by WWEIA categories. Snacks that contained fruit or dairy were compared to those that did not on both nutrients and nutrient density scores. Snacks that contained FVN were compared to those that did not. Tests for significant differences between means were based on one-way ANOVAs.
Results
Energy density (kcal/100 g), the LIM subscores, and the NRF 8.3 scores for WWEIA categories are shown in Table 1. WWEIA identification codes and the number of items per category are provided as well. As expected, the most popular children's snacks in 4 countries were mostly cakes, cookies, brownies (N = 27), fruit candies (N = 27), chocolate candies (N = 19), sweet grains, and flavored yogurts. Mean energy density of children's snacks ranged from <50 kcal/100 g for whole fruit and fruit based soft drinks to more than 500 kcal/100 g for energy-dense chocolate, chips, and nuts. Among snacks with energy density <200 kcal/100 g were milk and yogurts, unsweetened fruit, 100% fruit juices, and other sweetened beverages. Among snacks with energy density of >200 kcal/100 g were fruit candy and snacks with added sugar, sweet grains, savory snacks, candy bars, and cheeses.
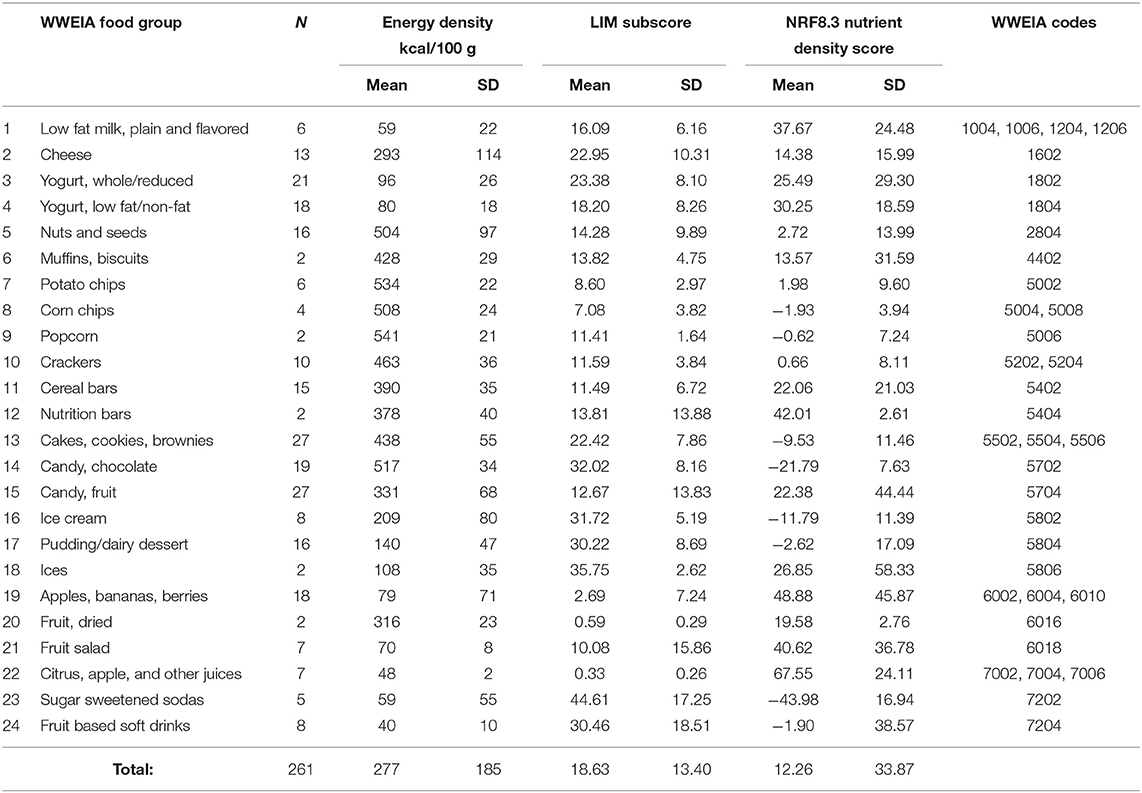
Table 1. Energy Density (ED) in kcal/100 g, LIM subscore, and NRF8.3 scores for snacks aggregated to WWEIA categories.
Figure 1 is a scatterplot of the relation between energy density (kcal/100 g) and nutrient density (NRF8.3) scores per 100 kcal for snack categories. Individual snacks were aggregated to WWEIA categories and the size of the circle denotes the number of items in each category. There was a clear separation between energy-dense snacks and snacks of lower energy density, which included unsweetened fruit and low-fat milk and yogurt. Chocolate candy, cakes, and crackers had relatively low NRF8.3 scores. Ice cream and pudding (dairy desserts) had lower energy density but also low NRF8.3 score, because of added sugar and saturated fat. Higher NRF8.3 scores were awarded to energy dense nutrition bars, cereal bars, dried fruit, cheese, and nuts and seeds.
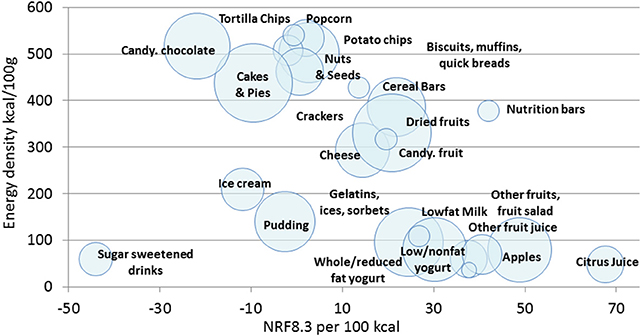
Figure 1. A scatterplot of NRF8.3 nutrient density per 100 kcal (x axis) and energy density kcal/100 g (y axis) of children's snacks the US, Canada, France and UK (n = 261). Snacks are aggregated by WWEIA food categories and labeled.
Energy density (kcal/100 g) and LIM scores (saturated fat, added sugar and sodium) are correlated but not the same (8, 9). Figure 2 is a scatterplot of the relation between the LIM subscore and the nutrient density (NRF8) subscore, with snacks aggregated to WWEIA categories. There was an inverse relation between LIM subscores and NRF8.3 nutrient density score. The continuum of nutrient densities ran from sugar sweetened soft drinks to 100% citrus juice. Snacks based on milk, yogurt, and fruit had higher NRF scores as compared to candy, cakes and desserts.
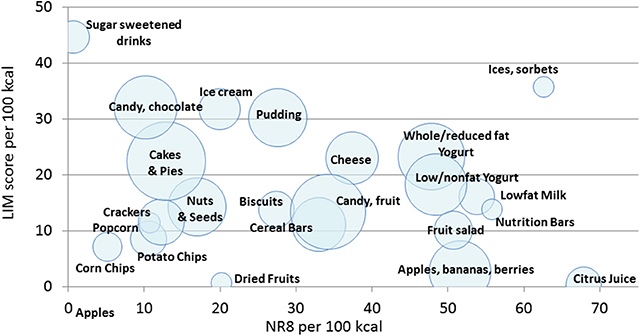
Figure 2. A scatterplot of NR8 nutrient density subscore per 100 kcal (x axis) and LIM scores (y axis) of children's snacks the US, Canada, France and UK (n = 261). Snacks are aggregated by WWEIA food categories and labeled.
Figure 3 is a scatterplot of the relation between energy density of individual snacks and their nutrient density (NRF8.3). The lowest nutrient density scores were for Coca-Cola; jellies and lollipops, chocolate candy, fruit drinks with added sugar and cookies and cake. The highest scores were for low-fat milk and low-fat plain yogurts, whole fruit, orange juice, Greek yogurt, and strawberries.
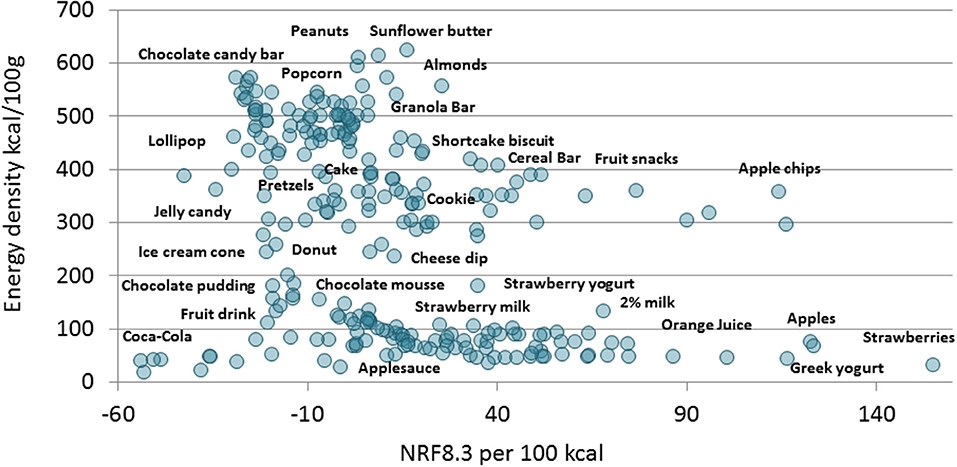
Figure 3. A scatterplot of NRF8.3 nutrient density per 100 kcal (x axis) and energy density kcal/100 g (y axis) of children's snacks the US, Canada, France and UK (n = 261). Snacks are shown individually and partly labeled.
Again, energy density and LIM scores were not the same. Lower- energy density foods had variable LIM scores, depending on added sugar content. Figure 4 shows that the highest LIM and lowest nutrient density NR8 subscores were for a sugar sweetened beverage followed by other sweetened foods. By contrast, low-fat milk and low-fat yogurt scored higher as did apples, bananas and berries and citrus juice. Children's snacks based on unsweetened fruit, plain yogurt, and low-fat milk ranked relatively high on the nutrient density continuum.
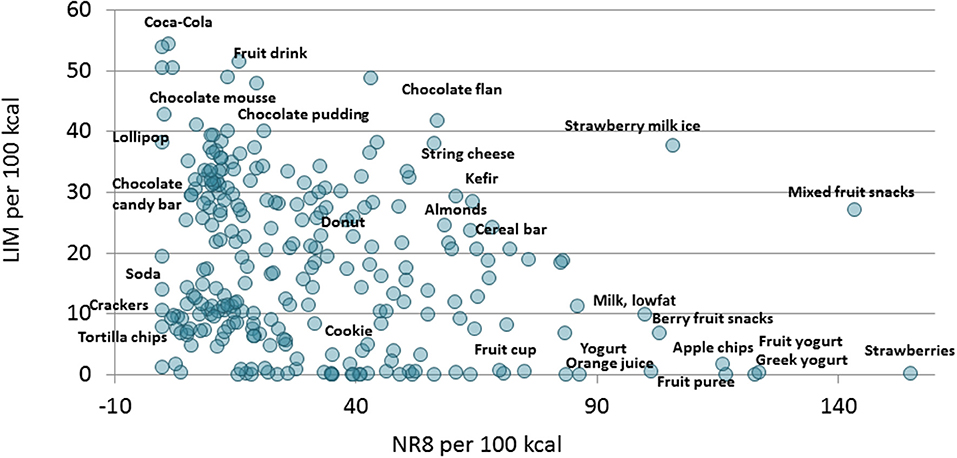
Figure 4. A scatterplot of NR8 nutrient density subscore per 100 kcal (x axis) and LIM scores (y axis) of children's snacks the US, Canada, France and UK (n = 261). Snacks are shown individually and partly labeled.
The Contribution of Dairy and Fruit as Main Ingredients to NRF8.3 Scores
The relation between dairy or fruit, listed as first ingredients on back-of-pack and the NRF8.3 score is shown in Table 2. Also shown are percent daily values (%DV) for NRF8.3 components and the NR8 and LIM subscores. When milk, yogurt, cheese or fruit were listed as the first ingredient, the snacks were higher in protein, fiber, vitamin A, vitamin C, vitamin D, calcium, iron, and potassium. Total sugar was higher because of naturally occurring sugar in milk and fruit; there was no difference in saturated fat, added sugar, or sodium. As might be expected, higher protein, vitamin A, vitamin D, calcium, and potassium came from dairy, whereas higher values for fiber and vitamin C were due to fruit.
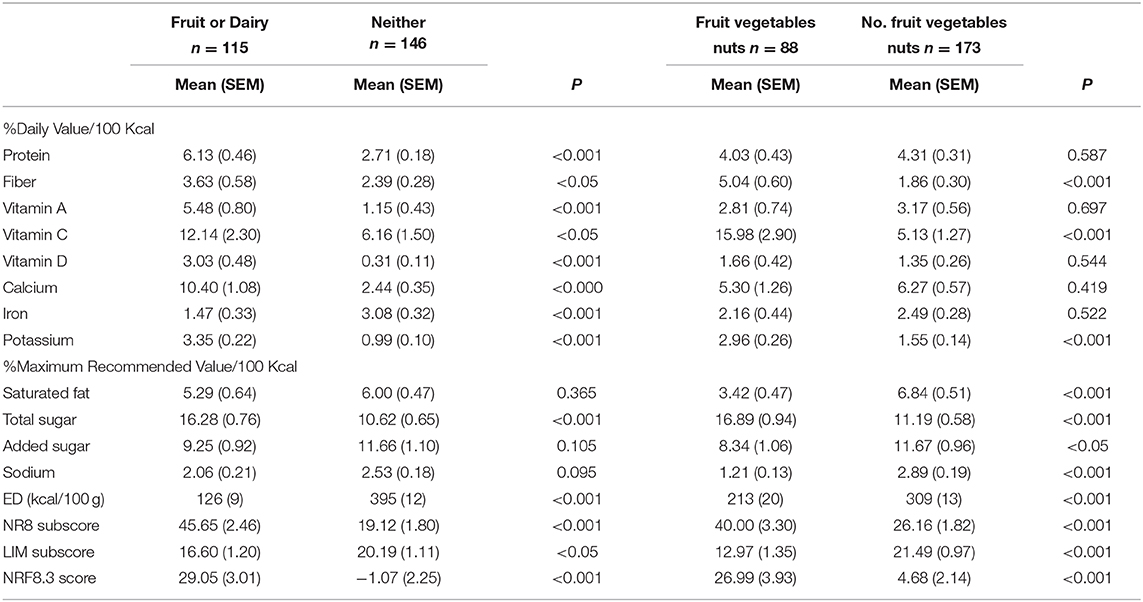
Table 2. Nutrient composition %DV 100 kcal of children's snacks by the first ingredient listed on the ingredient label.
Those snacks that listed dairy or fruit as the first ingredient had higher NRF8.3 scores compared to those that did not. Energy density was significantly lower (126 kcal/100 g compared to 395 kcal/100 g). The NR8 score was higher and the LIM subscore was lower. The NRF8.3 score was higher by an average of 30 points (p < 0.001).
Those snacks that listed FVN also had higher NRF8.3 scores compared to those that did not. Fewer children's snacks contained vegetables and so the category size was reduced. As expected, listed FVN content was associated with higher %DV values for fiber, vitamin C and potassium (but not protein). Saturated fat was reduced, total sugar was increased (fruit) and there was a reduction in added sugar and sodium. Energy density was significantly lower (213 kcal/100 g compared to 309 kcal/100 g). The NR8 score was higher and the LIM subscore was lower. The NRF8.3 score was higher by an average of 22 points (p < 0001).
Discussion
The present analyses were based on branded open-source nutrient composition databases for commonly consumed children's snacks in the United States, Canada, France and the United Kingdom, as identified by marketing research. Energy density and nutrient density measures were obtained. Energy density of children's snacks has been used in the past to distinguish between healthier and less healthy snacks (28). The present snacks varied greatly by energy density per 100 g. Energy-dense snacks (>200 kcal/100 g) were chocolate, nuts, chips, cakes, cookies and brownies and other sweetened grains. Lower energy density snacks (with energy density <200 kcal/100 g) were fruits and juices, milks, and plain and flavored yogurts.
Energy density per 100 g is a measure of policy interest. In January 2014, Mexico passed an 8% tax on non-essential foods—that is snacks—with energy density ≥275 kcal/100 g. The tax was imposed on salty snacks, chips, cakes, pastries, and frozen desserts; and a 1 peso/liter (~10%) tax on sugar-sweetened beverages. Basing the tax on energy density rather than on healthy ingredients or nutrient content meant that nuts and cereal bars were taxed whereas ice cream was not. By contrast, some past evaluations of nutrient density of snacks, some based on the NRF nutrient density score (29), have focused more on the snacks' nutritional value rather than on their energy density alone. When it comes to snacks, dietary advice has focused on promoting snacks of lower energy density and higher nutrition value (29–31).
It should be noted that some energy-dense snacks were relatively nutrient rich (32); for example, nuts and fortified cereals both had high NRF8.3 scores. By contrast, some low energy-density beverages were nutrient-poor (soda and fruit drinks). As shown above, the LIM score was distinct from energy density since it penalized added sugar in low energy density beverages. In the present dataset, about 60% of the snacks contained added sugar. Although the mean %DV for added sugar was 10%, sugar sweetened beverages and sugar candy were essentially all sugar, providing 100% of energy from added sugar.
Examining the contribution of first-listed ingredients to NRF8.3 scores is a novel component of this paper. This approach follows on the Code of Federal Regulations in the US and the more recent 2017 notice by the European Commission. In the US, the ingredients on a product label must be listed in the order of predominance, with the ingredients listed in the greatest amount listed first. The European Commission has imposed quantitative requirements for key ingredients to be listed as numerical percentage by weight. The implementation of these requirements will open the door to a new generation of NP models that make use of the ingredient list. In the present analyses, dairy or fruit listed as the first ingredient were associated with a 30-point increase in the NRF8.3 nutrient density score. The presence of FVN produced comparable results but the differences were less sharp.
While most NP models are based on nutrients only, some do award additional points to selected food groups, notably FVN. For example, the FSA-Ofcom guidelines (10) and the Australian Health Star Rating System (33) award extra points to foods containing fruit, vegetables, and nuts. The French Nutri-Score (34), directly derived from FSA-Ofcom, has awarded extra points to foods containing fruit, vegetables, legumes, nuts or rapeseed, and to olive or nut oils.
However, the relation between the foods' content of FVN and the nutrient profiling algorithm has always seemed arbitrary. The algorithm used to assess the amounts of fruits, vegetables, or nuts in complex foods for the FSA-Ofcom score was particularly complex (10). The FVN content of foods was then rated along a wholly arbitrary range of 5 points, based on the percent content of FVN per 100 g of food product. Only products that contained >80% FVN were awarded 5 points; products that contained <40% FVN got 0 points, those that contained >40% got 1 point and those that contained >60% got 2 points. The nutrient profiling technical guidance published in 2011 by the Obesity Team at the UK Department of Health runs to 18 detailed pages (10). It is a summary of a more extensive document that is no longer available online (35).
The principal consideration was that only intact fruit and vegetables (including those that were cooked and dried) and those that were minimally processed (peeled, sliced, tinned, frozen, 100% juices, and purees) could be included when calculating the FSA-Ofcom score. More detailed instructions on how to calculate the FVN content of foods for an updated UK nutrient profiling model were recently published by Public Health England (27). Neither document was meant to assist the shopper. Rather, the PHE guidelines had been produced to assist food manufacturers, retailers and advertisers to correctly calculate nutrient profiling scores for their products (10, 27). That required manufacturers to provide the weight of each ingredient in a product, which would then allow an exact calculation of the fruit, vegetable, and nut content in a food. The present approach was to base calculations on the ingredient listed first, consistent with the US and the EU guidelines. Following the FDA practice, concentrated fruit juice sugars, powders, or leathers were not counted as fruit in the present study. The nut category included peanuts as well as tree nuts.
There are other studies suggesting that the back of pack ingredient list is a potential additional tool for nutrition education. Lacking detailed information on the weight of FVN in food products, the Environmental Working Group in Washington DC (36) developed a separate algorithm that used the order of the ingredient's listing as a proxy for the percentage of fruit, vegetable, or nut in the product. The nutrient content of FVN ingredients was then compared to the foods' content of carbohydrates, sugar or fat in a ratio-based metric (36). The present approach was to quantify the contribution of dairy or fruit listed as first ingredients to the previously established NRF8.3 score. On average, snacks with dairy or fruit as first ingredients scored 30 points higher. Arguably, the inclusion of dairy is more relevant to the rating of children's snacks than are vegetables, which were barely represented in the present market-driven database.
As the dietary guidance is shifting from nutrients to whole foods and food ingredients, NP models need to follow suit. The 2015–2020 DGA defined healthy dietary patterns as composed of a variety of vegetables from all of the subgroups; fruits; grains, at least half of which are whole grains; fat-free or low-fat dairy; a variety of protein foods; and oils (1). Hybrid NP models that combine both nutrients and selected dietary ingredients are more closely aligned with dietary guidance that is increasingly targeted at foods and food groups, rather than isolated nutrients. Some hybrid scores have attempted to include whole grains, plant proteins, seafood, or healthy oils, consistent with the DGAs. However, some of those food groups seem to be underrepresented in children's snacks—hence the resent focus on dairy and fruit, in comparison to a modified FVN approach.
Children's snacks are not often viewed as particularly nutritious and many fall into the category of processed or “ultra-processed foods” (37–39). Whereas, NP models were initially intended to guide consumer behaviors at the point of sale, the NP methodology is increasingly being used by food companies for product screening and reformulation. Those voluntary efforts are monitored by the Access to Nutrition Index (ATNI), a global initiative to evaluate the world's largest food and beverage manufacturers on their policies and practices, including the nutritional value of their product portfolios (40).
Conclusions
Dairy or fruit, when listed as first ingredients, made an important contribution to the NRF8.3 nutrient density score. The correspondence between nutrient based NP models and the back-of-pack food ingredients suggests that ingredients can also be used to communicate the nutritional value of foods to the consumer. Data from the ingredient list, increasingly available in electronic format, can also be used to construct a new generation of hybrid NP scores for potential use in the (re) formulation and optimization of food products.
Data Availability Statement
The US Department of Agriculture Branded Food Products database is available at FoodData Central: https://fdc.nal.usda.gov/. The French food composition table CIQUAL is available at https://ciqual.anses.fr/. Additional data came from manufacturers' websites and food labels.
Author Contributions
AD and CR conceptualized the study and reviewed and approved the manuscript. CR generated the list of snacks from multiple markets and provided nutrient composition data. AD conducted nutrient profiling analyses and took the lead on writing the manuscript. The views expressed in this work are those of the authors and do not necessarily reflect the position or policy of MOM Materne Mont Blanc Group.
Funding
Funding for the collection of the nutrient composition data and data analyses was provided by MOM Materne Mont Blanc Group.
Conflict of Interest
The authors declare that this study received funding from MOM Materne Mont Blanc Group. CR is the Nutrition Director for MOM Materne Mont Blanc Group. CR was involved in conceptualizing study design, identifying snacks for nutrient profiling, and identifying open source websites with nutrition information. The funder was not involved in data collection, data analysis, interpretation of data, or the writing of the initial draft of the article. Both authors took the decision to submit the manuscript for publication. AD, the originator of the NRF family of nutrient density scores, has received grants, contracts, honoraria, and consulting fees from numerous food and beverage companies and other commercial and nonprofit entities with interest in nutrient profiling of foods.
References
1. Drewnowski A. Concept of a nutritious food: toward a nutrient density score. Am J Clin Nutr. (2005) 82:721–32. doi: 10.1093/ajcn/82.4.721
2. Drewnowski A. The nutrient rich foods index helps to identify healthy, affordable foods. Am J Clin Nutr. (2010) 91:1095–101. doi: 10.3945/ajcn.2010.28450D
3. Drewnowski A. Uses of nutrient profiling to address public health needs: from regulation to reformulation. Proc Nutr Soc. (2017) 76:220–9. doi: 10.1017/S0029665117000416
4. World Health Organization. Nutrient Profiling: Report of a WHO/IASO Technical Meeting. London (2010). Available online at: https://www.who.int/nutrition/publications/profiling/WHO_IASO_report2010.pdf?ua=1
5. Pan American Health Organization. Pan American Health Organization Nutrient Profile Model. Washington, DC (2016). Available online at: http://iris.paho.org/xmlui/bitstream/handle/123456789/18621/9789275118733_eng.pdf
6. Food Standards Agency. Using Traffic Lights to Make Healthier Choices. Food Stand Agency (2007). Available online at: https://www.resourcesorg.co.uk/assets/pdfs/foodtrafficlight1107.pdf (accessed November 25, 2019).
7. Drewnowski A, Fulgoni VL. Nutrient density: principles and evaluation tools. Am J Clin Nutr. (2014) 99:1223S−8S. doi: 10.3945/ajcn.113.073395
8. Drewnowski A, Maillot M, Darmon N. Testing nutrient profile models in relation to energy density and energy cost. Eur J Clin Nutr. (2009) 63:674–83. doi: 10.1038/ejcn.2008.16
9. Drewnowski A, Maillot M, Darmon N. Should nutrient profiles be based on 100 g, 100 kcal or serving size? Eur J Clin Nutr. (2009) 63:898–904. doi: 10.1038/ejcn.2008.53
10. Department of Health. Nutrient Profiling Technical Guidance. London (2011). Available online at: https://assets.publishing.service.gov.uk/government/uploads/system/uploads/attachment_data/file/216094/dh_123492.pdf
11. U.S. Department of Health and Human Services Food and Drug Administration. A Food Labeling Guide: Guidance for Industry. College Park, MD (2013). Available online at: www.fda.gov/FoodLabelingGuide
12. Drewnowski A, Rehm C, Vieux F. Breakfast in the United States: food and nutrient intakes in relation to diet quality in national health and examination survey 2011–2014. A study from the international breakfast research initiative. Nutrients. (2018) 10:1200. doi: 10.3390/nu10091200
13. KIND. KIND and Public Health Experts File Petition Urging FDA to Address Misleading Nutrient Content Claims. Available online at: https://www.kindsnacks.com/media-center/press-releases/fda-nutrient-content-claims.html (accessed November 25, 2019).
14. The National Law Review. KIND Petitions FDA to Update Nutrient Content Claim Regulations. (2019). Available online at: https://www.natlawreview.com/article/kind-petitions-fda-to-update-nutrient-content-claim-regulations (accessed November 25, 2019).
15. Drewnowski A, Dwyer J, King JC, Weaver CM. A proposed nutrient density score that includes food groups and nutrients to better align with dietary guidance. Nutr Rev. (2019) 77:404–16. doi: 10.1093/nutrit/nuz002
16. Fulgoni V, Drewnowski A. An economic gap between the recommended healthy food patterns and existing diets of minority groups in the US National Health and Nutrition Examination Survey 2013–14. Front Nutr. (2019) 6:37. doi: 10.3389/fnut.2019.00037
17. U.S. Department of Health and Human Services and U.S. Department of Agriculture. Dietary Guidelines for Americans 2015-2020. Washington, DC (2015).
18. Delamaire C, Escalon H, Noirot L. Plan National Nutrition Santé: Recommandations Relatives à L'alimentation, à l'Activité Physique, et à la Sédentarité pour les Adultes. Saint-Maurice (2019). Available online at: www.santepubliquefrance.fr (accessed January 21, 2020).
19. Darmon N, Caillavet F, Joly C, Maillot M, Drewnowski A. Low-cost foods: how do they compare with their brand name equivalents? A French study. Public Health Nutr. (2009) 12:808–15. doi: 10.1017/S1368980008003157
20. USDA Agricultural Research Service. What We Eat In America (WWEIA) Database. (2019) Available online at: https://data.nal.usda.gov/dataset/what-we-eat-america-wweia-database%0D (accessed November 21, 2019).
21. Fulgoni VL, Keast DR, Drewnowski A. Development and validation of the nutrient-rich foods index: a tool to measure nutritional quality of foods. J Nutr. (2009) 139:1549–54. doi: 10.3945/jn.108.101360
22. U.S. Food and Drug Administration. FDA Guidance to Industry - Nutrition Label Reform; New Daily Values For Macronutrients. (2016). Available online at: https://www.fda.gov/media/99059/download (accessed November 25, 2019).
23. U.S. Food and Drug Administration. FDA Guidance to Industry - Nutrition Label Reform; New Daily Values for Nutrients. (2016). Available online at: https://www.fda.gov/media/99069/download (accessed November 25, 2019).
24. Pehrsson P, Haytowitz D, McKillop K, Moore G, Finley J, Fukagawa N. USDA Branded Food Products Database. USDA Agric Res Serv (2018). Available online at: https://data.nal.usda.gov/dataset/usda-branded-food-products-database (accessed November 26, 2019).
25. Code of Federal Regulations, Title 21–Food and Drugs. (2019). Available online at: https://www.accessdata.fda.gov/scripts/cdrh/cfdocs/cfcfr/CFRSearch.cfm?fr=104.5 (accessed January 21, 2020).
26. Commission Notice on the Application of the Principle of Quantitative Ingredients Declaration (QUID) (2017/C 393/05). (2017). Available online at: https://eur-lex.europa.eu/legal-content/EN/TXT/?uri=CELEX:52017XC1121(01)%0D (accessed January 21, 2020).
27. Public Health England. Annex A: The 2018 Review of the UK Nutrient Profiling Model. London (2018). Available online at: https://assets.publishing.service.gov.uk/government/uploads/system/uploads/attachment_data/file/694145/Annex__A_the_2018_review_of_the_UK_nutrient_profiling_model.pdf
28. U.S. Department of Agriculture Food and Nutrition Service. National School Lunch Program and School Breakfast Program: Nutrition Standards for All Foods Sold in School as Required by the Healthy, Hunger-Free Kids Act of 2010; Interim Final Rule. Fed Regist. (2013) 78:39069–120. Available online at: https://www.federalregister.gov/documents/2013/06/28/2013-15249/national-school-lunch-program-and-school-breakfast-program-nutrition-standards-for-all-foods-sold-in
29. Hess JM, Slavin JL. Healthy snacks: using nutrient profiling to evaluate the nutrient-density of common snacks in the United States. J Food Sci. (2017) 82:2213–20. doi: 10.1111/1750-3841.13819
30. Hess JM, Slavin JL. The benefits of defining “snacks.” Physiol Behav. (2018) 193:284–7. doi: 10.1016/j.physbeh.2018.04.019
31. Hess J, Slavin J. Snacking for a cause: nutritional insufficiencies and excesses of U.S. children, A critical review of food consumption patterns and macronutrient and micronutrient intake of U.S. children. Nutrients. (2014) 6:4750–9. doi: 10.3390/nu6114750
32. Drewnowski A, Fulgoni V. Nutrient profiling of foods: creating a nutrient-rich food index. Nutr Rev. (2008) 66:23–39. doi: 10.1111/j.1753-4887.2007.00003.x
33. Lawrence MA, Dickie S, Woods JL. Do nutrient-based front-of-pack labelling schemes support or undermine food-based dietary guideline recommendations? Lessons from the Australian health star rating system. Nutrients. (2018) 10:E32. doi: 10.3390/nu10010032
34. Julia C, Etilé F, Hercberg S. Front-of-pack Nutri-Score labelling in France: an evidence-based policy. Lancet Public Health. (2018) 3:e164. doi: 10.1016/S2468-2667(18)30009-4
36. Environmental Working Group. Nutrition Score Methodology. Available online at: https://www.ewg.org/foodscores/content/methodology-nutrition (accessed November 25, 2019).
37. Gupta S, Hawk T, Aggarwal A, Drewnowski A. Characterizing ultra-processed foods by energy density, nutrient density, and cost. Front Nutr. (2019) 6:1–9. doi: 10.3389/fnut.2019.00070
38. Gamboa-Gamboa T, Blanco-Metzler A, Vandevijvere S, Ramirez-Zea M, Kroker-Lobos MF. Nutritional content according to the presence of front of package marketing strategies: the case of ultra-processed snack food products purchased in Costa Rica. Nutrients. (2019) 11:2738. doi: 10.3390/nu11112738
39. Costa CS, Rauber F, Leffa PS, Sangalli CN, Campagnolo PDB, Vitolo MR. Ultra-processed food consumption and its effects on anthropometric and glucose profile: a longitudinal study during childhood. Nutr Metab Cardiovasc Dis. (2019) 29:177–84. doi: 10.1016/j.numecd.2018.11.003
40. Access to Nutrition Initiative. Global Index 2018: Product Profile. Available online at: https://www.accesstonutrition.org/global-index/key-findings/product-profile (accessed January 21, 2020).
Keywords: nutrient profiling, nutrient-rich food index, ingredient list, dairy, fruit, snacks, WWEIA, food-based dietary guidelines
Citation: Drewnowski A and Richonnet C (2020) Dairy and Fruit Listed as Main Ingredients Improve NRF8.3 Nutrient Density Scores of Children's Snacks. Front. Nutr. 7:15. doi: 10.3389/fnut.2020.00015
Received: 30 November 2019; Accepted: 04 February 2020;
Published: 10 March 2020.
Edited by:
Ellen G. H. M. Van Den Heuvel, FrieslandCampina, NetherlandsReviewed by:
Agnes Agneta Maria Berendsen, Wageningen University & Research, NetherlandsÁine Hennessy, University College Cork, Ireland
Copyright © 2020 Drewnowski and Richonnet. This is an open-access article distributed under the terms of the Creative Commons Attribution License (CC BY). The use, distribution or reproduction in other forums is permitted, provided the original author(s) and the copyright owner(s) are credited and that the original publication in this journal is cited, in accordance with accepted academic practice. No use, distribution or reproduction is permitted which does not comply with these terms.
*Correspondence: Adam Drewnowski, YWRhbWRyZXdAdXcuZWR1