 Lisa Te Morenga
 Simonette R. Mallard2,3†
 Fabiane B. Ormerod
- 1Department of Human Nutrition, University of Otago, Dunedin, New Zealand
- 2Riddet Centre of Research Excellence, University of Otago, Dunedin, New Zealand
- 3Edgar Diabetes and Obesity Research, University of Otago, Dunedin, New Zealand
- 4School of Health, VIC University of Wellington, Wellington, New Zealand
High intakes of added sugar from soft drinks are associated with negative health outcomes such as the increased risk of gout and type 2 diabetes, weight gain and cardiovascular disease. Fruits are naturally high in sugars but their effect on cardiometabolic risk remains unknown. We examined the effect on cardiometabolic risk factors of consuming natural sugars from fruit or added sugars from sugar-sweetened soft drinks in overweight adults. Forty-eight healthy, overweight (BMI ≥ 28 kg/m2) men (n = 21) and women (n = 20) were randomized to either a fruit (n = 19) or sugar-sweetened soft drink (n = 22) intervention for 4 weeks. The fruit group received 6 items of fresh and dried fruit per day and the sugar-sweetened soft drink group received 955 ml of sugar-sweetened soft drink per day. The interventions were matched for both energy (fruit: 1,800 kJ/d; soft drink: 1,767 kJ/d) and fructose content (fruit: 51.8 g/d; soft drink: 51.7 g/d). The soft drink intervention provided 101 g total sugars, which was all added sugar and the fruit intervention provided 97 g total sugars, which were all natural sugars. Dietary intakes were otherwise ad libitum. Despite being asked to consume additional sugar (up to 1,800 additional kJ/d), there were no changes in weight, blood pressure or other cardiometabolic risk factors, except by uric acid, in any of the intervention groups. In conclusion, our findings do not provide any evidence that short-term regular intake of added sugars is linked to higher cardiometabolic risks, with exception of uric acid in overweight men. Public health interventions to prevent obesity and related diseases should focus on the quality of the whole diet rather than only focusing on reducing sugary drinks or sugar intakes.
Introduction
Increased consumption of added or free sugars is associated with increased risk of obesity and related diseases worldwide (1–3). The evidence linking sugar intakes with obesity-related diseases relates largely to the provision of extra calories with causes weight. The World health organization (WHO) recommends that free sugars (all monosaccharides and disaccharides added to foods by the manufacturer, cook or consumer, plus the sugars that are naturally present in honey, syrups and fruit juices) are limited to <10% of daily energy intake (4). This recommendation is mostly based on findings related to dental caries given relatively limited evidence of increased risk of cardiovascular disease or other negative health outcomes. There has been considerable interest in whether the associations between fructose and negative health outcomes are specifically linked with high intakes of fructose (1, 5–7). High fructose intake has indeed been linked with hyperuricemia (8, 9), risk of gout (5), but has not been found to be associated with risk for type 2 diabetes (10). However, fructose is infrequently consumed in the absence of equal amounts of glucose and therefore reduction of free or added sugars tends to be the target of public health interventions (11).
Sugars in the human diet are mostly presented as glucose, fructose, galactose, lactose, and sucrose (12). Sucrose, commonly consumed as table sugar, is a disaccharide constituted by equal parts of fructose and glucose (12). Fructose-containing sweeteners, such as high fructose corn syrup are presented in different forms but contain fructose and glucose in relatively similar proportions to sucrose (13). Added sugars are most commonly consumed globally in the form of sucrose or high fructose syrups which are commonly used to sweeten soft drinks, desserts and bakery items, confectionary, and other processed foods (11, 14).
Fruit is also an important source of dietary sugars glucose and sucrose and particularly, fructose. Chemically the sugars in fruit and added sugars are indistinguishable and the ratio of glucose to fructose equivalents is similar (1:1) (12). This has led to concerns in some quarters that fruit should also be limited. The strongest evidence for limiting fruit comes from studies which have examined the associations between fruit intake, and gout and hyperuricaemia. Generally, observational studies of varied design have indicated a reduced risk of incident gout (5) or experiencing gout attacks (15) with higher fruit consumption. Contrary to these findings, in an analysis of the Health Professionals Follow-up Study (n = 46,393 men), higher fruit juice and fruit intakes were associated with an increased risk of incident gout after a 12 years follow-up (5). Acute feeding studies in humans involving fruit or fruit juice have also produced mixed results, with an immediate rise in serum uric acid seen after consuming apples (16) or apple juice (17); a lowered plasma urate level after cherry consumption, and no effect of grapes, strawberries or kiwifruit on plasma urate (18). Finally, in a 6 week weight reduction trial, energy-restricted diets providing either a relatively high intake of fructose from fruit (50–70 g/d) or a low amount of fructose (<10–20 g/d) led to significantly lowered serum uric acid concentrations, although no difference was seen between the diets and the reductions in serum uric acid could have been explained by the weight achieved in both interventions (19). However, fruit is high in micronutrients, antioxidants and dietary fiber, and has a relatively low energy density and fruit intake has been associated with a reduced risk of several chronic diseases (9) as well as better glycemic control in people with type 2 diabetes (20). Clearly there is a need for research to clarify whether the sugars naturally found in fruits have similar effects on disease risks as added sugars.
In the present study, we sought to compare the effect of consuming sugars from either whole fruit or sugar sweetened soft drink (soft drink) on serum cardiometabolic risk factors, over 4 weeks, matched for both energy, fructose and total sugars in addition to an ad libitum diet. We hypothesized that due to its more favorable nutritional properties, sugars in fruit would have a more favorable effect on cardiometabolic risk factors than sugars from sugar-sweetened soft drinks.
Materials and Methods
Subjects
In September 2012, overweight men and women were recruited using a local newspaper advertisement and University of Otago, Dunedin, New Zealand email lists. Two-hundred and sixty-seven (267) respondents were assessed via an online survey or telephone interview, 48 of whom appeared to meet inclusion criteria: body mass index (BMI) ≥ 28 kg/m2; aged between 20 and 75 years; no established diabetes, liver or kidney disease, gout or a history of other major chronic illnesses; no diagnosed mental disorders; not currently taking medications affecting blood pressure, blood lipids, blood glucose or mood/mental state; not currently pregnant or breastfeeding; no intolerance to study fruit or fructose; able to remain in Dunedin for the duration of the intervention period; and willing to consume either fruit or soft drink for 4 weeks. Of the 48 respondents invited to attend a screening visit to confirm their eligibility and obtain written informed consent, seven did not meet inclusion criteria. A total of 41 participants were randomized to consume either fruit (n = 19) or soft drink (n = 22). Following randomization, but prior to receiving their allocated beverage, three participants withdrew from the study. One participant in the fruit group moved away from Dunedin midway through the intervention and was lost to follow-up, resulting in a final total of 37 participants (n = 18 fruit; n = 19 soft drink) completing the study by December 2012. This study was approved by University of Otago Human Ethics Committee (Ref: 12/197). The trial was registered with the Australian New Zealand Clinical Trials Registry: ACTRN12612000874819; http://www.anzctr.org.au.
Experimental Protocol
Computer-generated block randomization was stratified by sex (to account for potential differences uric acid in response to treatment), performed before recruitment, and concealed from researchers in sealed, numbered envelopes. After establishing a participant's eligibility at the screening visit, and obtaining written informed consent, the next envelope was opened and the participant's group allocation revealed. Due to the nature of the study the researcher responsible for delivering the interventions, and participants, could not be blinded to group allocation.
Approximately 1–2 weeks after their initial screening visit, participants attended a baseline visit at the Department of Human Nutrition Clinic, University of Otago, Dunedin, New Zealand. Between screening and baseline, and during the final week of the intervention, participants completed a 3-day weighed diet record, recorded on non-consecutive days and including a weekend day. Electronic scales were provided along with written instructions, and a trained researcher verbally explained how to complete the diet records. The researcher was available by email or telephone to answer questions that arose during completion of the diet record. Dietary intakes of macronutrients, fructose; vitamin C; potassium and dietary fiber were determined using Kaiculator dietary assessment software (University of Otago, Dunedin, NZ), which uses the New Zealand food composition database (21). Participants were informed of their group allocation at baseline. Those randomized to fruit were provided with one Cavendish banana (128 g), three Braeburn or Jazz apples (149 g each) and two 14 g boxes of Sunmaid seedless raisins per day. Those assigned to soft drinks were provided with one 355 mL can and one 600 mL bottle of sugar (sucrose) sweetened soft drink (either Coca-Cola or Sprite) per day. The interventions were matched as closely as possible for energy (fruit: 1,800 kJ/d; soft drink: 1,767 kJ/d), fructose (fruit: 51.8 g/d; soft drink: 51.7 g/d), and totals sugars (fruit: 97 g/d soft drink: 101 g/d) content and all participants were instructed to consume their usual diet as normal. Participants collected fruit and soft drinks weekly, and were asked to record daily consumption in a log booklet, and to return empty beverage containers and any unconsumed fruit/beverages on a weekly basis.
Participants attended a clinic at baseline and at the end of study after an overnight (10–12 h) fast. Anthropometric measurements were made by one trained researcher, during which participants wore light clothing and no shoes. Weight to the nearest 0.1 kg, body fat percentage to the nearest 0.1% and BMI to the nearest 0.1 kg/m2 were measured in duplicate using a calibrated Tanita Wedderburn bioimpedance analyzer. Height was measured using a Seca fixed stadiometer, and waist circumference was measured underneath clothing with a non-stretching anthropometric tape according to the International Society for the Advancement of Kinanthropometry protocols (22). Height and waist circumference were measured to the nearest 0.1 cm in duplicate, or in triplicate if measurements differed by >0.5 cm or >1%, respectively. Seated blood pressure was measured after a 5 min rest in triplicate using an Omron digital blood pressure monitor in mm Hg. Fasting blood samples (8 mL) were drawn by a research nurse using ethylenediaminetetraacetic acid (EDTA)-treated vacutainers. Blood samples were kept at <4°C for ~1 h, then centrifuged at 1,650 g for 15 min. Plasma samples were then frozen in polyethylene cryovials at −80°C until analysis.
Laboratory Analysis
Plasma insulin was measured using a specific electrochemiluminescence immunoassay for the Elecsys analyzer (Roche Diagnostics, Mannheim, Germany), with a coefficient of variation (CV) of 1.1%. Total cholesterol (CV: 1.0%), triglyceride (CV: 0.9%), glucose (CV: 0.8%), and plasma uric acid (CV: 0.9%) concentrations were measured enzymatically with kits and calibrators supplied by Roche Diagnostics on a Cobas Mira analyzer (Roche Diagnostics). High-density lipoprotein (HDL; CV: 1.5%) was measured in the supernatant after precipitation of apolipoprotein B-containing lipoproteins with phosphotungstate/magnesium chloride solution (23). Low-density lipoprotein (LDL) was calculated using the Friedewald equation (24). High sensitivity C-reactive protein (CRP) was measured using a latex-enhanced immunoturbidimetric method (Roche Diagnostics) with a CV of 6.4%.
Statistical Analysis
The primary outcome measure was serum uric acid and insulin sensitivity measured by the McAuley Index (25). Using an estimated change in mean plasma uric acid of 50 μmol/L (SD of 75 μmol/L) and a correlation between repeated measures of 0.75 (26), it was estimated that 15 participants per group would be required for analysis of covariance (ANCOVA) with one baseline and one follow-up measurement, at 80% power and alpha = 0.05. To allow for attrition, n = 40 was the overall recruitment goal.
Change in body composition and clinical measures from baseline to week 4 were compared within treatment groups using Student's t-tests. Data were checked for normality and equal variance, with non-normal data compared using Mann–Whitney tests, and data with unequal variance compared using Welch's t-tests. The effect of treatment on body composition and clinical measures was analyzed by ANCOVA with baseline values as a covariate. Other participant characteristics likely to affect outcomes (baseline BMI and age) and a potential interaction effect (sex by group) were included as covariates individually, and those with a P < 0.25 were retained in the final model. All analyses were conducted using Stata 11.1 (Stata Corporation 2010, College Station, Texas, United States), and a two-sided 0.05 level of significance was used in all cases.
Results
Table 1 summarizes baseline characteristics of participants randomized to treatment. Thirty-seven participants completed the study, 19 in the fruit group, and 18 in the soft drink group. Nine women completed each intervention. Participants had a mean age of 33.2 years and 54% were obese with mean BMI of 31.4 kg/m2.
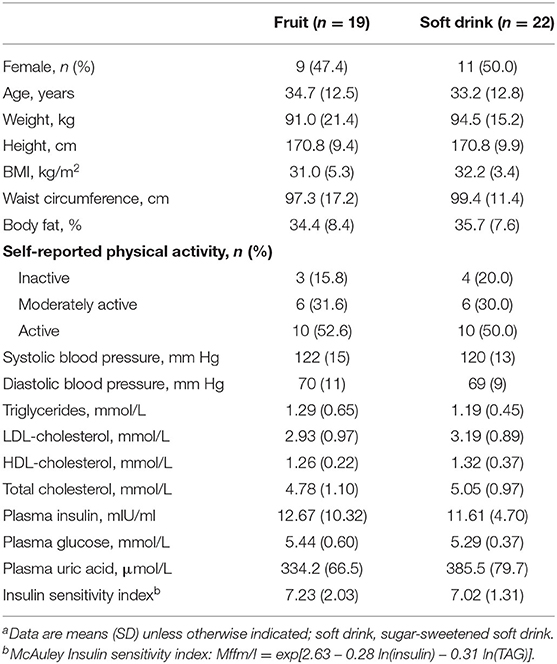
Table 1. Baseline demographic and clinical measures of participants randomized to fruit or soft drinka.
There were no significant differences in total energy, carbohydrate, total sugars and glucose intakes between treatments (Table 2). However, sucrose intake was higher in the soft drink group, and fructose intake was higher in the fruit group amongst women only. The fruit group also consumed significantly more dietary fiber during treatment. On average participants in the fruit group consumed 92% of the fruit provided (5.5 items per day) and participants in the soft drink group consumed 94% of the beverages provided (900 ml per day).
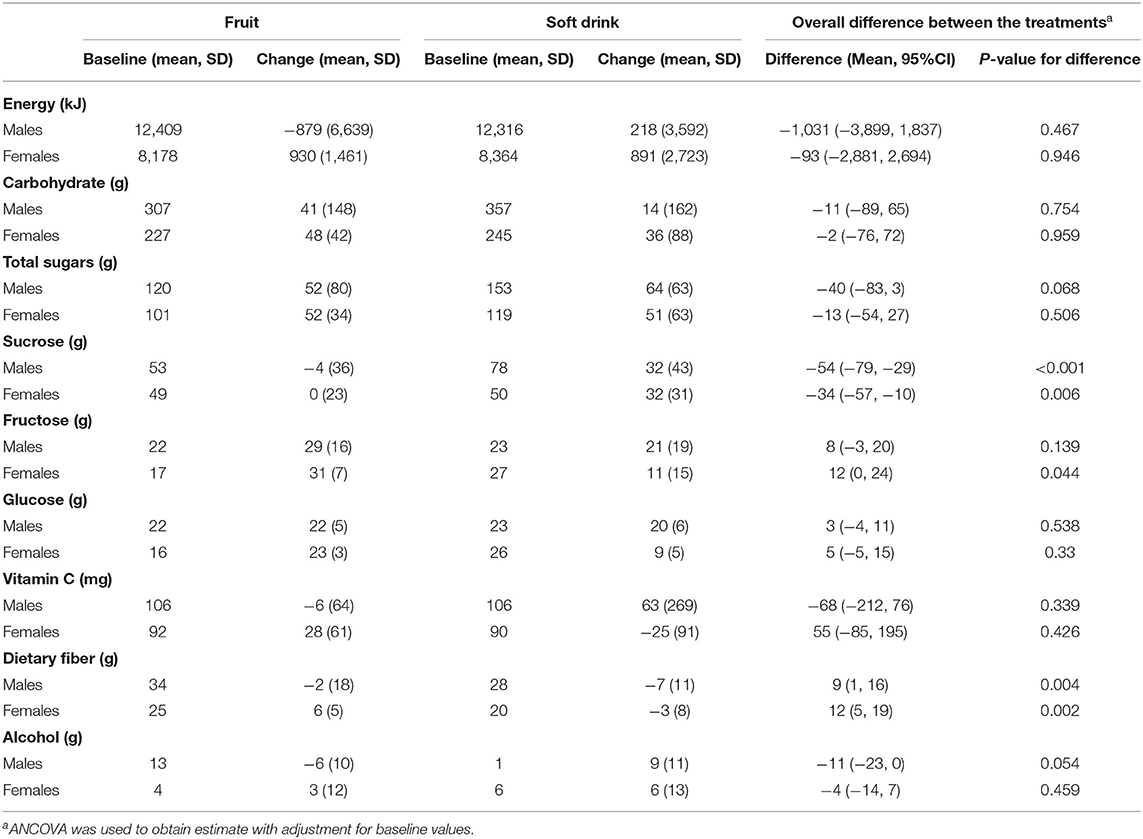
Table 2. Change in dietary intake from baseline to week 4 and difference between treatments.
There were no overall significant differences in the effects of treatment on cardiometabolic variables or body composition (Table 3). However, there was a significant sex by treatment interaction (P = 0.032) for serum uric acid. Amongst men uric acid was 57 μmol/L higher in those in the soft drink group (P = 0.008) but there was no effect in women. There was also a significant sex interaction (P = 0.034) for insulin sensitivity index. Insulin sensitivity declined amongst men and increased amongst women in the soft drink group compared with the fruit groups but the differences between treatments were not significant for men or for women. In a multivariate adjusted model examining the effect of treatment on serum uric acid soft drink treatment (P = 0.001), baseline BMI (P < 0.001) and increased alcohol intake (P = 0.032) were associated with higher uric acid while female sex (P = 0.002) was associated with lower uric acid (Table 4).
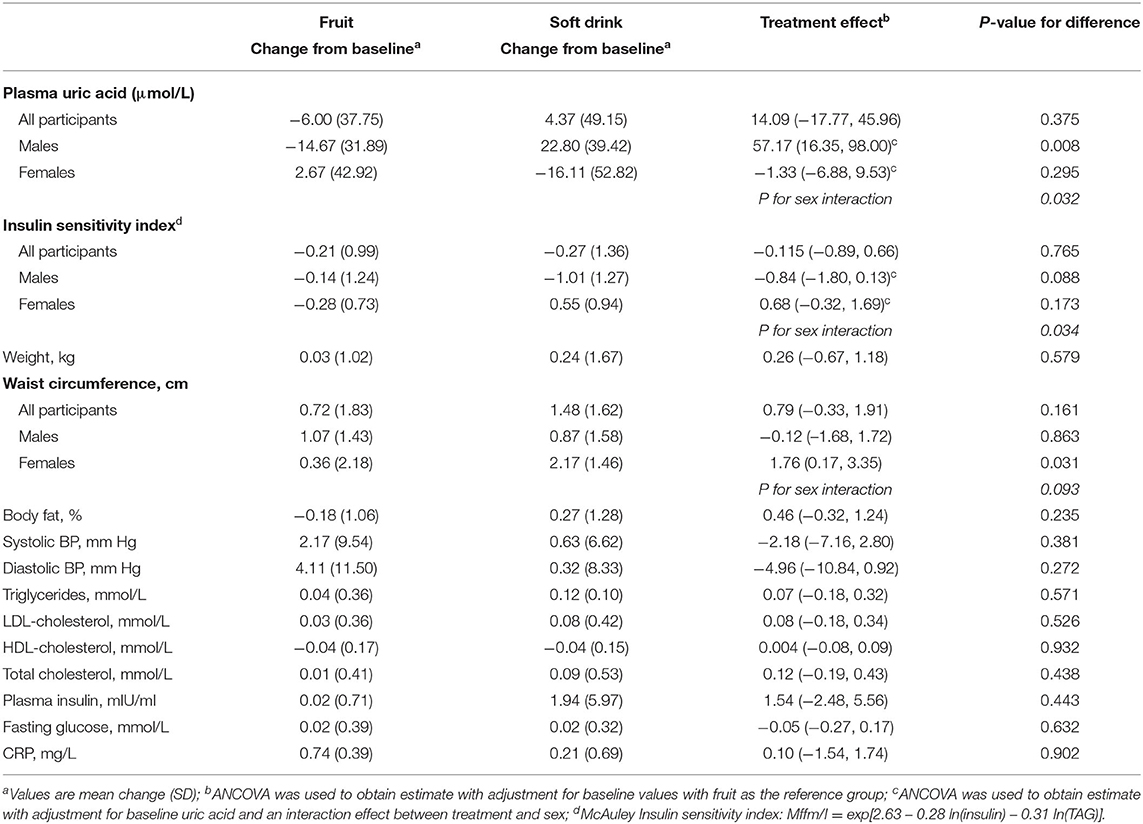
Table 3. Change in body composition and clinical measures from baseline to week 4 and difference between treatments.
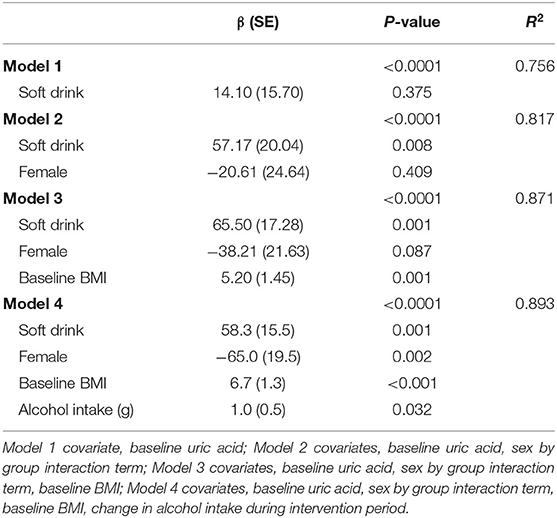
Table 4. Multivariate analysis of covariance of the effect of treatment and confounding variables on uric acid at week 4.
Discussion
We found that amongst overweight people increasing sugars intake either in the form of added sugars in soft drinks, or natural sugars from fruit did not lead to any deleterious changes in body weight or cardiometabolic risk factors and with no difference in effects between the two interventions. The absence of any change in weight despite being provided with additional energy from sugars (~1,800 kJ/d) in the form of fruit or soft drinks suggest that participants sub-consciously moderated their overall food intake to compensate. In a post-hoc analysis, we did find that consumption of soft drink resulted in a non-significant rise in plasma uric acid levels among men, while intake of an equivalent amount of fruit did not, with the difference between interventions being statistically significant. This research suggests that health promotion strategies to reduce the prevalence of non-communicable diseases must consider more than simply recommending the replacement of added sugars with fruit.
The finding that participants did not gain weight as a result being asked to consume additional sugar on a daily basis for 4 weeks was surprising. Many previous studies that have reported that participants gain weight when provided with sugar sweetened foods and drinks in addition to their usual diets, in an ad libitum context (2). We recruited participants that were willing to increase their sugars intake and were therefore likely to be relatively unconcerned about gaining weight. Evidence suggests that these type of participants may be more responsive to appetite and satiety cues than participants who are worried about gaining weight (27). However, if our study had been conducted over a longer period of time it is possible that we may have observed weight gain as our participants became habituated to a higher sugar intakes.
Our study has suggests that fructose intake from whole fruit may be handled differently by the body than added sugars from soft drinks leading to the observed rise in uric acid amongst men (7). However, it is also conceivable that differences in alcohol intake, which increased more in the soft drink group, might also explain the effect. Nevertheless fruit is important as fruit provides many beneficial dietary components, and those that would try to restrict fruit on the basis of its high fructose or sugars content would therefore reduce intake of these beneficial nutrients unnecessarily.
In this study the difference in plasma uric acid of 57 μmol/L between treatments amongst males is not only statistically significant, but is also large enough to be of clinical importance in the etiology of gout. While this was not a mechanistic study, potential reasons for the difference in uric acid between male groups should be explored. Firstly, it is not surprising that no difference in plasma uric acid was seen between female intervention groups, as high plasma uric acid levels and gout are characteristically more prevalent among men (28). During the intervention period, fiber intake was significantly higher among men and women consuming fruit (by 9–12 g/d), while total energy intake appeared higher (~1,000 kJ/d) among males consuming soft drinks. Thus, it is possible that fruit, due to its high fiber content, was more satiating and therefore conferred a reduced overall energy intake among men, leading to a lower plasma uric acid level. If continued longer, this difference in energy intake between male groups may have resulted in a significant difference in weight gain. The intrinsic fiber content of fruit may also have slowed the digestion rate of fructose, producing portal fructose concentrations that did not exceed the capacity of the small intestine and liver to metabolize fructose via routes other than those resulting in uric acid production (29–31). In addition, the fruit was consumed on average over 4 occasions per day (1.5 items/occasion) compared with 1.5 occasions for soft drink, further reducing the bolus dose of fructose consumed. When fructose is consumed in conjunction with glucose, as is the case in sugar-sweetened soft drinks, its absorption is enhanced (31) and it is unable to be metabolized down the glycogenic pathway, which is occupied by glucose (32).
A further possibility is that the higher vitamin C content of fruit reduced the effect of fructose on plasma uric acid levels. In a meta-analysis of 13 vitamin C supplementation studies reporting serum uric acid levels, a statistically significant mean reduction in serum uric acid of 21 μmol/L was observed with a median supplementary intake of 500 mg/d vitamin C (33). In this study, however, fruits with low vitamin C contents were chosen, and the difference in vitamin C intakes, although not significantly different, appeared higher in men receiving the soft drink treatment.
A strength of this study is that the amount of additional total sugars (~100 g/d) and fructose (~50 g/d) participants were required to consume was within the range consumed by populations, a factor often neglected in studies of this kind (34, 35). The average American consumes ~75 g/d of fructose (36) while the median usual daily intake of total sugars in NewZealand is ~120 g for males and 96 g for females (37). The fact that we did not observe the weight gain or other cardiometabolic effects observed in other studies (2, 3) suggests that public health approaches to reducing population obesity focusing only on reducing sugary drink intake may not be particularly effective and should focus on improving the quality of population diets as a whole.
Several factors limit the interpretation of the current study. While it is important to note that a meaningful difference in plasma uric acid in men was observed without evidence of a difference in weight gain, this study was underpowered to detect such a difference. In addition, it is possible that the intervention was not of sufficient duration to see an effect of soft drink consumption on other cardiometabolic risk factors also thought to be elevated by high fructose intakes and associated with hyperuricaemia (7, 31). A further, appropriately powered, longer-term study in overweight men is therefore warranted.
Data Availability Statement
The original contributions presented in the study are included in the article/supplementary material, further inquiries can be directed to the corresponding author/s.
Ethics Statement
This study was approved by University of Otago Human Ethics Committee (Ref: 12/197). The trial was registered with the Australian New Zealand Clinical Trials Registry: ACTRN12612000874819; http://www.anzctr.org.au. The patients/participants provided their written informed consent to participate in this study.
Author Contributions
LT designed the research and had primary responsibility for the final content. SM conducted the research. LT, SM, and FO performed the statistical analysis and wrote the manuscript. All authors have read and approved the final manuscript.
Funding
This research was funded by a University of Otago Research Grant and the Riddet Center of Research Excellence.
Conflict of Interest
The authors declare that the research was conducted in the absence of any commercial or financial relationships that could be construed as a potential conflict of interest.
References
1. Choo VL, Viguiliouk E, Mejia SB, Cozma AI, Khan TA, Ha V, et al. Food sources of fructose-containing sugars and glycaemic control: systematic review and meta-analysis of controlled intervention studies. BMJ. (2018) 363:k4644. doi: 10.1136/bmj.k4644
2. Te Morenga L, Mallard S, Mann J. Dietary sugars and body weight: systematic review and meta-analyses of randomised controlled trials and cohort studies. BMJ. (2013) 346:e7492. doi: 10.1136/bmj.e7492
3. Te Morenga LA, Howatson AJ, Jones RM, Mann J. Dietary sugars and cardiometabolic risk: systematic review and meta-analyses of randomized controlled trials of the effects on blood pressure and lipids. Am J Clin Nutr. (2014) 100:65–79. doi: 10.3945/ajcn.113.081521
5. Choi HK, Curhan G. Soft drinks, fructose consumption, and the risk of gout in men: prospective cohort study. BMJ. (2008) 336:309–12. doi: 10.1136/bmj.39449.819271.BE
6. Choi JWJ, Ford ES, Gao X, Choi HK. Sugar-sweetened soft drinks, diet soft drinks, and serum uric acid level: the Third National Health and Nutrition Examination Survey. Arthritis Rheum. (2008) 59:109–16. doi: 10.1002/art.23245
7. Johnson RJ, Segal MS, Sautin Y, Nakagawa T, Feig DI, Kang DH, et al. Potential role of sugar (fructose) in the epidemic of hypertension, obesity and the metabolic syndrome, diabetes, kidney disease, and cardiovascular disease. Am J Clin Nutr. (2007) 86:899–906. doi: 10.1093/ajcn/86.4.899
8. Gao X, Qi L, Qiao N, Choi HK, Curhan G, Tucker KL, et al. Intake of added sugar and sugar-sweetened drink and serum uric acid concentration in US men and women. Hypertension. (2007) 50:306–12. doi: 10.1161/HYPERTENSIONAHA.107.091041
9. Lin WT, Huang HL, Huang MC, Chan TF, Ciou SY, Lee CY, et al. Effects on uric acid, body mass index and blood pressure in adolescents of consuming beverages sweetened with high-fructose corn syrup. Int J Obes. (2013) 37:532–9. doi: 10.1038/ijo.2012.121
10. Tsilas CS, de Souza RJ, Mejia SB, Mirrahimi A, Cozma AI, Jayalath VH, et al. Relation of total sugars, fructose and sucrose with incident type 2 diabetes: a systematic review and meta-analysis of prospective cohort studies. CMAJ. (2017) 189:E711–E20. doi: 10.1503/cmaj.160706
11. Popkin BM, Hawkes C. Sweetening of the global diet, particularly beverages: patterns, trends, and policy responses. Lancet Diabetes Endocrinol. (2016) 4:174–86. doi: 10.1016/S2213-8587(15)00419-2
12. Mann J, Cummings J, Englyst H, Key T, Liu S, Riccardi G, et al. FAO/WHO scientific update on carbohydrates in human nutrition: conclusions. Eur J Clin Nutr. (2007) 61:S132–S7. doi: 10.1038/sj.ejcn.1602943
13. White JS. Straight talk about high-fructose corn syrup: what it is and what it ain't. Am J Clin Nutr. (2008) 88:1716S−21S. doi: 10.3945/ajcn.2008.25825B
14. Khan TA, Sievenpiper JL. Controversies about sugars: results from systematic reviews and meta-analyses on obesity, cardiometabolic disease and diabetes. Eur J Nutr. (2016) 55:25–43. doi: 10.1007/s00394-016-1345-3
15. Nakagawa T, Lanaspa MA, Johnson RJ. The effects of fruit consumption in patients with hyperuricaemia or gout. Rheumatology (Oxford). (2019) 58:1133–41. doi: 10.1093/rheumatology/kez128
16. Lotito SB, Frei B. The increase in human plasma antioxidant capacity after apple consumption is due to the metabolic effect of fructose on urate, not apple-derived antioxidant flavonoids. Free Radic Biol Med. (2004) 37:251–58. doi: 10.1016/j.freeradbiomed.2004.04.019
17. Godycki-Cwirko M, Krol M, Krol B, Zwolinska A, Kolodziejczyk K, Kasielski M, et al. Uric acid but not apple polyphenols is responsible for the rise of plasma antioxidant activity after apple juice consumption in healthy subjects. J Am Coll Nutr. (2010) 29:397–406. doi: 10.1080/07315724.2010.10719857
18. Jacob RA, Spinozzi GM, Simon VA, Kelley DS, Prior RL, Hess-Pierce B, et al. Consumption of cherries lowers plasma urate in healthy women. T J Nutr. (2003) 133:1826–9. doi: 10.1093/jn/133.6.1826
19. Madero M, Arriaga JC, Jalal D, Rivard C, McFann K, Perez-Mendez O, et al. The effect of two energy-restricted diets, a low-fructose diet versus a moderate natural fructose diet, on weight loss and metabolic syndrome parameters: a randomized controlled trial. Metabolism. (2011) 60:1551–9. doi: 10.1016/j.metabol.2011.04.001
20. Christensen AS, Viggers L, Hasselström K, Gregersen SJ. Effect of fruit restriction on glycemic control in patients with type 2 diabetes-a randomized trial. Nutr J. (2013) 12:29. doi: 10.1186/1475-2891-12-29
21. Plant and Food Research and Ministry of Health (NZ). New Zealand Food Composition Database from Ministry of Health (NZ) and the New Zealand Institute for Plant and Food Research. Available online at: http://www.foodcomposition.co.nz/ (accessed June 15, 2021).
22. Stewart A, Marfell-Jones M, Olds T, Ridder H. International Standards for Anthropometric Assessment. Lower Hutt: ISAK.
23. Assmann G, Schriewer H, Schmitz G, Hagele EO. Quantification of high-density-lipoprotein cholesterol by precipitation with phosphotungstic acid/MgCl2. Clin Chem. (1983) 29:2026–30. doi: 10.1093/clinchem/29.12.2026
24. Friedewald WT, Levy RI, Fredrickson DS. Estimation of the concentration of low-density lipoprotein cholesterol in plasma, without use of the preparative ultracentrifuge. Clin Chem. (1972) 18:499–502. doi: 10.1093/clinchem/18.6.499
25. McAuley KA, Williams SM, Mann JI, Walker RJ, Lewis-Barned NJ, Temple LA, et al. Diagnosing insulin resistance in the general population. Diabetes Care. (2001) 24:460–4. doi: 10.2337/diacare.24.3.460
26. McAuley KA, Smith KJ, Taylor RW, McLay RT, Williams SM, Mann JI. Long-term effects of popular dietary approaches on weight loss and features of insulin resistance. Int J Obes. (2006) 30:342–9. doi: 10.1038/sj.ijo.0803075
27. Johnson F, Pratt M, Wardle J, Johnson F, Pratt M, Wardle J. Dietary restraint and self-regulation in eating behavior. Int J Obes. 36, 665–674. doi: 10.1038/ijo.2011.156
28. Smith EUR, Diaz-Torne C, Perez-Ruiz F, March LM. Epidemiology of gout: an update. Best Pract Res Clin Rheumatol. (2010) 24:811–27. doi: 10.1016/j.berh.2010.10.004
29. Jang C, Hui S, Lu W, Cowan AJ, Morscher RJ, Lee G, et al. The small intestine converts dietary fructose into glucose and organic acids. Cell Metab. (2018) 27:351–61. doi: 10.1016/j.cmet.2017.12.016
30. Ludwig DS. Examining the health effects of fructose. JAMA. (2013) 310:33–4. doi: 10.1001/jama.2013.6562
31. Tappy L, Le KA. Metabolic effects of fructose and the worldwide increase in obesity. Physiol Rev. (2010) 90:23–46. doi: 10.1152/physrev.00019.2009
32. Hudgins LC, Parker TS, Levine DM, Hellerstein MK. A dual sugar challenge test for lipogenic sensitivity to dietary fructose. J Clin Endocrinol Metab. (2011) 96:861–8. doi: 10.1210/jc.2010-2007
33. Juraschek SP, Miller ER 3rd, Gelber AC. Effect of oral vitamin C supplementation on serum uric acid: a meta-analysis of randomized controlled trials. Arthritis Care Res (Hoboken). (2011) 63:1295–306. doi: 10.1002/acr.20519
34. Wang DD, Sievenpiper JL, de Souza RJ, Chiavaroli L, Ha V, Cozma AI, et al. The effects of fructose intake on serum uric acid vary among controlled dietary trials. J Nutr. (2012) 142:916–23. doi: 10.3945/jn.111.151951
35. White JS. Challenging the fructose hypothesis: new perspectives on fructose consumption and metabolism. Adv Nutr. (2013) 4:246–56. doi: 10.3945/an.112.003137
36. Vos MB, Kimmons JE, Gillespie C, Welsh J, Blanck HM. Dietary fructose consumption among US children and adults: the Third National Health and Nutrition Examination Survey. Medscape J Med. (2008) 10:160.
Keywords: fructose, fruit, sugar, cardiometabolic risk, sugar-sweetened soft drink, beverage, dietary intervention
Citation: Te Morenga L, Mallard SR and Ormerod FB (2021) No Effect of Added Sugars in Soft Drink Compared With Sugars in Fruit on Cardiometabolic Risk Factors: Results From a 4-Week, Randomized Controlled Trial. Front. Nutr. 8:636275. doi: 10.3389/fnut.2021.636275
Received: 01 December 2020; Accepted: 02 June 2021;
Published: 30 June 2021.
Edited by:
Anette E. Buyken, University of Paderborn, GermanyReviewed by:
Emily Sonestedt, Lund University, SwedenJennie Cecile Brand-Miller, The University of Sydney, Australia
Copyright © 2021 Te Morenga, Mallard and Ormerod. This is an open-access article distributed under the terms of the Creative Commons Attribution License (CC BY). The use, distribution or reproduction in other forums is permitted, provided the original author(s) and the copyright owner(s) are credited and that the original publication in this journal is cited, in accordance with accepted academic practice. No use, distribution or reproduction is permitted which does not comply with these terms.
*Correspondence: Lisa Te Morenga, bC50ZW1vcmVuZ2FAbWFzc2V5LmFjLm56
†These authors have contributed equally to this work and share first authorship