 Cristina López-Ibarra1Felipe de Jesús Ruiz-López1
 Minerva Bautista-Villarreal2
 Juan Gabriel Báez-González2Beatriz Adriana Rodríguez Romero3Blanca Edelia González-Martínez1Manuel López-Cabanillas Lomelí1
 Jesús Alberto Vázquez-Rodríguez1*
- 1Laboratorio de Alimentos, Centro de Investigación en Nutrición y Salud Pública, Facultad de Salud Pública y Nutrición, Universidad Autónoma de Nuevo León, Monterrey, Mexico
- 2Departamento de Alimentos, Facultad de Ciencias Biológicas, Universidad Autónoma de Nuevo León, Monterrey, Mexico
- 3Centro de Investigación y Desarrollo en la Industria Alimentaria, Facultad de Agronomía, Universidad Autónoma de Nuevo León, Monterrey, Mexico
The tepary bean (Phaseolus acutifolius Gray) is a US–Mexico frontier native crop, produces high yields in agriculture, and needs to be reconsidered because of its nutritional and functional properties. This study aimed to determine the technological and nutritional properties of flours and protein concentrates of tepary bean, besides determining an in silico agonist effect of tepary bean lectin to peroxisome proliferator-activated receptor gamma (PPAR-γ). We evaluated the technological properties of raw samples (tepary flour and tepary protein concentrate) and cooked samples (tepary flour and tepary protein concentrate). The flours present a significant difference (p < 0.05) concerning protein concentrates in water absorption and oil absorption capacity. The raw samples' emulsifying capacity was higher than that reported in the literature for other legumes, but not the cooked samples. The samples' foaming capacity had no significant difference in treatments (p > 0.05), and cooked tepary bean protein concentrate presented complete gelation at a lower concentration (2%). Nutritionally, raw samples present a protein percentage of 23.46 ± 0.06 and 71.38 ± 0.44 and cooked samples present a protein percentage of 25.27 ± 0.04 and 62.69 ± 0.14; a chemical score of 72, 86, 82, and 72; in vitro protein digestibility (%) = 48.20 ± 0.31, 49.80 ± 0.80, 61.77 ± 1.70, and 63.61 ± 4.19; and C-PER = 0.86, 1.34, 1.93, and 1.81, respectively. All the samples showed methionine + cysteine as the limiting amino acid. All these nutritional data are very similar to the common bean (Phaseolus vulgaris). SDS-PAGE preserves the lectin fraction in both protein concentrates. The in silico study of tepary lectin (PDB: 6tt9) shows that there were seven peptides that presented values below −120 kcal/mol: PEW, VSVGF, PSQK, TTPW, ATSF, ITY, and TSF, with VSVGF, PSQK, and PEW having the highest affinity for active sites of the PAPRγ receptor (binding energies from −5.32 to −7.04 kcal/mol). These peptides could show antiadipogenic or antidiabetic activity based on the intermolecular bond energies and open an interesting research item.
Introduction
The chemical composition of foods defines their structure, organoleptic properties, and bioavailability of macro- and micronutrients. Some foods such as grains and legumes can be processed into ingredients and used to develop new products. In recent years, the beneficial relationship of increased consumption of plant-based protein and the decrease or prevention of various pathologies such as obesity, cancer, and hypertension, compared to the intake of a typical omnivorous diet, has been ratified (1–4). Tepary bean (Phaseolus acutifolius Gray) is a species native to Mexico, grown mainly in the USA–México frontier and Sinaloa state, cultivated principally for self-consumption (5). P. acutifolius is an edible bean and naturally adapted to arid and semi-arid conditions. It is resistant to adverse agronomic conditions such as high concentrations of salt, limited water conditions, pests, and microorganisms that affect the common bean. Also, the tepary bean has similar nutritional and technological characteristics to cowpeas and chickpeas (6). Furthermore, tepary bean proteins, specifically lectin fraction, have shown functional effects vs. cancer lines in vitro and in vivo studies (7–9). Due to this, it is of utmost importance to study other possible beneficial health effects of tepary bean lectins, such as the effect on regulatory mechanisms of obesity, a global epidemic. One of the most studied mechanisms is that of peroxisome proliferation factors (PPARs), especially PPAR-γ. PPAR-γ is responsible for regulating the gene expression of enzymes involved in the storage of fatty acids in adipose tissue, such as acyl-CoA synthase, lipoprotein lipase, and phosphoenolpyruvate carboxykinase (10). PPAR-γ is principally involved in lipogenesis, adipocyte differentiation, cell proliferation, and insulin sensitivity (11). Recently, it has been seen as a therapeutic target for the treatment of metabolic disorders such as diabetes and dyslipidemia. However, the drugs have side effects such as edema and congestive heart failure (12); therefore, the search for natural agents that present an agonist effect in PPAR-γ is of utmost importance. This study aimed to determine the technological and nutritional properties of protein concentrates of tepary bean, besides determining an in silico agonist effect of tepary bean lectin to peroxisome proliferator-activated receptor gamma (PPAR-γ) for the identification of antiadipogenic compounds (13).
Materials and Methods
Biological Material
The seeds of white tepary bean (P. acutifolius) were cultivated and harvested in 2017 (Faculty of Agronomy of the Universidad Autónoma de Nuevo León). The dried beans were stored at 4°C and protected from a light until they are processed.
Flour and Protein Concentrate Obtainment
For the production and analysis of cooked bean flour, 100 g of raw tepary bean seeds was cleaned and soaked in 200 mL of distilled water for 4 h at room temperature. Subsequently, the cooking process was at 100°C for 1 h. Once cooked, they were dried in the oven (Shel Lab model SMO3, Cornelius, USA) at 65°C for 4 h and ground (IKA model M20, Wilmington, USA). The dehydrated sample was ground and sieved through mesh number 20 (aperture: 850 μm) to obtain a homogeneous particle size; the sample (CF) was stored in vacuum in polyethylene bags at 4°C (6). The raw tepary bean seeds (RF) were milled (IKA model M20, Wilmington, USA) and went through the same mesh (14). The protein concentrates, cooked (CPC) and raw (RPC), were obtained through 14 with some modifications. We suspended flours (RF and CF) in distilled water at a concentration of 1:6 (w/v) and pH was adjusted to 11 (NaOH 1 M). Subsequently, the samples were agitated for 1 h and filtered through mesh number 80 (180 μm). The remaining suspension was adjusted to pH 4.5 with HCl (1 M) and centrifuged for 12 min at 2,200×g (Hermle model Z 326K, Wehingen, Germany); the precipitate was freeze-dried under conditions of −45°C for 48 h (Labconco model FreeZone 4.5 L, Kansas City, USA) and stored at 4°C.
Physicochemical Characteristics
Water Absorption Capacity and Oil Absorption Capacity
Water absorption capacity (WAC) tests were reported according to Kaur and Singh (15). Three grams of each flour was dispersed in 25 mL of distilled water for 30 min with manual stirring, followed by a 25-min centrifugation period at 1,110×g (Hermle model Z 326K, Wehingen, Germany) at neutral pH and room temperature. We discard the supernatant, and the tubes were in the oven at 50°C for 25 min. The water absorption was measured in milliliters of water per gram of flour sample (mL/g sample). Finally, the sample was reweighed and analyzed. The oil absorption capacity (OAC) was according to Julianti et al. (16) with slight modifications. One gram of sample was suspended in 5 mL of corn oil in a centrifuge tube. The tube was shaken for 1 min at room temperature at neutral pH and then centrifuged at 1,110×g (Hermle model Z 326K, Wehingen, Germany) for 25 min. We discarded the supernatant and the samples were analyzed. The oil absorption was measured in milliliters of oil per gram of flour sample (mL/g sample).
Foaming Capacity
The foaming capacity is expressed as foam in milliliters per 100 mL of sample. Using a homogenizer (IKA model T-50, Wilmington, USA), 1 g of sample and 50 mL of distilled water were mixed into a 100-mL test piece for 5 min. The initial volume of the sample was measured at 0 min and 60 min, verifying the foam presence (17). The foaming capacity is expressed as foam in milliliters per 100 mL of test sample (mL/100 mL).
Emulsion Capacity
One gram of sample with 20 mL of distilled water was mixed at vortex agitation (Labnet model VX-200, Tewksbury, USA) for 15 s in a graduated tube of 50 mL. Later, the pH was adjusted to 7 with NaOH (0.1 N) and HCl (0.1 N), and a volume of 25 mL of distilled water and 25 mL of edible soybean vegetable oil were added and finally shaken for 3 min with a homogenizer (IKA model T-50, Wilmington, USA) and centrifuged at 210×g (Hermle model Z 326K, Wehingen, Germany) for 5 min. The emulsion was expressed in mL/100 mL as the emulsified layer's height concerning the total liquid (18).
Gelation Capacity
In glass tubes with a lid, the sample suspensions [sample concentration of 2, 4, 6, 8, 10, 12, 14, and 16% in distilled water (w/v)] were placed in a water bath at 100°C for 1 h and then allowed to cool to 4°C for 2 h. The results were taken when the tubes were inverted and recorded as complete gelling (+), no gelling (–), and partial gelling (±) (19).
Chemical and Nutritional Characteristics
Proximate Composition
Moisture (925.10), protein (920.06), ash (936.07), dietary fiber (985.29), and fat (920.09) were determined following the approved method of the American Association of Cereal Chemists (20). Carbohydrate was calculated by the difference and energy was calculated by multiplying the protein and carbohydrate by 4 and fat by 9, respectively. The determination of the amino acid score of the samples (CF, RF, CPC, and RPC) was carried out through the method of Vázquez-Ortiz et al. (21). Tryptophan was identified using the method of Dávila and Martínez with Betancur-Ancona modifications (14).
Chemical Score
The most limiting essential amino acid (EAA) in the sample was identified, for which the content of each EAA was compared with that recommended by FAO (3 years and older) (20, 22). The CS was calculated as follows:
Where, CS = chemical score, EAA = essential amino acid, and REAAR = recommended EAA requirement.
Calculated Protein Efficiency Ratio
The C-PER was evaluated according to the AOAC methodology (20). This procedure was based on the in vitro protein digestibility (GIS) and the EAA composition of the different samples (23).
In vitro Digestibility
Simulation of human gastrointestinal digestion (GIS) was conducted in vitro as reported Shim et al. and Xing et al. with some modifications (24, 25). The whole GIS digestion steps were performed sequentially at three phases, at 37°C. The pH was adjusted with HCl or NaOH (4 M) during digestion. We take aliquots at
1. before digestion (0 min);
2. after 1, 5, 30, and 60 min of gastric phase; and
3. after 1, 5, 30, and 120 min of duodenal phase.
After each digestion time, the digested samples were filled with deionized water to 14 mL and then heated in boiling water for 5 min to stop the enzymatic digestions. The digested samples were centrifuged (10,000×g, 20 min, 4°C) except those prepared for particle size distribution. The supernatants were kept frozen at −20°C until use to determine the protein digestibility (%) for Dumas methodology (920.06) (20) and calculated by:
Where IVPD is in vitro protein digestibility, FP is protein percentage at 120 min duodenal phase, and IP is protein percentage at 0 min.
Particle Size Distribution
The analysis of the particle size distribution of the samples from each digestion period was measured by an integrated laser light scattering instrument (Malvern Panalytical, model Mastersizer 3000, Southborough, USA). A value of 1.33 for water was used as a refractive index for the continuous phase. The particle size values were measured as D [4,3] and D [v,0.90], reported to describe 90% of the particles' total number (25).
Electrophoresis (SDS-PAGE)
The total protein of CPC and RPC concentrates was analyzed by denaturing electrophoresis in polyacrylamide gels (SDS-PAGE). Following the method proposed by Laemmli with some modifications (26): 10 mg of each sample was dissolved in 1 mL of sodium dodecyl sulfate solution (SDS, 1% w/v). Five microliters of BenchMark Protein LadderTM was the molecular weight marker. The proteins were separated (Bio-Rad Mini-PROTEAN model 1658000EDM, Hercules, USA) by a vertical electrophoresis chamber in Mini Geles Teo-Tricine SDS 4–12% RunBlueTM for 2 h, at 80 V (1 h) and 100 V (1 h). The separated proteins were stained with staining solution Coomassie R-250 blue (0.1%), 40% methanol, and 10% glacial acetic acid, and gentle stirring for 2.5 h, then faded with a methanol solution (40%). The images were photo-documented and analyzed.
In silico Methodology
In silico Digestibility
The sequence of the lectin protein fraction of tepary bean (P. acutifolius) was from the Protein Data Bank of Europe (https://www.ebi.ac.uk/pdbe/entry/pdb/6tt9/protein/1) (Table 1). In silico hydrolysis process was according to Shi et al. (27). It was performed through the BIOPEP UWM protein database using the digestive proteolytic enzymes pepsin (EC 3.4.23.1), trypsin (EC 3.4.21.4), and chymotrypsin (EC 3.4.21.1).
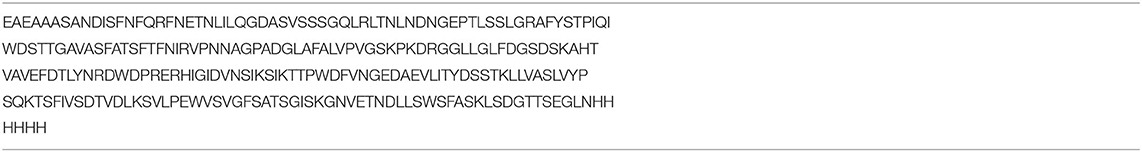
Table 1. The amino acid sequence of the lectin protein in FASTA format from tepary bean (Phaseolus acutifolius).
Ligand Preparation
Peptide preparation was according to Ye et al. (28) with some modifications. The peptides released from the digestive process with lengths between two and five amino acid residues were used for the subsequent tests. First, HPEPDOCK software evaluated the ligand-receptor affinity, considering binding energy of <−120 kcal/mol as high affinity. Later, these high-affinity peptide ligands were converted to SMILES (Simplified molecular-input line-entry system) format using the Dendrimer Builder tool (https://dendrimerbuilder.gdb.tools/) and the Avogadro software to model them, and finally, there was subsequent identification of in silico antiadipogenic activity at the PPARγ receptor. As a control, we used the G3335 and GW9662 molecules. The sequences were from the PubChem database (https://pubchem.ncbi.nlm.nih.gov/).
Receptor Preparation
The PPARγ receptor was extracted in crystallized form from the PDB protein database with the code 3V9V (https://www.rcsb.org/structure/3V9V) (Figure 1). This protein binds to specific regions of the DNA involved, mainly in the process of adipocyte differentiation, in the form of a heterodimer with the retinoid X receptor (RXR). We use the Autodock tools program for the affinity analysis of the ligands in the receptor, with an interaction area centered at 7,745 × 50,606 × 57,552 and with dimensions of X = 70, Y = 40, and Z = 40 with a spacing of 0.375 angstroms (Figure 1) to cover those regions of the PPARγ receptor involved with antiadipogenic effects (Phe264, His266, Ile281, Cys285, Arg288, Ser289, Met348, and His449) (28, 29).
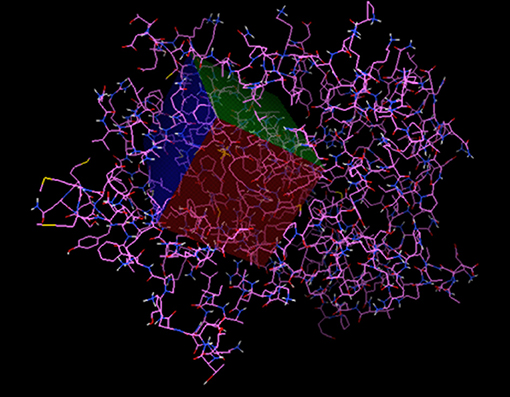
Figure 1. The active region of PPARγ.
Statistical Analysis
Data were expressed as mean ± SD. One-way analysis of variance (ANOVA) was used, and comparison of means was done using Tukey's post hoc test (Minitab version 17, Minitab Inc., State College, PA, USA), and two-factor ANOVA was applied to particle size distribution assay. Means were considered significantly different at p ≤ 0.05. All the analyses were made in triplicate except chemical score, C-PER, in silico analysis (calculated), and particle size distribution (n = 10).
Results
Physicochemical Characteristics
WAC and OAC
The WAC of tepary bean flours at room temperature and neutral pH in RF and CF samples (2.40 ± 0.20 and 2.40 ± 0.20 mL/g sample) and RPC and CPC (1.40 ± 0.00 and 1.46 ± 0.11 mL/g sample) presented a significant difference (p < 0.05) between flours and protein concentrates (Table 2). The opposite occurred with OAC in flour samples (1.26 ± 0.40 and 1.20 ± 0.00 mL/g sample) vs. protein concentrate samples (1.46 ± 0.20 and 1.80 ± 0.40 mL/g sample), showing a significant difference (p ≤ 0.05) with respect to flour samples.
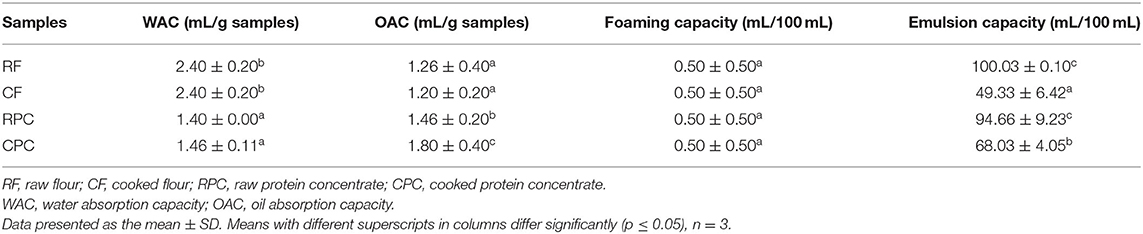
Table 2. Physicochemical properties of tepary bean flours (RF and CF) and protein concentrates (RPC and CPC).
Foaming Capacity
All the samples showed low foaming capacity and stability, with 0.50 mL/100 mL ± 0.50, with no significant difference (p > 0.05) (Table 2).
Emulsion Capacity
RF and RPC (100.03 ± 0.10 and 94.66 ± 9.23 mL/100 mL) had higher emulsifying capacity than CF and CPC samples (49.33 ± 6.42 and 68.03 ± 4.05 mL/100 mL) (Table 2), presenting a significant difference (p ≤ 0.05) between raw and cooked sample groups (Table 2).
Gelation Capacity
CF needed a lower percentage for gelation (2%) and preserved this capacity from 2 to 16%. RF and CPC presented gelation from 8 to 16% and from 12 to 16%, respectively. RF, CPC, and RPC presented partial gelation from 2 to 6%, 2 to 10%, and 6 to 16%, respectively (Table 3).
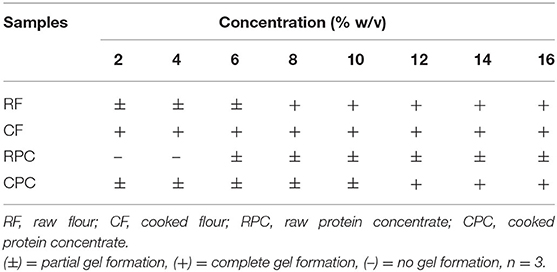
Table 3. Results of gel formation of tepary bean flours (RF and CF) and protein concentrates (RPC and CPC).
Chemical and Nutritional Characteristics
Proximate Composition and Nutritional Properties
RF and CF presented the lowest values for energy, total protein, and total lipids and the highest values for total carbohydrates, with no significant difference (p > 0.05) between them. RPC showed the highest value for total protein (71.38 ± 0.44%), with a significant difference (p < 0.05) from the other samples. CPC presented the highest value of energy (413.85 + 0.91 kcal). All the samples were significantly different (p < 0.05) in energy (Table 4). The limiting EAAA in the four samples was sulfur amino acids (methionine, cysteine), and the C-PER was higher in cooked samples (CF and CPC), with 1.93 and 1.81 vs. 0.86 and 1.34 in raw samples (RF and RPC), respectively (Table 5).
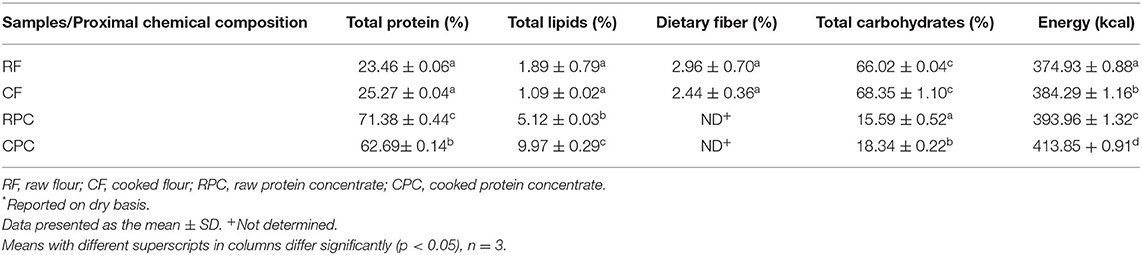
Table 4. Proximal chemical composition of tepary bean flours (RF and CF) and protein concentrates (RPC and CPC)*.
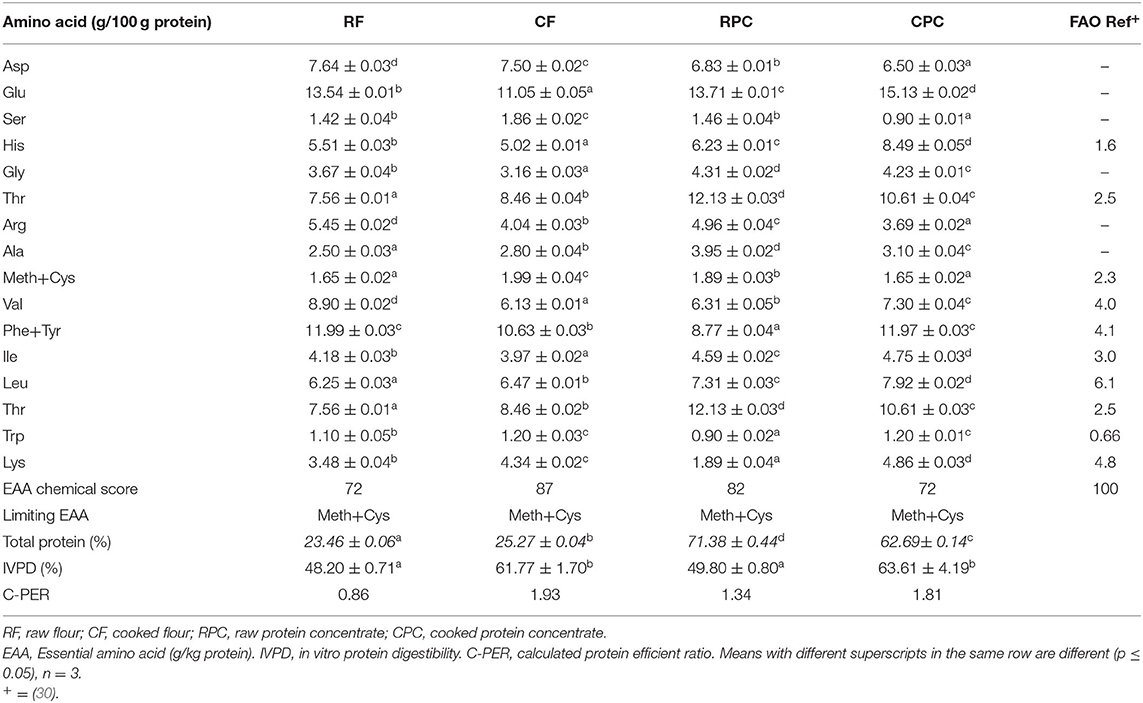
Table 5. Amino acid composition and nutritional evaluation of tepary bean flours (RF and CF) and protein concentrates (RPC and CPC).
GIS and Particle Size Distribution
% IVPD of CF and CPC (61.77 ± 1.70 and 63.61 ± 4.19) are higher than those of RF and RPC (48.20 ± 0.31 and 49.90 ± 0.80), showing a significant difference (p < 0.05); however, the CPC and CF's proximal analysis showed a significant difference (p < 0.05) in the protein percentage (Table 5). The % IVPD difference between RPC and CPC had a variation of 13.81%. The values of 90% of the particles at the duodenal phase for RF and RPC (442.60 ± 1.14 μm and 46.86 ± 0.83 μm) concerning CF and CPC (150.40 ± 0.89 μm and 42.46 ± 0.32 μm) showed that although the flours had a significant difference between treatments (p < 0.05), the protein concentrates did not show a significant difference (p > 0.05) (Table 6).
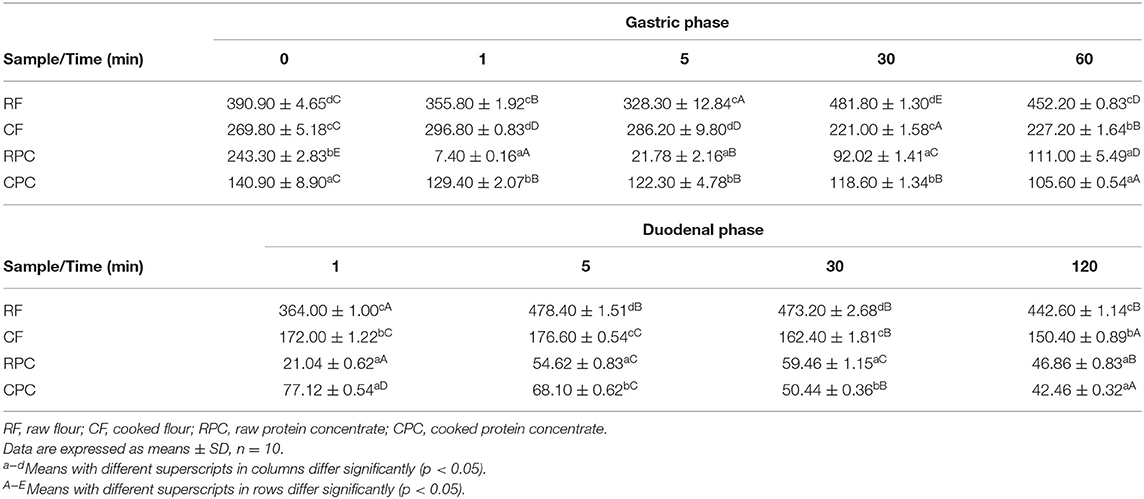
Table 6. Particle size distribution (μm) of 90% of total particles while in vitro protein digestion (IVPD).
Electrophoresis (SDS-PAGE)
Figure 2 shows the tepary bean proteins (RPC and CPC) separated by molecular weight in the presence of SDS. We could observe that the predominant proteins are those whose molecular weight is 50 kDa (phaseolin fraction) and between 20 and 30 kDa (lectin subunit fraction). Also, it showed smaller bands at 15–20 (albumin + globulin), 30–50 (gliadin), and 70–80 (high-molecular-weight glutenin subunit) kDa. Both samples showed electrophoretic patterns and behavior similar to concentrations of 5 μg/μL protein.
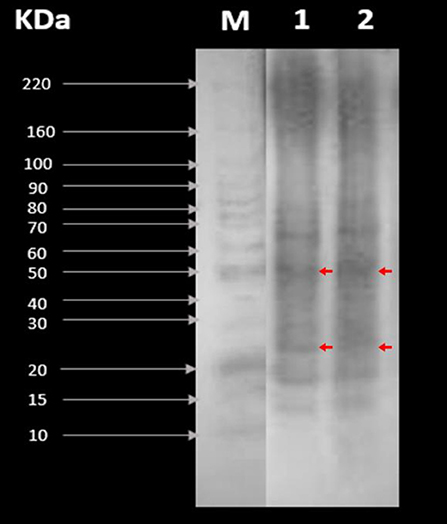
Figure 2. SDS-PAGE patterns of (1) raw protein concentrate (RPC) and (2) cooked protein concentrate CPC. M is the molecular weight marker (control).
In silico Methodology
In silico Digestibility
The proteolytic process used the BIOPEP UWM protein database using the proteolytic enzymes pepsin, trypsin, and chymotrypsin. The peptides released from the proteolytic process are shown in Table 7, in which the peptides with a length between two and five amino acids were the most significant amount released (51.13%), followed by the free amino acids (34.09%), and finally, the peptides with a length of >5 amino acids had the least amount (14.77%). Subsequently, the peptides released from the digestive process with a length between two and five amino acids were evaluated for their affinity score toward the PPARγ receptor using the HPEPEDOCK SERVER® program. There were 45 peptides analyzed, obtaining values between −50.73 and −157.90 kcal/mol, with 7 peptides that had values below −120 kcal/mol, which are high-affinity peptides toward PPARγ (Table 8). Finally, the binding analysis of high-affinity peptides with PPARγ anti-adipogenic regions was carried out with the Autodock tools® program (Figure 3). The results obtained show that the tripeptide PEW, ITY, and TSF obtained a binding energy of −6.38, −5.91, and −4.68 kcal/mol, respectively; the binding sites for PEW were at Ser342; those for ITY were at Met364, His323, and Cys285; and those for the TSF tripeptide were at Cys285 and Ser289. The tetrapeptide PSQK, TTPW, and ATSF, with an energy of −7.04, −5.96, and −3.89 kcal/mol, respectively, were obtained with bonds Ser342, Ile262, and Glu291 for PSQK; Cys285 and Gly284 for TTPW; and Cys285 and Ser342 for the TSF peptide. Finally, the pentapeptide VSVGF obtained a binding energy of −5.97 kcal/mol toward the Glu291 residue (Table 9).
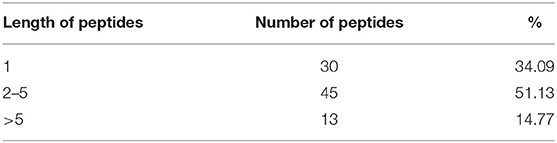
Table 7. In silico hydrolysis of the lectin protein.
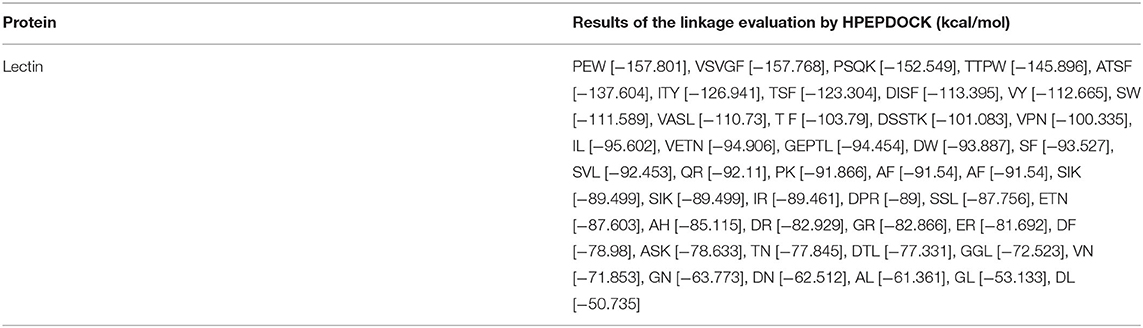
Table 8. Ligand-receptor affinity scores obtained with HPEPDOCK SERVER (kcal/mol).
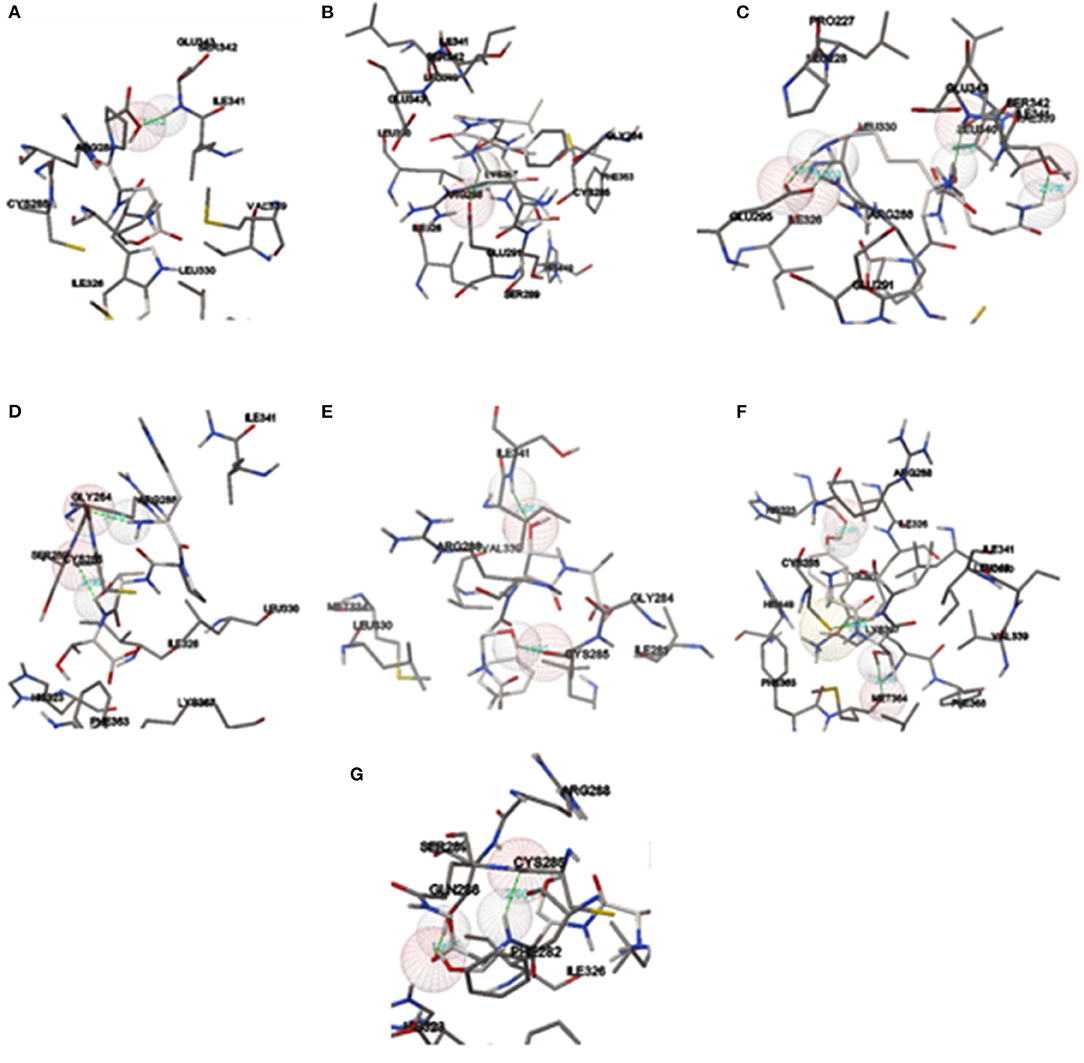
Figure 3. Intermolecular ligand-receptor conjunctions between PPARγ and peptides. (A) ITY, (B) TSF, (C) PEW, (D) PSQK, (E) TTPW, (F) ATSF, and (G) VSVGF.
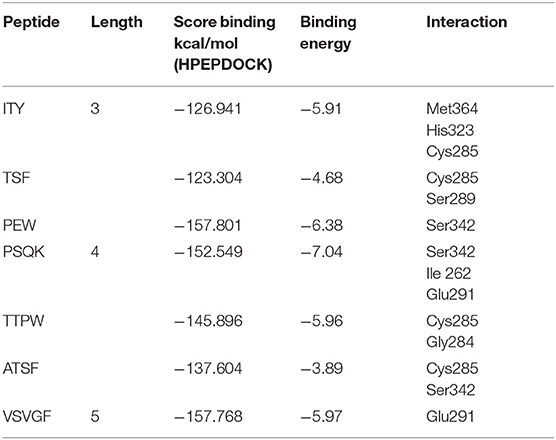
Table 9. Binding energies and bonds of peptides with binding point <−120 kcal/mol in antiadipogenic sites of PPARγ.
Discussion
Physicochemical Characteristics
WAC and OAC
The WAC of tepary bean flours at room temperature and neutral pH presented values similar to the varieties Negro 8025 and Bayo Madero of common bean (Phaseolus vulgaris) reported by Ramírez et al. (31), which had a range of 2.17 to 2.58 mL/g sample. Those samples were cooked and subsequently dehydrated. RPC and CPC had higher values than those reported by Butt and Rizwana (32) for protein isolate of guandu bean (Cajanus cajan) and caupi (Vigna unguiculata) (0.97 ± 0.04 and 1.38 ± 0.09 mL/g sample), but less than those of mung bean (Vigna radiata) and pea (Pisum sativum) (1.63 ± 0.10 and 1.52 ± 0.09 mL/g sample, respectively). The WAC of legumes is a property related to heat treatment, which reduces or increases the speed and amount of hydration, positively affecting the viscosity but could promote microbial growth (31, 33). Besides, the presence of hydrophilic carbohydrates could be responsible for increasing this parameter in flours, compared to the reported values for protein isolates and concentrates. In those, the number of components (protein, starch, fiber) allows to absorb and retain more significant amounts of water (34) and the conformal characteristics and availability of polar amino acids (32). OAC for RF and CF values was lower than that of cargamanto bean and black bean (1.48 ± 0.09 and 1.34 ± 0.11 mL/g sample) (35), but greater than that reported by Ramirez et al. (31) for the Varieties Black 8025 and Bayo Madero of common bean (0.76 to 0.88 mL/g). Butt and Rizwana (32) reported values similar to those obtained for RPC and CPC samples in pea isolates (P. sativum) (1.40 ± 0.08 mL/g sample) and caupi bean (V. unguiculata) (1.45 ± 0.06 mL/g sample). OAC is an essential physicochemical property in food processing and food storage; it influences the entrance and development of oxidative power, determining consumer acceptance and product quality and could be a determinant for hydrophilic groups and polar amino acids on the surface of protein molecules (32, 33).
Foaming Capacity
The results (Table 2) were higher for RF and RPC and similar for CF and CPC samples reported by Siddiq et al. (35) for red kidney, small red kidney, cranberry, and black bean flours (45.7, 38.2, 49.6, and 37.4 mL/100 mL, respectively). They mention factors that affect foaming capacity, such as flour composition, flour particle size, conditions of the process, and interactions between proteins and carbohydrates and between proteins and lipids. The tepary bean's low foaming capacity may be due to the type of protein, a characteristic that could represent an advantage that could increase the quantity and quality of protein in foods without changing their consistency (32, 36).
Emulsion Capacity
RF and RPC had higher emulsifying capacity than CF and CPC samples (Table 2), which resemble the values reported by Siddiq et al. (35) for black bean flour (45.6 ± 1.8 mL/100 mL). In other research, caupi bean protein isolates and chickpea showed lower emulsifying capacities than tepary bean after cooking (flour and protein concentrate) (33). The emulsifying ability is related to the potential to absorb water and oil, reflecting proteins' ability to impart stress resistance and changes over a defined period (33). Heat treatment influences the reduction of this capacity, justifying that raw samples have higher results (19, 34). Also, the increased emulsifying activity of tepary bean samples could be due to the difference in the chemical composition and solubility of the protein, as well as the dissociation and partial deployment of globular proteins, which exposes residues of hydrophobic amino acids and consequently increases surface activity and adsorption in the water and oil interface (33).
Gelation Capacity
Results were lower than other results reported in samples of cargamanto bean flour and black bean, pea protein, or caupi bean isolates (32, 35). Those results differ from research conducted by Gupta et al. (37), where tepary bean varieties did not present gel formation. Gelation capacity is a qualitative parameter that expresses the minimum concentration of protein at which the gel does not slide through the walls of the test tube in an inverted position, affecting the gel and thickness characteristics (38) due to permeability of seed by the thermal process (39). The lower the concentration required, the better the gelling capacity of proteins (35). Gelation capacity is an essential property in puddings, jellies, and batters for fried products (37).
Chemical and Nutritional Characteristics
Proximate Composition and Nutritional Properties
RF and CF showed values similar to those reported by Idouraine et al. (40) for different varieties of tepary beans that grew in the southwestern United States of America and northern Mexico (Table 4). The percentage of protein (23.46 ± 0.06 to 25.27 ± 0.04%) and the rest of the parameters evaluated are in the general range for legumes and other beans varieties, as reported by the Spanish Nutrition Foundation (41). The protein, carbohydrates, and lipids of average cooked bean are below those of the tepary bean, which directly affects the energy content. On the other hand, the percentage of protein in both concentrates was similar to that reported by Betancur-Ancona et al. (14) for Phaseolus lunatus. The presence of sulfured amino acids as a limiting amino acid and the C-PER between 0.86 and 1.93 are similar to those reported in a wide range of legumes and pulses (42). These classify the cooked samples (CF and CPC) as medium-quality protein. The fact that the C-PER relates the GIS value and the EAA means that it may also indicate that the thermal and chemical processing made the samples more accessible to enzymatic action by denaturing (23).
GIS and Particle Size Distribution
The denaturation of the protein and the reduction in amino acid availability are crucial in their evaluation. Proteins could be affected by cross-linking, racemization, and degradation, and formation of complexes with sugar may result in loss of digestibility (43). IVPD and C-PER were similar to those reported by tepary bean in Idouraine et al. and Salas-López et al. (44–46) but not in limiting EAAA. Also, they showed similar values to common bean varieties like black, navy, pinto, and red kidney and fava bean with extrusion, baked, or traditional cooking process (47). These values would increase with a mix of other pulses or grains as QPM maize (43). Samples of raw tepary beans (RF and RPC) showed higher degrees of complexity during digestibility and particle sizes more extensive than those of thermally treated samples (CF and CPC). It was believed that the variation between particle size distribution could explain the enzyme–protein and phenolic compound–protein interaction, even more when tepary bean presents around 110 mg of total polyphenols (GAE/100 g dry sample) (48) and its phenolic compound profile is not completely known (49). Hydrogen bonding and hydrophobic interactions are responsible for the complex formation of protein and phenolics (50), and the pH variations and enzymatic activity could interact with the particle size through time (25). Therefore, depending on the source and processing, proteins can exhibit a wide range of heterogeneous and complex structures in the foods we consume. Also, because proteins have regions with different affinity for hydrophobic and hydrophilic environments, native molecular structures affect susceptibility to proteolysis (39).
Electrophoresis (SDS-PAGE)
The phaseolin fraction usually represents the largest proportion of proteins in grains and legumes (36–46%), with those inside the beans being the most abundant. On the other hand, lectins are a 120-kDa tetramer (subunits around 31 kDa) and represent 5–12% of the total protein in the genus Phaseolus. These have numerous functions in the plant (nitrogen fixation and protection against pathogens, among others) and, within their functional properties in animals, have been reported to have positive effects in the circulatory system, mainly against aging and tumor cells (7–9). This effect of lectins is due to the fact that they can recognize carbohydrates with high specificity of the cell surface or in suspension, agglutinating cells, and precipitate glycoconjugates. Regardless of their specificity, legume lectins recognize carbohydrates thanks to the presence of three amino acids: aspartic acid, asparagine, and an aromatic residue or leucine creating strong interactions between proteins and carbohydrates that could have an impact on WAC and OAC and GIS (51). It is also important to note that tepary bean lectin and its subunits are the only protein of P. acutifolius deposited within the Protein Data Bank (PDB: 6TT9), which opens up research opportunities on our native plant species.
In silico Methodology
In silico Digestibility
Protein resistance to degradation and transport through the intestinal wall are two factors that influence the bioavailability of proteins, in which the degree of absorption is a function of the length of the peptide amino acid chain. Although information indicates that complete proteins' absorption could be through intercellular junctions, the highest absorption is from peptides with a length between two and five amino acid residues. The absorption of dipeptides and tripeptides is performed using PepT1 and PepT2 (SLC15A1, proton-dependent oligopeptide transporter), and for peptides with a length between four and five amino acids, absorption is carried out by SOPT1/SOPT2. Also, peptides with this length have a higher resistance to degradation, increasing their bioavailability and, more significantly, bioactivity (52). It has been reported that the determination of binding energy based on in silico experimental methods using HPEPDOCK shows a good correlation with the results obtained experimentally so that these molecules are the ones with the higher antiadipogenic potentiality (53, 54). However, concerning the results obtained with Autodock tools, the peptides TTPW, ATSF, ITY, and TSF showed the formation of hydrogen bonds in anti-adipogenic regions of the PPARγ receptor, mainly the three presented bonds with Cys285, which has been since it presents more significant antiadipogenic effects, with binding energies of −5.96, 3.89, −5.91, and −4.68 kcal/mol, respectively (28). The molecules GW9662 and G3335, which are widely known for their anti-adipogenic effect via PPARγ (55, 56), showed the formation of hydrogen bonds to Ser289 and Cys285 for GW9662 and Tyr473, Met364, His323, and Ser289 for G3335, with binding energies of −7.98 and −5.64 kcal/mol, respectively, for which the TTPW and ITY peptides are the ones that could present this antiadipogenic effect taking as reference the energies and binding sites of the controls used. Also, it is essential to consider the presence of hydrophobic amino acids (V, L, I, A, F, W, M, and P) since it has been reported that hydrophobic interactions is crucial for their functionality as bioactive compounds (57, 58). Oseguera Toledo et al. (59) have reported that the peptides FFL, LLSL, and LVLL, with a high content of hydrophobic amino acids, present a 13–28% inhibition in lipid accumulation. Therefore, the molecules must present this type of amino acids since their antagonistic mechanism via PPARγ is in adipose tissue (60). Also, it has been reported that the presence of proline in peptides shows higher resistance to degradation with intracellular peptidases, so that the tetrapeptide TTPW has a greater probability of being absorbed intact (61), and recently, Vega-Rojas et al. (62) demonstrated that derivate peptides from recombinant tepary bean lectin can cross through the intestinal membrane into ex vivo study with enterocytes. Nevertheless, different compounds found in the food matrix could be linked to peptide compounds, affecting their bioavailability, bioaccessibility, or bioactivity. One of the most studied is phenolic compounds; they could exert antagonistic or synergistic effects with proteins' bioactivity in their pure state (63, 64) and the presence of them in tepary bean protein concentrates would modify this results. Although PPARγ is the main protein for identifying antiadipogenic ligands, it is crucial to consider more proteins involved in this process, such as C/EBPβ, Ap2, SREBP-1c, FAS, HMGCCR, and β-actin, for a compressive knowledge of these peptides and their putative agonist action.
Conclusion
Although raw samples (RF and RPC) have a more significant amount of protein, the GIS and particle size behavior show a significant difference (p < 0.05) concerning cooked samples (CF and CPC). CF and CPC show desirable physicochemical characteristics for a functional ingredient, with WAC, OAC, and emulsion capacity similar to black and cranberry common bean and a % IVDP of 62 and 64 and C-PER of 1.93 and 1.81, respectively, being slightly higher than those reported for some varieties of common bean flours, reinforcing that heat treatment is crucial to develop suitable physicochemical and nutritional properties in legume materials. In addition to the nutritional role that proteins have, the in silico study found that the peptides TTPW and ITY, obtained from tepary bean lectin, could exert putative antiadipogenic effects via PPAR-γ based on the intermolecular interactions formed by ligand-receptors and presence of peptides with hydrophobic amino acids such as proline, which is crucial for their functionality. However, further studies should investigate in vitro and in vivo levels to elucidate the biological activity that these peptides may present, considering the different factors that mediate the digestion of proteins like lectin as polyphenols in the food matrix and heat treatment, among others.
Data Availability Statement
The raw data supporting the conclusions of this article will be made available by the authors, without undue reservation.
Author Contributions
CL-I and JV-R collected the samples, performed the analysis, interpreted and analyzed the data, and wrote the manuscript, with contributions from FR-L, BR, and MB-V. JV-R along with MB-V planned the work and checked the manuscript thoroughly. BG-M and ML-C helped with funding and nutritional analysis. JB-G helped with the physicochemical analysis and the statistical analysis. All authors read and checked the manuscript properly before submission.
Funding
This work was supported by PAICYT (Programa de Apoyo a la Investigación Científica y Tecnológica) from Universidad Autónoma de Nuevo León (UANL). Also, we acknowledge CONACYT (Consejo Nacional de Ciencia y Tecnología—México) for the grant awarded to CL-I and FR-L.
Conflict of Interest
The authors declare that the research was conducted in the absence of any commercial or financial relationships that could be construed as a potential conflict of interest.
Acknowledgments
We acknowledge Centro de Investigación en Alimentación y Desarrollo CIAD for amino acid analysis services, especially Amparo Nieblas and María Grijalva.
References
1. Alasmre FA, Alotaibi HA. Plant-based diet: a potential intervention for heart failure. Cureus. (2020) 12:e8282. doi: 10.7759/cureus.8282
2. Moreno-Valdespino CA, Luna-Vital D, Camacho-Ruiz RM, Mojica L. Bioactive proteins and phytochemicals from legumes: mechanisms of action preventing obesity and type-2 diabetes. Food Res Int. (2020) 130:108905. doi: 10.1016/j.foodres.2019.108905
3. Tran E, Dale HF, Jensen C, Lied GA. Effects of plant-based diets on weight status: a systematic review. Diabetes Metab Syndr Obes Targets Ther. (2020) 13:3433–48. doi: 10.2147/DMSO.S272802
4. Trautwein EA, McKay S. The role of specific components of a plant-based diet in management of dyslipidemia and the impact on cardiovascular risk. Nutrients. (2020) 12:2671. doi: 10.3390/nu12092671
5. Jiménez Galindo JCJ, Acosta Gallegos JAA. Caracterización de genotipos criollos de frijol Tepari (Phaseolus acutifolius A. Gray) y común (Phaseolus vulgaris L.) bajo temporal. Rev Mex Cienc Agríc. (2012) 3:1565–77. Available online at: http://www.redalyc.org/articulo.oa?id=263124770007
6. Heredia-Rodríguez L, Gaytán-Martínez M, Morales-Sánchez E, Garza-Juárez A de J, Urias-Orona V, González-Martínez BE, et al. Nutritional and technological properties of tepary bean (Phaseolus acutifolius) cultivated in Mexican Northeast. Czech J Food Sci. (2019) 37:62–8. doi: 10.17221/331/2017-CJFS
7. García-Gasca T, García-Cruz M, Hernandez-Rivera E, López-Matínez J, Castañeda-Cuevas AL, Yllescas-Gasca L, et al. Effects of tepary bean (Phaseolus acutifolius) protease inhibitor and semipure lectin fractions on cancer cells. Nutr Cancer. (2012) 64:1269–78. doi: 10.1080/01635581.2012.722246
8. Moreno-Celis U, López-Martínez J, Blanco-Labra A, Cervantes-Jiménez R, Estrada-Martínez LE, García-Pascalin AE, et al. Phaseolus acutifolius lectin fractions exhibit apoptotic effects on colon cancer: preclinical studies using dimethilhydrazine or azoxi-methane as cancer induction agents. Molecules. (2017) 22:1670. doi: 10.3390/molecules22101670
9. Moreno-Celis U, López-Martínez FJ, Cervantes-Jiménez R, Ferríz-Martínez RA, Blanco-Labra A, García-Gasca T. Tepary bean (Phaseolus acutifolius) lectins induce apoptosis and cell arrest in G0/G1 by P53(Ser46) phosphorylation in colon cancer cells. Molecules. (2020) 25:1021. doi: 10.3390/molecules25051021
10. Sá PM de, Richard AJ, Hang H, Stephens JM. Transcriptional regulation of adipogenesis. In: Comprehensive Physiology. Atlanta, GA: American Cancer Society (2017). p. 635–74. doi: 10.1002/cphy.c160022
11. Xue P, Hou Y, Zuo Z, Wang Z, Ren S, Dong J, et al. Long isoforms of NRF1 negatively regulate adipogenesis via suppression of PPARγ expression. Redox Biol. (2020) 30:101414. doi: 10.1016/j.redox.2019.101414
12. Lebovitz HE. Thiazolidinediones: the forgotten diabetes medications. Curr Diab Rep. (2019) 19:151. doi: 10.1007/s11892-019-1270-y
13. Kumar MS. Peptides and peptidomimetics as potential antiobesity agents: overview of current status. Front Nutr. (2019) 6:11. doi: 10.3389/fnut.2019.00011
14. Betancur-Ancona D, Gallegos-Tintoré S, Chel-Guerrero L. Wet-fractionation of Phaseolus lunatus seeds: partial characterization of starch and protein. J Sci Food Agric. (2004) 84:1193–201. doi: 10.1002/jsfa.1804
15. Kaur M, Singh N. Relationships between selected properties of seeds, flours, and starches from different chickpea cultivars. Int J Food Prop. (2006) 9:597–608. doi: 10.1080/10942910600853774
16. Julianti E, Rusmarilin H, Ridwansyah, Yusraini E. Functional and rheological properties of composite flour from sweet potato, maize, soybean and xanthan gum. J Saudi Soc Agric Sci. (2017) 16:171–7. doi: 10.1016/j.jssas.2015.05.005
17. Bencini MC. Functional properties of drum-dried chickpea (Cicer arietinum L.) flours. J Food Sci. (1986) 51:1518–21. doi: 10.1111/j.1365-2621.1986.tb13849.x
18. Yasumatsu K, Sawada K, Moritaka S, Misaki M, Toda J, Wada T, et al. Whipping and emulsifying properties of soybean products. Agric Biol Chem. (1972) 36:719–27. doi: 10.1080/00021369.1972.10860321
19. Chau CF, Cheung CK. Effect of various processing methods on antinutrients and in vitro digestibility of protein and starch of two Chinese indigenous legume seeds. J Agric Food Chem. (1997) 45:4773–6. doi: 10.1021/jf970504p
21. Vázquez-Ortiz FA, Caire G, Higuera-Ciapara I, Hernández G. High performance liquid chromatographic determination of free amino acids in shrimp. J Liq Chromatogr. (1995) 18:2059–68. doi: 10.1080/10826079508013960
22. Leser S. The 2013 FAO report on dietary protein quality evaluation in human nutrition: recommendations and implications. Nutr Bull. (2013) 38:421–8. doi: 10.1111/nbu.12063
23. Gómez-Favela M, Gutiérrez Dorado R, Cuevas-Rodriguez E, Adrián Canizalez-Román V, del Rosario León-Sicairos C, Milán-Carrillo J, et al. Improvement of chia seeds with antioxidant activity, GABA, essential amino acids, and dietary fiber by controlled germination bioprocess. Plant Foods Hum Nutr. (2017) 72:345–52. doi: 10.1007/s11130-017-0631-4
24. Shim S-M, Choi M-H, Park S-H, Gu Y-U, Oh J-M, Kim S, et al. Assessing the digestibility of genetically modified soybean: physiologically based in vitro digestion and fermentation model. Food Res Int. (2010) 43:40–5. doi: 10.1016/j.foodres.2009.08.011
25. Xing G, Rui X, Wang D, Liu M, Chen X, Dong M. Effect of fermentation ph on protein bioaccessibility of soymilk curd with added tea polyphenols as assessed by in vitro gastrointestinal digestion. J Agric Food Chem. (2017) 65:11125–32. doi: 10.1021/acs.jafc.7b04456
26. Camacho Espinoza MK, Peinado Guevara LI, López Valenzuela JÁ, Valdez Ortiz Á, Salinas Pérez RA, Moreno Herrera CG, et al. Caracterización proteómica de granos de frijol azufrado (Phamseolus Vulgaris) cultivados en el estado de Sinaloa. Ra Ximhai. (2010) 6:23–36. doi: 10.35197/rx.06.01.2010.04.mc
27. Shi Z, Hao Y, Teng C, Yao Y, Ren G. Functional properties and adipogenesis inhibitory activity of protein hydrolysates from quinoa (Chenopodium quinoa Willd.). Food Sci Nutr. (2019) 7:2103–12. doi: 10.1002/fsn3.1052
28. Ye F, Zhang Z-S, Luo H-B, Shen J-H, Chen K-X, Shen X, et al. The dipeptide H-Trp-Glu-OH shows highly antagonistic activity against PPARγ: bioassay with molecular modeling simulation. ChemBioChem. (2006) 7:74–82. doi: 10.1002/cbic.200500186
29. Aranaz P, Navarro-Herrera D, Zabala M, Miguéliz I, Romo-Hualde A, López-Yoldi M, et al. Phenolic compounds inhibit 3T3-L1 adipogenesis depending on the stage of differentiation and their binding affinity to PPARγ. Molecules. (2019) 24:1045. doi: 10.3390/molecules24061045
30. Food and Agriculture Organization of the United Nations, editor. Dietary Protein Quality Evaluation in Human Nutrition: Report of an FAO Expert Consultation, 31 March-2 April, 2011, Auckland, New Zealand. Rome: Food and Agriculture Organization of the United Nations (2013). p. 66.
31. Ramírez-Jiménez AK, Reynoso-Camacho R, Tejero ME, León-Galván F, Loarca-Piña G. Potential role of bioactive compounds of Phaseolus vulgaris L. on lipid-lowering mechanisms. Food Res Int. (2014) 161:254–60. doi: 10.1016/j.foodchem.2014.04.008
32. Butt M, Rizwana B. Nutritional and functional properties of some promising legumes protein isolates. Pak J Nutr. (2010) 9:373–9. doi: 10.3923/pjn.2010.373.379
33. Sreerama YN, Sashikala VB, Pratape VM, Singh V. Nutrients and antinutrients in cowpea and horse gram flours in comparison to chickpea flour: evaluation of their flour functionality. Food Chem. (2012) 131:462–8. doi: 10.1016/j.foodchem.2011.09.008
34. Aguilera Gutiérrez Y. Harinas de Leguminosas Deshidratadas: Caracterización Nutricional y Valoración de sus Propiedades Tecnofuncionales. (2010). Available online at: https://repositorio.uam.es/handle/10486/4180 (accessed January 27, 2021).
35. Siddiq M, Ravi R, Harte JB, Dolan KD. Physical and functional characteristics of selected dry bean (Phaseolus vulgaris L.) flours. LWT - Food Sci Technol. (2010) 43:232–7. doi: 10.1016/j.lwt.2009.07.009
36. Ferreyra JC, Kuskoski EM, Luiz MTB, Arellano DB, Fett R. Propiedades emulsificantes y espumantes de las proteínas de harina de cacahuate (Arachis hypogaea Lineau). Grasas Aceites. (2007) 58:264–9. doi: 10.3989/gya.2007.v58.i3.181
37. Gupta S, Chhabra GS, Liu C, Bakshi JS, Sathe SK. Functional properties of select dry bean seeds and flours. J Food Sci. (2018) 83:2052–61. doi: 10.1111/1750-3841.14213
38. Miranda-Villa PP, Marrugo-Ligardo YA, Montero-Castillo PM. Caracterización funcional del almidón de fríjol zaragoza (Phaseolus lunatus L.) y cuantificación de su almidón resistente: functional characterization of bean zaragoza starch (Phaseolus lunatus L.) and quantification of the resistant starch. TecnoLógicas. (2013) 30:17–32. doi: 10.22430/22565337.80
39. Boland M, Golding M, Harjinder S. Food Structures, Digestion and Health. Elsevier (2014). Available online at: https://linkinghub.elsevier.com/retrieve/pii/C20120022430 (accessed January 27, 2021).
40. Idouraine A, Weber CW, Kohlhepp EA. Composition of tepary bean (Phaseolus acutifolius) of the Southwestern U.S. and Northern Mexico. Ecol Food Nutr. (1995) 33:139–47. doi: 10.1080/03670244.1995.9991424
41. Enjamio-Perales L, Rodríguez-Alonso P, Valero-Gaspar T, Ruiz-Moreno E, Ávila-Torres J, Varela-Moreiras G. Informe sobre Legumbres, Nutrición y Salud (Adaptado al Reglamento relativo a las declaraciones nutricionales y de propiedades saludables en los alimentos). España: Fundación Española de la Nutrición (FEN) (2017). Available online at: https://www.fen.org.es/storage/app/media/imgPublicaciones/informe-legumbres-nutricion-y-saludvw.pdf (accessed January 27, 2021).
42. Nosworthy MG, Neufeld J, Frohlich P, Young G, Malcolmson L, House JD. Determination of the protein quality of cooked Canadian pulses. Food Sci Nutr. (2017) 5:896–903. doi: 10.1002/fsn3.473
43. Omosebi MO, Osundahunsi OF, Fagbemi TN. Effect of extrusion on protein quality, antinutritional factors, and digestibility of complementary diet from quality protein maize and soybean protein concentrate. J Food Biochem. (2018) 42:e12508. doi: 10.1111/jfbc.12508
44. Idouraine A, Tinsley AM, Weber CW. Nutritional quality and sensory acceptability of akara prepared from germinated tepary beans. J Food Sci. (1989) 54:114–7. doi: 10.1111/j.1365-2621.1989.tb08580.x
45. Idouraine A, Yensen Sb, Weber Cw. Tepary bean flour, albumin and globulin fractions functional properties compared with soy protein isolate. J Food Sci. (1991) 56:1316–8. doi: 10.1111/j.1365-2621.1991.tb04761.x
46. Salas-López F, Gutiérrez-Dorado R, Milán-Carrillo J, Cuevas-Rodríguez EO, Canizalez-Roman VA, León-Sicairos C del R, et al. Nutritional and antioxidant potential of a desert underutilized legume – tepary bean (Phaseolus acutifolius). Optimization of germination bioprocess. Food Sci Technol. (2018) 38:254–62. doi: 10.1590/fst.25316
47. Nosworthy M, Medina G, Franczyk A, Neufeld J, Appah P, Utioh A, et al. Effect of processing on the in vitro and in vivo protein quality of beans (Phaseolus vulgaris and Vicia Faba). Nutrients. (2018) 10:671. doi: 10.3390/nu10060671
48. Mora-Uzeta C, Cuevas-Rodriguez EO, Cervantes JL, Carrillo JM, Dorado RG, Moreno CR. Improvement nutritional/antioxidant properties of underutilized legume tepary bean (Phaseolus acutifolius) by solid state fermentation. Agrociencia. (2019) 53:987–1003. Available online at: https://agrociencia-colpos.mx/index.php/agrociencia/article/download/1858/1855/1845
49. Heredia Rodríguez L. Caracterización Fisicoquímica y de Compuestos Bioactivos del Frijol Tepari (Phaseolus acutifolius gray) Cultivado en Nuevo León, México. Universidad Autónoma de Nuevo León (2017). Available online at: http://eprints.uanl.mx/14362/ (accessed January 27, 2021).
50. Ozdal T, Capanoglu E, Altay F. A review on protein–phenolic interactions and associated changes. Food Res Int. (2013) 51:954–70. doi: 10.1016/j.foodres.2013.02.009
51. Martínez-Alarcón D, Varrot A, Fitches E, Gatehouse JA, Cao M, Pyati P, et al. Recombinant lectin from tepary bean (Phaseolus acutifolius) with specific recognition for cancer-associated glycans: production, structural characterization, and target identification. Biomolecules. (2020) 10:654. doi: 10.3390/biom10040654
52. Vij R, Reddi S, Kapila S, Kapila R. Transepithelial transport of milk derived bioactive peptide VLPVPQK. Food Chem. (2016) 190:681–8. doi: 10.1016/j.foodchem.2015.05.121
53. Kandemir-Cavas C, Pérez-Sanchez H, Mert-Ozupek N, Cavas L. In silico analysis of bioactive peptides in invasive sea grass halophila stipulacea. Cells. (2019) 8:557. doi: 10.3390/cells8060557
54. Li X, Ye L, Wang X, Shi W, Liu H, Qian X, et al. In silico investigations of anti-androgen activity of polychlorinated biphenyls. Chemosphere. (2013) 92:795–802. doi: 10.1016/j.chemosphere.2013.04.022
55. Ohtera A, Miyamae Y, Yoshida K, Maejima K, Akita T, Kakizuka A, et al. Identification of a new type of covalent PPARγ agonist using a ligand-linking strategy. ACS Chem Biol. (2015) 10:2794–804. doi: 10.1021/acschembio.5b00628
56. Seargent JM, Yates EA, Gill JH. GW9662, a potent antagonist of PPARγ, inhibits growth of breast tumour cells and promotes the anticancer effects of the PPARγ agonist rosiglitazone, independently of PPARγ activation. Br J Pharmacol. (2004) 143:933–7. doi: 10.1038/sj.bjp.0705973
57. Choe J, Seol K-H, Son D-I, Lee HJ, Lee M, Jo C. Identification of angiotensin I-converting enzyme inhibitory peptides from enzymatic hydrolysates of pork loin. Int J Food Prop. (2019) 22:1112–21. doi: 10.1080/10942912.2019.1629690
58. Nongonierma AB, FitzGerald RJ. Features of dipeptidyl peptidase IV (DPP-IV) inhibitory peptides from dietary proteins. J Food Biochem. (2019) 43:e12451. doi: 10.1111/jfbc.12451
59. Oseguera Toledo ME, Gonzalez de Mejia E, Sivaguru M, Amaya-Llano SL. Common bean (Phaseolus vulgaris L.) protein-derived peptides increased insulin secretion, inhibited lipid accumulation, increased glucose uptake and reduced the phosphatase and tensin homologue activation in vitro. J Funct Foods. (2016) 27:160–77. doi: 10.1016/j.jff.2016.09.001
60. Li-Chan EC. Bioactive peptides and protein hydrolysates: research trends and challenges for application as nutraceuticals and functional food ingredients. Curr Opin Food Sci. (2015) 1:28–37. doi: 10.1016/j.cofs.2014.09.005
61. Bhutia YD, Ganapathy V. Chapter 47 - protein digestion and absorption. In: Said HM, editor. Physiology of the Gastrointestinal Tract. 6th ed. Academic Press (2018). p. 1063–86. doi: 10.1016/B978-0-12-809954-4.00047-5
62. Vega-Rojas LJ, Luzardo-Ocampo I, Mosqueda J, Palmerín-Carreño DM, Escobedo-Reyes A, Blanco-Labra A, et al. Bioaccessibility and in vitro intestinal permeability of a recombinant lectin from tepary Bean (Phaseolus acutifolius) using the everted intestine assay. Int J Mol Sci. (2021) 22:1049. doi: 10.3390/ijms22031049
63. González-Espinosa de los Monteros LA, Ramón-Gallegos E, Torres-Torres N, Mora-Escobedo R. Effect of germinated soybean protein hydrolysates on adipogenesis and adipolysis in 3T3-L1 cells. Plant Foods Hum Nutr. (2011) 66:355–62. doi: 10.1007/s11130-011-0263-z
Keywords: PPAR-gamma, underutilized food, tepary bean, Phaseolus acutifolius, in silico docking, vegetal protein
Citation: López-Ibarra C, Ruiz-López FdJ, Bautista-Villarreal M, Báez-González JG, Rodríguez Romero BA, González-Martínez BE, López-Cabanillas Lomelí M and Vázquez-Rodríguez JA (2021) Protein Concentrates on Tepary Bean (Phaseolus acutifolius Gray) as a Functional Ingredient: In silico Docking of Tepary Bean Lectin to Peroxisome Proliferator-Activated Receptor Gamma. Front. Nutr. 8:661463. doi: 10.3389/fnut.2021.661463
Received: 30 January 2021; Accepted: 19 April 2021;
Published: 31 May 2021.
Edited by:
Efigenia Montalvo-Gonzalez, Instituto Tecnológico de Tepic, MexicoReviewed by:
Maira Rubi Segura Campos, Universidad Autónoma de Yucatán, MexicoRoberto Gutiérrez Dorado, Universidad Autónoma de Sinaloa, Mexico
Jorge Sánchez-Burgos, Instituto Tecnológico de Tepic, Mexico
Copyright © 2021 López-Ibarra, Ruiz-López, Bautista-Villarreal, Báez-González, Rodríguez Romero, González-Martínez, López-Cabanillas Lomelí and Vázquez-Rodríguez. This is an open-access article distributed under the terms of the Creative Commons Attribution License (CC BY). The use, distribution or reproduction in other forums is permitted, provided the original author(s) and the copyright owner(s) are credited and that the original publication in this journal is cited, in accordance with accepted academic practice. No use, distribution or reproduction is permitted which does not comply with these terms.
*Correspondence: Jesús Alberto Vázquez-Rodríguez, amVzdXMudmF6cXVlenJkekB1YW5sLmVkdS5teA==