 Constanza S. Carrera
 Fernando Salvagiotti
 Ignacio A. Ciampitti
- 1Unidad de Estudios Agropecuarios, Consejo Nacional de Investigaciones Científicas y Técnicas (CONICET), Instituto Nacional de Tecnología Agropecuaria (INTA), Córdoba, Argentina
- 2Department of Agronomy, 2004 Throckmorton Plant Science Center, Kansas State University, Manhattan, KS, United States
- 3Consejo Nacional de Investigaciones Científicas y Técnicas (CONICET), Buenos Aires, Argentina
- 4Crops, Soil and Water Management Group, Estación Experimental Agropecuaria Instituto Nacional de Tecnología Agropecuaria (INTA) and Consejo Nacional de Investigaciones Científicas y Técnicas (CONICET), Oliveros, Argentina
The aim of this study was to explore relationships between protein, oil, and seed weight with seed nutraceutical composition, focused on total isoflavone (TI) and total tocopherol (TT) contents across genotypic and environmental combinations in soybean. We conducted a synthesis-analysis of peer-reviewed published field studies reporting TI, TT, protein, oil, and seed weight (n = 1,908). The main outcomes from this synthesis-analysis were: (i) relationship of TI-to-protein concentration was positive, though for the upper boundary, TI decreases with increases in protein; (ii) relationship of TT-to-oil concentration was positive, but inconsistent when oil was expressed in mg per seed; and (iii) as seed weight increased, TI accumulation was less than proportional relative to protein concentration and TT decreased more proportional relative to oil concentration. Association between nutraceuticals and protein, oil, and seed weight for soybean reported in the present study can be used as a foundational knowledge for soybean breeding programs interested on predicting and selecting enhanced meal isoflavone and/or oil tocopherol contents.
Introduction
Seed protein and oil in soybeans [Glycine max (L.) Merrill] define the overall quality value for the international trade markets (1). Additionally, more recently, soybean has ranked as one of the top sources of highly valuable nutraceutical compounds with health-enhancing properties (2). These active substances extracted from plants origin (phytocomplexes), such as soybean seeds, are important given their proven efficacy and benefits on human health (for prevention or support treatment of some pathologic scenarios) in addition to their nutritional content (3–5). For such relevant properties, these compounds are usually referred to as nutraceuticals (6). From the nutraceutical seed components, isoflavones (minor components of meal) plays a key role in the prevention and treatment of chronic diseases (e.g., cancer, heart disease, osteoporosis) (7) due to its anti-estrogenic and antioxidant activities (8). Several health benefits have been associated with tocopherols, minor components of oil with lipophilic antioxidant properties, playing a critical role in delaying the pathogenesis of cardiovascular and neurodegenerative diseases (e.g., Alzheimer's and Parkinson's) (9).
In the past two decades, several studies have been conducted to quantify the variation in soybean seed composition relative to the interaction of genotype by environment (G × E) (10–20). Breeding programs aimed at improving soybean compositional quality, i.e., increasing the content of key nutrients such as isoflavones (21), have invested considerable efforts in estimating correlations between seed components for different G × E (22–24). Past research studies have already reported trade-offs for protein and oil (25–27), isoflavone and protein (23, 28, 29), and tocopherol and oil weight per grain (30), but with the latter association receiving considerably less attention in the scientific literature.
Seed size defined by weight of seeds, is an important character for different type of soybean foods. Protein, oil, isoflavones, and tocopherols deposition patterns mimic seed dry mass accumulation during seed filling period in soybean (1). Thus, final seed weight may act as an integrative indicator of ecophysiological processes occurring during this period when these seed components accumulate. However, association of nutraceuticals with seed weight has not been comprehensively analyzed. Those relationships may be tightly linked to the particular genotypic and environmental combinations explored in each study, making difficult to assess the biological limits of nutraceuticals composition relative to protein and oil. Thus, a synthesis-analysis, by quantitatively combining results from different studies, may overcome those limitations, expanding the level of inference as well as increasing the validity of conclusions (31, 32). A similar approach has been previously explored for analyzing relationships between grain yield and a given resource such as water availability (33) or nutrient (N, P, and K) (34) in wheat or in soybean (35–37).
Several review studies have been published to synthesize knowledge on soybean seed composition (6, 38–41). However, until the present a more comprehensive characterization of the variation for seed nutraceuticals with relevant agronomic traits under diverse genotypic and environmental combinations is still lacking. Therefore, the aim of this study was to explore relationships between protein, oil, and seed weight with seed nutraceutical composition, focused on total isoflavone (TI) and total tocopherol (TT) contents across different genotypic and environmental combinations in soybean.
Materials and Methods
Database Compilation and Variables Evaluated
The literature search for the database compilation was conducted by surveying peer-reviewed journal articles published over the past decades following the procedures described in previous review papers (35, 42). Briefly, collected studies were evaluated under field conditions reporting total isoflavone (TI) and total tocopherol (TT) contents (expressed as mg and μg component per seed in dry basis, respectively), protein and oil concentrations (expressed as percentage of dry weight) and/or contents (mg component per seed in dry basis) as well. Seed protein and oil concentrations from all studies were adjusted to a standard moisture basis of 130 g kg−1, because wet basis moisture content is generally used for industrial and commercial purposes (43). Only two studies were meeting the criteria for being included in this review i.e., that evaluated the four above-mentioned seed chemical traits (20, 22), yielding insufficient data to address the objectives of our work. Thus, two databases were generated, one comprising protein and TI, involving 12 studies (Table 1) from Argentina (3), Brazil (2), Canada (4), Korea (1), and the United States (US) (2) and the second database comprising oil and TT, and involving 5 studies (Table 2) from Argentina (1), China (1), and US (3). Since not all studies reported simultaneously the seed weight, the number of cases for protein and oil concentrations and contents in each database were different. For instance, database 1 includes 1,624 data points for protein concentration and total isoflavone, and 1,600 data points for protein content. Database 2 includes 284 data points for oil concentration and total tocopherol, and 255 data points for oil content. In all cases, the databases included studies primarily focused on quantifying soybean seed composition as affected by G × E combinations. Data were retrieved directly from tables or digitalized from figures.
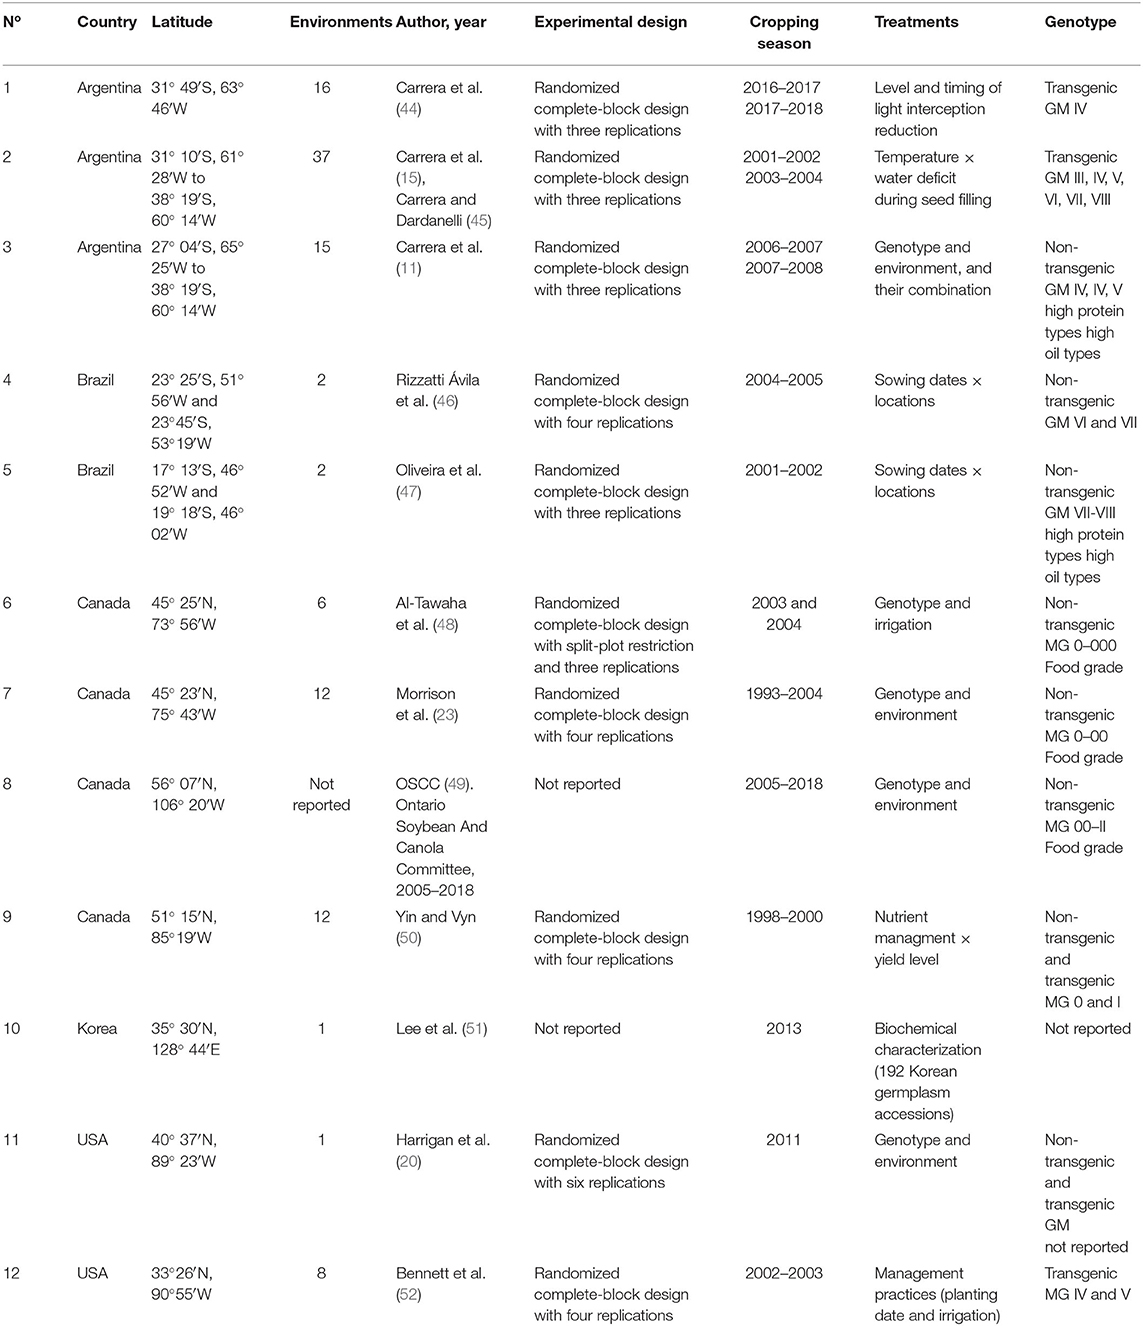
Table 1. Number of study, country, latitude, number of involved environments defined as crop year, location, and sowing date combinations, author and year of publication, experimental conditions and design, cropping season, treatments evaluated, and genotype type for each study included in the soybean seed protein and isoflavone meta-data base.
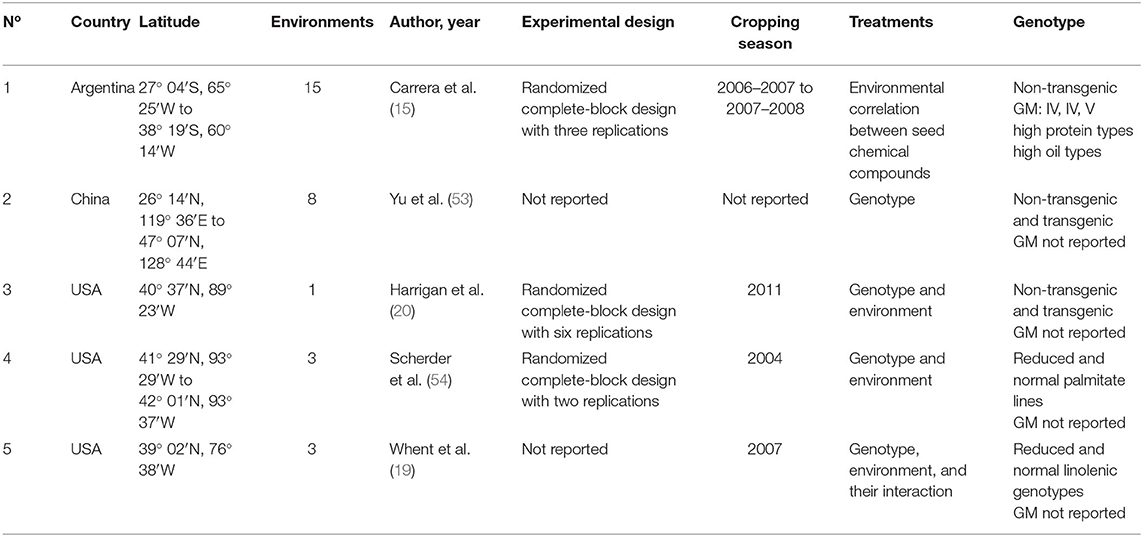
Table 2. Number of study, country, latitude, number of involved environments defined as crop year, location, and sowing date combinations, author and year of publication, experimental conditions and design, cropping season, treatments evaluated, and genotype type for each study included in the soybean seed oil and tocopherol meta-data base.
Database Analysis
Total isoflavone and total tocopherol contents, as well as protein and oil concentrations and contents from both databases were analyzed using descriptive statistics: number of observations (n), mean, standard deviation (SD), median, range of variation (minimum and maximum), quartile 25% as well as 75%, i.e., interquartile range (IQR), with 50% of all observations centered around the median. Analyses were complemented with histograms to visualize the distributions of seed components (GraphPad Prism version 7.0). Seed total isoflavone-to-protein and seed total tocopherol-to-oil relationships were modeled using quantile regression techniques (55, 56). Envelopes portraying maximum (0.99 quantile) and minimum (0.01 quantile) boundaries, and the envelopes enclosing 50% of all the observed data, namely the IQR as described in Salvagiotti et al. (57) were obtained using Blossom software (58). In addition, total isoflavone-to-protein and total tocopherol-to-oil ratios for the boundary functions were further studied via linear and quadratic regressions testing seed weight (mg per seed) as an independent variable for explaining changes in soybean seed composition variation. Model selection was based on the residue analysis and the coefficient of determination (R2) (59). In case of significant quadratic regressions, the first derivative of the functions that indicates the seed weight at which a trait accumulation rates is zero was analyzed.
Results
Variation of Soybean Seed Protein, Total Isoflavone, Oil, and Total Tocopherol
Overall mean seed protein concentration, content and total isoflavone were 36%, 87 mg seed−1, and 1.76 mg seed−1, respectively (Table 3). Differences between maximum and minimum values were 72 and 366% for protein concentration (IQR of 35–38%) and content (IQR of 76–97 mg seed−1), respectively, and 3,358% for total isoflavone content (IQR of 1.22–2.26 mg seed−1). On the other hand, mean seed oil concentration, content and total tocopherol were 19%, 40 mg seed−1, and 331 μg seed−1, respectively (Table 3). For oil concentration (IQR of 17–20%) and content (IQR of 35–47 mg seed−1) differences between maximum and minimum values were 65 and 214%, respectively, and 228% for total tocopherol content (IQR of 283–360 μg seed−1). The great variability observed for all the traits can be attributed to the contrasting environments (climate, soil types) and cropping management (e.g., sowing date, plant density, genotypes, water regimes, and tillage) interactions during the seed filling period across the regions. Frequency distributions for protein concentration and content (i.e., database 1) were slightly skewed (−0.33 and −0.37, respectively), with a leptokurtic (kurtosis = 1) and close to a mesokurtic distribution (kurtosis = 0.27), respectively (Figures 1A,B). Total isoflavone was more normally distributed close to a mesokurtic distribution (kurtosis = −0.4) (Figure 1C). Distribution for oil and total tocopherol (i.e. database 2) concentration were slightly skewed (skew = −0.11, −0.73, respectively), while oil content was normally distributed but all three variables exhibiting a slightly flat distribution (kurtosis = −0.58, −0.23, 0.18, for oil concentration, content and total tocopherol, respectively Figures 1D–F).
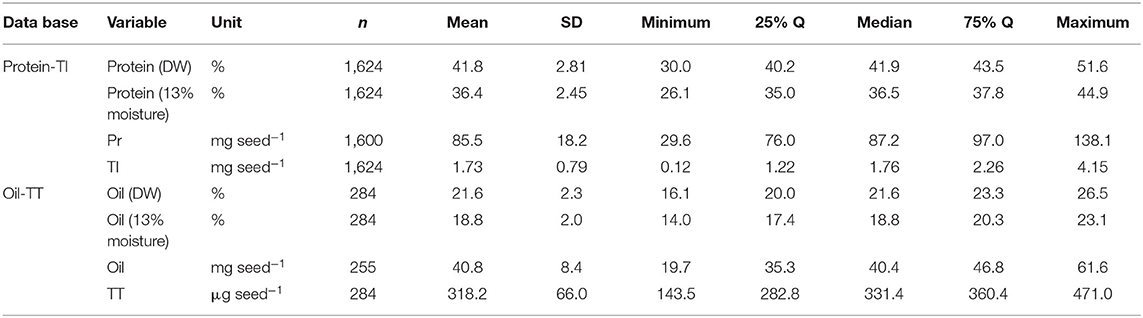
Table 3. Descriptive statistics of the two meta-databases, one relative to soybean seed protein concentration [expressed as percentage of dry weight (DW) and adjusted to 13% moisture] and content (mg seed−1), and total isoflavone (TI) content (mg seed−1); the other relative to seed oil concentration (expressed as percentage of DW and adjusted to 13% moisture) and content (mg seed−1), and total tocopherol (TT) content (μg seed−1).
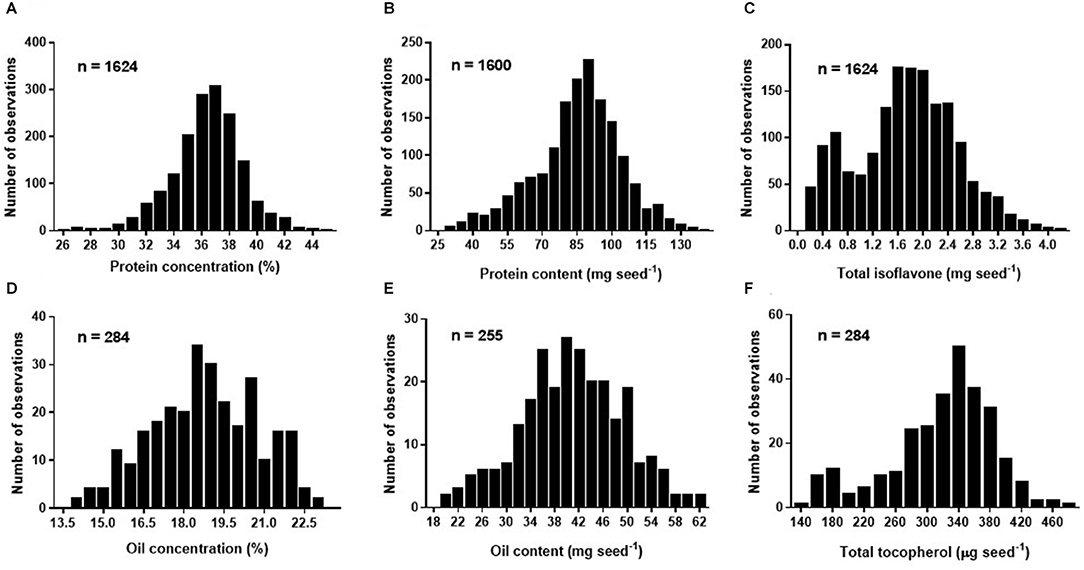
Figure 1. Frequency histogram for soybean seed protein concentration (%) adjusted to 13% moisture (A), protein content expressed in mg seed−1 (B), total isoflavone content expressed in mg seed−1 (C) of Database 1, and oil concentration (%) adjusted to 13% moisture (D), oil content expressed in mg seed−1 (E), and total tocopherol content expressed in μg seed−1 (F) of Database 2.
Nutraceutical Soybean Composition Relative to Protein and Oil
For the relationships between seed nutraceutical with protein and oil, the slopes of the linear regressions for percentiles 1 and 99 were 0.005 and 0.10 mg TI seed−1 % protein−1 (Figure 2A), 0.004 and 0.05 mg TI seed−1 mg protein seed−1 (Figure 2B), and 10.0 and 22.6 μg TT seed−1 % oil−1 (Figure 2C), 4.2 and 15.0 μg TT seed−1 mg oil seed−1 (Figure 2D), respectively. Thus, the upper boundary lines represent maximum seed protein (Figures 2A,B) or oil (Figures 2C,D), implying that TI or TT are limited by factors other than protein or oil, respectively. In contrast, the lower boundary lines indicate maximum TI or TT dilution, with protein (Figures 2A,B) or oil (Figures 2C,D) as the main limiting factors for TI or TT, respectively. The distribution of data points in the TI-to-protein concentration relationship (Figure 2A) depicts a positive association up to 35% of protein (13% moisture basis), above which increases in protein concentration seem to be not accompanied by increases in seed TI, plausible portraying the trade-off generally reported between these two traits. Respect to the TT-to-oil concentration relationship, there was not a clear plateauing in seed TT content at high levels of oil concentration (Figure 2C), suggesting that soybean TT accumulation rate per unit of oil remains constant even at high levels of oil concentration (above 20% expressed in 13% moisture basis).
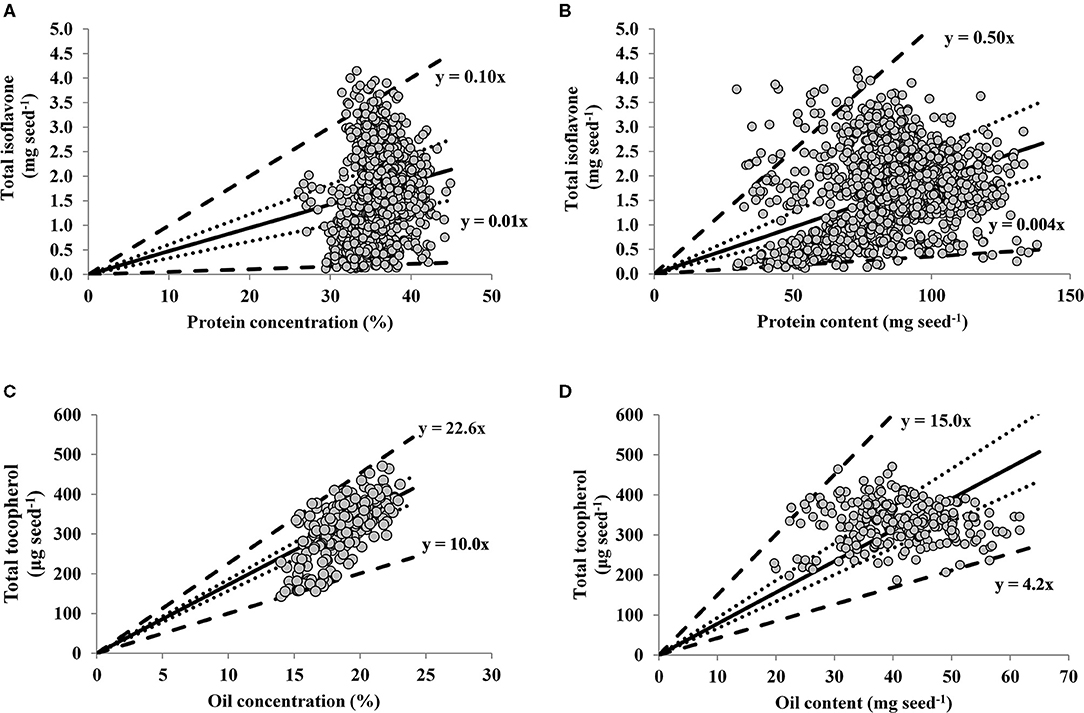
Figure 2. Relationships between seed total isoflavone (mg seed−1) vs. protein concentration (%, adjusted to 13% moisture content) (A) and vs. protein content (mg seed−1) (B); and between soybean seed total tocopherol (μg seed−1) vs. oil concentration (%, adjusted to 13% moisture content) (C) and vs. oil content (mg seed−1) (D) across a range of soybean genotypes and environments. In all panels lines represent quantile regression for percentiles 1 and 99 (thick dotted lines) percentiles 25 and 75 (dotted lines). The solid line is the average fit of the data, for which the following models were computed: (A) Y = −0.37 + 0.06X, adjusted R2 = 0.03, P < 0.0001; (B) Y = 0.81 + 0.01X, adjusted R2 = 0.06, P < 0.0001; (C) Y = −118.93 + 23.27X, adjusted R2 = 0.48, P < 0.0001; (D) Y = 326.0 + 0.15X, adjusted R2 = 0.00, P = 0.70.
However, when the relationships of both protein and oil are expressed in terms of their contents (i.e., in mg of protein or oil per seed), the TI-to-protein relationship presented a larger variation relative to TT-to-oil content. Indeed, in the range of oil content variation (20–61 mg seed−1), TT varied 151%. For the range of protein variation (30–138 mg seed−1), TI varied 3,358%, with 22% more variability than TT. This greater variability may explain the significant and positive association for TI and protein content (p < 0.0001, Figure 2B), with a non-significant for TT and oil content (p = 0.70, Figure 2D).
Relations of Nutraceuticals, Protein and Oil With Individual Seed Weight
Final individual seed weight is a useful variable integrating physiological responses, with changes in seed weight closely related to variations in seed components. Indeed, across a range of environments, growing seasons, and genotypes, protein and seed weight were positively and linearly related (Figure 3A), with a slope of 0.03% protein mg seed−1. Interestingly, a quadratic model was fitted for TI content and seed weight (Figure 3B), indicating that TI rate increases less proportionally with increments in seed weight (0.02 mg seed−1 increase in TI up to 91 mg seed−1 then decreases steadily until a seed weight of 258 mg seed−1). From a similar range of seed weight, TI is diluted due to a lower deposition (Figure 3B) relative to protein (Figure 3A). On the other hand, responses of both oil concentration and TT content to seed weight were both linear and negative (Figures 3C,D), with a slope of −0.01 % oil and −0.34 μg TT seed−1 mg seed−1, respectively. Thus, although both traits decreases with increasing values of seed weight, TT decreases at a lower rate than oil, with both traits exhibiting dilution with large seed weights.
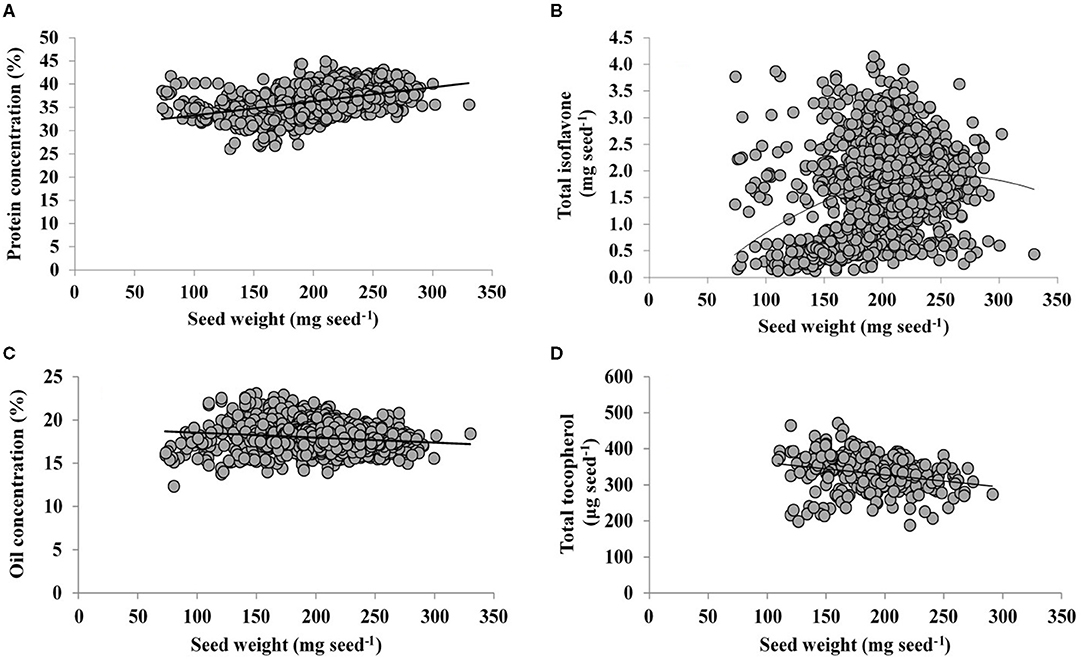
Figure 3. Relationship of seed protein concentration (%, adjusted to 13% moisture content) (A), total isoflavone (mg seed−1) (B), oil concentration (%, adjusted to 13% moisture content) (C), and total tocopherol (μg seed−1) with seed weight. The line represents a fitted linear model for samples from a range of soybean genotypes and environments. The following models were computed: (A) Y = 30.2 + 0.03 X, adjusted R2 = 0.21, P < 0.0001; (B) Y = - 1.02 + 0.02X −5E-05 X2, adjusted R2 = 0.08, PX < 0.0001, PX2 < 0.0001; (C) Y = 19.1–0.01X, adjusted R2 = 0.03, P < 0.0001; (D) Y = 396–0.34X, adjusted R2 = 0.06, P = 0.0001.
Discussion
Broadly variation in soybean seed nutraceuticals relative to protein and oil components revealed that negative associations might not imply a detrimental effect on the synthesis of those compounds. The latter suggests that in some cases physical or genetic limitations at seed level may exist, altering the seed deposition rate, plausible playing a key role for understanding the physiological basis of the directions of the interrelationships between seed traits. The main goal of the current synthesis-analysis was to provide a more holistic interpretation of soybean seed nutraceuticals linked to agronomically relevant seed composition traits (e.g., oil, protein) under the umbrella of broad genotypic and environmental combinations. Although several studies presented associations among different seed components, those associations might be study-specific limited to those conditions with a narrow level of inference. In addition, one of the main roadblocks highlighted by this review is the lack uniformity of reporting units, lack of data on the interrelationships between nutraceutical and agronomically relevant seed traits, and lastly, a lack of proper context for linking changes in concentration without considering the relevancy of individual seed weight. These were the most critical elements needing to receive full attention for researchers, agronomists, breeders, and stakeholders investigating this seed quality topic in the near future.
From an agronomical seed composition standpoint, ranges in oil were within the spectrum reported in the scientific literature, from 13 to 24% (1, 27, 39, 60). On the other hand, even when the protein range explored in the current study was 2-fold greater (from 26 to 45%) than those reported in published scientific reports [i.e., 30–42%; e.g., Piper and Boote (27); Dardanelli et al. (60)], this range fell within values reported for some international soybean germplasm collection that informed 30 to 50%, like the USDA (1, 39). In terms of nutraceuticals, maximum TI content has been previously reported in field studies (ca. 4.0 mg seed−1) (16, 61) and for TT content, the maximum value documented in our dataset was 1.3- and 3.7-fold greater than the maximum reported by ILSI (61) and Ujiie et al. (62) (363 and 128 μg seed−1, respectively). Thus, the range of soybean seed quality compounds gathered in the current database was ample enough for analyzing relationships between nutraceutical composition with protein, oil, and seed weight.
Overall the present synthesis-analysis showed that TI was positively related to protein concentration, but at protein concentrations above 35% (13% moisture basis) increases in protein seem to be not proportionally accompanied by increments in seed TI. Indeed, Charron et al. (24) only observed a positive correlation of TI with protein in 5 out of 17 soybean cultivars, when protein percentage was below 35%. We found that for protein values above 35% TI increments decreased, highlighting the relevance of a more holistic approach when analyzing relashionships between seed components, since several studies in the literature that reported a trade-off between these traits, analyzed always datasets with protein levels above 35% (23, 28, 29, 63, 64). On the other hand, the relationship between TT-to-oil concentration was also positive as previously shown in the literature (65–67) suggesting an universal relationship between both variables. Only negative relationship for TT-to-oil was reported when evaluating low linolenic oil modified genotypes (19), which might responds indirectly to the reported positive correlation between linolenic and TT (68), but not being representative of commercial cultivars.
Previous investigations studied associations between seed traits by making correlation analyses that does not define basis of the associations and potentially implying cause-effect from highly correlated variables (69). In the present study, the boundary analysis by using quantile regression enabled us to obtain more meaningful agronomic and physiological conclusions. Although this analysis has been extensively used for studying relationships between resource availability and seed yield (33, 35, 57, 70), it has not been used for addressing changes in seed composition. For instance, comparing TI-to-protein concentration and TI-to-protein content relationships, the analysis showed that increases in TI accumulation were lower in the second case, suggesting that physical limits may exist for TI increments especially in the range of high protein level. Regarding oil content, the present synthesis-analysis showed non-significant relationship between TT and oil seed content. Nolasco et al. (71) in sunflower (Helianthus annuus L.) found a positive relationship between mentioned traits, but it is important to highlight that oil content in sunflower seeds is 3-fold than in soybean (72), and thus, more variation in oil content and a closer relationship between TT and oil content is expected. Then, taking into account the narrow variation of TT across the range of oil, it seems evident that there would be limited opportunity for further increasing TT content in soybean seeds.
Several studies have reported variations in soybean seeds isoflavones (10, 13, 16, 29, 73–77) as well as tocopherols (12, 18, 65, 67, 78). Nonetheless, many of those studies rarely addressed interactions between these nutraceuticals components with agronomically relevant traits such as protein, oil, and seed weight. Other major issue is that frequently, seed protein and oil are quantified in terms of their concentrations and not their contents, providing little or null insight into the physiological mechanisms underlying seed quality metabolism (79). Thus, the inclusion of seed weight is key for accounting variations in seed quality traits, taking into account that both protein and oil accumulation are relevant processes during the seed filling period. The present synthesis-analysis showed that when seed weight was above ca. 258 mg seed−1, the accumulation of TI per unit of seed weight was less than proportional; however, protein concentration continued increasing above this seed weight. From the oil perspective, both TT and oil concentration presented limitations to the increases in their accumulations as seed weight increases. This suggests that both TT and oil concentration are maintained as seed weight increased, suggesting that both components are smoothly diluted, whereas protein concentration can still accumulate (concentrate) as seed weight increased. However, TI showed a clear dilution.
The evident dilution of TI proposes a biological limitation to the accumulation of this nutraceutical component, not related to a physical restriction (i.e., seed size). Instead, environmental conditions during seed development and genetic factors such as gene linkage or pleiotropic effects (i.e., trait-by-trait interactions) could be underlying processes of this limitation at the biosynthesis-level (45, 63, 64, 80). Rotundo et al. (81) documented increases in seed size associated with increased protein and reduced oil concentrations. On the other hand, Nolasco et al. (71) for sunflower and Izquierdo et al. (30) for soybean, reported that TT content increased in a lower proportion than oil weight per grain. In the whole range of the explored seed weight, which was within that reported for the USDA soybean germplasm collection [40–340 mg seed−1, Nelson and Wang (82)] we observed that as seed weight increased, TT decreased at a higher rate than oil concentration. The lack of association between TT-to-oil content in our synthesis-analysis could be pointing toward compensatory effects of opposite total tocopherol content responses to oil concentration and seed weight, respectively.
Seed chemical composition is the result of complex interactions among seed genetic characteristics and the environment (83). In the current study, we have provided a comprehensive and effective approach for understanding the natural variation of seed nutraceuticals in soybean with an ecophysiological perspective, i.e., analyzing their interrelationships with the major seed components concentrations and contents (Figure 4). Seed weight, closely linked to seed composition and often overlooked in many seed nutraceutical composition studies, arises as an important trait to be further investigated for addressing both seed industrial and nutraceutical quality. Furthermore, future research is needed in order to shed light into the physiological mechanisms occurring during the seed filling period to better understand the effect of environmental conditions (e.g., temperature, water and nutrient availability, radiation), genotype, and/or management practices on modulating changes in soybean seed nutraceuticals. Also, to bridge the gap between soybean matrix constituents, research should also advance toward the relationship between seed protein and carbohydrates. As it is well-documented, increases in protein with reductions in carbohydrates would contribute to enhancing the nutritional value of soybean meal (84, 85). The main outcomes presented in this synthesis-analysis provide for the first time, to extend of our knowledge, valuable practical data on the association between nutraceuticals and protein, oil, and seed weight for soybean crop. This review provides foundational knowledge for soybean breeding programs interested on predicting and selecting enhanced meal isoflavone and/or oil tocopherol contents and their relationships with less-cost intensive and more rapidly-assessed agronomically relevant seed traits such as protein and oil content.
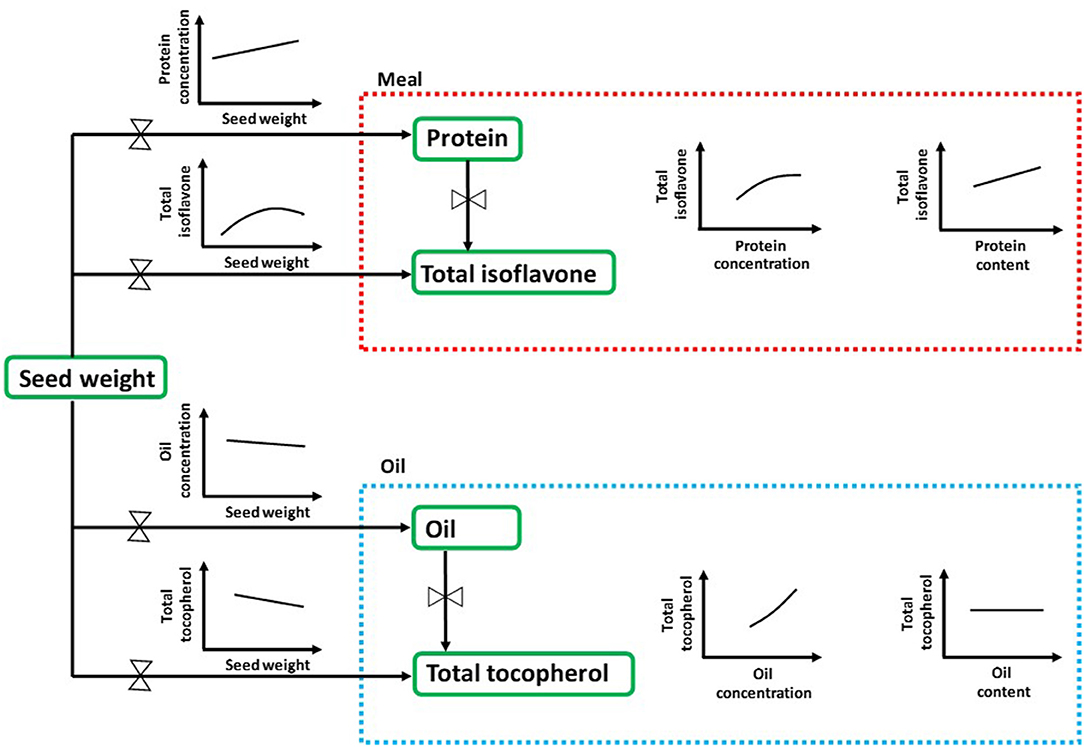
Figure 4. Comprehensive scheme of quality matrix highlighting the main interrelationships between seed nutraceuticals in soybean with the major seed components concentrations and contents through an ecophysiological perspective. Protein and oil concentrations are expressed as percentage of dry weight, whereas contents are expressed as mg component per seed on a dry basis. Total isoflavone and total tocopherol contents are expressed as mg and μg component per seed on a dry basis, respectively.
Author Contributions
CC, FS, and IC contributed to conception and design of the study, organized the database and performed the statistical analysis, and prepared and reviewed the manuscript. All authors contributed to manuscript revision, read, and approved the submitted version.
Funding
Funding for CC stipend were supported primary by the Department of Agronomy, Kansas State University (Farming Systems, Ciampitti's Lab), and complemented by the National Scientific and Technical Research Council (CONICET) as well as the National Institute of Agricultural Research both from Argentina. Contribution no. 22-012-J from the Kansas Agricultural Experiment Station.
Conflict of Interest
The authors declare that the research was conducted in the absence of any commercial or financial relationships that could be construed as a potential conflict of interest.
Publisher's Note
All claims expressed in this article are solely those of the authors and do not necessarily represent those of their affiliated organizations, or those of the publisher, the editors and the reviewers. Any product that may be evaluated in this article, or claim that may be made by its manufacturer, is not guaranteed or endorsed by the publisher.
Acknowledgments
The authors thank Dr. Philippe Seguin from McGill University for kindly providing insight on the data availability. CC and FS are members of CONICET.
Abbreviations
TI, total isoflavone; TT, total tocopherol.
References
1. lson RF. Seed composition. In: Stewart BA, Nielsen DR, editor. Soybeans: Improvement, Production, and Uses. Agronomy Monograph 16, ASSA, 3rd edn. Madison: CSSA, and SSSA. (2004). p. 621–77. doi: 10.2134/agronmonogr16.3ed.c13
2. Isanga J, Zhang GN. Soybean bioactive components and their implications to health—a review. Food Rev Int. (2008) 24:252–76. doi: 10.1080/87559120801926351
3. Santini A, Tenore GC, Novellino E. Nutraceuticals: a paradigm of proactive medicine. Eur J Pharm Sci. (2017) 96:53–61. doi: 10.1016/j.ejps.2016.09.003
4. Volpe R, Sotis G. Nutraceuticals: definition and epidemiological rationale for their use in clinical practice. High Blood Press Cardiovasc Prevent. (2015) 22:199–201. doi: 10.1007/s40292-015-0092-5
5. DeFelice S. The nutraceutical revolution: fueling a powerful, new international market. Como: Harvard University Advanced Management Program in Biomedical Research and Development (1989).
6. Rajcan I, Hou G, Weir AD. Advances in breeding of seed-quality traits in soybean. J Crop Improv. (2005) 14:145–74. doi: 10.1300/J411v14n01_07
7. Vollmann J, Rajcan I. Oil crop breeding and genetics. In: Vollmann J, Rajcan I, editors. Oil Crops. New York, NY: Springer (2009). p. 1–30. doi: 10.1007/978-0-387-77594-4_1
8. McCue P, Shetty K. Health benefits of soy isoflavonoids and strategies for enhancement: a review. Crit Rev Food Sci Nutr. (2004) 44:361–7. doi: 10.1080/10408690490509591
9. Bramley PM, Elmadfa I, Kafatos A, Kelly FJ, Manios Y, Roxborough HE, et al. Vitamin E. J Sci Food Agric. (2000) 80. doi: 10.1002/(SICI)1097-001080:7<913::AID–JSFA600>3.0.CO;2-3
10. Lee SJ, Yan W, Ahn JK, Chung IM. Effects of year, site, genotype and their interactions on various soybean isoflavones. Field Crops Res. (2003) 81:181–92. doi: 10.1016/S0378-4290(02)00220-4
11. Carrera CS, Dardanelli JL, Soldini DO. Genotypic and environmental variation in seed nutraceutical and industrial composition of non-transgenic soybean (Glycine max) genotypes. Crop Pasture Sci. (2014) 65:1311–22. doi: 10.1071/CP14114
12. Dolde D, Vlahakis C, Hazebroek J. Tocopherols in breeding lines and effects of planting location, fatty acid composition, and temperature during development. J Am Oil Chem Soc. (1999) 76:349–55. doi: 10.1007/s11746-999-0242-9
13. Hoeck JA, Fehr WR, Murphy PA, Welke GA. Influence of genotype and environment on isoflavone contents of soybean. Crop Sci. (2000) 40:48–51. doi: 10.2135/cropsci2000.40148x
14. Primomo VS, Falk DE, Ablett GR, Tanner JW, Rajcan I. Genotype × environment interactions, stability, and agronomic performance of soybean with altered fatty acid profiles. Crop Sci. (2002) 42:37–44. doi: 10.2135/cropsci2002.3700
15. Carrera C, Martínez MJ, Dardanelli J, Balzarini M. Water deficit effect on the relationship between temperature during the seed fill period and soybean seed oil and protein concentrations. Crop Sci. (2009) 49:990–8. doi: 10.2135/cropsci2008.06.0361
16. Wang HJ, Murphy PA. Isoflavone composition of American and Japanese soybeans in Iowa: effects of variety, crop year, and location. J Agric Food Chem. (1994) 42:1674–7. doi: 10.1021/jf00044a017
17. Poysa V, Woodrow L. Stability of soybean seed composition and its effect on soymilk and tofu yield and quality. Food Res Int. (2002) 35:337–45. doi: 10.1016/S0963-9969(01)00125-9
18. Carrão-Panizzi MC, Erhan SZ. Environmental and genetic variation of soybean tocopherol content under brazilian growing conditions. J Am Oil Chem Soc. (2007) 84:921–8. doi: 10.1007/s11746-007-1128-3
19. Whent M, Hao J, Slavin M, Zhou M, Song J, Kenworthy W, et al. Effect of genotype, environment, and their interaction on chemical composition and antioxidant properties of low-linolenic soybeans grown in Maryland. J Agric Food Chem. (2009) 57:10163–74. doi: 10.1021/jf902344h
20. Harrigan GG, Culler AH, Culler M, Breeze ML, Berman KH, Halls SC, et al. Investigation of biochemical diversity in a soybean lineage representing 35 years of breeding. J Agric Food Chem. (2013) 61:10807–15. doi: 10.1021/jf4032102
21. Harrigan GG, Lundry D, Drury S, Berman K, Riordan SG, Nemeth MA, et al. Natural variation in crop composition and the impact of transgenesis. Nat Biotechnol. (2010) 28:402–4. doi: 10.1038/nbt0510-402
22. Carrera C, Martínez MJ, Dardanelli J, Balzarini M. Environmental variation and correlation of seed components in nontransgenic soybeans: protein, oil, unsaturated fatty acids, tocopherols, and isoflavones. Crop Sci. (2011) 51:800–9. doi: 10.2135/cropsci2010.06.0314
23. Morrison M, Cober E, Saleem M, McLaughlin N, Fregeau-Reid J, Ma B, et al. Changes in isoflavone concentration with 58 years of genetic improvement of short-season soybean cultivars in Canada. Crop Sci. (2008) 48:2201–8. doi: 10.2135/cropsci2008.01.0023
24. Charron CS, Allen FL, Johnson RD, Pantalone VR, Sams CE. Correlations of oil and protein with isoflavone concentration in soybean [Glycine max (L.) Merr.]. J Agric Food Chem. (2005) 53:7128–35. doi: 10.1021/jf050610o
25. Gibson L, Mullen R. Soybean seed composition under high day and night growth temperatures. J Am Oil Chem Soc. (1996) 73:733–7. doi: 10.1007/BF02517949
26. Hurburgh CR Jr, Brumm TJ, Guinn JM, Hartwig RA. Protein and oil patterns in US and world soybean markets. J Am Oil Chem Soc. (1990) 67:966–73. doi: 10.1007/BF02541859
27. Piper EL, Boote KI. Temperature and cultivar effects on soybean seed oil and protein concentrations. J Am Oil Chem Soc. (1999) 76:1233–41. doi: 10.1007/s11746-999-0099-y
28. Al-Tawaha A, Seguin P. Seeding date, row spacing, and weed effects on soybean isoflavone concentrations and other seed characteristics. Can J Plant Sci. (2006) 86:1079–87. doi: 10.4141/P06-043
29. Seguin P, Zheng W, Smith DL, Deng W. Isoflavone content of soybean cultivars grown in eastern Canada. J Sci Food Agric. (2004) 84:1327–32. doi: 10.1002/jsfa.1825
30. Izquierdo N, Nolasco S, Mateo C, Santos D, Aguirrezábal L. Relationship between oil tocopherol concentration and oil weight per grain in several crop species. Crop Pasture Sci. (2012) 62:1088–97. doi: 10.1071/CP11313
31. Cook DJ, Mulrow CD, Haynes RB. Systematic reviews: synthesis of best evidence for clinical decisions. Ann Intern Med. (1997) 126:376–80. doi: 10.7326/0003-4819-126-5-199703010-00006
32. Lang TA, Lang T, Secic M. How to Report Statistics in Medicine: Annotated Guidelines for Authors, Editors, and Reviewers. Philadelphia, PA: ACP Press (2006).
33. French R, Schultz J. Water use efficiency of wheat in a Mediterranean-type environment. II. Some limitations to efficiency. Aust J Agric Res. (1984) 35:765–75. doi: 10.1071/AR9840765
34. Lollato RP, Figueiredo BM, Dhillon JS, Arnall DB, Raun WR. Wheat grain yield and grain-nitrogen relationships as affected by N, P, and K fertilization: a synthesis of long-term experiments. Field Crops Res. (2019) 236:42–57. doi: 10.1016/j.fcr.2019.03.005
35. Ciampitti IA, Salvagiotti F. New insights into soybean biological nitrogen fixation. Agron J. (2018) 110:1185–96. doi: 10.2134/agronj2017.06.0348
36. Mourtzinis S, Kaur G, Orlowski JM, Shapiro CA, Lee CD, Wortmann C, et al. Soybean response to nitrogen application across the United States: a synthesis-analysis. Field Crops Res. (2018) 215:74–82. doi: 10.1016/j.fcr.2017.09.035
37. Salvagiotti F, Magnano L, Ortez O, Enrico J, Barraco M, Barbagelata P, et al. Estimating nitrogen, phosphorus, potassium, and sulfur uptake and requirement in soybean. Euro J Agron. (2021) 127:126289. doi: 10.1016/j.eja.2021.126289
38. Carrera CS, Seguin P. Factors affecting tocopherol concentrations in soybean seeds. J Agric Food Chem. (2016) 64:9465–74. doi: 10.1021/acs.jafc.6b03902
39. Medic J, Atkinson C, Hurburgh CR Jr. Current knowledge in soybean composition. J Am Oil Chem Soc. (2014) 91:363–84. doi: 10.1007/s11746-013-2407-9
40. Wang Y, Frei M. Stressed food–The impact of abiotic environmental stresses on crop quality. Agric Ecosyst Environ. (2011) 141:271–86. doi: 10.1016/j.agee.2011.03.017
41. Winkel-Shirley B. Biosynthesis of flavonoids and effects of stress. Curr Opin Plant Biol. (2002) 5:218–23. doi: 10.1016/S1369-5266(02)00256-X
42. Ciampitti IA, Vyn TJ. A comprehensive study of plant density consequences on nitrogen uptake dynamics of maize plants from vegetative to reproductive stages. Field Crops Res. (2011) 121:2–18. doi: 10.1016/j.fcr.2010.10.009
43. Hellevang KJ. Grain Moisture Content Effects and Management. Fargo, ND: NDSU, Extension Service AE-905 (1995).
44. Carrera CS, Rosas MB, Gontijo Mandarino JM, Santos Leite R, Raspa F, Fava F, et al. Calidad industrial-nutricional y peso del grano de soja: respuesta a la radiación solar. In: Proceedings of VII Congreso Mercosoja 2019. Rosario (2019).
45. Carrera CS, Dardanelli JL. Changes in the relationship between temperature during the seed-filling period and soya bean seed isoflavones under water-deficit conditions. J Agron Crop Sci. (2016) 202:421–32. doi: 10.1111/jac.12147
46. Rizzatti Ávila M, De Lucca E, Braccini A, Scapim CA, Gontijo Mandarino JM, Albrecht LP, Vidigal Filho PS. Componentes do rendimento, teores de isoflavonas, proteínas, óleo e qualidade de sementes de soja. Rev Bras Sementes. (2007) 29:98–111. doi: 10.1590/S0101-31222007000300014
47. Oliveira MIP, Piovesan ND, José IC, Barros EG, Moreira MA, Oliveira LO. Protein, oil, and isoflavone contents in lipoxygenase-and Kunitz trypsin inhibitor-deficient soybean seeds. Chromatographia. (2007) 66:521–7. doi: 10.1365/s10337-007-0339-y
48. Al-Tawaha A, Seguin P, Smith D, Bonnell R. Irrigation level affects isoflavone concentrations of early maturing soya bean cultivars. J Agron Crop Sci. (2007) 193:238–46. doi: 10.1111/j.1439-037X.2007.00263.x
50. Yin X, Vyn TJ. Relationships of isoflavone, oil, and protein in seed with yield of soybean. Agron J. (2005) 97:1314–21. doi: 10.2134/agronj2004.0316
51. Lee J, Hwang Y-S, Kim ST, Yoon W-B, Han WY, Kang I-K, et al. Seed coat color and seed weight contribute differential responses of targeted metabolites in soybean seeds. Food Chem. (2017) 214:248–58. doi: 10.1016/j.foodchem.2016.07.066
52. Bennett JO, Yu O, Heatherly LG, Krishnan HB. Accumulation of genistein and daidzein, soybean isoflavones implicated in promoting human health, is significantly elevated by irrigation. J Agric Food Chem. (2004) 52:7574–9. doi: 10.1021/jf049133k
53. Yu D, Elfalleh W, He S, Ma Y, Jiang L, Li L, et al. Physicochemical properties and minor lipid components of soybean germ. J Am Oil Chem Soc. (2013) 90:1551–8. doi: 10.1007/s11746-013-2306-0
54. Scherder CW, Fehr WR, Welke GA, Wang T. Tocopherol content and agronomic performance of soybean lines with reduced palmitate. Crop Sci. (2006) 46:1286–90. doi: 10.2135/cropsci2005.07-0227
55. Cade BS, Noon BR. A gentle introduction to quantile regression for ecologists. Front Ecol Environ. (2003) 1:412–20. doi: 10.1890/1540-92952003001[0412:AGITQR]2.0.CO;2
56. Koenker R, Hallock KF. Quantile regression. J Econ Perspect. (2001) 15:143–56. doi: 10.1257/jep.15.4.143
57. Salvagiotti F, Cassman KG, Specht JE, Walters DT, Weiss A, Dobermann A. Nitrogen uptake, fixation and response to fertilizer N in soybeans: a review. Field Crops Res. (2008) 108:1–13. doi: 10.1016/j.fcr.2008.03.001
58. Cade B, Richards J. Blossom statistical software. Fort Collins, CO: US Geological Survey, Midcontinent Ecological Science Center (2001).
59. Draper NR, Smith H. Applied Regression Analysis. New York, NY: John Wiley & Sons (1998). doi: 10.1002/9781118625590
60. Dardanelli JL, Balzarini M, Martínez MJ, Cuniberti M, Resnik S, Ramunda SF, et al. Soybean maturity groups, environments, and their interaction define mega-environments for seed composition in Argentina. Crop Sci. (2006) 46:1939–47. doi: 10.2135/cropsci2005.12-0480
61. ILSI. International Life Sciences Institute Crop Composition Database, Version 5.0. (2014). Available online at: www.cropcomposition.org (accessed October 17, 2016).
62. Ujiie A, Yamada T, Fujimoto K, Endo Y, Kitamura K. Identification of soybean varieties with high. ALPHA tocopherol content. Breed Sci. (2005) 55:123–5. doi: 10.1270/jsbbs.55.123
63. Chiari L, Piovesan ND, Naoe LK, José IC, Viana JMS, Moreira MA, et al. Genetic parameters relating isoflavone and protein content in soybean seeds. Euphytica. (2004) 138:55–60. doi: 10.1023/B:EUPH.0000047060.03101.4a
64. Primomo VS, Poysa V, Ablett GR, Jackson C-J, Rajcan I. Agronomic performance of recombinant inbred line populations segregating for isoflavone content in soybean seeds. Crop Sci. (2005) 45:2203–11. doi: 10.2135/cropsci2004.0610
65. Seguin P, Turcotte P, Tremblay G, Pageau D, Liu W. Tocopherols concentration and stability in early maturing soybean genotypes. Agron J. (2009) 101:1153–9. doi: 10.2134/agronj2009.0140
66. Morrison M, Cober E, Frégeau-Reid J, Seguin P. Changes in lutein and tocopherol concentrations in soybean cultivars released across seven decades in the short-season region. Crop Sci. (2015) 55:312–9. doi: 10.2135/cropsci2014.04.0294
67. Shaw EJ, Kakuda Y, Rajcan I. Effect of genotype, environment, and genotype × environment interaction on tocopherol accumulation in soybean seed. Crop Sci. (2016) 56:40–50. doi: 10.2135/cropsci2015.02.0069
68. McCord KL, Fehr WR, Wang T, Welke GA, Cianzio SR, Schnebly SR. Tocopherol content of soybean lines with reduced linolenate in the seed oil. Crop Sci. (2004) 44:772–6. doi: 10.2135/cropsci2004.7720
69. Taylor R. Interpretation of the correlation coefficient: a basic review. J Diagn Med Sonogr. (1990) 6:35–9. doi: 10.1177/875647939000600106
70. Sadras VO. On water-use efficiency, boundary functions and yield gaps: French and Schultz insight and legacy. Crop Sci. (2020) 60:1450–61. doi: 10.1002/csc2.20188
71. Nolasco S, Aguirrezábal L, Crapiste G. Tocopherol oil concentration in field-grown sunflower is accounted for by oil weight per seed. J Am Oil Chem Soc. (2004) 81:1045–51. doi: 10.1007/s11746-004-1020-6
72. Gunstone F. Vegetable Oils in Food Technology: Composition, Properties and Uses. Ames, IA: John Wiley & Sons (2011). doi: 10.1002/9781444339925
73. Carrão-Panizzi MC, Berhow M, Mandarino JMG, Oliveira MCNd. Environmental and genetic variation of isoflavone content of soybean seeds grown in Brazil. Pesqui Agropecu Bras. (2009) 44:1444–51. doi: 10.1590/S0100-204X2009001100011
74. Murphy SE, Lee EA, Woodrow L, Seguin P, Kumar J, Rajcan I, et al. Genotype × environment interaction and stability for isoflavone content in soybean. Crop Sci. (2009) 49:1313–21. doi: 10.2135/cropsci2008.09.0533
75. Azam M, Zhang S, Abdelghany AM, Shaibu AS, Feng Y, Li Y, et al. Seed isoflavone profiling of 1168 soybean accessions from major growing ecoregions in China. Food Res Int. (2020) 130:108957. doi: 10.1016/j.foodres.2019.108957
76. Eldridge AC, Kwolek WF. Soybean isoflavones: effect of environment and variety on composition. J Agric Food Chem. (1983) 31:394–6. doi: 10.1021/jf00116a052
77. Zhang J, Ge Y, Han F, Li B, Yan S, Sun J, et al. Isoflavone content of soybean cultivars from maturity group 0 to VI grown in northern and southern China. J Am Oil Chem Soc. (2014) 91:1019–28. doi: 10.1007/s11746-014-2440-3
78. Britz SJ, Kremer DF, Kenworthy WJ. Tocopherols in soybean seeds: genetic variation and environmental effects in field-grown crops. J Am Oil Chem Soc. (2008) 85:931–6. doi: 10.1007/s11746-008-1286-y
79. Rotundo JL, Westgate ME. Meta-analysis of environmental effects on soybean seed composition. Field Crops Res. (2009) 110:147–56. doi: 10.1016/j.fcr.2008.07.012
80. Kassem MA, Meksem K, Iqbal M, Njiti V, Banz W, Winters T, et al. Definition of soybean genomic regions that control seed phytoestrogen amounts. J Biomed Biotechnol. (2004) 2004:52–60. doi: 10.1155/S1110724304304018
81. Rotundo JL, Borrás L, Westgate ME, Orf JH. Relationship between assimilate supply per seed during seed filling and soybean seed composition. Field Crops Res. (2009) 112:90–6. doi: 10.1016/j.fcr.2009.02.004
82. Nelson RL, Wang P. Variation and evaluation of seed shape in soybean. Crop Sci. (1989) 29:147–50. doi: 10.2135/cropsci1989.0011183X002900010033x
83. Aguirrezábal L, Martre P, Pereyra-Irujo G, Echarte MM, Izquierdo N. Improving grain quality: ecophysiological and modeling tools to develop management and breeding strategies, Crop Physiol. (2015) 2015:423–65. doi: 10.1016/B978-0-12-417104-6.00017-0
84. Wilcox Jr, Shibles RM. Interrelationships among seed quality attributes in soybean. Crop Sci. (2001) 41:11–4. doi: 10.2135/cropsci2001.41111x
Keywords: total isoflavone, total tocopherol, soybean seed composition, seed weight, nutraceutical compounds
Citation: Carrera CS, Salvagiotti F and Ciampitti IA (2021) Benchmarking Nutraceutical Soybean Composition Relative to Protein and Oil. Front. Nutr. 8:663434. doi: 10.3389/fnut.2021.663434
Received: 18 February 2021; Accepted: 15 July 2021;
Published: 11 August 2021.
Edited by:
Antonello Santini, University of Naples Federico II, ItalyReviewed by:
Veda Krishnan, Indian Council of Agricultural Research (ICAR), IndiaMarcin Szymanski, Adam Mickiewicz University, Poland
Copyright © 2021 Carrera, Salvagiotti and Ciampitti. This is an open-access article distributed under the terms of the Creative Commons Attribution License (CC BY). The use, distribution or reproduction in other forums is permitted, provided the original author(s) and the copyright owner(s) are credited and that the original publication in this journal is cited, in accordance with accepted academic practice. No use, distribution or reproduction is permitted which does not comply with these terms.
*Correspondence: Constanza S. Carrera, Y2FycmVyYS5jb25zdGFuemFAaW50YS5nb2IuYXI=; Fernando Salvagiotti, c2FsdmFnaW90dGkuZmVybmFuZG9AaW50YS5nb2IuYXI=; Ignacio A. Ciampitti, Y2lhbXBpdHRpQGtzdS5lZHU=