 Li Chen1,2†
 Yihang Qi2†
 Xiangyi Kong2
 Zhaohui Su3
 Zhongzhao Wang2Xiangyu Wang2
 Yaying Du1
 Yi Fang2*
 Xingrui Li1*
 Jing Wang2*
- 1Department of Thyroid and Breast Surgery, Tongji Hospital, Tongji Medical College of Huazhong University of Science and Technology, Wuhan, China
- 2Department of Breast Surgical Oncology, National Cancer Center/National Clinical Research Center for Cancer/Cancer Hospital, Chinese Academy of Medical Sciences and Peking Union Medical College, Beijing, China
- 3Center on Smart and Connected Health Technologies, Mays Cancer Center, School of Nursing, University of Texas Health Science Center, San Antonio, TX, United States
Nutritional risk index (NRI) is an index based on ideal body weight that aims to present body weight and serum albumin levels. It has been utilized to discriminate patients at risk of postoperative complications and predict the postoperative outcome of major surgeries. However, this index remains limited for breast cancer patients treated with neoadjuvant chemotherapy (NACT). The research explores the clinical and prognostic significance of NRI in breast cancer patients. This study included 785 breast cancer patients (477 cases received NACT and 308 cases did not) were enrolled in this retrospective study. The optimal NRI cutoff value was evaluated by receiver operating characteristic (ROC) curve, then reclassified as low NRI group (<112) and high NRI group (≥112). The results demonstrated that NRI independently predicted survival on disease-free survival (DFS) and overall survival (OS) by univariate and multivariate Cox regression survival analyses [P = 0.019, hazard ratio (HR): 1.521, 95% CI: 1.071–2.161 and P = 0.004, HR: 1.415, 95% CI: 1.119–1.789; and P = 0.026, HR:1.500, 95% CI: 1.051–2.143 and P < 0.001, HR: 1.547, 95% CI: 1.221–1.959]. According to the optimal cutoff value of NRI, the high NRI value patients had longer mean DFS and OS time in contrast to those with low NRI value patients (63.47 vs. 40.50 months; 71.50 vs. 56.39 months). Furthermore, the results demonstrated that the high NRI score patients had significantly longer mean DFS and OS time than those with low NRI score patients in early-stage breast cancer (χ2 = 9.0510, P = 0.0026 and χ2 = 9.2140, P = 0.0024) and advanced breast cancer (χ2 = 6.2500, P = 0.0124 and χ2 = 5.8880, P = 0.0152). The mean DFS and OS values in patients with high NRI scores were significantly longer in contrast to those with low NRI scores in different molecular subtypes. The common toxicities after NACT were hematologic and gastrointestinal reactions, and the NRI had no statistically significant effects on toxicities, except in nausea (χ2 = 9.2413, P = 0.0024), mouth ulcers (χ2 = 4.8133, P = 0.0282), anemia (χ2 = 8.5441, P = 0.0140), and leukopenia (χ2 = 11.0951, P = 0.0039). NRI serves as a minimally invasive, easily accessible and convenient prognostic tool for evaluating breast cancer prognoses and treatment efficacy, and may help doctors in terms of selecting measures of greater efficiency or appropriateness to better treat breast cancer.
Introduction
Breast cancer is among the most frequently diagnosed cancers in women globally, and seriously endangers their health (1). Although breast cancer often yields relatively more satisfactory prognoses compared to other types of cancer (e.g., lung cancer), the survival outcomes of patients with aggressive pathological breast cancer or distant metastasis remain to be alarmingly poor—about 90% of breast cancer deaths are caused by the occurrence of distant metastasis (2). As scientific evidence accumulates, treatment strategies, such as surgery, hormone therapy, targeted therapy, and immunotherapy, have forged a comprehensive network of promising treatments with varying degrees of curative effects (3). Aside from the differences in disease conditions, nutritional status also plays an essential role in shaping patients' prognosis as well as treatment efficacy and outcomes.
Decreased appetite with weight loss and cachexia, for instance, can be commonly found in cancer patients (4, 5). As a complicated and multifactorial syndrome, cachexia affects ~50–80% of cancer patients, and is correlated with 20–40% of cancer deaths (6). It is important to note that poor nutritional status not only accelerates the progression of cancer, but also hinders the treatment of the disease, effectively creating a vicious circle that impacts both cancer care and treatment (7, 8). Previous studies found that malnutrition could cause patients' poor response to antitumor therapy, increase the incidence of postoperative complications, and subsequently, result in unsatisfactory survival prognosis (9, 10). In addition, cachexia may be a direct cause of death for cancer patients (11). In one retrospective autopsy study, for instance, the results show that ~1% of 486 patients with cancer died from no other cause but cachexia (11). While some emerging evidence suggests that response rates of chemotherapy were lower among weight-losing patients, limited research on this relationship in breast cancer patients is available (12). Hence, it is of vital significance to discover more convenient indicators to evaluate the effect of nutritional status on disease prognosis and treatment efficacy in breast cancer patients.
Currently known indicators that reflect patients' nutritional status range from the assessment of patients' total body weight (TBW), globulin (GLB), albumin to globulin ratio (AGR), body mass index (BMI), to the prognostic nutritional index (PNI). For instance, previous studies show that malnutrition was related to poor treatment outcomes among patients with various types of cancers (13–15). Nevertheless, people know little about the relationship between nutritional status, cancer prognosis, and treatment efficacy in breast cancer patients (16). Existing evidence often suggests that breast cancer might be related to overnutrition, as opposed to malnutrition (17), effectively contradicting what is known about the predictive role of nutritional status in cancer patients.
To further cloud the research field, research indicates that factors such as BMI might be an unstable indicator of breast cancer patients' nutrition status-the relationship between BMI and the risk of women developing breast cancer differs by patients' menopausal status: in premenopausal women, most studies found either no association or a weak inverse correlation (18); however, in postmenopausal women, greater levels of BMI often increase women's likelihood of receiving a breast cancer diagnosis (19). One way to better shed light on the relationship between nutritional status, cancer prognosis, and treatment efficacy in breast cancer patients is via close examinations of less-studied factors such as the Nutritional Risk Index (NRI).
NRI is one of the most promising assessment tools in gauging the impact of nutritional status on cancer patients' morbidity and mortality rates (20). It is a composite index that factors in changes in patients' ideal body weight, present body weight, and serum albumin levels, and could serve as a convenient screening mechanism to predict the incidence rate of nutrition-related morbidity and mortality in cancer patients (21). For instance, current evidence suggests that low preoperative NRI was associated with poor prognosis and increased postoperative complications and can serve as an indicator in elderly colorectal cancer patients (22). However, this index remains limited for breast cancer patients treated with neoadjuvant chemotherapy. Therefore, to bridge the research gap, the current study aims to evaluate the clinical and prognostic significance of NRI in breast cancer patients, and the correlation between NRI and the treatment efficacy.
Materials and Methods
Study Population
The retrospective study included a total of 785 participants-477 patients with breast cancer undergoing NACT (NACT group) and 308 breast cancer patients as control (non-NACT group). All patients received surgery at a large national hospital located in Beijing, China between January 1998 and December 2016. Anthracyclines-based and/or taxanes-based chemotherapy regimens were used for 477 breast cancer patients received NACT treatment. The detailed clinicopathological data were obtained from the patients' electronic medical records. This study was covered under Institutional Review Board (IRB) approved of Cancer Hospital Chinese Academy of Medical Sciences and Tongji Hospital, and it adheres to the standards of the Declaration of Helsinki and its subsequent amendments. All of the patients provided written consent before participating in the study.
Participants were considered as eligible if they were breast cancer patients who had: (1) Confirmed by pathology; (2) Undergone primary tumor resection; (3) Performance Status (Zubrod-ECOG-WHO, ZPS) between 0 and 2 scores, and Karnofsky Performance Scores (KPS) ≥80 scores; (4) complete clinical recorded and follow-up data for all patients; (5) Expected to survive over 3 months; (6) Admission examination showed no obvious abnormalities in liver and renal function. Exclusion criteria were: (1) Patients received relevant anti-tumor therapy, such as chemotherapy, radiotherapy; (2) With serious complications, for instance, infection, pneumonia, skin ulcer; (3) Patients with chronic inflammatory diseases or autoimmune disease, for example, liver cirrhosis, systemic lupus erythematosus (SLE); (4) With distant organ metastasis; (5) Blood product transfusion within 1 month before treatment.
Pre-treatment Evaluation and TNM Classification
The 8th edition American Joint Committee on Cancer (AJCC) and the Union for International Cancer Control (UICC) were used to evaluate TNM stage classification (23, 24). The Response Evaluation Criteria in Solid Tumors (RECIST) guidelines were performed to evaluate the response rates of patients who received NACT (25). The Miller and Payne grade (MPG) framework was used to assess the histological response of the participants (26). The National Cancer Institute Common Toxicity Criteria (NCI-CTC) was used to assess the chemotherapy toxicity and adverse effects (27). Molecular classification of breast cancer was triple-negative type, HER2-enriched type, Luminal B HER2-negative type, Luminal B HER2-positive type, and Luminal A type, respectively (28).
Peripheral Venous Blood Parameters and Nutritional Factors
All of patients' blood samples were taken within 7 days before treatment. NRI is calculated as follows: 1.519 × serum albumin level (g/l) + 41.7 × (present/ideal body weight). And the ideal weight (Wlo) was calculated using the following formula: Height-100-[(Height-150)/2.5].
Follow-Up
Follow-up modalities included clinical examination, laboratory tests (routine blood test and blood biochemical), imaging examination (ultrasonography, mammography, and computed tomography of the chest). Follow-up evaluations were performed: (1) every 3 months for the first to second year postoperatively, (2) every 6 months for the third to fifth year postoperatively, (3) then yearly thereafter. Disease-free survival (DFS) was the duration from date of surgery to tumor recurrence, distant metastases, the date of death from any cause or last follow-up. Overall survival (OS) was the duration from the date of surgery to the date of death from any cause or last follow-up. Follow-up data were obtained from medical records, both inpatients and outpatients.
Statistical Analysis
The optimal cutoff values of related variables were utilized receiver operating characteristic (ROC) curves. The qualitative data was presented as the number of cases (%), and with intergroup comparisons performed in Chi-square test or Fisher's exact test. Survival curves, including DFS and OS, were generated using the Kaplan-Meier method coupled with the Log-rank test. The univariate and multivariate Cox proportional hazards regression model was used to discern potential prognostic factors. The association between patients' NRI and prognosis was performed using hazard ratios (HRs) and 95% confidence intervals (CIs). All statistical analyses were carried out by SPSS 17.0 (SPSS Inc., Chicago, IL, USA) and GraphPad prism 8.0 (GraphPad Inc., La Jolla, CA, USA). Alpha was set at the 0.05 level, and a two-tailed P < 0.05 was interpreted to achieve statistically significant.
Results
Demographic and Clinicopathologic Features
The ROC curve was used to confirm the optimal cutoff value of NRI, and the value was 112. Two NRI groups were formed by the optimal NRI cutoff value: low NRI group (NRI <112) and high NRI group (NRI ≥ 112). Of all patients, in the results demonstrated that age (χ2 = 4.2272, P = 0.0398), menopause (χ2 = 12.6300, P = 0.0004), US-LNM (χ2 = 6.6599, P = 0.0099), total lymph nodes (χ2 = 8.7863, P = 0.0030), total axillary lymph nodes (χ2 = 6.9193, P = 0.0085) were statistically significant differences between the two NRI groups. Other parameters were not statistically significant differences between the two NRI groups (P > 0.05) (see Table 1).
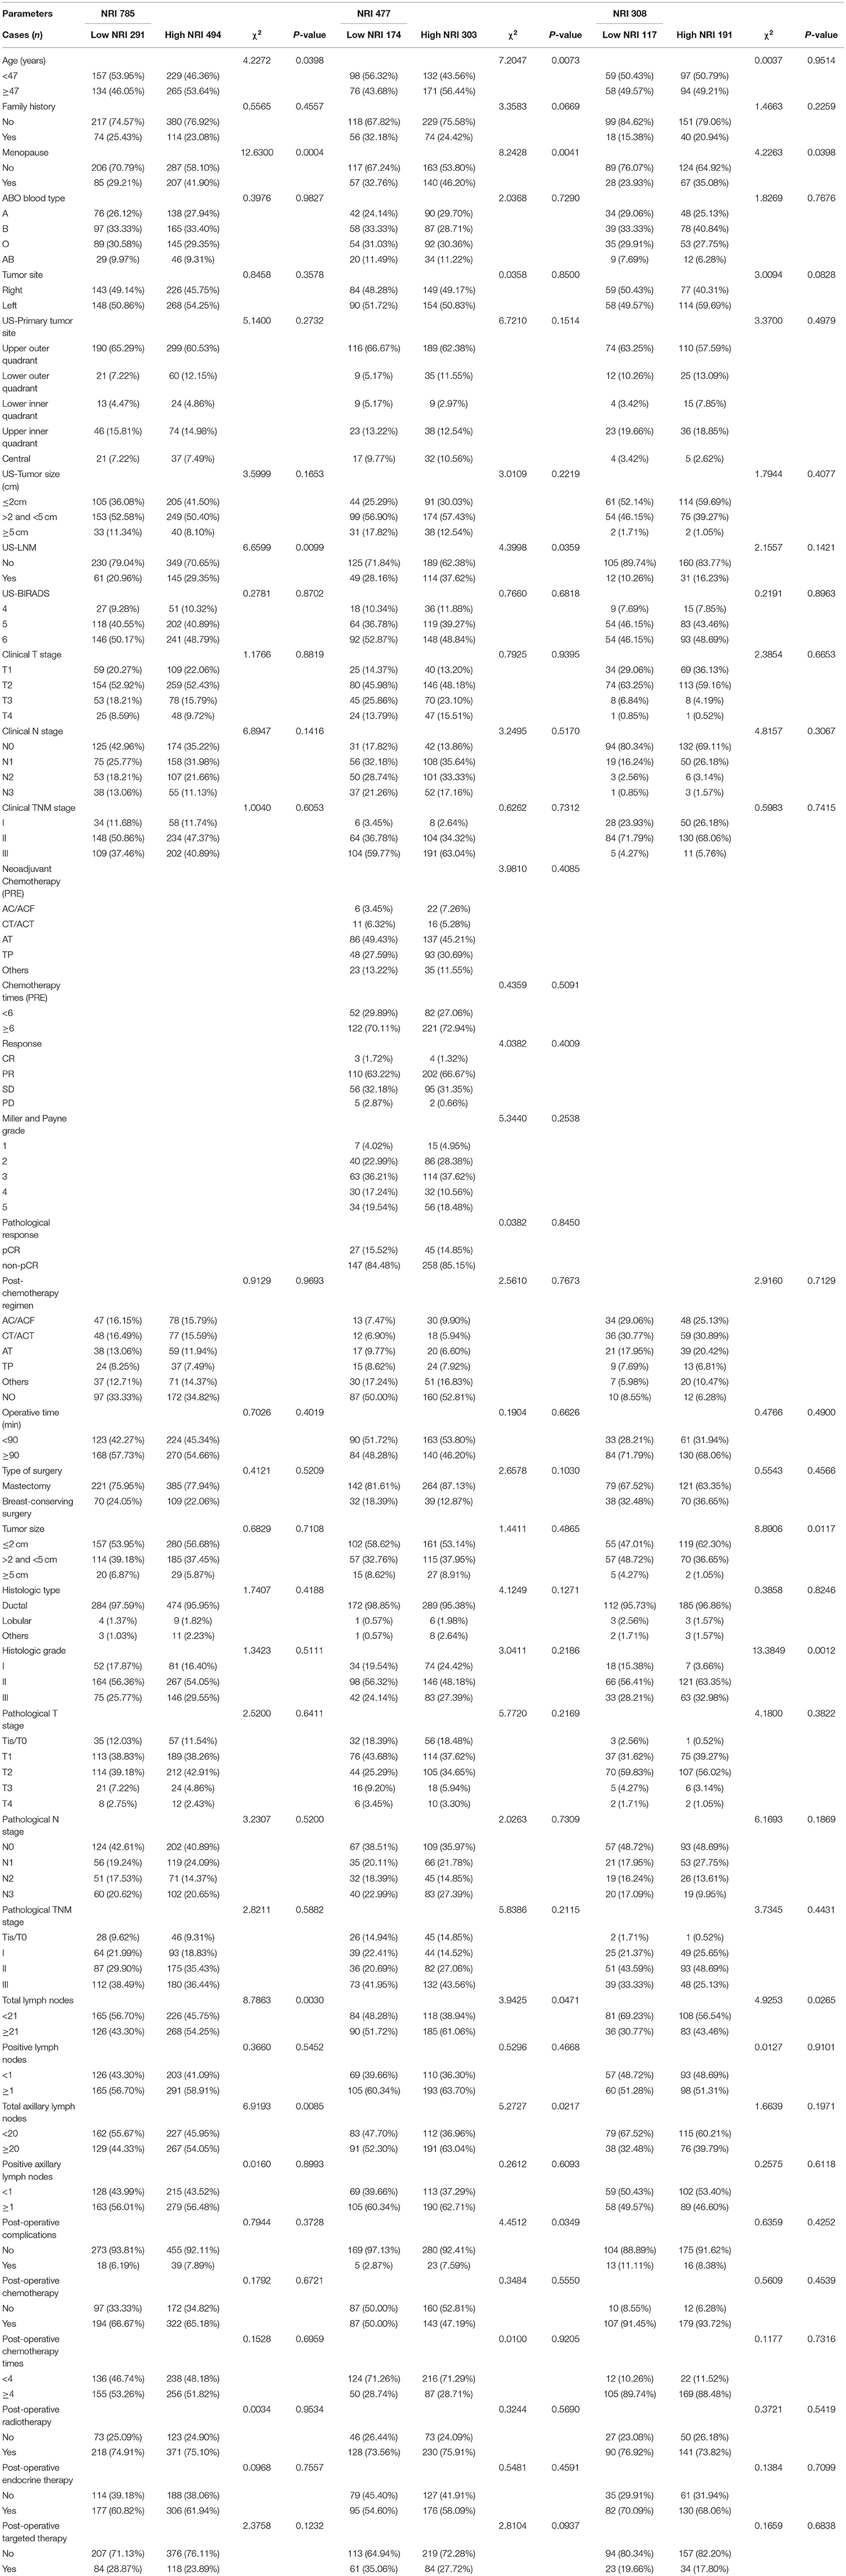
Table 1. Demographic and clinicopathologic characteristics of the study's 785 breast cancer participants.
Nutritional Parameters and Hematological Parameters
Of all enrolled patients, there were significant differences in weight (χ2 = 165.5080, P < 0.0001), Body Mass Index (BMI) (χ2 = 189.1500, P < 0.0001), Alanine aminotransferase (ALT) (χ2 = 14.2711, P = 0.0002), Aspartate aminotransferase (AST) (χ2 = 8.6402, P = 0.0033), Lactate dehydrogenase (LDH) (χ2 = 19.1932, P < 0.0001), γ-glutamyl transpeptidase (GGT) (χ2 = 22.926, P < 0.001), Alkaline phosphatase (ALP) (χ2 = 12.861, P = 0.0003), Blood glucose (GLU) (χ2 = 13.713, P < 0.001), Immunoglobulin G (IgG) (χ2 = 15.8213, P < 0.0001), Albumin (ALB) (χ2 = 135.2380, P < 0.0001), White blood cell (W) (χ2 = 6.9193, P = 0.0085), Red blood cell (R) (χ2 = 34.5983, P < 0.0001), Hemoglobin (Hb) (χ2=30.5623, P < 0.0001), Neutrophil (N) (χ2 = 12.2538, P = 0.0005), Eosinophils (E) (χ2 = 5.6190, P = 0.0178), Platelet (P) (χ2 = 13.8379, P = 0.0002), respectively. The results were shown in Table 2.
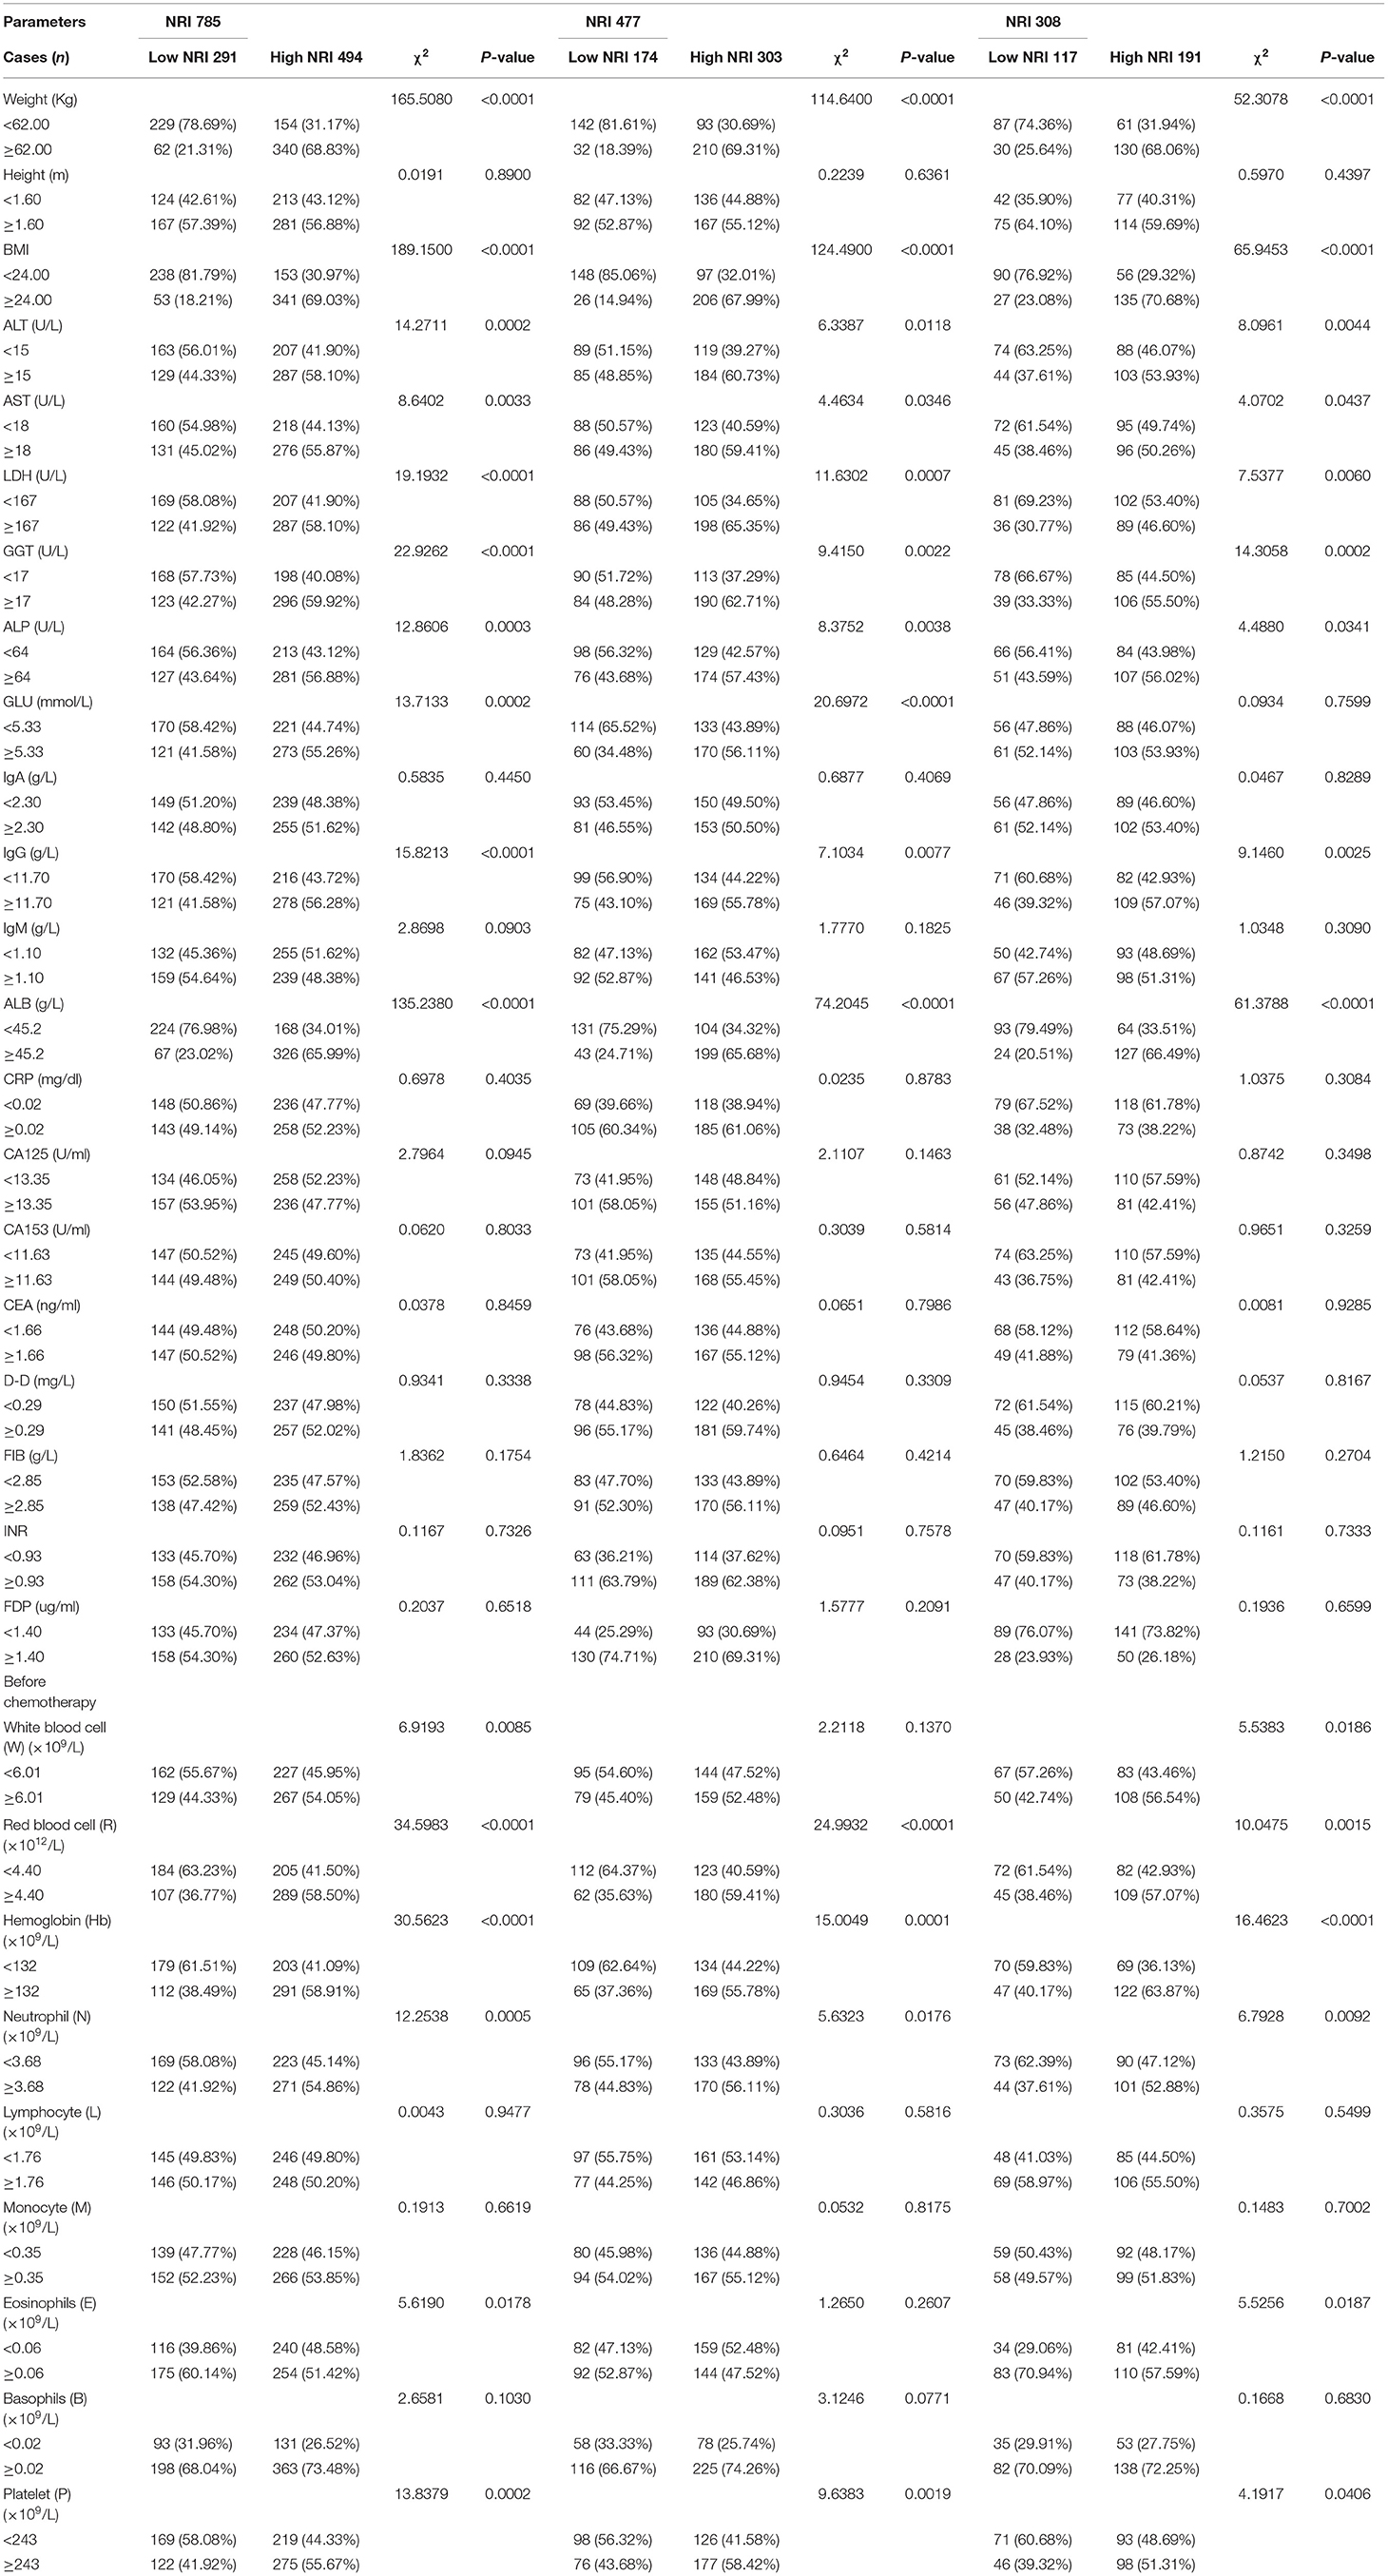
Table 2. The correlation between nutritional parameters/blood parameters and NRI.
Univariate and Multivariate Cox Regression Survival Analyses for Survival Analysis
The univariate and multivariate Cox proportional-hazards models with time-varying NRI were used to analyze the independent prognostic factors. Through univariate and multivariate Cox regression analysis, menopause, GLU, Cancer antigen 125 (CA125), Cancer antigen 153 (CA153), eosinophils, NRI, histologic type, pathological T/N/TNM stage, Ki-67 status, Cytokeratin 5/6 (CK5/6) status, lymph vessel invasion (LVI), post-operative chemotherapy, post-operative endocrine therapy, post-operative targeted therapy were the significant prognostic factors for DFS. Moreover, GLU, CA153, International normalized ratio (INR), monocyte, eosinophils, NRI, clinical T stage, histologic type, pathological T/N/TNM stage, Ki-67 status, CK5/6 status, E-cadherin (E-cad) status, LVI, post-operative chemotherapy, post-operative endocrine therapy, post-operative targeted therapy were the significant prognostic factors for OS (see Table 3).
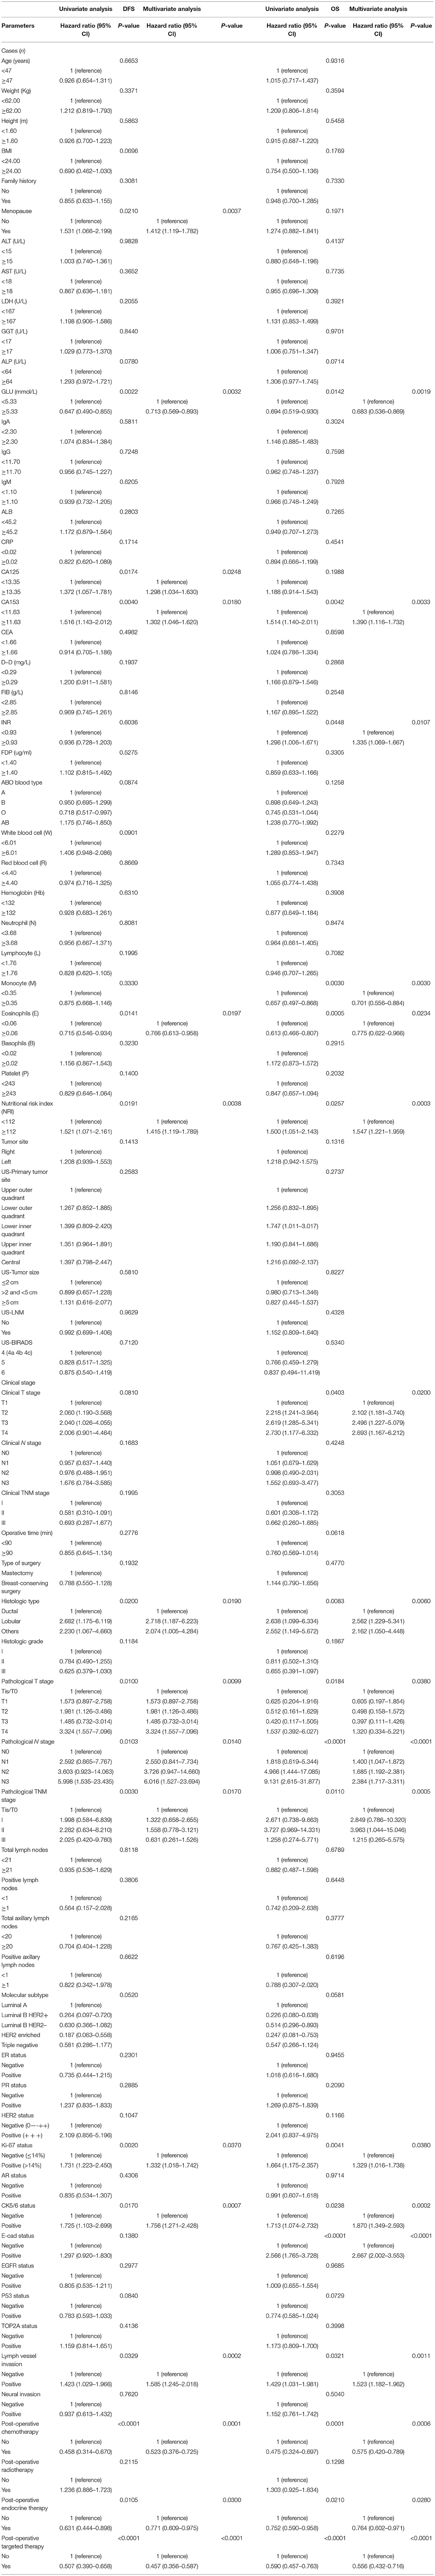
Table 3. Univariate and multivariate cox regression survival analyses of the NRI for the prediction of DFS and OS in the participants.
DFS and OS by NRI
As seen in Table 3, the NRI was the important prognostic factors DFS and OS using the cutoff value of 112. The results performed that high NRI was associated with prolonged DFS and OS (P = 0.019, HR: 1.521, 95% CI: 1.071–2.161 and P = 0.004, HR: 1.415, 95% CI: 1.119–1.789; and P = 0.026, HR: 1.500, 95% CI: 1.051–2.143 and P < 0.001, HR: 1.547, 95% CI: 1.221–1.959, respectively), on both univariate and multivariate analyses.
Of all breast cancer patients, patients with low NRI scores had mean DFS and OS time of 40.50 and 63.47 months, while patients with high NRI scores were 56.39 and 71.50 months, respectively. Furthermore, the mean DFS and OS survive time of NRI in the high group were remarkably longer in contrast to for those of NRI in the low group by the log-rank analysis (χ2 = 13.9500, P = 0.0002 and χ2 = 4.4660, P = 0.0346, respectively; Figures 1A,B). In the NACT group, the mean DFS and OS survive time of NRI in the high group were remarkably longer in contrast to those of NRI in the low group (χ2 = 4.9440, P = 0.0262 and χ2 = 5.3210, P = 0.0211, respectively; Figures 1C,D). In the non-NACT group, the mean DFS and OS survive time of NRI in the high group were remarkably longer in contrast to those of NRI in the low group (χ2 = 8.3230, P = 0.0039 and χ2 = 7.9940, P = 0.0047, respectively; Figures 1E,F).
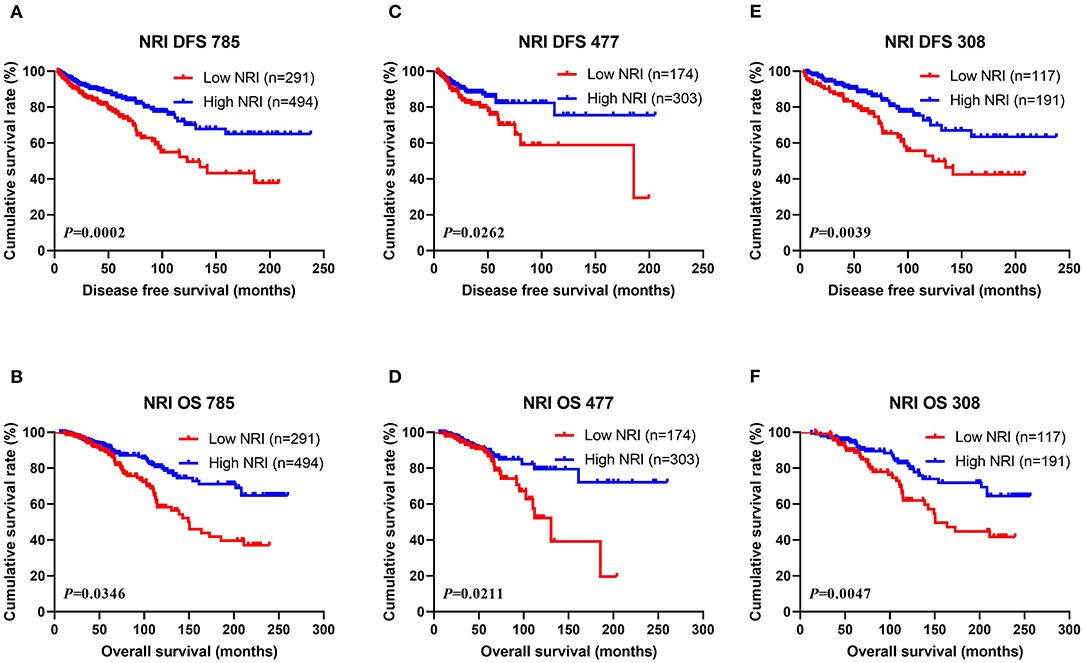
Figure 1. DFS and OS of patients with breast cancer. (A) Kaplan-Meier analysis of DFS for the NRI of all breast cancer patients. (B) Kaplan-Meier analysis of OS for the NRI of all breast cancer patients. (C) Kaplan-Meier analysis of DFS for the NRI of breast cancer patients in NACT group. (D) Kaplan-Meier analysis of OS for the NRI of breast cancer patients in NACT group. (E) Kaplan-Meier analysis of DFS for the NRI of breast cancer patients in non-NACT group. (F) Kaplan-Meier analysis of OS for the NRI of breast cancer patients in non-NACT group.
The Association Between Pathologic Stage and NRI in Breast Cancer Patients
The results shown that pathologic TNM stage was the significant predictor via the univariate and multivariate analyses (see Table 3). In order to further study the efficiency of prediction of NRI, and the NRI was analyzed by the pathologic TNM stage. Of all breast cancer patients, the results shown that patients with high NRI scores had notably longer DFS and OS survive time than those with low NRI scores in early-stage breast cancer (included pathologic Tis/T0 and pathologic I stage) (χ2 = 9.0510, P = 0.0026 and χ2 = 9.2140, P = 0.0024). Similarly, patients with high NRI scores had remarkably longer DFS and OS survive time than those with low NRI scores in advanced stage breast cancer (pathologic II and pathologic III stage) (χ2 = 6.2500, P = 0.0124 and χ2 = 5.8880, P = 0.0152). In the NACT group, the results also indicated that patients with high NRI scores had longer DFS and OS survive time than those with low NRI scores in early-stage breast cancer (χ2 = 3.0700, P = 0.0798 and χ2 = 3.9210, P = 0.0477). Meanwhile, patients with high NRI scores had longer DFS and OS survive time than those with low NRI scores in advanced stage breast cancer (χ2 = 2.2330, P = 0.1351 and χ2 = 2.0160, P = 0.1557). In the non-NACT group, the results demonstrated that patients with high NRI scores had remarkably longer DFS and OS survive time than those with low NRI scores in early-stage breast cancer (χ2 = 7.3580, P = 0.0067 and χ2 = 5.1700, P = 0.0230). Furthermore, patients with high NRI scores had longer DFS and OS than those with low NRI scores in advanced stage breast cancer (χ2 = 3.7450, P = 0.0530 and χ2 = 3.7570, P = 0.0526). See in Figure 2.
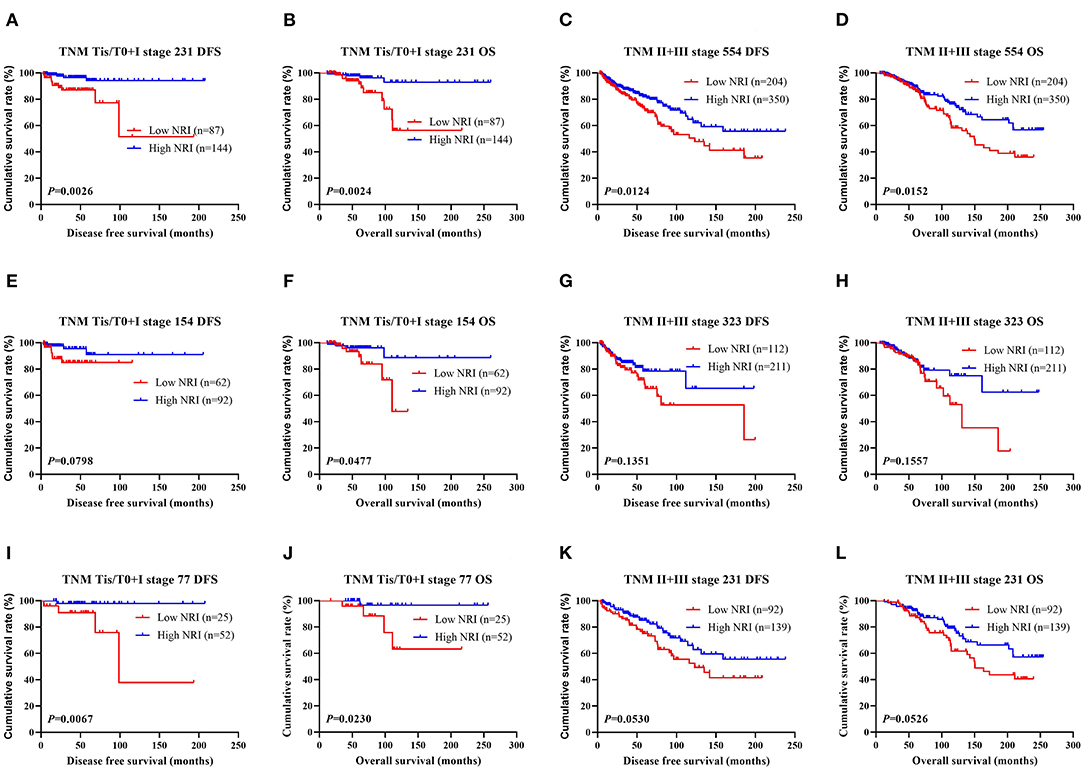
Figure 2. DFS and OS for the NRI of breast cancer patients in different pathologic stages. (A) Kaplan-Meier analysis of DFS for the NRI scores of early-stage breast cancer (Tis/T0+I stage) patients in all enrolled breast cancer patients. (B) Kaplan-Meier analysis of OS for the NRI values of early-stage breast cancer (Tis/T0+I stage) patients in all enrolled breast cancer patients. (C) Kaplan-Meier analysis of DFS for the NRI values of advanced stage breast cancer (II+III stage) patients in all enrolled breast cancer patients. (D) Kaplan-Meier analysis of OS for the NRI levels of advanced stage breast cancer (II + III stage) patients in all enrolled breast cancer patients. (E) Kaplan-Meier analysis of DFS for the NRI values of early-stage breast cancer (Tis/T0 + I stage) patients in NACT group. (F) Kaplan-Meier analysis of OS for the NRI scores of early-stage breast cancer (Tis/T0 + I stage) patients in NACT group. (G) Kaplan-Meier analysis of DFS for the NRI values of advanced stage breast cancer (II + III stage) patients in NACT group. (H) Kaplan-Meier analysis of OS for the NRI values of advanced stage breast cancer (II + III stage) patients in NACT group. (I) Kaplan-Meier analysis of DFS for the NRI scores of early-stage breast cancer (Tis/T0 + I stage) patients in non-NACT group. (J) Kaplan-Meier analysis of OS for the NRI scores of early-stage breast cancer (Tis/T0 + I stage) patients in non-NACT group. (K) Kaplan-Meier analysis of DFS for the NRI values of advanced stage breast cancer (II + III stage) patients in non-NACT group. (L) Kaplan-Meier analysis of OS for the NRI of advanced stage breast cancer (II + III stage) patients in non-NACT group.
The Association Between Pathology Parameters and NRI in Patients With Breast Cancer
The results performed that statistically significant differences were found in TOP2A status (χ2 = 4.0108, P = 0.0452), and no statistically significant differences were observed in the other pathology parameters in all cases (P > 0.05). These findings were shown in Table 4. We also analyzed that the different molecular subtypes by NRI. Of all enrolled patients, the mean DFS and OS survive time for patients with high NRI by the log-rank test were longer than in those with low NRI in Luminal A subtype (χ2 = 0.0496, P = 0.8238 and χ2 = 0.1107, P = 0.7394), Luminal B HER2-positive subtype (χ2 = 0.4465, P = 0.5040 and χ2 = 0.2313, P = 0.6305), Luminal B HER2-negative subtype (χ2 = 3.4830, P = 0.0620 and χ2 = 3.8280, P = 0.0504), HER2-enriched subtype (χ2 = 6.1510, P = 0.0131 and χ2 = 5.6560, P = 0.0174), triple-negative subtype (χ2 = 5.8120, P = 0.0159 and χ2 = 6.9300, P = 0.0085; Figure 3A). Moreover, we also analyzed the molecular subtypes by NRI in the NACT group and the non-NACT group (Figures 3B,C).
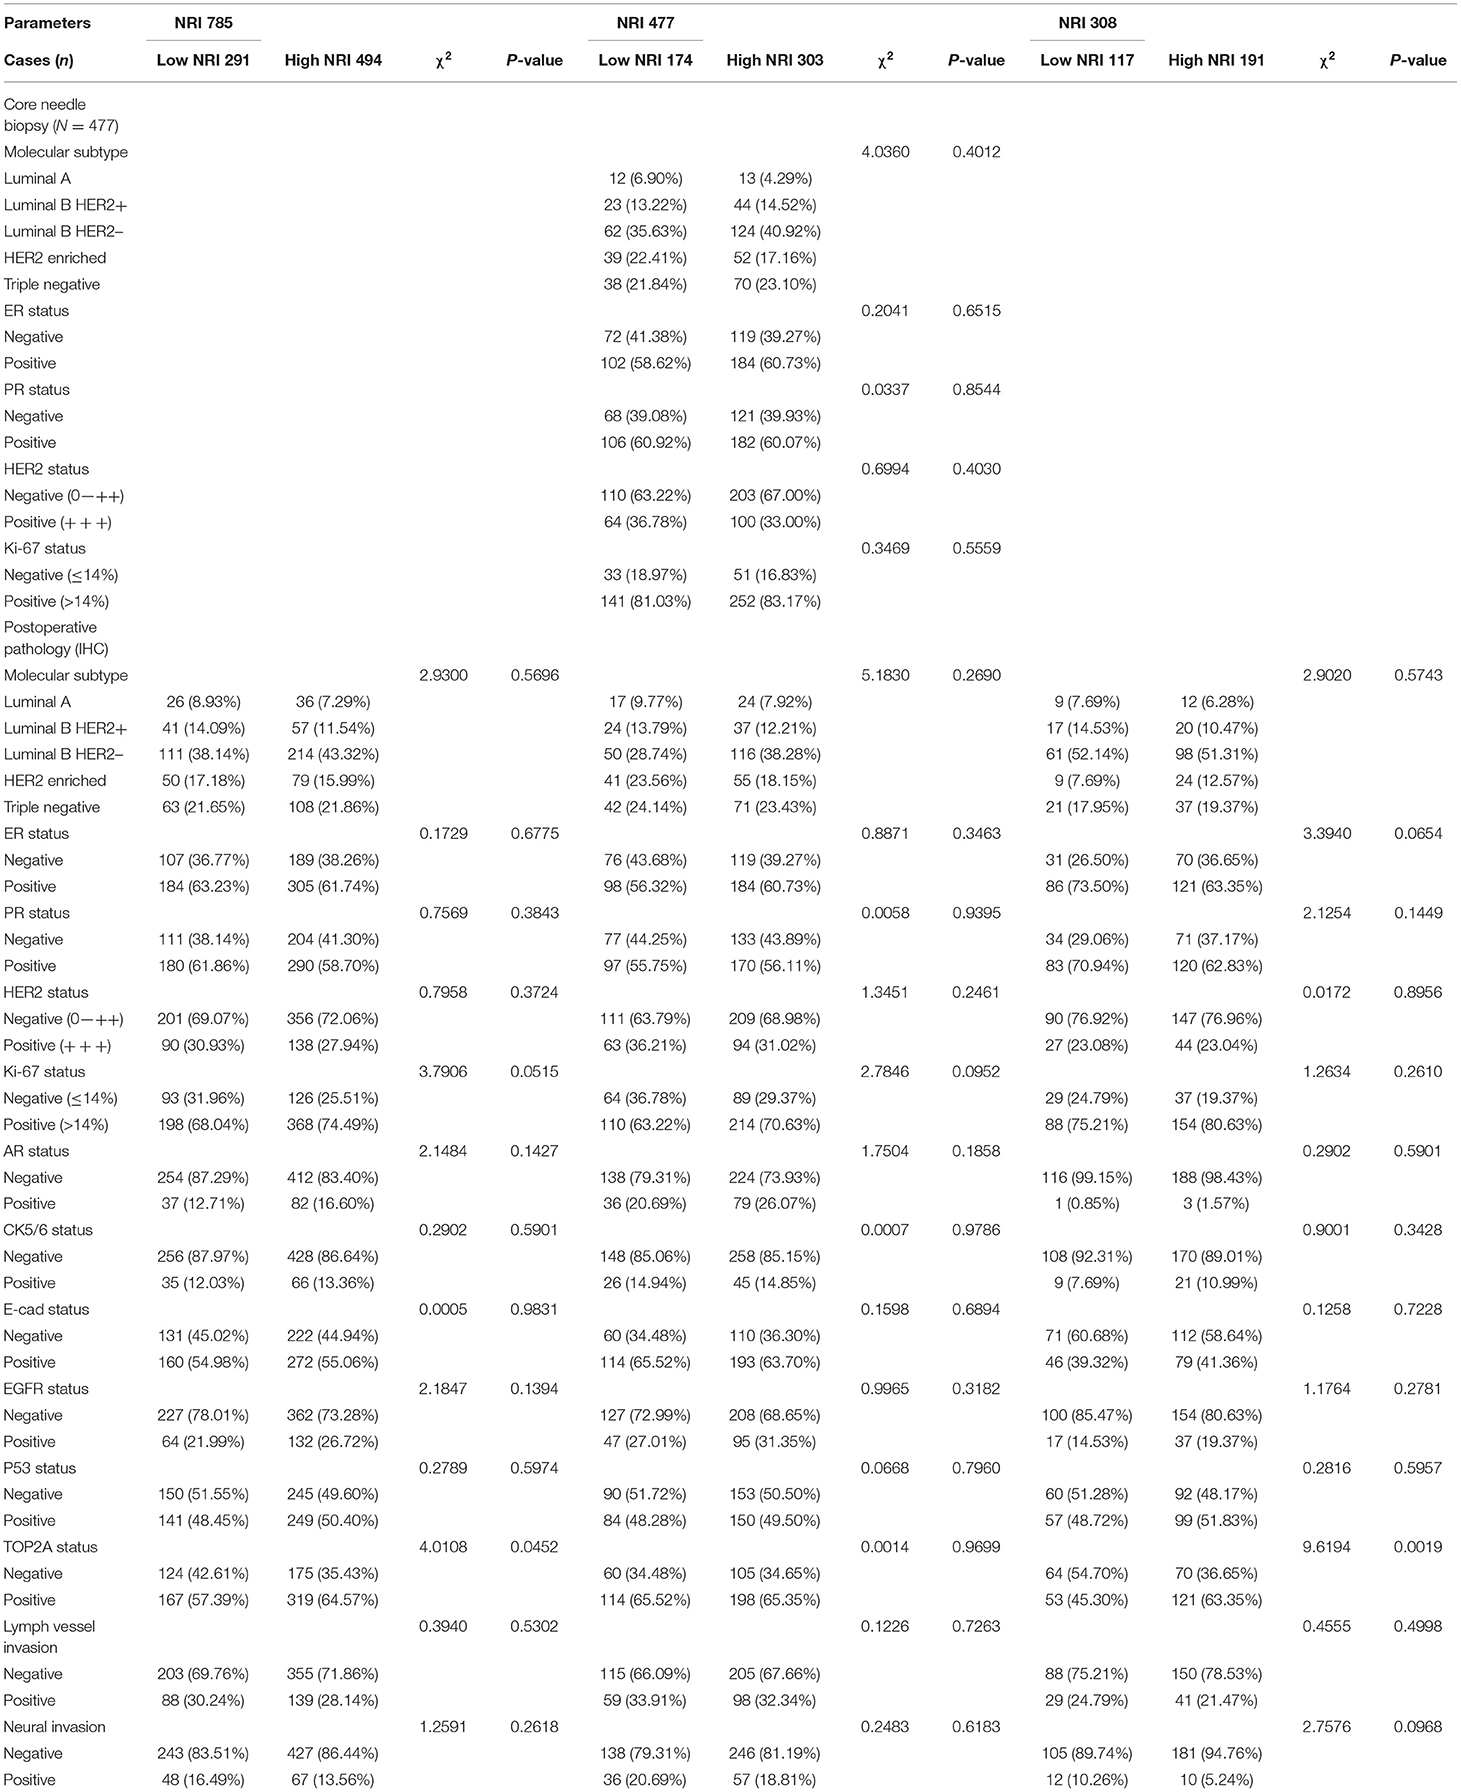
Table 4. The association between molecular subtype and NRI in patients with breast cancer.
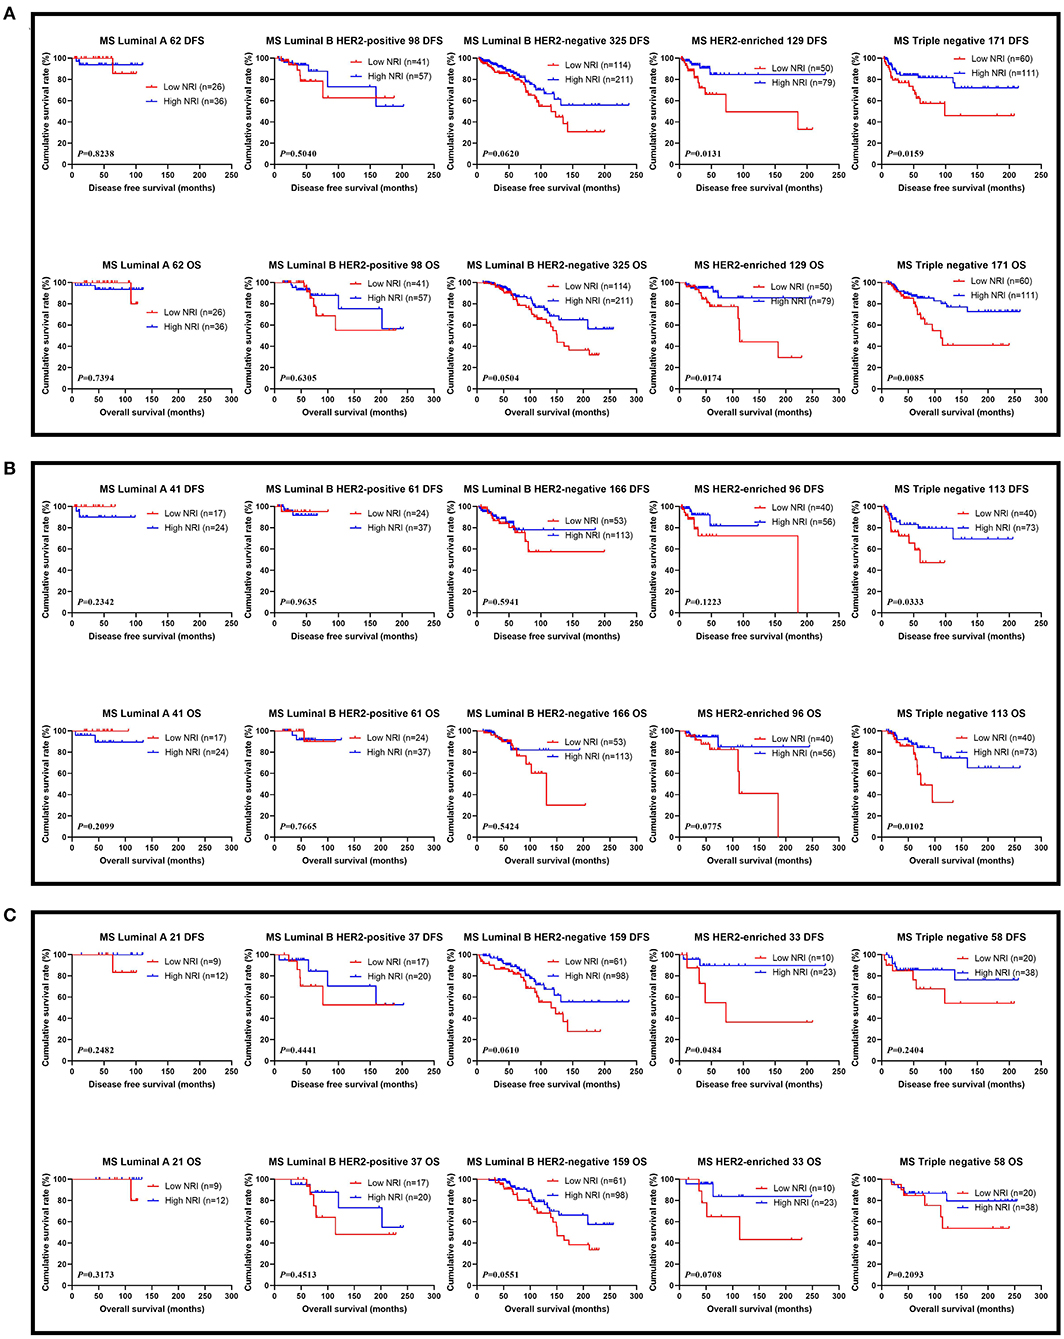
Figure 3. DFS and OS for the NRI of breast cancer patients in different molecular subtypes. (A) DFS and OS for the NRI of breast cancer patients in different molecular subtypes in all patients; (B) DFS and OS for the NRI of breast cancer patients in different molecular subtypes in NACT group; (C) DFS and OS for the NRI of breast cancer patients in different molecular subtypes in non-NACT group.
The Association Between LVI and NRI in Breast Cancer Patients
Through univariate and multivariate analyses, LVI was the significant predictor (Table 3). The ability of NRI to determine breast cancer prognosis was further assessed by examining the relationship between LVI and NRI. Among the patients without LVI, patients who had high NRI scores had remarkably longer DFS and OS survive time than those had low NRI scores (χ2 = 13.6600, P = 0.0002 and χ2 = 12.1500, P = 0.0005). Among the patients with LVI, patients who had high NRI scores had longer DFS and OS survive time than those had low NRI scores (χ2 = 0.8332, P = 0.3613 and χ2 = 1.4780, P = 0.2241). In the NACT group, patients who had high NRI scores had notably longer DFS and OS survive time than those had low NRI scores without LVI (χ2 = 6.4450, P = 0.0111 and χ2 = 6.9200, P = 0.0085). Furthermore, patients who had high NRI scores had longer DFS and OS survive time than those had low NRI scores with LVI (χ2 = 0.07560, P = 0.7833 and χ2 = 0.1831, P = 0.6687). In the non-NACT group, patients who had high NRI values had remarkably longer DFS and OS survive time than those had low NRI values without LVI (χ2 = 6.4910, P = 0.0108 and χ2 = 5.8110, P = 0.0159). At the same time, patients who had high NRI values had longer DFS and OS survive time than those had low NRI values with LVI (χ2 = 1.3370, P = 0.2476 and χ2 = 2.5280, P = 0.1118; Figure 4).
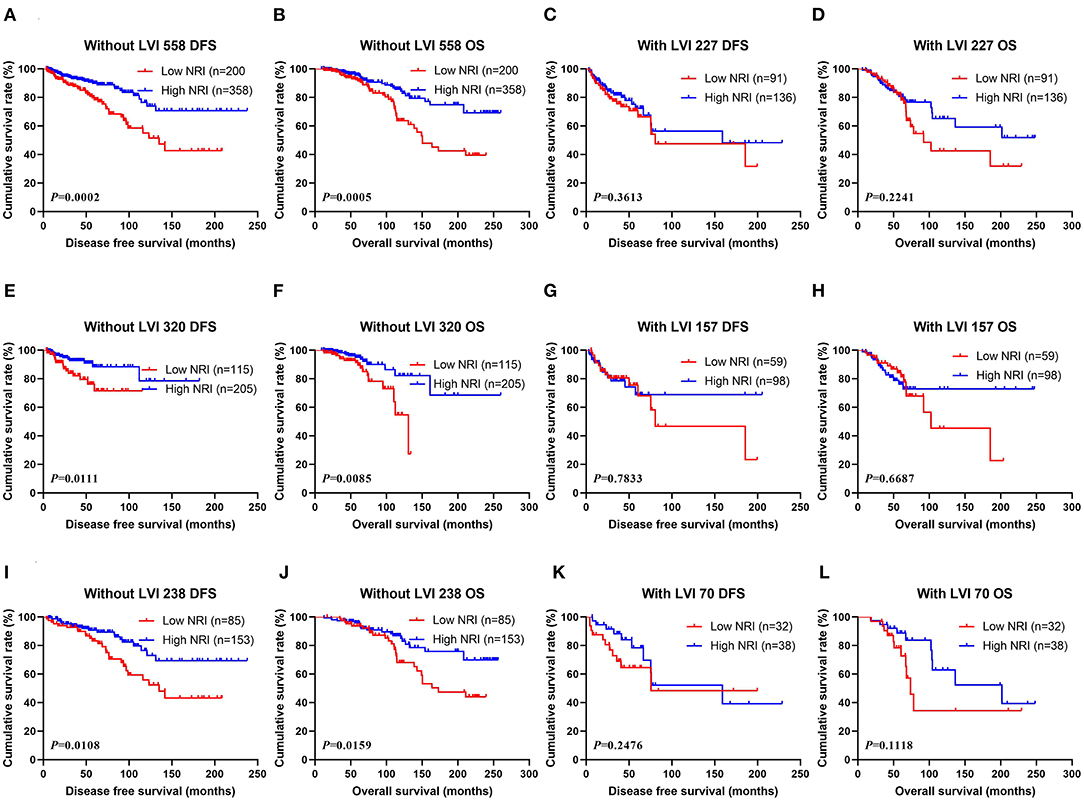
Figure 4. (A) Kaplan-Meier analysis of DFS of patients without LVI by NRI in all breast cancer patients, (B) Kaplan-Meier analysis of OS of patients without LVI by NRI in all breast cancer patients, (C) Kaplan-Meier analysis of DFS of patients with LVI by NRI in all breast cancer patients, (D) Kaplan-Meier analysis of OS of patients LVI by NRI in all breast cancer patients; (E) Kaplan-Meier analysis of DFS of patients without LVI by NRI in NACT group, (F) Kaplan-Meier analysis of OS of patients without LVI by NRI in NACT group, (G) Kaplan-Meier analysis of DFS of patients with LVI by NRI in NACT group, (H) Kaplan-Meier analysis of OS of patients with LVI by NRI in NACT group; (I) Kaplan-Meier analysis of DFS of patients without LVI by NRI in non-NACT group, (J) Kaplan-Meier analysis of OS of patients without LVI by NRI in non-NACT group, (K) Kaplan-Meier analysis of DFS of patients with LVI by NRI in non-NACT group, (L) Kaplan-Meier analysis of OS of patients with LVI by NRI in non-NACT group.
The Association Between NRI and Response in Breast Cancer Patients Received NACT
In the NACT group, all enrolled received neoadjuvant chemotherapy, and the effect of chemotherapy was evaluated after two chemotherapy cycles. After surgery, the degree of pathological remission was evaluated by MPG. So, we analyzed the MPG by NRI, and the results indicated that there was no difference in MPG grade 1 (χ2 = 0.5520, P = 0.4575 and χ2 = 0.0136, P = 0.9071), MPG grade 3 (χ2 = 0.4711, P = 0.4925 and χ2 = 0.1296, P = 0.7189), MPG grade 4 (χ2 = 0.6459, P = 0.4216 and χ2 = 1.9650, P = 0.1610), MPG grade 5 (χ2 = 1.6620, P = 0.1973 and χ2 = 1.7820, P = 0.1819), except in MPG grade 2 (χ2 = 10.9100, P = 0.0010 and χ2 = 9.5030, P = 0.0021; Figure 5). Furthermore, we analyzed the relationship between response and NRI, and the results indicated that there was no difference in CR (χ2 = 0.0000, P>0.9999 and χ2 = 0.0000, P>0.9999), PR (χ2 = 0.7815, P = 0.3767 and χ2 = 0.6523, P = 0.4193), SD (χ2 = 2.5450, P = 0.1107 and χ2 = 3.1730, P = 0.0749), except in PD (χ2 = 3.8460, P = 0.0499 and χ2 = 2.7400, P = 0.0979; Figure 6).
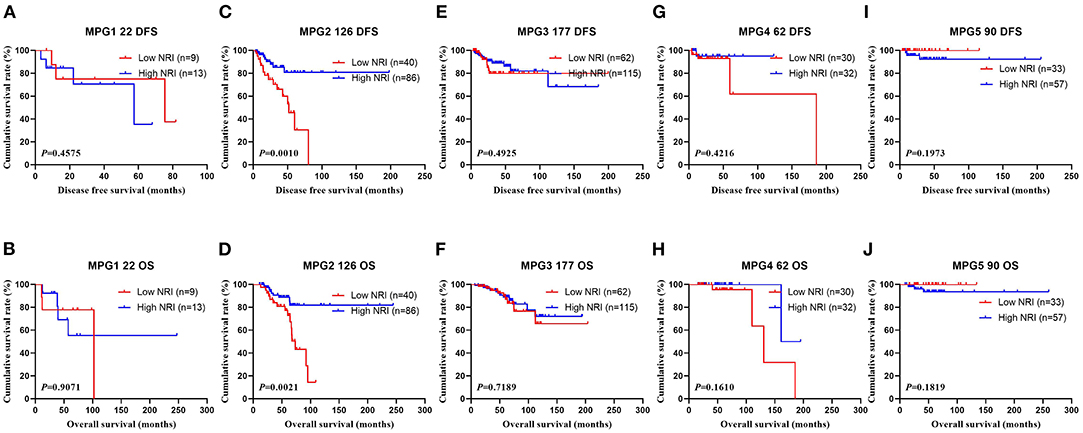
Figure 5. DFS and OS for the NRI of breast cancer patients in Miller and Payne grade (MPG) in NACT group. (A) Kaplan-Meier analysis of DFS of patients with MPG 1, (B) Kaplan-Meier analysis of OS of patients with MPG 1, (C) Kaplan-Meier analysis of DFS of patients with MPG 2, (D) Kaplan-Meier analysis of OS of patients with MPG 2, (E) Kaplan-Meier analysis of DFS of patients with MPG 3, (F) Kaplan-Meier analysis of OS of patients with MPG 3, (G) Kaplan-Meier analysis of DFS of patients with MPG 4, (H) Kaplan-Meier analysis of OS of patients with MPG 4, (I) Kaplan-Meier analysis of DFS of patients with MPG 5, (J) Kaplan-Meier analysis of OS of patients with MPG 5.
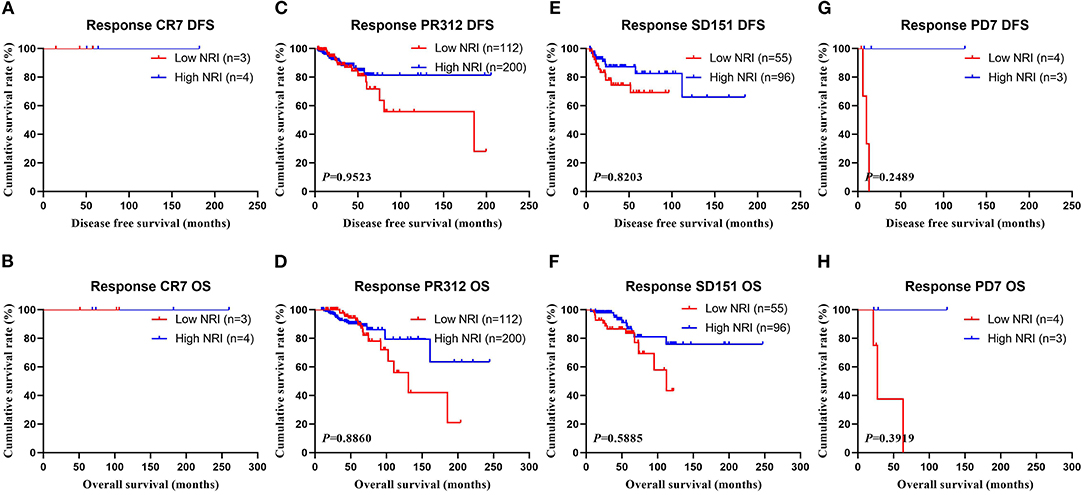
Figure 6. DFS and OS for the NRI of breast cancer patients in response in NACT group. (A) Kaplan-Meier analysis of DFS of patients with response CR, (B) Kaplan-Meier analysis of OS of patients with response CR, (C) Kaplan-Meier analysis of DFS of patients with response PR, (D) Kaplan-Meier analysis of OS of patients with response PR, (E) Kaplan-Meier analysis of DFS of patients with response SD, (F) Kaplan-Meier analysis of OS of patients with response SD, (G) Kaplan-Meier analysis of DFS of patients with response PD, (H) Kaplan-Meier analysis of OS of patients with response PD.
The Relationship Between NRI and Toxicity and Adverse Effects
In the NACT group, the common toxicities after NACT were hematologic and gastrointestinal reactions. The results shown that the nausea (χ2 = 9.2413, P = 0.0024), mouth ulcers (χ2 = 4.8133, P = 0.0282), anemia (χ2 = 8.5441, P = 0.0140), and leukopenia (χ2 = 11.0951, P = 0.0039) were statistically different between the two groups (see Table 5).
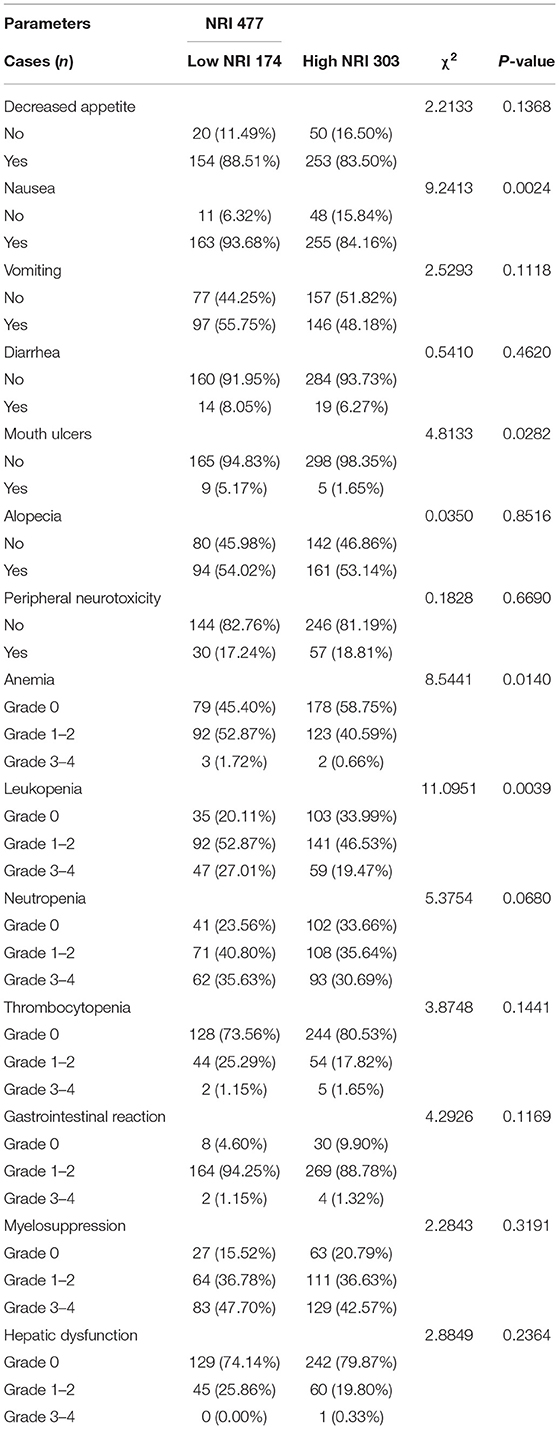
Table 5. The correlation between NRI and toxicity assessment.
Discussion
Breast cancer is a major public health threat globally (29). In women around the world, breast cancer is a very common female malignant tumor and the leading cause of cancer-related deaths (2). Although promising treatment options are emerging, recurrence and metastasis are still the driving causes for breast cancer fatality (30). Evidence shows that approximately 30%-40% of patients who suffer from invasive breast cancer will eventually progress to metastatic breast cancer, whose 5-year survival rate could be poorer than 30% (31, 32). Additionally, research also suggests that probabilities of recurrence and progression could occur in some breast cancer patients even after radical resection and neoadjuvant/adjuvant therapy (33). Therefore, to address these issues, there is an urgent need to develop assessment strategies based on non-invasive, reproducible, and convenient biomarkers to estimate the curative effects and the prognosis of breast cancer, as well as to better pair treatment options with patient characteristics (e.g., ascertain those breast cancer patients who get a profit from neoadjuvant chemotherapy).
Prior studies have identified a limited number of screening tools to evaluate nutritional risks that have the potential to predict prognosis in cancer patients, ranging from Subjective Global Assessment (SGA), Nutritional Risk Screening 2002 (NRS 2002), Mini Nutritional Assessment-Screening Form (MNA-SF), and Malnutrition Universal Screening Tool (MUST), as well as several nutritional status markers such as the neutrophil-to-lymphocyte ratio, prognostic nutritional index, BMI, serum albumin, total lymphocyte count, and indicators such as patients' cholesterol levels (34–38). Among them, BMI and serum albumin level are usually used as makers of patients' nutritional status in routine clinical practice (39), largely due to their abilities to predict cancer patients' survival rates, as indicated in recent studies (40–42). While these tools play an important role in nutritional assessment, the fact that they rely on subjective assessments that could be easily varied and swayed by individual examiners makes these screening mechanisms incomparable and unsatisfactory. Additionally, some non-nutritional factors such as inflammation, fluid status, renal dysfunction, and hepatic congestion also exert diverse effects on indicators like serum albumin and BMI (43, 44), effectively exposing these tools to additional noises. Thus, it is neither sufficient nor precise to evaluate patients' nutritional risk with regard to their cancer prognosis and treatment efficacy only by their BMI or albumin status.
Fortunately, NRI values measured by a combination of factors such as ideal body weight, serum albumin, and present body weight may overcome the shortcomings of individual indicators. In other words, creating patients' NRI score as a combined index of their ideal body weight, present body weight, and serum albumin levels has the potential to minimize the effects of fluid status, and in turn, distinguish nutritional risk better than individual indexes. As demonstrated in previous studies, one of the indexes under the NRI umbrella that could appraise forecasting risk of malnutrition-related incidence rate and mortality in advanced-age patients was the Geriatric Nutritional Risk Index (GNRI) (45). GNRI has been associated with poor treatment outcomes in many diseases, including cancer (46–50). Moreover, previous research also illustrated that in patients with new metastatic gastric adenocarcinoma and esophageal adenocarcinoma, pretreatment NRI and change of NRI in that were significant prognostic factors for OS.
Emerging evidence further suggests that evaluate NRI at baseline and during treatment can not only indicate patients' nutrition status but also provide useful prognostic information (51). Nevertheless, while meaningful insights are procurable, little is known about the association between NRI, prognosis, and treatment efficacy in breast cancer patients. To bridge the research gap, by analyzing the clinical and demographic attributes of 785 participants, our study demonstrated the clinical significance of using NRI to assess nutritional risk assessment in breast cancer patients. Our results indicated that high levels of NRI were significantly associated with more indicative clinicopathologic characteristics (age, menopause, US-LNM, total lymph nodes, and total axillary lymph nodes), nutritional parameters, and blood parameters (weight, BMI, ALT, AST, LDH, GGT, ALP, GLU, IgG, W, ALB, Hb, R, N, E, and P) of all breast cancer patients.
Through the univariate and multivariate Cox regression survival analyses, the preoperative NRI was an independent predictor of DFS and OS survive time. And the average DFS and OS survive time for patients who had high NRI scores were longer than for those who had low NRI scores by the log-rank analysis in the NACT group and the non-NACT group. Similar conclusions have been reached in many published studies focusing on other malignancies (52, 53). For instance, 143 patients with localized esophageal cancer treated with definitive concurrent chemoradiotherapy in a retrospective study conducted by Clavier and associates, multivariable analyses indicated that the NRI was an independent predictor for patients' overall survival (52). Moreover, Cox and colleagues retrospectively analyzed patients with esophageal cancer included chemoradiotherapy with or without cetuximab in the SCOPE1 clinical trial, reporting that NRI <100 in a baseline was significantly related to decreased overall survival in cancer patients (53).
Previous studies suggest that patients' NRI values were prognostic in a range of localized as well as metastatic tumors like esophageal cancer (54, 55). However, there is a dearth of research on the effects of NRI on prognosis and treatment efficacy in breast cancer patients. To bridge the research gap, we analyzed the relationship between pathologic stage and NRI in patients with breast cancer, and observed that patients who had high NRI scores had longer DFS and OS survive time than those who had low NRI values in both patients with early-stage breast cancer and advanced stage breast cancer. Furthermore, patients who had high NRI levels had longer DFS and OS survive time in contrast to those who had low NRI scores in molecular subtypes of breast cancer. Moreover, the results also performed the mean DFS and OS survive time in breast cancer patients who had high NRI scores were longer than in those patients who had low NRI scores with LVI status. Furthermore, we also analyzed the relationship between NRI and MPG/Response, and the results also shown that patients who had high NRI scores had longer DFS and OS survive time than those who had low NRI scores in different MPG grades, especially in MPG grade 2; and patients who had high NRI values had longer DFS and OS survive time in contrast to those who had low NRI scores in different responses.
All breast cancer patients could tolerate the neoadjuvant chemotherapy toxicities and adverse effects. The hematologic and gastrointestinal reactions were the common toxicities and adverse effects, and the results shown that there was no difference using the optimal NRI cutoff value of 112 in toxicity assessment, except in nausea, mouth ulcers, anemia, leukopenia, which should get doctors' as well as patients' attention. Using NRI as a prognostic marker and monitoring response to treatment make it possible to start timely interventions to reduce the risk of these complications.
As far as we know, this study is the first to illustrate the clinical and prognostic significance of NRI in a large cohort of breast cancer patients. Additionally, we also demonstrate that the change of NRI during treatment is a predictor for DFS and OS in different molecular subtypes and different lymph vessel invasion levels, as well as the relationship between NRI status and neoadjuvant chemotherapy toxicities.
However, the presented study is not without limitations. Firstly, our study evaluated the research topic from a retrospective perspective and was underway in a single-center with a relatively restricted number of breast cancer patients. To further enrich the literature, multicenter-based research that draws insights from large study populations should be encouraged. Secondly, as common in studies that adopt similar research methods (e.g., utilize eligibility criteria to screen patients), selection bias in our study could be difficult to eliminate. Thirdly, as NRI is a non-specific tumor marker, additional validation of the association between NRI, cancer prognosis, and treatment efficacy in large prospective studies should be conducted in the future.
Conclusion
NRI is described as the significant predictor for breast cancer patients, and may forecast the survival and prognosis for breast cancer. The minimally invasive, easily accessible and convenient indicators should be help doctors in terms of selecting measures, evaluating the curative effect, and estimating the prognosis of breast cancer.
Data Availability Statement
The raw data supporting the conclusions of this article will be made available by the authors, without undue reservation.
Ethics Statement
This study was approved by the Ethics Committee of Cancer Hospital Chinese Academy of Medical Sciences and Tongji Hospital. The patients/participants provided their written informed consent to participate in this study.
Author Contributions
LC and YQ: writing—original draft and writing—review & editing. XK and ZS: formal analysis. ZW, XW, and YD: data curation and investigation. YF and XL: methodology and supervision. XL and JW: resources, funding acquisition, and project administration. All authors contributed to the article and approved the submitted version.
Funding
The work is partly supported by research grants from National Nature Science Foundation of China (Nos. 81872160, 82072940, 82103047, 82102887, and 81802676), Beijing Nature Science Foundation of China (Nos. 7191009 and 7204293), National Key Research and Development Program of China (No. 2018YFC1312100), China National Key Research and Development Program (Nos. 2020AAA0105000 and 2020AAA0105004), Special Research Fund for Central Universities, Peking Union Medical College (No. 3332019053), Beijing Hope Run Special Fund of Cancer Foundation of China (Nos. LC2020L01, LC2019B03, and LC2019L07), Wuhan Youth Cadre Project (Nos. 2017zqnlxr01 and 2017zqnlxr02), Clinical Research Physician Program of Tongji Medical College HUST (No. 5001540018), Golden Bridge Project Seed Fund of Beijing Association for Science and Technology (No. ZZ20004), Chinese Young Breast Experts Research project (No. CYBER-2021-005), 2021 Chaoyang District Social Development Science and Technology Plan Project (No. CYSF2115), Beijing Xisike Clinical Oncology Research Foundation (No. Y-Young2021-0017), and XianSheng Clinical Research Special Fund of China International Medical Foundation (No. Z-2014-06-2103).
Conflict of Interest
The authors declare that the research was conducted in the absence of any commercial or financial relationships that could be construed as a potential conflict of interest.
Publisher's Note
All claims expressed in this article are solely those of the authors and do not necessarily represent those of their affiliated organizations, or those of the publisher, the editors and the reviewers. Any product that may be evaluated in this article, or claim that may be made by its manufacturer, is not guaranteed or endorsed by the publisher.
References
1. Bray F, Ferlay J, Soerjomataram I, Siegel RL, Torre LA, Jemal A. Global cancer statistics 2018: GLOBOCAN estimates of incidence and mortality worldwide for 36 cancers in 185 countries. CA Cancer J Clin. (2018) 68:394–424. doi: 10.3322/caac.21492
2. Siegel RL, Miller KD, Jemal A. Cancer statistics, 2020. CA Cancer J Clin. (2020) 70:7–30. doi: 10.3322/caac.21590
3. Shien T, Iwata H. Adjuvant and neoadjuvant therapy for breast cancer. Jpn J Clin Oncol. (2020) 50:225–9. doi: 10.1093/jjco/hyz213
4. Zietarska M, Krawczyk-Lipiec J, Kraj L, Zaucha R, Małgorzewicz S. Chemotherapy-related toxicity, nutritional status and quality of life in precachectic oncologic patients with, or without, high protein nutritional support. A prospective, randomized study. Nutrients. (2017) 9:1108. doi: 10.3390/nu9101108
6. Freire PP, Fernandez GJ, Cury SS, de Moraes D, Oliveira JS, de Oliveira G, et al. The pathway to cancer cachexia: MicroRNA-Regulated networks in muscle wasting based on integrative meta-analysis. Int J Mol Sci. (2019) 20:1962. doi: 10.3390/ijms20081962
7. Ryo S, Kanda M, Ito S, Mochizuki Y, Teramoto H, Ishigure K, et al. The controlling nutritional status score serves as a predictor of short- and long-term outcomes for patients with stage 2 or 3 gastric cancer: analysis of a multi-institutional data set. Ann Surg Oncol. (2019) 26:456–464. doi: 10.1245/s10434-018-07121-w
8. Sun L, Su S, Xiong J, Hu W, Liu L, Xu H, et al. Controlling nutritional status score as a prognostic marker to predict overall survival in resected biliary tract cancers. Ann Transl Med. (2021) 9:644. doi: 10.21037/atm-20-6770
9. Yang Y, Ye F, Xin Y, Wang Y, Li X, Feng D, et al. Prognostic significance of controlling nutritional status score-based nomogram for hepatocellular carcinoma within Milan criteria after radiofrequency ablation. J Gastrointest Oncol. (2020) 11:1024–1039. doi: 10.21037/jgo-20-225
10. Müller L, Hahn F, Mähringer-Kunz A, Stoehr F, Gairing SJ, Foerster F, et al. Immunonutritive scoring in patients with hepatocellular carcinoma undergoing transarterial chemoembolization: prognostic nutritional index or controlling nutritional status score? Front Oncol. (2021) 11:696183. doi: 10.3389/fonc.2021.696183
11. Zaorsky NG, Churilla TM, Egleston BL, Fisher SG, Ridge JA, Horwitz EM, et al. Causes of death among cancer patients. Ann Oncol. (2017) 28:400–7. doi: 10.1093/annonc/mdw604
12. Fang Q, Huang J, Gan L, Shen K, Chen X, Wu B. Weight gain during neoadjuvant chemotherapy is associated with worse outcome among the patients with operable breast cancer. J Breast Cancer. (2019) 22:399–411. doi: 10.4048/jbc.2019.22.e37
13. Castillo-Martínez L, Castro-Eguiluz D, Copca-Mendoza ET, Pérez-Camargo DA, Reyes-Torres CA, Ávila EA, et al. Nutritional assessment tools for the identification of malnutrition and nutritional risk associated with cancer treatment. Rev Invest Clin. (2018) 70:121–5. doi: 10.24875/RIC.18002524
14. De Groot LM, Lee G, Ackerie A, van der Meij BS. Malnutrition screening and assessment in the cancer care ambulatory setting: mortality predictability and validity of the patient-generated subjective global assessment short form (PG-SGA SF) and the GLIM criteria. Nutrients. (2020) 12:2287. doi: 10.3390/nu12082287
15. Yanni A, Dequanter D, Lechien JR, Loeb I, Rodriguez A, Javadian R, et al. Malnutrition in head and neck cancer patients: Impacts and indications of a prophylactic percutaneous endoscopic gastrostomy. Eur Ann Otorhinolaryngol Head Neck Dis. (2019) 136:S27–S33. doi: 10.1016/j.anorl.2019.01.001
16. De Cicco P, Catani MV, Gasperi V, Sibilano M, Quaglietta M, Savini I. Nutrition and breast cancer: a literature review on prevention, treatment and recurrence. Nutrients. (2019) 11:1514. doi: 10.3390/nu11071514
17. Neuhouser ML, Aragaki AK, Prentice RL, Manson JE, Chlebowski R, Carty CL, et al. Overweight, obesity, and postmenopausal invasive breast cancer risk: a secondary analysis of the women's health initiative randomized clinical trials. JAMA Oncol. (2015) 1:611–21. doi: 10.1001/jamaoncol.2015.1546
18. Fang X, Wei J, He X, Lian J, Han D, An P, et al. Quantitative association between body mass index and the risk of cancer: A global meta-analysis of prospective cohort studies. Int J Cancer. (2018) 143:1595–603. doi: 10.1002/ijc.31553
19. Tamaki K, Tamaki N, Terukina S, Kamada Y, Uehara K, Arakaki M, et al. The correlation between body mass index and breast cancer risk or estrogen receptor status in okinawan women. Tohoku J Exp Med. (2014) 234:169–74. doi: 10.1620/tjem.234.169
20. Fruchtenicht AV, Poziomyck AK, Kabke GB, Loss SH, Antoniazzi JL, Steemburgo T, et al. Nutritional risk assessment in critically ill cancer patients: systematic review. Rev Bras Ter Intensiva. (2015) 27:274–83. doi: 10.5935/0103-507X.20150032
21. Viana ACC, Aguiar APN, Rodrigues BC, Mendonça PDS, Maia FMM. Evaluation of nutritional risk factors in hematopoietic stem cell transplantation-eligible patients. Einstein. (2020) 18:eAO5075. doi: 10.31744/einstein_journal/2020AO5075
22. Tang S, Xie H, Kuang J, Gao F, Gan J, Ou H. The value of geriatric nutritional risk index in evaluating postoperative complication risk and long-term prognosis in elderly colorectal cancer patients. Cancer Manag Res. (2020) 12:165–75. doi: 10.2147/CMAR.S234688
23. Abdel-Rahman O. Validation of the 8th AJCC prognostic staging system for breast cancer in a population-based setting. Breast Cancer Res Treat. (2018) 168:269–75. doi: 10.1007/s10549-017-4577-x
24. Fouad TM, Barrera AMG, Reuben JM, Lucci A, Woodward WA, Stauder MC, et al. Inflammatory breast cancer: a proposed conceptual shift in the UICC-AJCC TNM staging system. Lancet Oncol. (2017) 18:e228–32. doi: 10.1016/S1470-2045(17)30192-4
25. Eisenhauer EA, Therasse P, Bogaerts J, Schwartz LH, Sargent D, Ford R, et al. New response evaluation criteria in solid tumours: revised RECIST guideline (version 1.1). Eur J Cancer. (2009) 45:228–47. doi: 10.1016/j.ejca.2008.10.026
26. Chen L, Kong X, Wang Z, Wang X, Fang Y, Wang J. Pre-treatment systemic immune-inflammation index is a useful prognostic indicator in patients with breast cancer undergoing neoadjuvant chemotherapy. J Cell Mol Med. (2020) 24:2993–3021. doi: 10.1111/jcmm.14934
27. Cavaletti G, Cornblath DR, Merkies ISJ, Postma TJ, Rossi E, Frigeni B, et al. The chemotherapy-induced peripheral neuropathy outcome measures standardization study: from consensus to the first validity and reliability findings. Ann Oncol. (2013) 24:454–62. doi: 10.1093/annonc/mds329
28. Howlader N, Cronin KA, Kurian AW, Andridge R. Differences in breast cancer survival by molecular subtypes in the United States. Cancer Epidemiol Biomarkers Prev. (2018) 27:619–26. doi: 10.1158/1055-9965.EPI-17-0627
29. Barrios CH, Reinert T, Werutsky G. Global breast cancer research: moving forward. Am Soc Clin Oncol Educ Journal. (2018) 38:441–50. doi: 10.1200/EDBK_209183
30. Waks AG, Winer EP. Breast cancer treatment: a review. JAMA. (2019) 321:288–300. doi: 10.1001/jama.2018.19323
31. Early Breast Cancer Trialists' Collaborative Group (EBCTCG), Peto R, Davies C, Godwin J, Gray R, Pan HC, et al. Comparisons between different polychemotherapy regimens for early breast cancer: meta-analyses of long-term outcome among 100,000 women in 123 randomised trials. Lancet. (2012) 379:432–44. doi: 10.1016/S0140-6736(11)61625-5
32. Noguchi M, Inokuchi M, Noguchi M, Morioka E, Ohno Y, Kurita T. Axillary surgery for breast cancer: past, present, and future. Breast Cancer. (2021) 28:9–15. doi: 10.1007/s12282-020-01120-0
33. Tabor S, Szostakowska-Rodzos M, Fabisiewicz A, Grzybowska EA. How to predict metastasis in luminal breast cancer? Current solutions and future prospects. Int J Mol Sci. (2020) 21:8415. doi: 10.3390/ijms21218415
34. Chew STH, Tan NC, Cheong M, Oliver J, Baggs G, Choe Y, et al. Impact of specialized oral nutritional supplement on clinical, nutritional, and functional outcomes: a randomized, placebo-controlled trial in community-dwelling older adults at risk of malnutrition. Clin Nutr. (2021) 40:1879–92. doi: 10.1016/j.clnu.2020.10.015
35. Dolan RD, Maclay JD, Abbass T, Colville D, Buali F, MacLeod N, et al. The relationship between 18F-FDG-PETCT-derived tumour metabolic activity, nutritional risk, body composition, systemic inflammation and survival in patients with lung cancer. Sci Rep. (2020) 10:20819. doi: 10.1038/s41598-020-77269-7
36. Zhang M, Ye S, Huang X, Sun L, Liu Z, Liao C, et al. Comparing the prognostic significance of nutritional screening tools and ESPEN-DCM on 3-month and 12-month outcomes in stroke patients. Clin Nutr. (2021) 40:3346–53. doi: 10.1016/j.clnu.2020.11.001
37. Neal CP, Cairns V, Jones MJ, Masood MM, Nana GR, Mann CD, et al. Prognostic performance of inflammation-based prognostic indices in patients with resectable colorectal liver metastases. Med Oncol. (2015) 32:144. doi: 10.1007/s12032-015-0590-2
38. Lv Y, Ji ML, Feng QY, Zhu DX, Lin SB, Mao YH, et al. Combined test of third lumbar skeletal muscle index and prognostic nutrition index improve prognosis prediction power in resected colorectal cancer liver metastasis. Aging. (2019) 11:10301–15. doi: 10.18632/aging.102457
39. Almutawa DA, Almuammar M, Elshafie MM, Aljuraiban GS, Alnafisah A, Abulmeaty MMA. Survival and nutritional status of male and female heart transplant patients based on the nutritional risk index. Nutrients. (2020) 12:3868. doi: 10.3390/nu12123868
40. Guo ZQ, Yu JM, Li W, Fu ZM, Lin Y, Shi YY, et al. Survey and analysis of the nutritional status in hospitalized patients with malignant gastric tumors and its influence on the quality of life. Support Care Cancer. (2020) 28:373–80. doi: 10.1007/s00520-019-04803-3
41. Gul B, Metintas S, Ak G, Yilmaz S, Metintas M. The relationship between nutritional status and prognosis in patients with locally advanced and advanced stage lung cancer. Support Care Cancer. (2021) 29:3357–65. doi: 10.1007/s00520-020-05856-5
42. Lima MTM, Maruyama TC, Custódio IDD, Marinho EDC, Ferreira IB, Crispim CA, et al. The impact of a higher eating frequency on the diet quality and nutritional status of women with breast cancer undergoing chemotherapy. Br J Nutr. (2020) 123:410–8. doi: 10.1017/S0007114519002952
43. Morais JG, Pecoits-Filho R, Canziani MEF, Poli-de-Figueiredo CE, Cuvello Neto AL, Barra AB, et al. Fluid overload is associated with use of a higher number of antihypertensive drugs in hemodialysis patients. Hemodial Int. (2020) 24:397–405. doi: 10.1111/hdi.12829
44. Bassoli C, Oreni L, Ballone E, Foschi A, Perotti A, Mainini A, et al. Role of serum albumin and proteinuria in patients with SARS-CoV-2 pneumonia. Int J Clin Pract. (2021) 75:e13946. doi: 10.1111/ijcp.13946
45. Jia Z, El Moheb M, Nordestgaard A, Lee JM, Meier K, Kongkaewpaisan N, et al. The geriatric nutritional risk index is a powerful predictor of adverse outcome in the elderly emergency surgery patient. J Trauma Acute Care Surg. (2020) 89:397–404. doi: 10.1097/TA.0000000000002741
46. Lee GW, Go SI, Kim DW, Kim HG, Kim JH, An HJ, et al. Geriatric nutritional risk index as a prognostic marker in patients with extensive-stage disease small cell lung cancer: results from a randomized controlled trial. Thorac Cancer. (2020) 11:62–71. doi: 10.1111/1759-7714.13229
47. Kang HW, Seo SP, Kim WT, Yun SJ, Lee SC, Kim WJ, et al. A low geriatric nutritional risk index is associated with aggressive pathologic characteristics and poor survival after nephrectomy in clear renal cell carcinoma: a multicenter retrospective study. Nutr Cancer. (2020) 72:88–97. doi: 10.1080/01635581.2019.1621357
48. Hirahara N, Matsubara T, Fujii Y, Kaji S, Hyakudomi R, Yamamoto T, et al. Preoperative geriatric nutritional risk index is a useful prognostic indicator in elderly patients with gastric cancer. Oncotarget. (2020) 11:2345–56. doi: 10.18632/oncotarget.27635
49. Shoji F, Miura N, Matsubara T, Akamine T, Kozuma Y, Haratake N, et al. Prognostic significance of immune-nutritional parameters for surgically resected elderly lung cancer patients: a multicentre retrospective study. Interact Cardiovasc Thorac Surg. (2018) 26:389–94. doi: 10.1093/icvts/ivx337
50. Kushiyama S, Sakurai K, Kubo N, Tamamori Y, Nishii T, Tachimori A, et al. The preoperative geriatric nutritional risk index predicts postoperative complications in elderly patients with gastric cancer undergoing gastrectomy. In Vivo. (2018) 32:1667–72. doi: 10.21873/invivo.11430
51. Ma LX, Taylor K, Espin-Garcia O, Anconina R, Suzuki C, Allen MJ, et al. Prognostic significance of nutritional markers in metastatic gastric and esophageal adenocarcinoma. Cancer Med. (2021) 10:199–207. doi: 10.1002/cam4.3604
52. Clavier JB, Antoni D, Atlani D, Ben Abdelghani M, Schumacher C, Dufour P, et al. Baseline nutritional status is prognostic factor after definitive radiochemotherapy for esophageal cancer. Dis Esophagus. (2014) 27:560–7. doi: 10.1111/j.1442-2050.2012.01441.x
53. Cox S, Powell C, Carter B, Hurt C, Mukherjee S, Crosby TD. Role of nutritional status and intervention in oesophageal cancer treated with definitive chemoradiotherapy: outcomes from SCOPE1. Br J Cancer. (2016) 115:172–7. doi: 10.1038/bjc.2016.129
54. Bo Y, Wang K, Liu Y, You J, Cui H, Zhu Y, et al. The geriatric nutritional risk index predicts survival in elderly esophageal squamous cell carcinoma patients with radiotherapy. PLoS ONE. (2016) 11:e0155903. doi: 10.1371/journal.pone.0155903
Keywords: nutritional risk index, breast cancer, nutrition, neoadjuvant chemotherapy, prognosis
Citation: Chen L, Qi Y, Kong X, Su Z, Wang Z, Wang X, Du Y, Fang Y, Li X and Wang J (2022) Nutritional Risk Index Predicts Survival in Patients With Breast Cancer Treated With Neoadjuvant Chemotherapy. Front. Nutr. 8:786742. doi: 10.3389/fnut.2021.786742
Received: 30 September 2021; Accepted: 20 December 2021;
Published: 13 January 2022.
Edited by:
Kalliopi-Anna Poulia, Agricultural University of Athens, GreeceReviewed by:
Raquel Arifa, Minas Gerais State University, BrazilLihua Zhu, North China University of Science and Technology, China
Copyright © 2022 Chen, Qi, Kong, Su, Wang, Wang, Du, Fang, Li and Wang. This is an open-access article distributed under the terms of the Creative Commons Attribution License (CC BY). The use, distribution or reproduction in other forums is permitted, provided the original author(s) and the copyright owner(s) are credited and that the original publication in this journal is cited, in accordance with accepted academic practice. No use, distribution or reproduction is permitted which does not comply with these terms.
*Correspondence: Yi Fang, ZmFuZ3lpQGNpY2Ftcy5hYy5jbg==; Xingrui Li, bGl4aW5ncnVpQHRqaC50am11LmVkdS5jbg==; Jing Wang, d2FuZ2ppbmdAY2ljYW1zLmFjLmNu
†These authors have contributed equally to this work