 Tianci Chen1,2†
 Fangyi Zhang1,2†
 Juanqin Chen3†
 Qiangui Zhong1,2
 Yuxin Hu1,2
 Ruru Wu1
 Baogui Xie2
 Yuji Jiang1,2*
 Bingzhi Chen1,2*
- 1College of Food Science, Fujian Agriculture and Forestry University, Fuzhou, China
- 2Mycological Research Center, Fujian Agriculture and Forestry University, Fuzhou, China
- 3Yongtai Agricultural and Rural Bureau, Fuzhou, China
Ganoderma resinaceum is a valuable Chinese medicine. This study aimed to investigate whether a G. resinaceum alcohol extract (GRAE) improves sleep, and analyze the potential mechanism. After 30 days of continuous administration of GRAE at various doses, GRAE (1,000 mg/kg.bw) prolonged pentobarbital sodium-induced sleep, increased the rate of sleeping in mice treated with a subthreshold dose of pentobarbital sodium, and shortened sleep latency. The mice brain was analyzed using UPLC-MS/MS and RNA-sequencing. Metabolomics analysis revealed that 73 metabolites in the high-dose (HD) group had changed significantly, mainly in amino acids and their derivatives, especially the accumulation of L-glutamine and PGJ2 (11-oxo-15S-hydroxy-prosta-5Z, 9, 13E-trien-1-oic acid). Transcriptome analysis revealed 500 differential genes between HD and control groups, mainly enriched in neuroactive ligand-receptor interaction, amphetamine addiction, and cocaine addiction pathways. The conjoint analysis of the transcriptome and metabolome showed that the biosynthesis of L-glutamine might be regulated by Homer1, Homer3, and Grin3b. This suggests that GRAE may affect L-glutamine accumulation by regulating the expression of these genes. This study showed that GRAE may prolong the sleep time of mice by reducing the accumulation of L-glutamine and deepens our understanding of the regulatory network between certain genes and L-glutamine.
Introduction
Sleep is an important process in the maintenance of health (1). Chronic insomnia may cause regulatory imbalances, leading to various complications (2, 3). It is estimated that over one-third of people suffer from insomnia, and the frequency is increasing (4). At present, most sleep-inducing medicines are synthetic and cause major side effects, such as muscle relaxation, memory loss, and drug dependence (5). Benzodiazepines, the primary drugs used to treat sleep disorders, mainly act on the central nervous system, and long-term use has side effects such as tolerance and dependency (6). Therefore, a safe and efficient alternative is needed to improve sleep quality.
Ganoderma lucidum contains polysaccharides, proteins, amino acids, fatty acids, terpenes, steroids, alkaloids, and phenolic compounds. Among these, the water-soluble polysaccharides and alcohol-soluble triterpenoids appear to the main bioactive components (7, 8). Ganoderma lucidum is widely used to lower blood pressure, to protect the liver, and as an anti-aging agent in China. Modern pharmacology indicates that G. lucidum can improve immune regulation and has antiviral, anti-inflammatory, antioxidant, and anti-tumor effects (9, 10). Many Chinese medical doctors reported that G. lucidum can improve sleep in patients with neurasthenia and mental confusion. Previous studies have shown that G. lucidum can reduce spontaneous motor activity, prolong non-rapid eye movement (NREM), and relax the central nervous system (11, 12). Ganoderma lucidum can improve sleep by increasing the number of GABAA receptors (13). It increases interleukin (IL)-1β, tumor necrosis factor (TNF)-α, and nitric oxide (NO) production in a concentration-dependent manner (14). TNF-α is a key factor in regulating human sleep. Although previous studies have indicated that G. lucidum can affect sleep, there is no direct evidence that it can improve sleep.
We previously isolated and identified three strains of G. resinaceum from different areas of G. lucidum production in China and found that the triterpene content in the fruiting body is higher in G. resinaceum than in G. lucidum (15). Ganoderma resinaceum has been used to prevent and treat diseases such as inflammation and cancer; however, studies of the species are limited. Previous studies have mostly focused on the compositions and activities of G. resinaceum polysaccharides and triterpenoids (16, 17). Since it is not clear whether G. resinaceum improves sleep, one aim of the current study was to evaluate the in vivo effects of G. resinaceum on sleep. A second aim of the study was to elucidate the potential effects of G. resinaceum alcohol extract (GRAE) on the regulatory networks between genes and key metabolites using transcriptomic and metabolomic analyses.
Materials and Methods
Drugs and Drug Administration
Ganoderma resinaceum was provided by the Mycological Research Center, Fujian Agriculture and Forestry University. The method for preparing G. resinaceum alcohol extract (GRAE) was adopted from a previous study, with minor modifications (18). The fruiting bodies of G. resinaceum were dried at 70°C for 12 h, crushed using an herbal grinder, and passed through a 60-mesh sieve. To obtain a solid-liquid ratio of 1:30, ethanol (55% v/v) was added. After passing through a water bath at 60°C for 2 h and filtering under reduced pressure, the first filtrate and the first filter residue were obtained. These two steps were repeated twice to obtain the respective filtrates. The three filtrates were combined and added to a rotary evaporator and rotary evaporated at 55°C. After observing that no significant amount of liquid spiraled out, the temperature was slowly increased to 95°C, during which the extract was kept boiling, and the concentrate was collected and then dried in a freeze drier for 24 h.
Animals
Male ICR mice (19–21 g) were provided by Shanghai SLAC Laboratory Animal Co. Ltd. (Shanghai, China). Mice were housed in cages with controlled ambient temperature (24 ± 1°C), relative humidity (60 ± 10%), and a 12 h light-dark cycle. Before the experiment, the mice were reared for 1 week to adapt to the environment. In this study, all animal experiments were performed in strict accordance with the European Community guidelines for the use of experimental animals and the rules of the guide for the care and use of laboratory animals published by the US National Institutes of Health (NIH Publication no. 85-23, revised 1996). The animal protocol was approved by the Animal Care and Use Committee of the College of Food Science, Fujian University of Agriculture and Forestry (Protocol code number FS-2019-0055, approved on October 10, 2019).
Wang et al. demonstrated that the ethanol extract of fruiting bodies of G. lucidum has no acute and genetic toxicity test in mice using the Ames test, micronucleus test of bone marrow cell, and sperm shape abnormality test (19). In this study, we determined that GRAE at 100-1,000 mg/kg.bw had different degrees of sleep improving effects through preliminary experiments, and selected gradient doses of 250, 500, and 1,000 mg/kg.bw for further experimentation.
GRAE was administered to mice by gavage according to the body weight of mice. ICR mice, with a body weight difference of 2 g, were randomly divided into four groups: control (CK, distilled water), low-dose (LD, 250 mg/kg.bw), middle-dose group (MD, 500 mg/kg.bw), and high-dose (HD, 1,000 mg/kg.bw) groups. The treatments were administered every morning, from 9:00 to 10:00 am, via gavage for 30 days. The dosage of each drug was 0.2 ml/10 g.bw.
Sleep Improvement Experiment
The GRAE improved sleep experiment was conducted according to the method in the “Technical Standards for Testing and Assessment of Health Food (2003 edition) prepared by the Ministry of Health of the People's Republic of China” and the method of Chu et al. (12). Sleep was defined as the disappearance of righting reflex, in which mice remained in a dorsal posture for 30–60 s. Animal wakening was identified as the disappearance of the supine position and limbs touching the ground. A quiet sleep experiment environment was maintained at a temperature of 24°C and a relative humidity of 60 ± 10%. Sleep improvement was evaluated by a previously described method, with some modifications (20). The concentrations of pentobarbital sodium and barbiturate sodium in this experiment were the lowest concentrations that could cause sleep in mice, as verified by preliminary experiments.
Induction of Prolonged Sleep by Pentobarbital Sodium
Twenty minutes after the last gavage, the mice were injected intraperitoneally with pentobarbital sodium (55 mg/kg) at a dose volume of 0.2 ml/20 g.bw. The sleep duration of mice was recorded by the righting reflex, from disappearance to recovery. The time of sleep was compared between the treatment and control groups.
Application of Pentobarbital Sodium at a Subthreshold Dose
Twenty minutes after the last gavage, the mice were injected intraperitoneally with pentobarbital sodium (32 mg/kg) at a dose volume of 0.2 ml/20 g.bw. The disappearance of the righting reflex indicated the mouse fell asleep. The frequency of falling asleep was compared between mice in the treatment group and the control group.
Time Until Barbital Sodium-Induced Sleep
Twenty minutes after the last gavage, the mice were injected intraperitoneally with barbital sodium (280 mg/kg) at a dose volume of 0.2 ml/20 g.bw. The time from administration to the disappearance of the righting reflex was recorded and compared with the control group.
Mouse Brain Metabolism
After 30 days of continuous administration of GRAE, mice were euthanized and dissected. Mouse brain tissues were frozen immediately with liquid nitrogen and stored at −80°C for later use. The samples were thawed on ice and 50 mg of the sample was supplemented with 1,000 μl of pre-cooled extractant (70% methanol aqueous solution containing 1 μg/ml 2-chlorophenylalanine as an internal standard) and pre-cooled steel balls. The mixture was homogenized for 30 min at 30 Hz and vortexed for 1 min. After standing on ice for 15 min, samples were centrifuged at 10,000 ×g for 10 min. The supernatant was obtained for ultra-performance liquid chromatography tandem mass spectrometry (UPLC-MS/MS) using the Shim-pack UFLC (SHIMADZU CBM30A; Kyoto, Japan) equipped with the Waters ACQUITY HSS T3 C18 (1.8 μm, 2.1 × 100 mm). Phase A was ultrapure water (0.04% acetic acid) and phase B was acetonitrile (0.04% acetic acid). The flow rate was 0.4 ml/min, the column temperature was 40°C, and the injection volume was 2 μl. The elution gradient was: 0 min water/acetonitrile (95: 5 V/V), 11.0 min (5: 95 V/V), 12.0 min (5: 95 V/V), 12.1 min (95: 5 V/V), and 14.0 min (95: 5 V/V).
For tandem mass spectrometry (MS/MS, QTRAP®), the temperature for electrospray ionization was 500°C and the mass spectrometer voltage was 5,500 V for the positive pole and −4,500 V for the negative pole. The other parameters were an ion source gas I of 55 psi, a gas II of 60 psi, and a curtain gas of 25 psi. The collision-activated dissociation parameter was high. Metabolite quantification was accomplished by a multiple reaction monitoring (MRM) analysis with triple quadrupole mass spectrometry. Based on the target standard database MWDB (metware database), qualitative analysis is performed according to the retention time, ion pair information and secondary spectral data of the detected substances (21).
Raw data were converted to mzXML format by ProteoWizard, then peak alignment, retention time correction and extraction of peak areas were performed using the XCMS program. Metabolite structure identification was performed by exact mass number matching (<25 parts per million) and secondary spectrum matching, using the company's own database for searching. Differential metabolites discriminant analysis was performed using OPLS-DA in R studio software (3.2-ZOL). Differential metabolism was selected according to fold change ≧ 2, fold change ≦ 0.5 and VIP (variable importance for the projection) ≧ 1.
Transcriptomics Analysis of Mice Brain Tissue
The RNA-sequencing (RNA-Seq) experimental method of mice brain tissue was referenced from Wang et al. (22). Three biological replicates were performed for each group. After the final transcriptomic data was generated, stringTie and edgeR were used to estimate the expression levels of all transcripts. StringTie was used to perform expression level for mRNAs by calculating fragments per kilobase per million (FPKM). The differentially expressed mRNAs and genes were selected with log2 (fold change) >1 or log2 (fold change) < -1 and with statistical significance (P < 0.05, multiple test corrected p-value) using R package (3.2.5). Pathways were built using Kyoto Encyclopedia of Genes and Genomes (KEGG) and OmicShare tools for enrichment analyses.
Conjoint Analysis of Transcriptome and Metabolome
Conjoint analysis of transcriptome and metabolome were used to comprehensively analyze the effects of GRAE on prolonging sleep time in mice. All differentially expressed genes and metabolites were queried and mapped to pathways based on KEGG. Key metabolic pathways were screened and calculation of Pearson correlation coefficients for genes and metabolites using the cor program in R were used to analyze gene and metabolite correlations. Pathway enrichment analysis was performed based on p-values. The correlation between differential genes and metabolites was analyzed using R software, and heatmaps were plotted using the clustermap function.
Statistical Analysis
Experimental data were analyzed using SPSS 16.0 and R packages (3.2.5), and plots were generated using GraphPad Prism 6 and R packages (3.2.5). All values are presented as the means ± standard deviation (SD). Correction of p-values in transcriptome and metabolome was performed using false positive rate (FDR) error control method. Each group of experiments was designed in three parallel replicates, and the experimental results conforming to a normal distribution were analyzed using one-way analysis of variance (ANOVA) followed by Student-Newman-Keuls test. Differences with P < 0.05 were considered significant.
Results
Effect of GRAE on Sleep Time
As shown in Figure 1, the length of sleep induced by pentobarbital sodium (55 mg/kg) did not differ significantly between mice in the LD and CK groups (P > 0.05). Compared with the sleep duration in CK, the durations in the MD and HD groups were significantly different (P < 0.01). The sleep durations of the MD and HD groups were 2.04 and 2.30 times longer than those in CK, respectively.
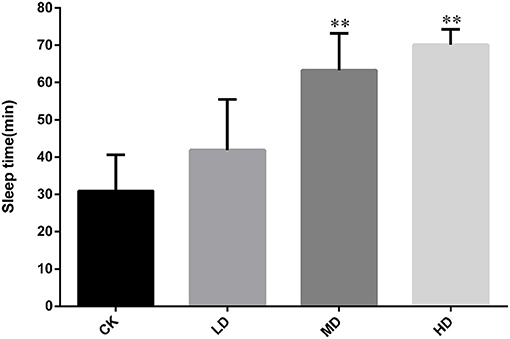
Figure 1. Effect of GRAE on the sleep time of mice induced by pentobarbital sodium in sleep improvement experiment. Each bar represents the mean ± SD (n = 10). *P < 0.05 vs. control group, **P < 0.01 vs. control group.
In mice treated with pentobarbital sodium (55 mg/kg), as the dose of GRAE increased, the number of sleeping mice and the rate of falling asleep increased. The rates of falling asleep in the LD, MD, and HD groups were all significantly higher than that in CK (Table 1, P < 0.01).
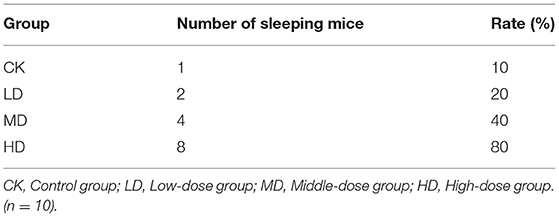
Table 1. Effect of GRAE on the effects of a subthreshold dose of pentobarbital sodium.
Figure 2 summarizes the sleep latency after induction by barbital sodium (280 mg/kg). As the dose of GRAE increased, the sleep latency showed a decreasing trend. The sleep latencies in the LD and MD groups were shorter than that in CK, but the differences were not significant. The sleep latency in the HD group was significantly reduced (P < 0.01) to 0.71 times that in CK.
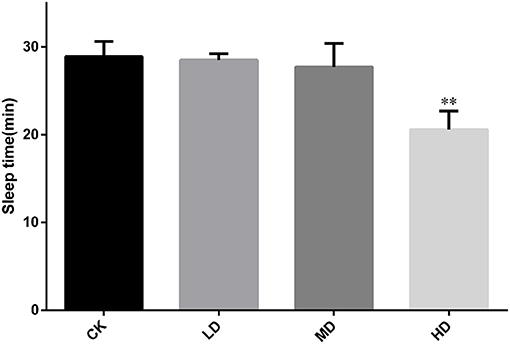
Figure 2. Effect of GRAE on the length of sleep latency in mice induced by barbiturate sodium in sleep improvement experiment. Each bar represents the mean ± SD (n = 10). *P < 0.05 vs. control group, **P < 0.01 vs. control group.
Effect of GRAE on Mouse Brain Metabolites
OPLS-DA
Orthogonal partial least squares discriminated analysis (OPLS-DA) can maximize the distinction between groups and is a useful approach for the identification of metabolite differences (23). The prediction parameters for the evaluation model, R2X, R2Y, and Q2 represent the fractions of variance explained by the X and Y matrices and the predictive ability of the model. As shown in Table 2, the Q2 value for the comparison between the HD and CK groups (i.e., Q2 > 0.5) indicates that the OPLS-DA model was effective. The Q2 value for the comparison between the MD and CK groups (i.e., Q2 < 0.5) indicates that the OPLS-DA model is invalid. The samples from the HD and CK group were completely separated and there were significant differences in the brain metabolite profiles (Figure 3).
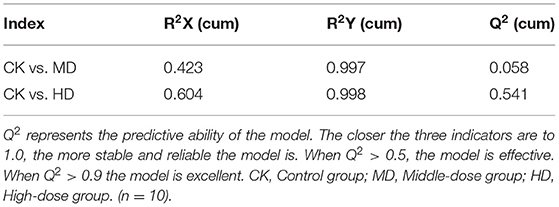
Table 2. R2X, R2Y, and Q2 of OPLS-DA in mouse brain tissue samples from various groups.
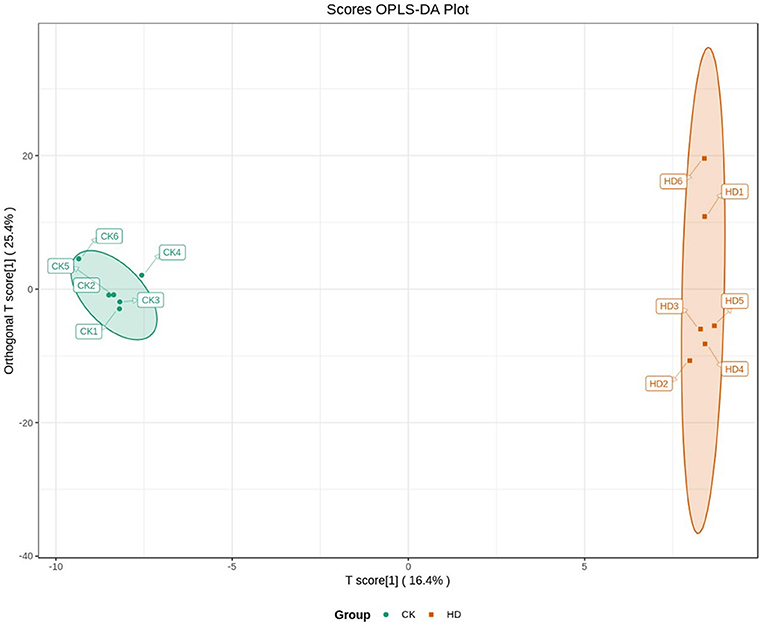
Figure 3. Differences brain metabolite between treatment groups in mice analyzed by OPLS-DA.
The results of the sleep experiments showed that mice in the HD group had the best sleep improvement effects, compared with the CK group. OPLS-DA analysis showed that the OPLS-DA model was invalid between the MD and CK groups. Therefore, the metabolome data of the MD could not be used for subsequent analysis.
Targeted Metabolomic Analysis
The metabolites that were significantly different between the CK and HD groups were screened as shown in Table 3 (metabolites with VIP ≧ 1 are generally considered being significantly different). Compared with the CK group, the relative contents of 73 metabolites in the brain tissue of the HD group were significantly altered. The 73 annotated metabolites were divided into 12 categories: amino acid metabolomics, benzene and substituted derivatives, camitine, carbohydrate metabolomics, coothers enzyme factor and vitamin, indole and its derivatives, ketones, lactone, lipid fatty acids, nucleotide metabolomics, organic acid and its derivatives, oxidized lipid, phenols and its derivatives, and polyamine.
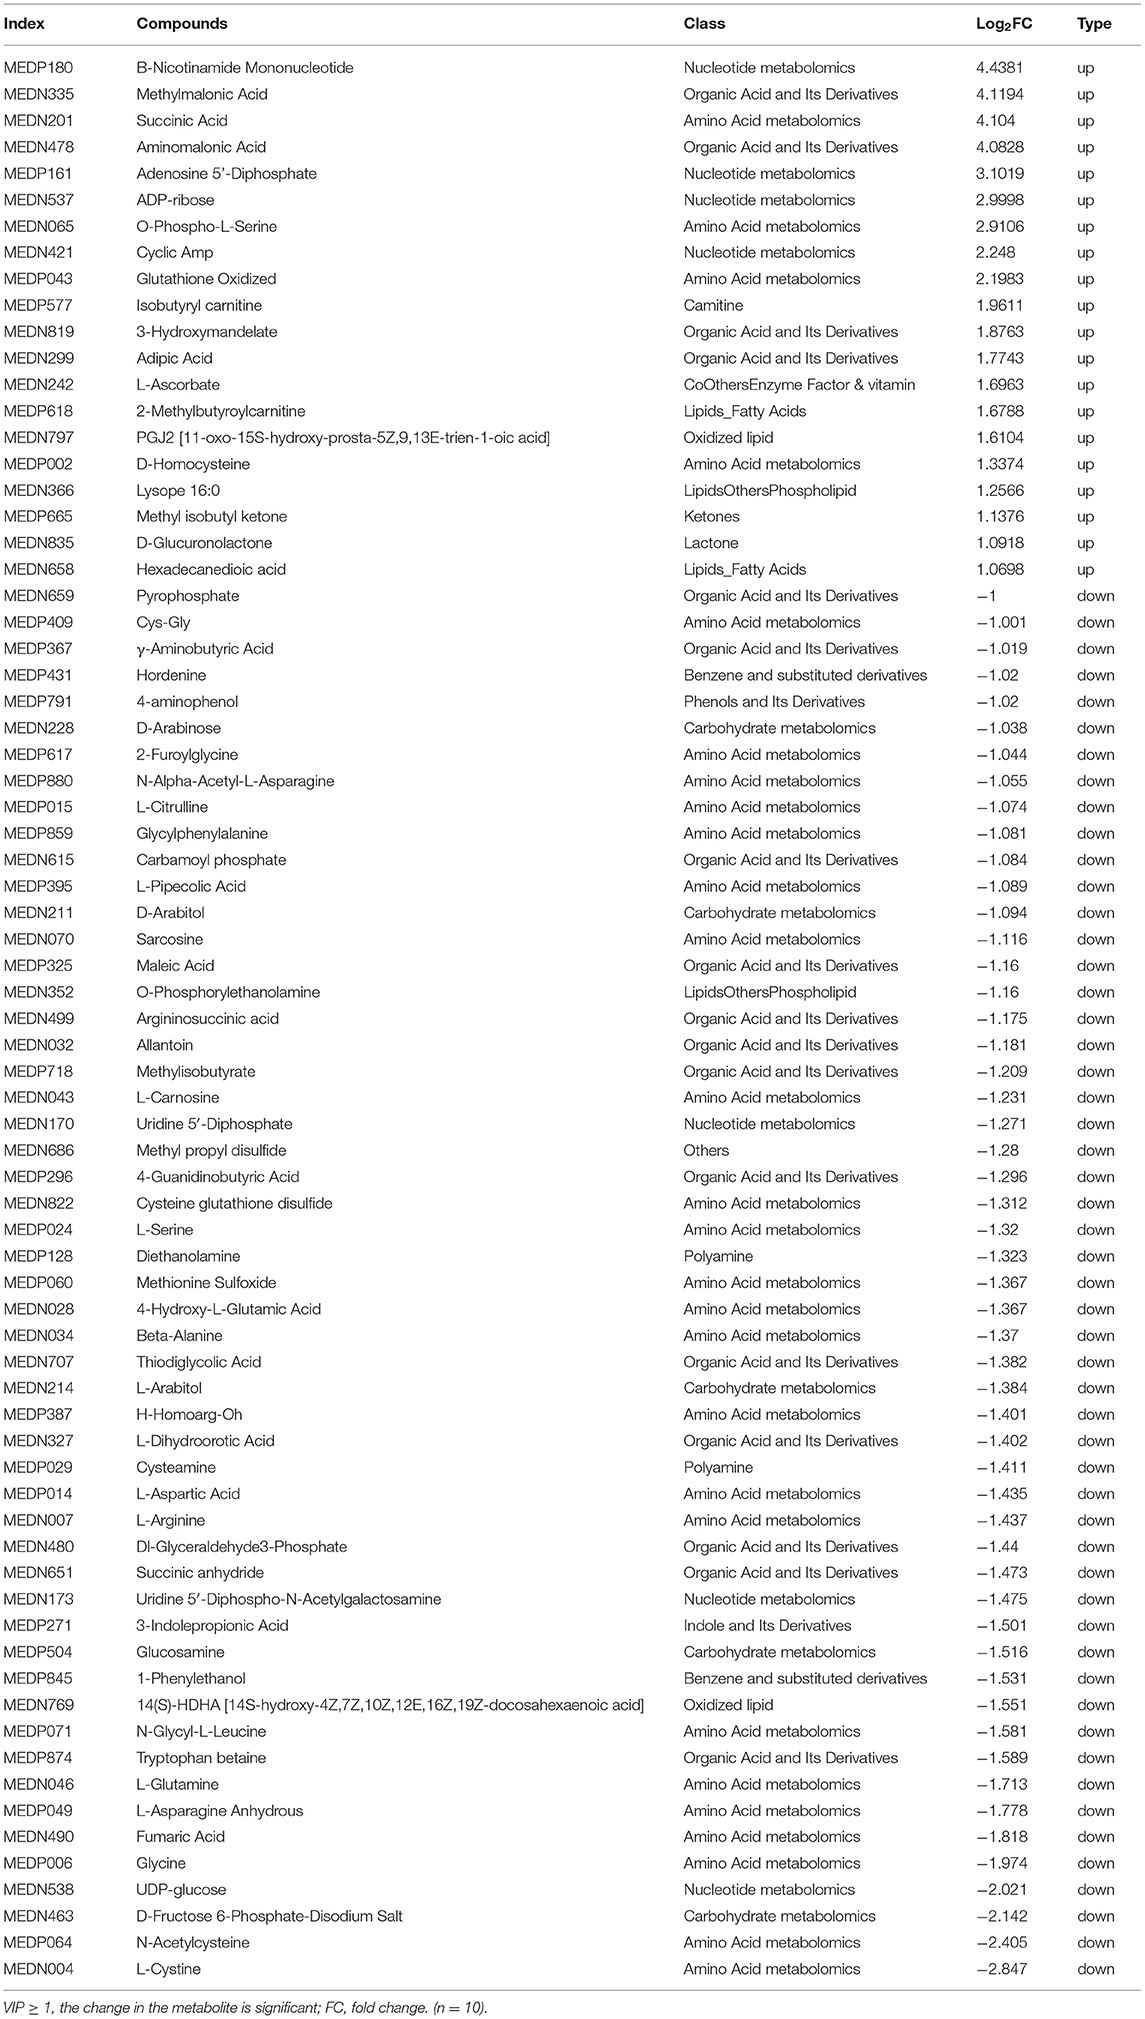
Table 3. Significant metabolites differences in the mouse brain between the high-dose and control groups.
Among these metabolites, 20 were upregulated in the HD group, whereas 53 were downregulated. The most significantly upregulated metabolites were B-nicotinamide mononucleotide, methylmalonic acid, succinic acid, amino malonic acid, and adenosine 5′-diphosphate. The most significantly downregulated metabolites were L-cystine, N-acetylcysteine, D-fructose 6-phosphate-disodium salt, UDP-glucose, and glycine.
Transcriptomics Analysis of Mice Brain Tissue
After raw data filtering, sequencing error rate checking, and GC content distribution checking, the clean reads data used for subsequent analysis were obtained. The Q20% (sequencing error rate < 0.01) was 99.6% and the Q30% (sequencing error rate < 0.001) was 97.63–98.19%. Transcriptome data was then used for further analysis. The brain tissues of mice in the HD and CK groups were screened and a total of 500 significantly different genes were obtained, of which 373 genes were significantly (P < 0.05) upregulated and 127 genes were significantly (P < 0.05) downregulated (Figure 4). These differential genes were enriched in 99 pathways. KEGG enrichment results showed the genes were mainly enriched in neuroactive ligand-receptor interaction, amphetamine addiction, and cocaine addiction (Figure 5). The raw sequencing data of transcriptome of mouse brain were submitted to Sequence Read Archive (SRA) database (with SRA number: SRR17023841- SRR17023846).
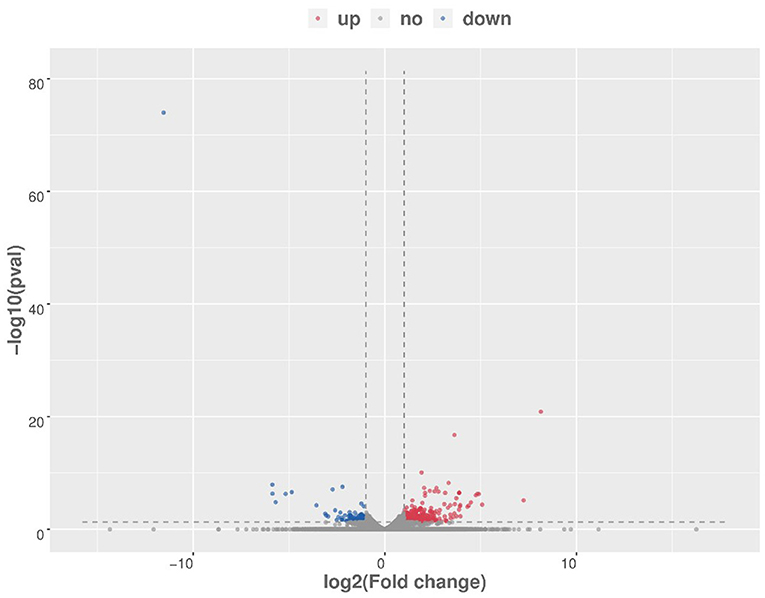
Figure 4. Volcano map of differential genes (HD vs. CK). Red represents upregulated significantly differentially expressed genes, blue represents downregulated significantly differentially expressed genes, and gray dots represent non-significant differentially expressed genes. HD, High-dose group; CK, Control group.
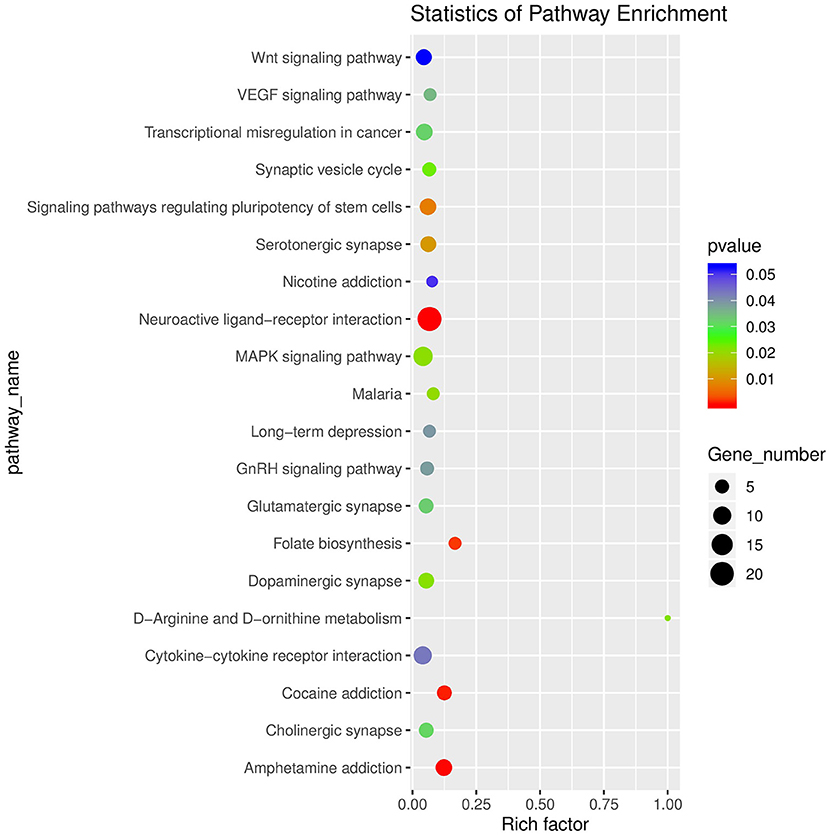
Figure 5. Enrichment diagram of significantly different genes based on a KEGG analysis (top 20). The rich factor referred to the ratio of the number of deferential expressed genes to the total number of genes enriched in a specific category. The size of circles roughly represented the count of deferential expressed genes. The color saturation from blue to red indicated P-value (Student-Newman-Keuls test, n = 3).
Conjoint Analysis of Transcriptome and Metabolome
Conjoint analysis of the transcriptome and metabolome was used to determine correlations between genes and metabolites. Enrichment analysis was performed for differential genes and metabolites between the HD and CK groups. As shown in Figure 6A, the differential metabolites and genes were both enriched in 102 KEGG pathways, including eight pathways potentially related to sleep, namely MAPK signaling pathway, cAMP signaling path-way, neuroactive ligand-receptor interaction, circadian rhythm, circadian entrainment, glutamatergic synapse, serotonergic synapse, and GABAergic synapse. A total of 10 differential metabolites and 42 differential genes were enriched in eight sleep-related pathways.
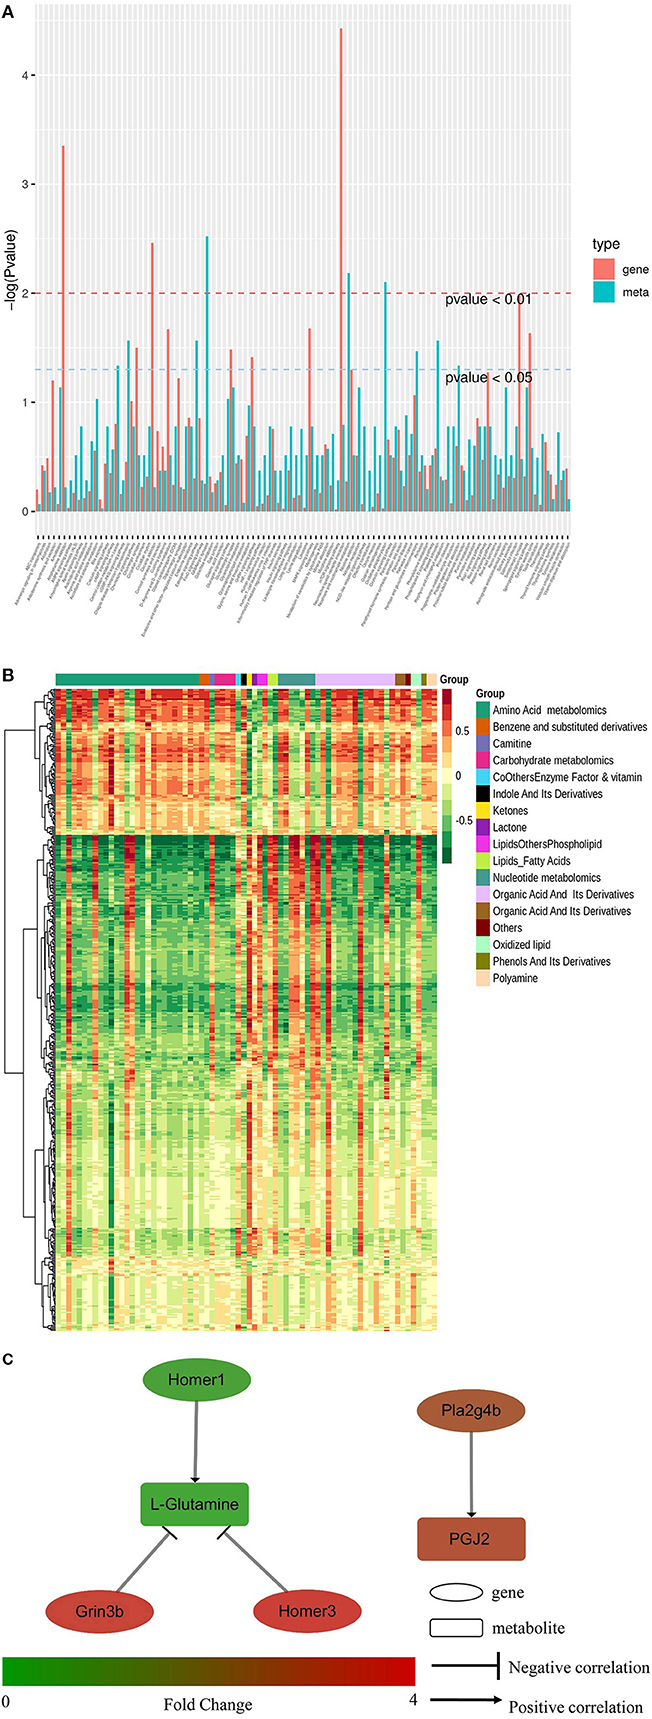
Figure 6. Conjoint analysis of transcriptome and metabolome in mice brain tissues of CK and HD group. (A) KEGG pathway enrichment of differential genes and metabolites. (B) Heatmap of correlation coefficient matrix between differential metabolites and differential genes with the Pearson correlation coefficient above 0.8. Red and green indicated the positive and negative correlation, respectively. The color labels represent Pearson correlation coefficient values. (C) Regulating network between the genes and metabolites in sleep-related pathways. Differences in expression levels between the HD and CK groups was indicated by different colors, with green indicating down-regulation and red indicating up-regulation.
The Pearson correlation coefficients (PCC) between genes and metabolites were calculated using the cor program in R. The differential genes and metabolites with PCC higher than 0.8 were selected and a clustered heatmap (Figure 6B) was drawn. The clustered heatmap showed that the differential metabolites associated with differential genes could be classified into 17 categories, among which amino acid metabolism was the largest category.
The regulation network between the screened differential genes and metabolites was analyzed to further understand the regulatory relationships between the sleep-related differential genes and metabolites. As shown in Figure 6C, L-glutamine was negatively regulated by Homer3 and Grin3b, but Homer1 positively regulated it. PGJ2 (11-oxo-15S-hydroxy-prosta-5Z, 9, 13E-trien-1-oic acid) was positively regulated by Phospholipase A2 Group IVB gene (Pla2g4b).
Discussion
This study showed that 30 days of GRAE (1,000 mg/kg.bw) administration can prolong pentobarbital sodium-induced sleep in mice, increase the sleeping rate in mice treated with a subthreshold pentobarbital sodium dose, and shorten the sleep latency. These results indicate that G. resinaceum prolongs sleep time. After daily administration via gavage, the mice did not sleep. Therefore, GRAE does not directly induce sleep in mice.
To explore the mechanism by which GRAE prolongs sleep in mice, a comprehensive targeted metabolic analysis was performed using a combination of UPLC-MS/MS and statistical analyses to identify metabolite differences between the treatment groups and the control group (21, 24). OPLS-DA revealed significant differences in mice brain metabolites between the CK and HD groups. Identification analysis of differential metabolites in mice brain tissues showed GRAE has a substantial impact on amino acid metabolism. Amino acids and their derivatives play important roles in neurotransmitter activity and their alterations are expected to affect sleep (25). In this study, the sleep time of mice in the HD group was significantly longer than in the CK group, and the contents of L-glutamine in brain tissue of mice in HD group were reduced. L-glutamate is an excitatory amino acid, glutamate and glutamine can be interconverted and the glutamate-glutamine cycle is crucial for the proper maintenance of synaptic activity in brain tissue (26). The results of previous studies showed that increased glutamine and glutamate levels can reduce non-rapid eye movement sleep, which is consistent with the results of this study (27).
Conjoint analysis of transcriptome and metabolome revealed that the most remarkably enriched pathway for differential genes enrichment is the neuroactive ligand-receptor interaction pathway, which is enriched to 19 genes and five metabolites. Bioinformatics analysis showed that upregulation of neuroactive ligand-receptor interactions improved sleep (28). The most noticeably enriched pathway for differential metabolites enrichment is the GABAergic synapse pathway, which is upregulated and enriched to four metabolites and two genes. The GABAergic pathway may adaptively tune the neural property of dorsal fan-shaped body neurons to temperature shifts and reorganize sleep architecture (29), which is consistent with the results in this study that increased mice sleep duration upregulated the GABAergic pathway. Studies have also shown that circadian rhythm, circadian entrainment, cAMP signaling pathway, glutamatergic synapse, serotonergic synapse and MAPK signaling pathway were associated with sleep. Circadian rhythm and circadian entrainment control light/dark cycle, and light has been shown to modulate autonomic and neuroendocrine responses as well as regulating sleep such as attention and arousal (30). Sleep deprivation impaired 3′, 5′-cyclic AMP (cAMP) dependent forms of synaptic plasticity in the mouse hippocampus, reduced cAMP signaling, and drugs that enhance cAMP signaling may counteract the effects of sleep deprivation (31). Glutamate is an excitatory neurotransmitter that affects mood, and glutamatergic neurotransmission is associated with antidepressant-like effects (32). Glutamatergic synapse influences glutamatergic neurotransmission, which consequently affects sleep through mood. Serotonin inhibits rapid eye movement sleep through an action on cholinergic neurons in the mesopontine tegmentum (33). Although no evidence for a directly effect of MAPK signaling pathway on sleep, but some studies have found obstructive sleep apnea (OSA) activated mitogen-activated protein kinase (MAPK) family members.
KEGG analysis of differentially expressed genes and metabolites showed that 10 differential metabolites and 42 differential genes were enriched in eight sleep-related pathways, of which two differential metabolites showed a strong correlation with four differential genes [Pearson correlation coefficient (PCC), |PCC| > 0.8]. As the regulating network between the genes and metabolites showed that two homer scaffolding protein genes, Homer1 and Homer3, are correlated with L-glutamine in glutamatergic synapse pathway. This agrees with previous findings that Homer proteins form metabotropic glutamate receptors with several actors at critical key points of signaling pathways, Homer1 and Homer3 regulates the trafficking and surface expression of Type I metabotropic glutamate (mGlu1) receptors, and Homer proteins form metabotropic glutamate receptors with several actors at critical key points of signaling pathways (34, 35). In the glutamatergic synapse pathway, GRAE increased the expression of Grin3b and decreased the expression of L-glutamine. NR3B, encoded by the Grin3b gene, can protect motoneurons against glutamate-mediated excitotoxicity (36). Blocking NMDA receptors (NR3B) in vivo increases glutamine synthetase activity and glutamine content in brain, and then affect the content of glutamate through the glutamate-glutamine cycle (37). This result indicated that GRAE may affect the accumulation of L-glutamine in mice brain tissue by regulating the expression of Grin3b. This study showed that Homer1, Homer3, and Grin3b were related to L-glutamine, which indicates that they may play a role in regulating L-glutamine accumulation. This study is the first to find that GEAE improves sleep in mice from both the metabolome and transcriptome, and this relationship correlates with L-glutamine levels, raising the conclusion that Grin3b is associated with L-glutamine synthesis. Of course this study has its limitation, such as it cannot probe deeply how the three genes, Homer1, Homer3, and Grin3b, regulate L-glutamine synthesis in mouse brain tissue then regulate the sleep of mice, using knockout technology and neurochemical approaches in future studies. The study also showed that PGJ2 was positively regulated by Pla2g4b, but the mechanism of regulation has not been reported.
Rodent models have widely been used for sleep experiments due to the high similarity of brain circuitry and electrophysiological rhythms between rodents and human. In particular, both rodents and infants exhibit a short sleep-wake cycle (38). Experimental mice share the same genetic background, and can be manipulated easily, reproducibly and reliably. As a result, mice are useful animal models to reproduce an important aspect of human sleep behavior (rapid eye movement sleep). Conversely, rodents are different from humans in that rodent sleep is polyphasic, with multiple sleep-wake cycles per day and each cycle lasting from a few minutes to a several hours (39). Effects of the difference to results remain unknown, and require follow-up studies.
Conclusions
This study investigated the effects of different concentrations of GRAE on the sleep time of mice. Our study showed that GRAE (1,000 mg/kg.bw) could prolong the sleep time of mice. This effect may be related to amino acids and their derivatives in mice brain tissue, especially the accumulation of L-glutamine and PGJ2. The conjoint analysis of the transcriptome and metabolome showed that Homer1, Homer3, and Grin3b were related to the accumulation of L-glutamine. Therefore, these genes may play a role in regulating the biosynthesis of L-glutamine in mice brain tissue. The current research provides new insights into the function of GRAE in prolonging the sleep time of mice.
Data Availability Statement
The datasets presented in this study can be found in online repositories. This data can be found here: https://www.ncbi.nlm.nih.gov/sra?linkname=bioproject_sra_all&from_uid=781743 [accession: SRR17023841 – SRR17023846].
Ethics Statement
The animal study was reviewed and approved by the Animal Care and Use Committee of the College of Food Science, Fujian University of Agriculture and Forestry (Protocol code number FS-2019-0055, approved on October 10, 2019).
Author Contributions
TC: writing review and editing, data curation, investigation, and validation. FZ and RW: writing—original draft, data curation, and investigation. JC, QZ, and YH: data curation and investigation. BX: funding acquisition and conceptualization. YJ: funding acquisition, conceptualization, methodology, formal analysis, and project administration. BC: funding acquisition, conceptualization, methodology, formal analysis, writing—original draft, project administration, and writing—review and editing. All authors contributed to the article and approved the submitted version.
Funding
This research was supported by the National Key Research and Development Program of China (2019YFC1710500), National Natural Science Foundation of China (31801920), National Modern Agriculture Technology System of Edible Fungi Industry (KMD16001A), Natural Science Foundation of Fujian Province (2020J01557), Education and Scientific Research Projects of Young and Middle-aged Teachers in Fujian Province (JT180115), Fujian Agriculture and Forestry University Science and Technology Innovation Fund Project (CXZX2017409 and CXZX2017410) and Natural Science Foundation for Distinguished Young Scholar of Fujian Agriculture and Forestry University of China (xjq202113, BC).
Conflict of Interest
The authors declare that the research was conducted in the absence of any commercial or financial relationships that could be construed as a potential conflict of interest.
Publisher's Note
All claims expressed in this article are solely those of the authors and do not necessarily represent those of their affiliated organizations, or those of the publisher, the editors and the reviewers. Any product that may be evaluated in this article, or claim that may be made by its manufacturer, is not guaranteed or endorsed by the publisher.
References
1. Petit JM, Burlet-Godinot S, Magistretti PJ, Allaman I. Glycogen metabolism and the homeostatic regulation of sleep. Metab Brain Dis. (2015) 30:263–79. doi: 10.1007/s11011-014-9629-x
2. Gamaldo CE, Shaikh AK, McArthur JC. The sleep-immunity relationship. Neurol Clin. (2012) 30:1313–43. doi: 10.1016/j.ncl.2012.08.007
3. Poroyko VA, Carreras A, Khalyfa A, Khalyfa AA, Leone V, Peris E, et al. Chronic sleep disruption alters gut microbiota, induces systemic and adipose tissue inflammation and insulin resistance in mice. Sci Rep. (2016) 6:35405. doi: 10.1038/srep35405
4. Lu R, Wang Z, Lin X, Guo L. How do family role overload and work interferance with family affect the life satisfaction and sleep sufficiency of construction professionals? IJERPH. (2019) 16:3094. doi: 10.3390/ijerph16173094
5. Kleykamp BA, Griffiths RR, McCann UD, Smith MT, Mintzer MZ. Acute effects of zolpidem extended-release on cognitive performance and sleep in healthy males after repeated nightly use. Exp Clin Psychopharmacol. (2012) 20:28–39. doi: 10.1037/a0025237
6. DeKosky ST, Williamson JB. The long and the short of benzodiazepines and sleep medications: short-term benefits, long-term harms? Neurotherapeutics. (2020) 17:153–5. doi: 10.1007/s13311-019-00827-z
7. Paterson RRM. Ganoderma – a therapeutic fungal biofactory. Phytochemistry. (2006) 67:1985–2001. doi: 10.1016/j.phytochem.2006.07.004
8. Chen WY, Chang CY, Li JR, Wang JD, Wu CC, Kuan YH, et al. Anti-inflammatory and neuroprotective effects of fungal immunomodulatory protein involving microglial inhibition. IJMS. (2018) 19:3678. doi: 10.3390/ijms19113678
9. Baby S, Johnson AJ, Govindan B. Secondary metabolites from Ganoderma. Phytochemistry. (2015) 114:66–101. doi: 10.1016/j.phytochem.2015.03.010
10. Amen Y, Shimizu K, Zhu Q, Morimoto S, Kohono T, Hai-Bang T, et al. Tubulin polymerization-stimulating activity of Ganoderma triterpenoids. J Nat Med. (2017) 71:457–62. doi: 10.1007/s11418-017-1072-y
11. Cui XY, Cui SY, Zhang J, Wang ZJ, Yu B, Sheng ZF, et al. Extract of Ganoderma lucidum prolongs sleep time in rats. J Ethnopharmacol. (2012) 139:796–800. doi: 10.1016/j.jep.2011.12.020
12. Chu QP, Wang LE, Cui XY, Fu HZ, Lin ZB, Lin SQ, et al. Extract of Ganoderma lucidum potentiates pentobarbital-induced sleep via a GABAergic mechanism. Pharmacol Biochem Behav. (2007) 86:693–8. doi: 10.1016/j.pbb.2007.02.015
13. Cho SM, Shimizu M, Lee CJ, Han DS, Jung CK, Jo JH, et al. Hypnotic effects and binding studies for GABAA and 5-HT2C receptors of traditional medicinal plants used in Asia for insomnia. J Ethnopharmacol. (2010) 132:225–32. doi: 10.1016/j.jep.2010.08.009
14. Ahmadi K, Riazipour M. Effect of Ganoderma lucidum on cytokine release by peritoneal macrophages. Iran J Immunol. (2007) 4:220–6.
15. Chen B, Ke B, Ye L, Jin S, Jie F, Zhao L, et al. Isolation and varietal characterization of Ganoderma resinaceum from areas of Ganoderma lucidum production in China. Sci Horticult. (2017) 224:109–14. doi: 10.1016/j.scienta.2017.06.002
16. Chen L, Chen X, Wang S, Bian Y, Zhao J, Li S. Analysis of triterpenoids in Ganoderma resinaceum using liquid chromatography coupled with electrospray ionization quadrupole - time - of - flight mass spectrometry. Int J Mass Spectr. (2019) 436:42–51. doi: 10.1016/j.ijms.2018.11.016
17. Shi Q, Huang Y, Su H, Gao Y, Peng X, Zhou L, et al. C28 steroids from the fruiting bodies of Ganoderma resinaceum with potential anti-inflammatory activity. Phytochemistry. (2019) 168:112109. doi: 10.1016/j.phytochem.2019.112109
18. Guo WL, Pan YY, Li L, Li TT, Liu B, Lv XC. Ethanol extract of Ganoderma lucidum ameliorates lipid metabolic disorders and modulates the gut microbiota composition in high-fat diet fed rats. Food Funct. (2018) 9:3419–31. doi: 10.1039/C8FO00836A
19. Wang LH, Xu B, Zhang HN, Yang Y, Zhuang HT, Tang TH, et al. A toxicological study on ethanol extract from fruiting bodies of Ganoderma Lingzhi[J]. Mycosystema. (2017) 36:1642-50. doi: 10.13346/j.mycosystema.170106
20. Yu L, Han X, Cen S, Duan H, Feng S, Xue Y, et al. Beneficial effect of GABA-rich fermented milk on insomnia involving regulation of gut microbiota. Microbiol Res. (2020) 233:126409. doi: 10.1016/j.micres.2020.126409
21. Chen W, Gong L, Guo Z, Wang W, Zhang H, Liu X, et al. A novel integrated method for large-scale detection, identification, and quantification of widely targeted metabolites: application in the study of rice metabolomics. Mol Plant. (2013) 6:1769–80. doi: 10.1093/mp/sst080
22. Wang Z, Gerstein M, Snyder M. RNA-Seq: a revolutionary tool for transcriptomics. Nat Rev Genet. (2009) 10:57–63. doi: 10.1038/nrg2484
23. Thévenot EA, Roux A, Xu Y, Ezan E, Junot C. Analysis of the human adult urinary metabolome variations with age, body mass index, and gender by implementing a comprehensive workflow for univariate and OPLS statistical analyses. J Proteome Res. (2015) 14:3322–35. doi: 10.1021/acs.jproteome.5b00354
24. Chen Y, Zhang R, Song Y, He J, Sun J, Bai J, et al. RRLC-MS/MS-based metabonomics combined with in-depth analysis of metabolic correlation network: finding potential biomarkers for breast cancer. Analyst. (2009) 134:2003. doi: 10.1039/b907243h
25. Lee M, Jayathilake K, Dai J, Meltzer HY. Decreased plasma tryptophan and tryptophan/large neutral amino acid ratio in patients with neuroleptic-resistant schizophrenia: relationship to plasma cortisol concentration. Psychiatr Res. (2011) 185:328–33. doi: 10.1016/j.psychres.2010.07.013
26. Bryant AS, Li B, Beenhakker MP, Huguenard JR. Maintenance of thalamic epileptiform activity depends on the astrocytic glutamate-glutamine cycle. J Neurophysiol. (2009) 102:2880. doi: 10.1152/jn.00476.2009
27. Caroline L, O'Gorman RL, Fiona P, Tüshaus L, Wehrle F, Achermann P, et al. Sleep spindles are related to schizotypal personality traits and thalamic glutamine/glutamate in healthy subjects. Schizophr Bull. (2015) 2:522-31. doi: 10.1093/schbul/sbu109
28. Xu Y, Li X, Man D, Su X, Gula A. ITRAQ-based proteomics analysis on insomnia rats treated with mongolian medical warm acupuncture. Biosci Rep. (2020) 40:BSR20191517. doi: 10.1042/BSR20191517
29. Kim JH, Ki Y, Lee H, Hur MS, Baik B, hur J-H, et al. The voltage-gated potassium channel Shaker promotes sleep via thermosensitive GABA transmission. Communications Biology. (2020) 3:174-96. doi: 10.1038/s42003-020-0902-8
30. Fisk AS, Tam SKE, Brown LA, Vyazovskiy VV, Bannerman DM, Peirson SN. Light and cognition: roles for circadian rhythms, sleep, and arousal. Front Neurol. (2018) 9:56. doi: 10.3389/fneur.2018.00056
31. Vecsey CG, Baillie GS, Jaganath D, Havekes R, Daniels A, Wimmer M, et al. Sleep deprivation impairs cAMP signalling in the hippocampus. Nature. (2009) 461:1122–5. doi: 10.1038/nature08488
32. Manosso LM, Moretti M, Colla AR, Ribeiro CM, Dal-Cim T, Tasca CI, et al. Involvement of glutamatergic neurotransmission in the antidepressant-like effect of zinc in the chronic unpredictable stress model of depression. J Neural Transm. (2016) 123:339–52. doi: 10.1007/s00702-015-1504-3
33. Honda T, Semba K. Serotonergic synaptic input to cholinergic neurons in the rat Mesopontine tegmentum. Brain Res. (1994) 647:299-306. doi: 10.1016/0006-8993(94)91329-3
34. Roche KW, Tu JC, Petralia RS, Xiao B, Wenthold RJ, Worley PF. Homer 1b Regulates the Trafficking of Group I Metabotropic Glutamate Receptors. J Biol Chem. (1999) 274:25953-7. doi: 10.1074/jbc.274.36.25953
35. Mansouri M, Kasugai Y, Fukazawa Y, Bertaso F, Raynaud F, Perroy F, et al. Distinct subsynaptic localization of type 1 metabotropic glutamate receptors at glutamatergic and GABAergic synapses in the rodent cerebellar cortex. Eur J Neurosci. (2015) 41:157-67. doi: 10.1111/ejn.12779
36. Niemann S, Landers JE, Churchill MJ, Hosler B, Sapp P, Speed WC, et al. Motoneuron-specific NR3B gene: no association with ALS and evidence for a common null allele. Neurology. (2008) 70:666–76. doi: 10.1212/01.wnl.0000271078.51280.17
37. Kosenko E, Llansola M, Montoliu C, Monfort P, Rodrigo R, Hernandez-Viadel M, et al. Glutamine synthetase activity and glutamine content in brain: modulation by NMDA receptors and nitric oxide. Neurochem Int. (2003) 43:493-9. doi: 10.1016/S0197-0186(03)00039-1
38. Cui GF, Hou M, Shao YF, Chen HL, Gao JX, Jun FX, et al. A novel continuously recording approach for unraveling ontogenetic development of sleep-wake cycle in rats. Front Neurol. (2019) 10:873. doi: 10.3389/fneur.2019.00873
Keywords: Ganoderma resinaceum, alcohol extract, sleep, metabolome, transcriptome
Citation: Chen T, Zhang F, Chen J, Zhong Q, Hu Y, Wu R, Xie B, Jiang Y and Chen B (2022) Effects of Alcohol Extracts From Ganoderma resinaceum on Sleep in Mice Using Combined Transcriptome and Metabolome Analysis. Front. Nutr. 9:745624. doi: 10.3389/fnut.2022.745624
Received: 22 July 2021; Accepted: 05 January 2022;
Published: 28 January 2022.
Edited by:
Christopher M. Butt, Bolder BioPATH, Inc., United StatesReviewed by:
Moul Dey, South Dakota State University, United StatesChenyang Huang, Institute of Agricultural Resources and Regional Planning (CAAS), China
Copyright © 2022 Chen, Zhang, Chen, Zhong, Hu, Wu, Xie, Jiang and Chen. This is an open-access article distributed under the terms of the Creative Commons Attribution License (CC BY). The use, distribution or reproduction in other forums is permitted, provided the original author(s) and the copyright owner(s) are credited and that the original publication in this journal is cited, in accordance with accepted academic practice. No use, distribution or reproduction is permitted which does not comply with these terms.
*Correspondence: Yuji Jiang, anlqMTIwOUAxNjMuY29t; Bingzhi Chen, Y2J6XzIwMDZAMTYzLmNvbQ==
†These authors have contributed equally to this work