 Natália Yumi Noronha1†
 Mariana Barato2†
 Chanachai Sae-Lee3
 Marcela Augusta de Souza Pinhel1,2
 Lígia Moriguchi Watanabe4
 Vanessa Aparecida Batista Pereira4
 Guilherme da Silva Rodrigues1
 Déborah Araújo Morais5
 Wellington Tavares de Sousa Jr.5
 Vanessa Cristina de Oliveira Souza5
 Jessica Rodrigues Plaça6
 Wilson Salgado Jr.7
 Fernando Barbosa Jr.5
 Torsten Plösch8
 Carla Barbosa Nonino1,4*
- 1Department of Internal Medicine, Ribeirao Preto Medical School, University of São Paulo, São Paulo, Brazil
- 2Department of Molecular Biology, São José do Rio Preto Medical School, São Paulo, Brazil
- 3Research Division, Faculty of Medicine, Siriraj Hospital, Mahidol University, Bangkok, Thailand
- 4Department of Health Sciences, Ribeirão Preto Medical School, University of São Paulo, São Paulo, Brazil
- 5Department of Clinical Analysis, Toxicology and Food Sciences, School of Pharmaceutical Sciences of Ribeirão Preto, University of São Paulo, São Paulo, Brazil
- 6National Institute of Science and Technology in Stem Cell and Cell Therapy and Center for Cell-Based Therapy, São Paulo, Brazil
- 7Department of Surgery and Anatomy, Ribeirao Preto Medical School, SãoPaulo, Brazil
- 8Department of Obstetrics and Gynecology, University Medical Center Groningen, University of Groningen, Groningen, Netherlands
Introduction: Nutriepigenetic markers are predictive responses associated with changes in “surrounding” environmental conditions of humans, which may influence metabolic diseases. Although rich in calories, Western diets could be linked with the deficiency of micronutrients, resulting in the downstream of epigenetic and metabolic effects and consequently in obesity. Zinc (Zn) is an essential nutrient associated with distinct biological roles in human health. Despite the importance of Zn in metabolic processes, little is known about the relationship between Zn and epigenetic. Thus, the present study aimed to identify the epigenetic variables associated with Zn daily ingestion (ZnDI) and serum Zinc (ZnS) levels in women with and without obesity.
Materials and Methods: This is a case-control, non-randomized, single-center study conducted with 21 women allocated into two groups: control group (CG), composed of 11 women without obesity, and study group (SG), composed of 10 women with obesity. Anthropometric measurements, ZnDI, and ZnS levels were evaluated. Also, leukocyte DNA was extracted for DNA methylation analysis using 450 k Illumina BeadChips. The epigenetic clock was calculated by Horvath method. The chip analysis methylation pipeline (ChAMP) package selected the differentially methylated regions (DMRs).
Results: The SG had lower ZnS levels than the CG. Moreover, in SG, the ZnS levels were negatively associated with the epigenetic age acceleration. The DMR analysis revealed 37 DMRs associated with ZnDI and ZnS levels. The DMR of PM20D1 gene was commonly associated with ZnDI and ZnS levels and was hypomethylated in the SG.
Conclusion: Our findings provide new information on Zn's modulation of DNA methylation patterns and bring new perspectives for understanding the nutriepigenetic mechanisms in obesity.
Introduction
Nutriepigenetic markers are predictive responses associated with changes in “surrounding” environmental conditions of humans, influencing metabolic diseases. DNA methylation, the most studied epigenetic modification, is defined as a reversible chemical modification (addition of a methyl group) in a CpG dinucleotide, represented as methylated CpG (mCpG) (1). The available studies in DNA methylation typically retrieve a list of trait-associated differentially methylated positions (DMPs) or differentially methylated regions (DMRs) (2). DMPs refer to a single CpG site analyzed, while DMRs refer to a genomic region that comprises several CpG sites. Evaluation of trait-related DMRs can avoid stochastic associations and brings more information about the gene-specific methylation status (3). Another application of DNA methylation profiles is the development of aging epigenetic biomarkers, the epigenetic clock, or DNA methylation age (DNAm age) (4). DNAm age model was developed by Horvath and is based on DNA methylation at 353 CpG sites, which map genes associated with cell development and survival (5). Additionally, Horvath's (5) epigenetic clock is reliable and highly correlated with chronological age. DNAm age acceleration is estimated by the residuals of the regression of chronological age and has been correlated with mortality and aging-related diseases (6, 7). Recent investigations have shown that metabolic diseases, such as obesity, could be associated with changes in DNAm age (8).
Obesity is characterized by an abnormal fat accumulation that leads to other comorbidities and health risks (9). It is a worldwide health concern with a multifactorial etiology, including environmental and genetic influences (9). Eating behavior could be an environmental risk factor for obesity progression (9). Although characterized by excessive high-energy density foods and palatable ingredients, Western diets may result in a high risk for micronutrient deficiency (10–12). Also, Western diets have been described as possible epigenetic modulators due to their inflammatory potential. However, evaluating responses to single nutrients or isolated compounds in epigenome studies remains a challenge (1).
Zinc (Zn) deficiency is common in obesity conditions, resulting in an inflammatory status, oxidative stress, insulin resistance, and lower insulin secretion by the pancreatic β cells (13). Zn participates in DNA repair and transcription, as an enzyme cofactor, and regulates cell proliferation, including apoptosis and cell differentiation (14). Zn deficiency can also be associated with DNA hypomethylation through the methionine synthetase (MTR) and reduction in the activity of DNA methyltransferases (DNMTs). Another Zn-related epigenetic mechanism is its role in maintaining the three-dimensional structure of Zinc finger domains (ZnDs). Recently it was described that these motifs could have a new genomic influence, acting as methyl-CpG binding proteins (MBPs). Those proteins can recognize and bind methylated DNA and promote downstream effects of gene expression (15). Nevertheless, the obesity-related biomarker, peroxisome proliferator-activated receptor-gamma (PPARγ), is a nuclear receptor protein that regulates fatty acid and glucose homeostasis. Zn supplementation may increase PPARγ expression, resulting from the two ZnDs that can bind to DNA (16).
Thus, the purpose of this study was to identify epigenetic variables related to serum Zn (ZnS) levels and Zn daily ingestion (ZnDI) in a case-control cohort of women with and without obesity. Here, we hypothesized that Zn is related to DNA methylation, and this association may have metabolic effects.
Materials and Methods
Ethics Statement
The Research Ethics Committee of the Ribeirão Preto Medical School University Hospital of University of São Paulo (HCRP-USP) approved the study with the CAAE license: 14275319.7.0000.5440. All participants signed the informed consent form. The principles of the Declaration of Helsinki guided all the procedures that were adopted (17).
Study Design
A case-control, non-randomized, single-center study was conducted in Ribeirão Preto Medical School University Hospital (HCRP-USP).
Subjects
The population size was defined by convenience. Individuals (n = 21) were selected and classified according to their body mass index (BMI), following the international classification from the Centers for Disease Control and Prevention (CDC) (18). Obesity is defined by BMI > 30 kg/m2 and non-obesity by 18.5 < BMI < 25 kg/m2. The volunteers were allocated into two groups: control group (CG), composed of 11 women without obesity, and study group (SG), composed of 10 women with obesity. The inclusion criteria adopted in this study were women aged 18–50 years, with stable body weight for at least 6 months. The non-inclusion criteria were current tobacco use, pregnant women, or women in the post-menopause stage. Patients under any nutritional, surgical, or healthy interventions protocols were not included, and participants had to report any other health condition besides obesity.
Anthropometric and Body Composition Data
Weight was measured with an electronic platform (Filizola) scale with a precision of 0.1 kg and a maximum capacity of 300 kg. Height was measured with a vertical shaft with 0.5 cm graduation. BMI was calculated by dividing the body mass in kilograms by the square of the body height in meters, universally expressed in units of kg/m2. Body composition was measured using the electrical bioimpedance device model Quantum BIA 450 Q—RJL System (Clinton Township, MI, USA). For waist circumference (WC) measurement (cm), the smallest perimeter between the last rib and the iliac crest was adopted.
ZnDI Evaluation
ZnDI was assessed based on food record over 3 non-consecutive days. Orientation was conducted for the patients to self-record the type and amount of food and beverages consumed. The information was processed in the nutritional analysis program Dietpro® 5i.
Biological Sampling
Patients were instructed to attend the hospital in the morning after a 12 h fasting period. Serum and EDTA vacuum tubes were used to collect peripheral blood for biochemical, ZnS levels, and genetic analysis. The tubes were immediately centrifuged, and samples were processed and stored at -80°C.
Biochemical Analysis
The biochemical biomarkers that were accessed included total cholesterol (TC), triglycerides (TG), high-density lipoprotein cholesterol (HDL-c), low-density lipoprotein cholesterol (LDL-c), and blood glucose.
ZnS Measurements
ZnS levels were determined with an inductively coupled plasma mass spectrometer (PerkinElmer, NexION 2000 B, Waltham, MA, USA, EUA). The analysis was performed using the procedure described by Batista et al. (19). Briefly, the samples (0.25 ml) were directly diluted in a metal-free polypropylene tube containing 4.75 ml of the diluent solution composed of 0.005% v/v Triton® X-100 and 0.5% v/v distilled HNO3. The resulting solution was directly injected for inductively coupled plasma–mass spectrometry (ICP-MS) measurements. The analytical calibration standards (matrix-matching) were prepared daily over the range of 10–100 μgL−1.
DNA Extraction and 450K DNA Methylation Illumina BeadChip
Leukocyte DNA extraction was performed using the automated Promega system (Madison, Wisconsin, USA). All instructions stipulated by the manufacturer were followed. The DNA integrity was accessed by agarose gel and the quality, using a nanodrop (Thermo Fisher, Waltham, Massachusetts, USA). Following the recommendations of the Infinium Human Methylation 450k (IHM450K) protocol, DNA was extracted from total leukocytes and converted to bisulfite using the EZ DNA Methylation Kit (Zymo Research Corporation, Irvine, CA, USA). Subsequently, the processes were performed using 500 ng of DNA hybridized to the IHM450K BeadChip. The intensities were obtained by the iScan system (Illumina, Inc., San Diego, CA, USA), and the raw data file was exported for bioinformatics analysis.
Bioinformatics Analysis
The analysis was performed using RStudio version 3.6.2 and the ChAMP package version 2.24.0, available from Bioconductor (2). We evaluated the anthropometric, biochemical, epigenetic, and Zn information for further association.
After data normalization using the champ.norm() function available in the ChAMP package, we performed a quality control analysis. Missing data were imputed with K-nearest neighbor (k-NN) method (20). Single value decomposition (SVD) function was used to verify the components inserted in the sample sheet and the main variations between methylation data.
The method proposed by Houseman (21) was used to estimate the cell type of leukocytes. The information about the leukocyte cell types was obtained from purified cells, and the IHM450K contained 473 CpG sites as a reference for the most critical cell types.
Epigenetic Clock Analysis
Using the beta values obtained from the beta-mixture quantile (BMIQ) normalization, the DNAm age was calculated using the Horvath's method through the online tool (http://dnamage.genetics.ucla.edu/) (5). Briefly, the calculation of DNAm age is based on methylation levels of 353 CpG sites. Age-acceleration metrics were derived by regressing DNAm age on chronological age and predicting the residuals (AAR). A positive or accelerated epigenetic age occurred when an individual's DNA methylation predicted age is older than chronological age.
Differentially Methylated Regions
The champ.DMR() function was used to calculate the DMR. A supervised method, the Bumphunter, was adopted in the DMR calculation. This method is based on linear regression models and uses statistical techniques to scan the genome for groups of probes associated with the variable of interest. A linear regression of the M value is performed to identify candidate regions, and only results with significant false discovery rate (FDR) were exported (argument cutoff point available in the Bumphunter function) (22). M-value, a method proposed to measure the methylation level, is the log2 ratio of the intensities of methylated probe versus unmethylated probe (23). The correspondent symbols were input in the STRING (Protein-Protein Interaction Networks Functional Enrichment Analysis) for gene ontology results (24).
Statistical Analysis
The anthropometric, biochemical, ZnDI, and ZnS variables were analyzed using the Statistical Package for Social Sciences (SPSS) software version 24.0 (IBM, New York, USA). The Shapiro Wilk test was used to verify the normality of data. Student t-test was performed to compare parametric data, and Mann–Whitney U test was used to compare non-parametric data. Spearman's correlation was performed to verify associations between AAR and ZnS levels, BMI and WC. The p-value was established at p < 0.05.
Results
Clinical Data
Table 1 summarizes anthropometry, body composition, and biochemical analysis. As expected for these variables, we found the weight, BMI, fat mass, free fat mass, and WC values to be higher in SG when compared to CG. No difference was found between SC and CG for glucose, TC, HDL-c, LDL-c, TG, and ZnDI values. SG had lower ZnS levels (1.05 ± 0.20 mg/l) compared to CG (1.40 ± 0.21 mg/l, p = 0.001).
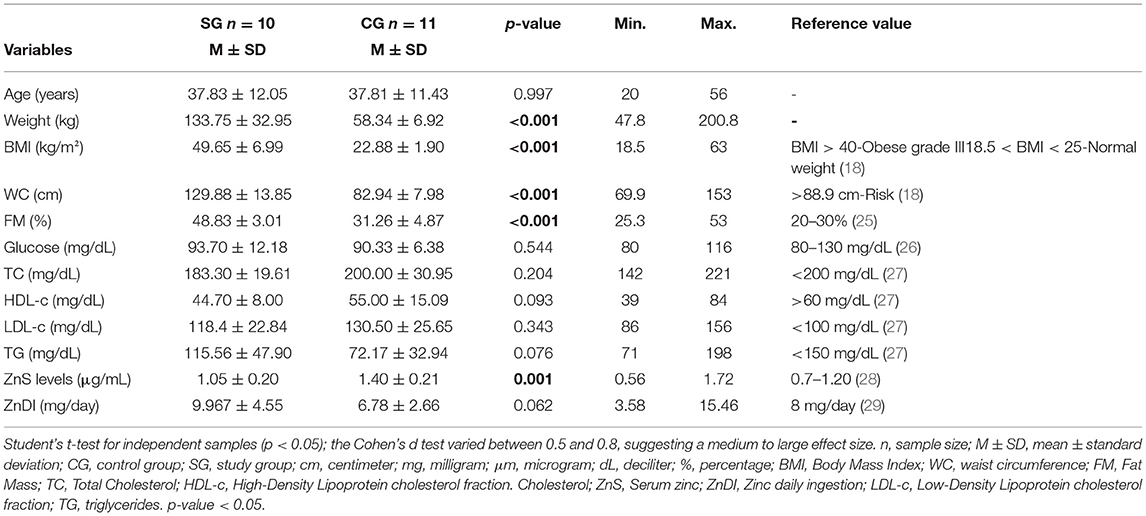
Table 1. Descriptive characteristics of the study population (n = 21).
Epigenetic Clock Analysis
DNAm age was not different between SG and CG (DNAm age: 41.85 ± 13.04 vs. 40.80 ± 14.49, p = 0.86). However, AAR, which has more biological relevance as an indicator of an individual's rate of biological aging, was higher in the SG (Figure 1A). Furthermore, there was a negative correlation between AAR and the ZnS levels (Figure 1B), but AAR showed a positive correlation with BMI and WC (Figures 1C,D). When we reanalyzed the AAR by removing participants who were younger than 30 years old [SG: 43.51 ± 8.22 (n = 7), CG: 47.68 ± 9.87], there were no significant differences in the chronological age and DNAm age between the SG and CG (Figures 2A,B). Concomitantly, we observed a significant increase of AAR in SG participants from this sub-analysis (p = 0.036) (Figure 2C).
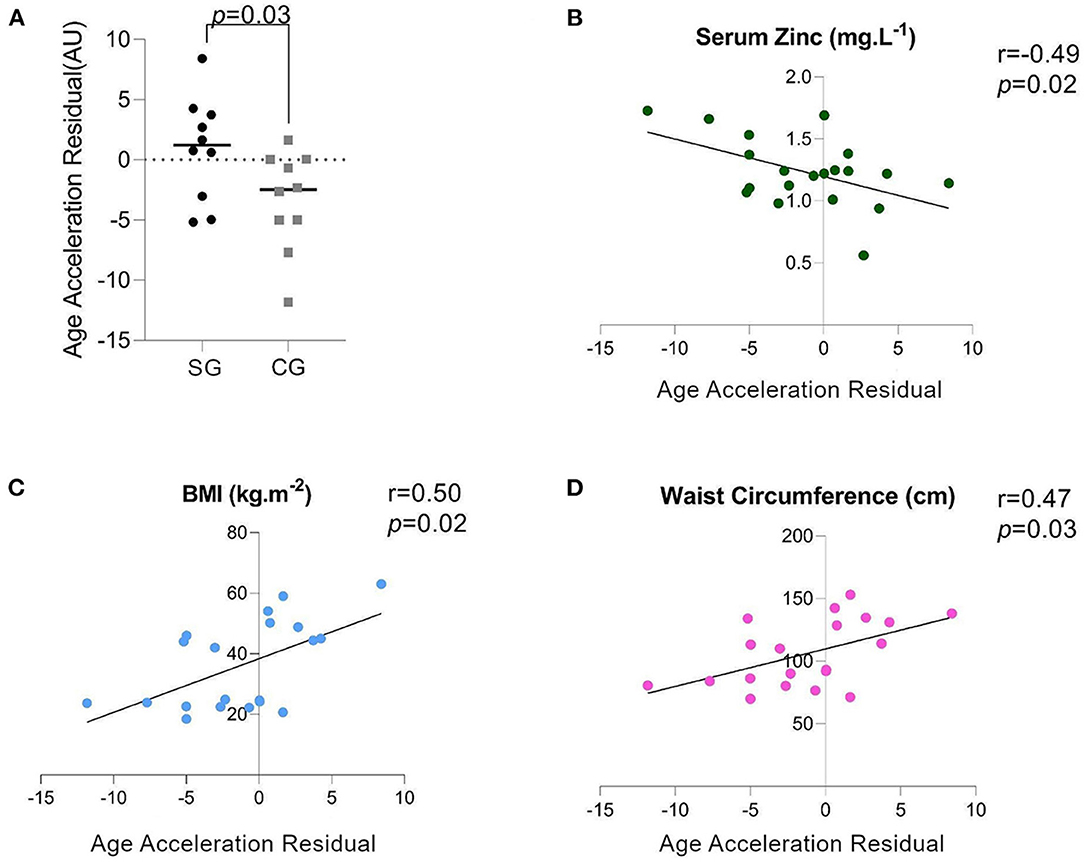
Figure 1. (A) AAR: Age Acceleration Residual (measured in arbitrary units), (B) Spearman's Correlation of the serum zinc (ZnS) levels and the AAR, (C) Spearman's Correlation of the BMI and AAR, (D) Spearman's Correlation of the waist circumference (WC) and AAR.
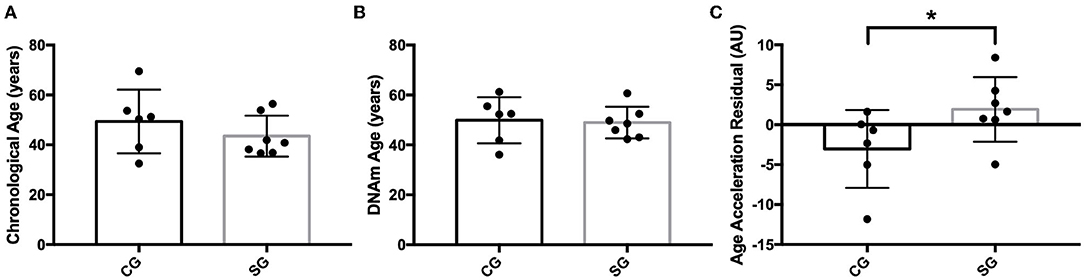
Figure 2. (A) Comparison of chronological Age (in years) between study group (SG) and control group (CG), (B) Comparison of DNA methylation age (DNAm) age (in years) between SG and CG, (C) Comparison of age acceleration residual (AAR) (in years) between SG and CG (p* = 0.036).
Differentially Methylated Regions Calculation
The DMR analysis by the ChAMP package revealed that 30 DMRs were associated with ZnS levels, and 10 DMRs were associated with ZnDI (Table 2).
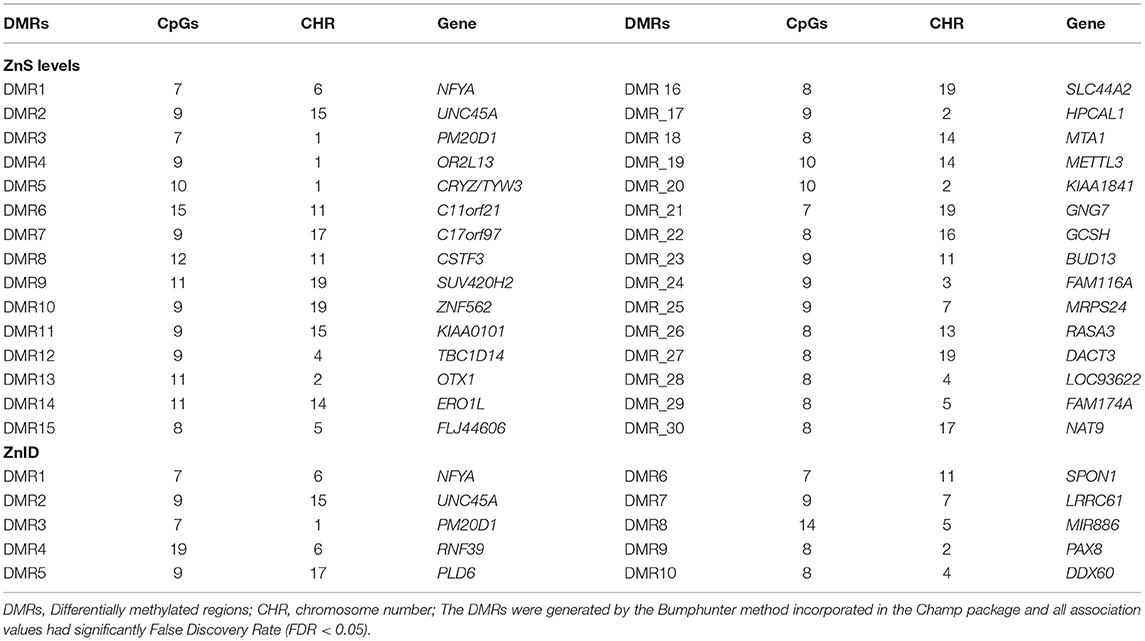
Table 2. Zinc-related differentially methylated regions (DMRs).
The enrichment of all retrieved DMRs (Figure 3A) revealed targets involved with immune function (GO:0030886, GO:0045409, GO:0045659, GO:0045658, GO:0030885), DNA/cellular repair (GO:0051684, GO:0097680, GO:0009786), and lipid/protein metabolism (GO:0002933, GO:0009822). Three DMRs were common for both ZnDI and ZnS levels (Figure 3B). These targets were explored in depth in this article.
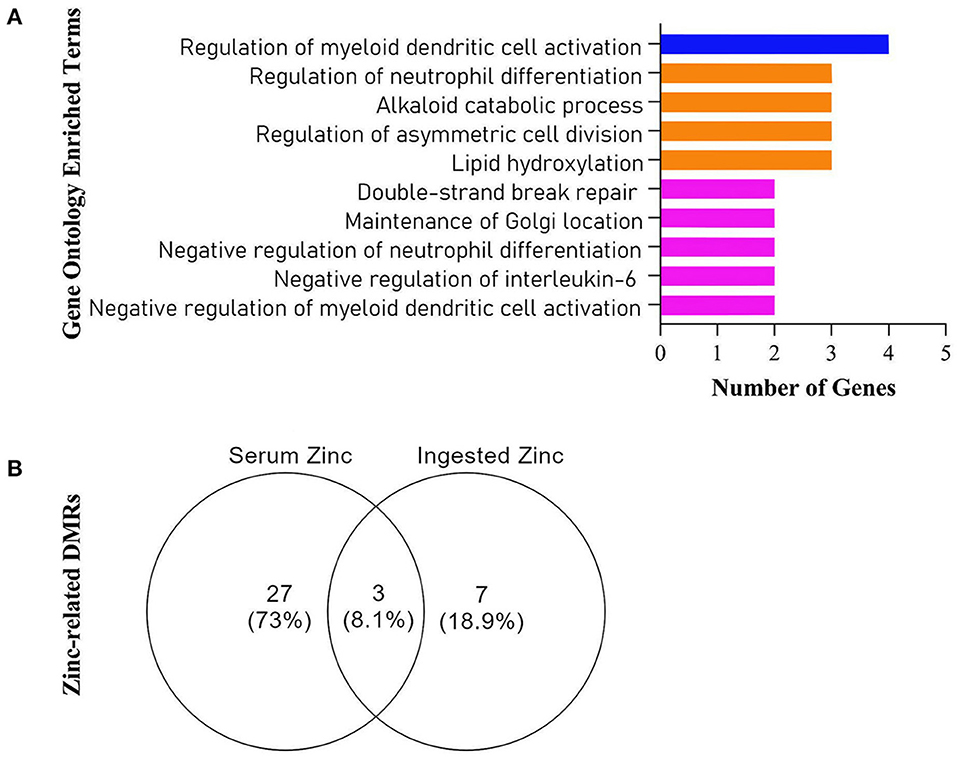
Figure 3. (A) Gene Ontology Enriched Terms performed on Webgestalt Web Tool, (B) Venn Diagram of all retrieved differentially methylated regions (DMRs) from the Champ algorithm.
The common DMRs analyzed were enriched in the NFYA, UNC45A, and PM20D1 genes, named DMR1, DMR2, and DMR3, respectively. No difference between groups for M value was detected for NFYA and UNC45A genes (Table 3). For the PM20D1 gene, SG presented a lower M value compared to CG (-1.532 ± 1.369 vs. −0.353 ± 0.92, p = 0.031). From a site-specific perspective, six CpG sites' M values from the PM20D1 gene were lower in the SG compared to the CG: cg17178900, cg07167872, cg11965913, cg14159672, cg14893161, cg24503407; p < 0.05. Table 3 also shows each group's beta value (β) and delta beta value (Δβ). Considering the SG as the reference, all the Δβ values from the PM20D1 were negative, indicating that those sites were hypomethylated.
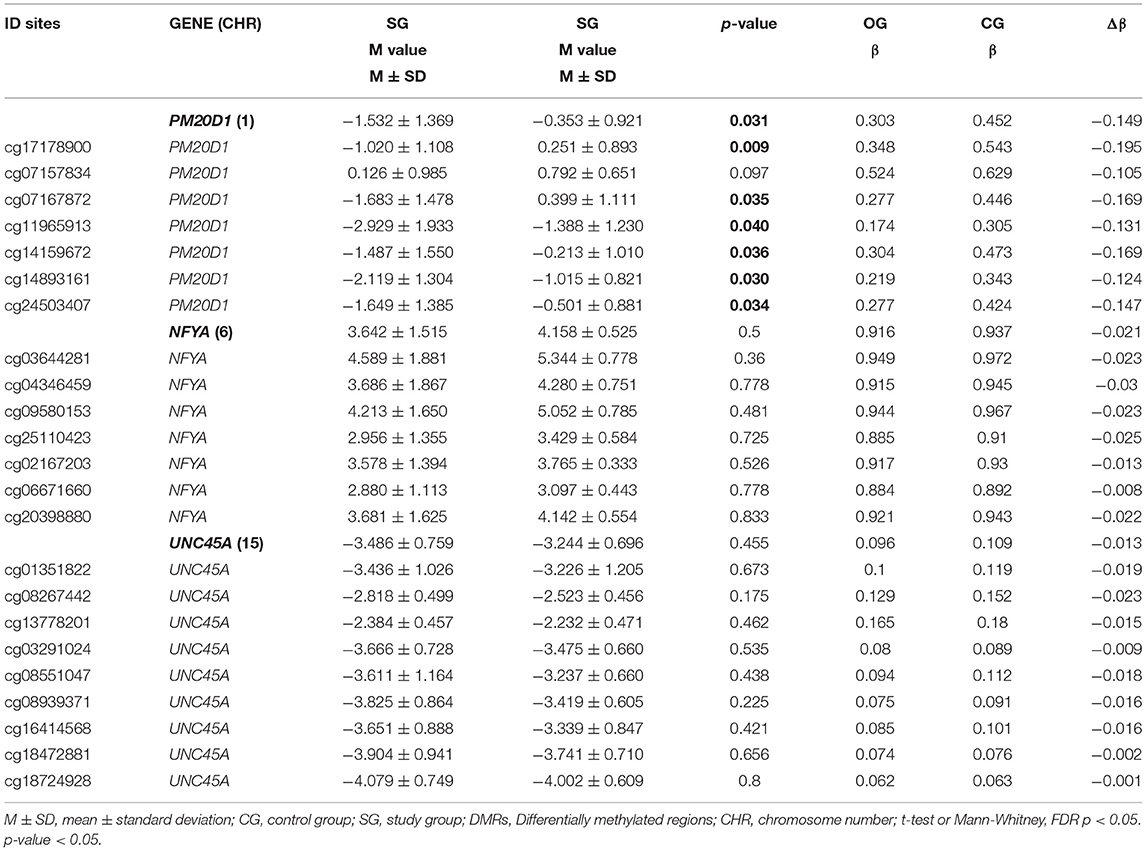
Table 3. M value mean comparison between study group (SG) and control group (CG) for each differentially methylated region (DMR) and its respective CpG sites, individually.
Interestingly, the majority (n = 6) of the CpG sites from the DMR3 (PM20D1 genes) were located before the gene (TSS200, TSS1500, 5'UTR). One CpG was in the first exon, and one site was in the gene body (Figure 4). These associations reinforced that Zn might participate in gene control.
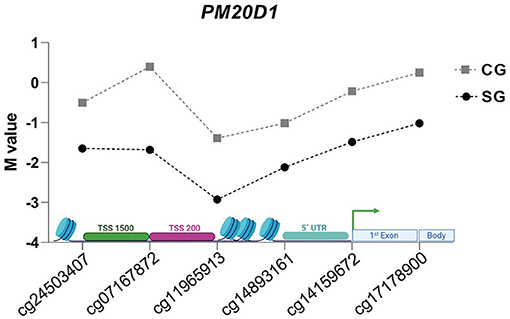
Figure 4. M values of evaluated CpG sites in DMR of PM20D1 gene in SG e CG.
Discussion
The present study reinforced the concept that regulating human gene expression in obesity is a complex mechanism involving several aspects, including diet, genetic, epigenetic, and aging. Figure 5 summarizes the main mechanisms of action found in the present study.
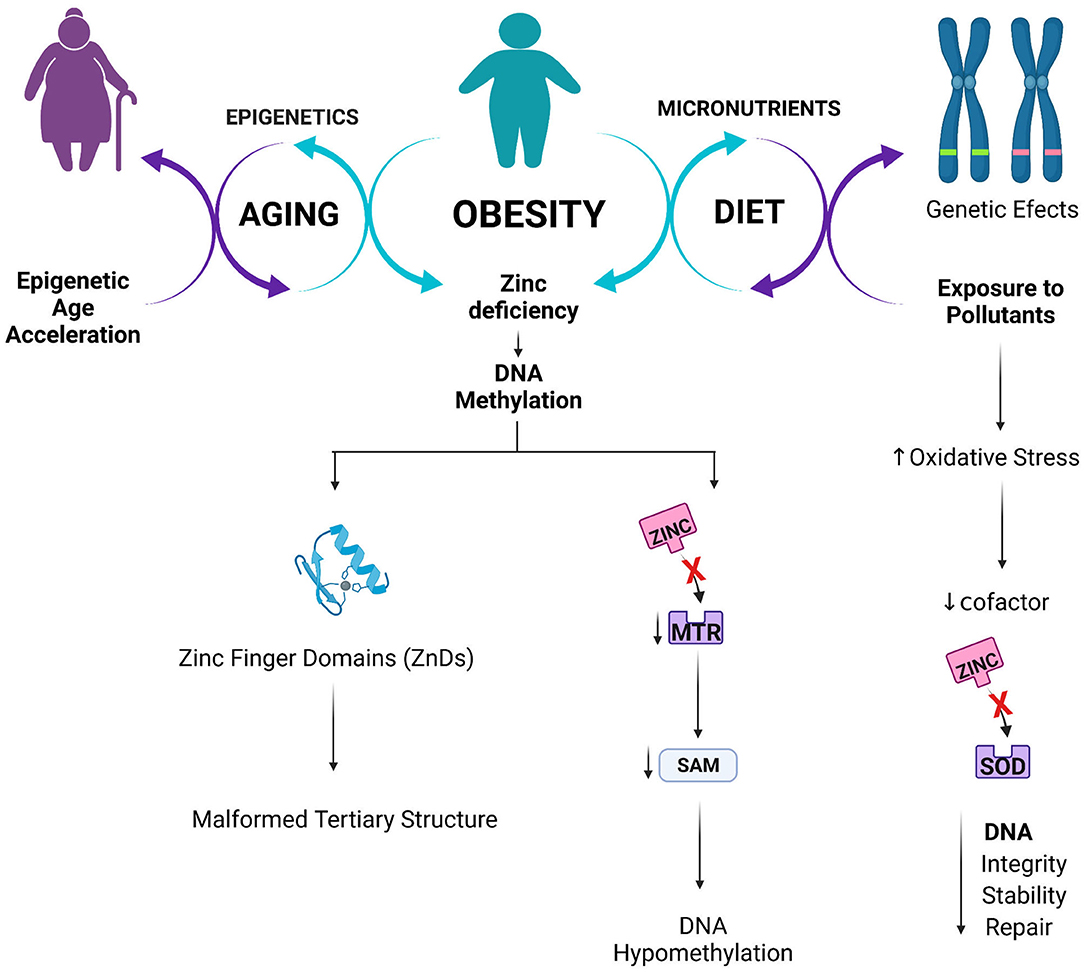
Figure 5. Proposed interlink between Zinc status, epigenetics and obesity.
Our study demonstrated an association between lower levels of Zn and obesity, which corroborated with previous data in the literature (30, 31). A randomized, double-blind clinical trial conducted with subjects with obesity compared the effects of Zn supplementation and placebo. The intervention group presented increased ZnS levels after Zn supplementation and decreased BMI compared to placebo (32). Furthermore, a cross-sectional study with children and adolescents found a negative association between ZnS levels and obesity (33).
Also, our results regarding Zn homeostasis in women with obesity suggested regulation by other mechanisms, besides ingestion, which corroborated with a previous study conducted in adults with dyslipidemia, in which they did not observe a correlation between ZnDI and ZnS levels (34). Several events may be related to lower ZnS levels in patients with obesity, especially modifications in Zn metabolism, including absorption, bioavailability, and urinary excretion (35, 36). Individuals with obesity could also have decreased expression of Zn transporters families, such as the Zrt-, Irt-like protein (ZIP) and the Zn transporter (ZnT), in the cell membrane, decreasing the Zn assimilation and consequently lower ZnS (36).
As observed in the present study, the dysregulation in Zn homeostasis can result in epigenetic alterations (36), reflecting in variations of the EAAR and DMRs and indicating that women with obesity age faster than those without obesity. Moreover, the negative correlation of ZnS with the epigenetic age acceleration residual (EAAR) was observed, suggesting that the higher the ZnS levels, the lower is the aging rate of the individual. Xiao et al. observed a negative correlation between age acceleration and Zn in a study that evaluated important factors for aging and longevity in a Chinese cohort (30).
Both ZnDI and ZnS levels were associated with DMRs in the DNA. Three DMRs were commonly associated with both ZnDI and ZnS levels, although the enrichment analysis indicated that only PM20D1 differed between the SG and CG. A lower β mean value of PM20D1 was detected in the SG compared to the CG, suggesting that SG has a hypomethylated phenotype for this target. The PM20D1 enzyme synthesizes and hydrolyzes (bidirectional activity) the endogenous N-fatty acyl amino acid (NAAs). This protein is found in many tissues and can influence body energy expenditure (31). Indeed, Benson et al. (37) observed a lower percentage of methylated regions at PM20D1 in the presence of rs823080 polymorphism in PM20D1 gene, increasing the expression of the gene and resulting in a lower NAA levels, higher BMI, and higher risk for diabetes mellitus type 2. The PM20D1 gene is also important in regulating the PPARγ. PPARs are ligand-activated transcription factors, and PPARγ regulates fatty acid, glucose, and energy homeostasis (38). Studies have shown that Zn supplementation could increase PPARγ expression (39), since the PPAR-DNA binding seems to occur through ZnDs (16).
In this study, the DMR approach decreases the chance of negative random association compared to single CpG site's high reproducible technique. Furthermore, standardized arrays and bioinformatics analysis can make data more comparable through datasets. Data sharing and adoption of standardized bioinformatic methods are essential for the development of nutrigenomics and nutriepigenetics. Leukocytes are important components in obesity studies and may carry epigenetic marks due to the chronic low-grade inflammatory status (40). The mixed cell types could be considered a limiting factor, but this bias was alleviated by the cell types correction using Houseman's method (21). Previous studies have shown that Zn levels fluctuate widely in line with menstrual cycle (41, 42). However, despite the prevalence of female gender in this study, the Zn status according to the menstrual cycle was a limitation in this cohort. As far as we know, this is the first study that evaluated the association of ZnDI and ZnS levels and human leukocytes epigenome in individuals with obesity.
Conclusion
The present study evidences the influence of Zn in the modulation of DNA methylation patterns. Obesity parameters are related to Zn deficiency and epigenetic age acceleration. Zn-associated DMRs may exert downstream effects on inflammation, macronutrient metabolism, and DNA/cellular process repair. The hypomethylation of the PM20D1 gene could indicate the interconnection between DNA methylation and nutritional status. Thus, we emphasized the importance of monitoring Zn, not only in the serum measurement but also the ingestion during clinical treatments and follow-ups, to avoid Zn deficiency and consequently to decrease the risks for the development of chronic disease.
Data Availability Statement
The datasets presented in this study can be found in online repositories. The names of the repository/repositories and accession number(s) can be found at: Gene Expression Omnibus, GSE193836. https://www.ncbi.nlm.nih.gov/geo/query/acc.cgi?acc=GSE193836.
Ethics Statement
The studies involving human participants were reviewed and approved by Research Ethics Committee of the Ribeirão Preto Medical School University Hospital of University of São Paulo (HCRP-USP) CAAE license: 14275319.7.0000.5440. The patients/participants provided their written informed consent to participate in this study.
Author Contributions
NN and MB conceived and designed the study. CN, MP, and FB provided laboratory support, supervised experiments, and got financial support. NN and MP collected clinical data. NN, MP, LW, VS, DM, and WS performed experiments. GR, NN, MB, VP, and JP performed data analysis. MB, NN, GR, and LW drafted the manuscript. GR curated the data to make it public. All authors participated in the manuscript review and approved the final manuscript.
Funding
Consumables: São Paulo Research Foundation (FAPESP) (#2018/24069-3) and National Council for Scientific and Technological Development (CNPq: #408292/2018-0). Personal funding: (FAPESP: #2014/16740-6 and #2020/08687-9) and Academic Excellence Program from Coordination for higher Education Staff Development (CAPES: 88882.180020/2018-01). Moreover, this work was supported by the São José do Rio Preto Medical School (FAMERP) and the Foundation to Support Teaching, Research and Assistance of the Clinical Hospital, Faculty of Medicine of Ribeirao Preto, University of São Paulo (FAEPA).
Conflict of Interest
The authors declare that the research was conducted in the absence of any commercial or financial relationships that could be construed as a potential conflict of interest.
Publisher's Note
All claims expressed in this article are solely those of the authors and do not necessarily represent those of their affiliated organizations, or those of the publisher, the editors and the reviewers. Any product that may be evaluated in this article, or claim that may be made by its manufacturer, is not guaranteed or endorsed by the publisher.
References
1. Maugeri A, Barchitta M. How dietary factors affect DNA methylation: lesson from epidemiological studies. Medicina. (2020) 56:374. doi: 10.3390/medicina56080374
2. Tian Y, Morris TJ, Webster AP, Yang Z, Beck S, Feber A, et al. ChAMP: updated methylation analysis pipeline for illumina beadchips. Bioinformatics. (2017) 33:3982–4. doi: 10.1093/bioinformatics/btx513
3. Peters Timothy J, Buckley Michael J, Chen Y, Smyth Gordon K, Goodnow Christopher C, Clark Susan J. Calling differentially methylated regions from whole genome bisulphite sequencing with DMRcate. Nucleic Acids Res. (2021) 49:e109. doi: 10.1093/nar/gkab637
4. Fransquet PD, Wrigglesworth J, Woods RL, Ernst ME, Ryan J. The epigenetic clock as a predictor of disease and mortality risk: a systematic review and meta-analysis. Clin Epigenetics. (2019) 11:1–17. doi: 10.1186/s13148-019-0656-7
5. Horvath S. DNA methylation age of human tissues and cell types. Genome Biol. (2013) 14:R115. doi: 10.1186/gb-2013-14-10-r115
6. Marioni RE, Harris SE, Shah S, McRae AF, von Zglinicki T, Martin-Ruiz C, et al. The epigenetic clock and telomere length are independently associated with chronological age and mortality. Int J Epidemiol. (2018) 45:424–32. doi: 10.1093/ije/dyw041
7. Dugué P-A, Bassett JK, Joo JE, Jung C-H, Ming Wong E, Moreno-Betancur M, et al. DNA methylation-based biological aging and cancer risk and survival: pooled analysis of seven prospective studies. Int J Cancer. (2018) 142:1611–9. doi: 10.1002/ijc.31189
8. Sae-Lee C, Corsi S, Barrow TM, Kuhnle GGC, Bollati V, Mathers JC, et al. Dietary intervention modifies DNA methylation age assessed by the epigenetic clock. Mol Nutr Food Res. (2018) 62:e1800092. doi: 10.1002/mnfr.201800092
9. WHO. WHO Fact Sheet: Obesity and Overweight. (2021). Available online at: https://www.who.int/news-room/fact-sheets/detail/obesity-andoverweight (accessed August 10, 2021).
10. Diels S, Vanden Berghe W, Van Hul W. Insights into the multifactorial causation of obesity by integrated genetic and epigenetic analysis. Obes Rev. (2020) 21:e13019. doi: 10.1111/obr.13019
11. Crujeiras AB, Diaz-Lagares A, Sandoval J, Milagro FI, Navas-Carretero S, Carreira MC, et al. DNA methylation map in circulating leukocytes mirrors subcutaneous adipose tissue methylation pattern: a genome-wide analysis from non-obese and obese patients. Sci Rep. (2017) 7:41903. doi: 10.1038/srep41903
12. Wang X, Zhu H, Snieder H, Su S, Munn D, Harshfield G, et al. Obesity related methylation changes in DNA of peripheral blood leukocytes. BMC Med. (2010) 8:87. doi: 10.1186/1741-7015-8-87
13. Costarelli L, Muti E, Malavolta M, Cipriano C, Giacconi R, Tesei S, et al. Distinctive modulation of inflammatory and metabolic parameters in relation to zinc nutritional status in adult overweight/obese subjects. J Nutr Biochem. (2010) 21:432–7. doi: 10.1016/j.jnutbio.2009.02.001
14. Sharif R, Thomas P, Zalewski P, Fenech M. The role of zinc in genomic stability. Mutat Res. (2012) 733:111–21. doi: 10.1016/j.mrfmmm.2011.08.009
15. Hudson NO, Buck-Koehntop BA. Zinc finger readers of methylated DNA. Molecules. (2018) 23:2555. doi: 10.3390/molecules23102555
16. Heidarzadeh Z, Samimi M, Seifati SM, Ashkezari MD, Ahmadi S, Mahmoodi S, et al. The effect of zinc supplementation on expressed levels of peroxisome proliferator-activated receptor gamma and glucose transporter type 1 genes in newborns of women with gestational diabetes mellitus. Biol Trace Elem Res. (2017) 175:271–7. doi: 10.1007/s12011-016-0788-y
17. Association WM. World Medical Association Declaration of Helsinki. ethical principles for medical research involving human subjects. Bull World Health Organ. (2001) 79:373.
18. Centers for Disease Control and Prevention. Assessing Your Weight. (2020). Available online at: https://www.cdc.gov/healthyweight/assessing/index.html (accessed August 20, 2021).
19. Batista BL, Rodrigues JL, Nunes JA, de Oliveira Souza VC, Barbosa F. Exploiting dynamic reaction cell inductively coupled plasma mass spectrometry (DRC-ICP-MS) for sequential determination of trace elements in blood using a dilute-and-shoot procedure. Anal Chim Acta. (2009) 639:13–8. doi: 10.1016/j.aca.2009.03.016
20. Malarvizhi R, Thanamani AS. K-nearest neighbor in missing data imputation. Int J Eng Res Dev. (2012) 5:5–7.
21. Houseman EA, Accomando WP, Koestler DC, Christensen BC, Marsit CJ, Nelson HH, et al. DNA methylation arrays as surrogate measures of cell mixture distribution. BMC Bioinform. (2012) 13:86. doi: 10.1186/1471-2105-13-86
22. Mallik S, Odom GJ, Gao Z, Gomez L, Chen X, Wang L. An evaluation of supervised methods for identifying differentially methylated regions in Illumina methylation arrays. Brief Bioinform. (2019) 20:2224–35. doi: 10.1093/bib/bby085
23. Du P, Zhang X, Huang C-C, Jafari N, Kibbe WA, Hou L, et al. Comparison of Beta-value and M-value methods for quantifying methylation levels by microarray analysis. BMC Bioinform. (2010) 11:587. doi: 10.1186/1471-2105-11-587
24. Szklarczyk D, Gable AL, Lyon D, Junge A, Wyder S, Huerta-Cepas J, et al. STRING v11: protein-protein association networks with increased coverage, supporting functional discovery in genome-wide experimental datasets. Nucleic Acids Res. (2019) 47:D607–13. doi: 10.1093/nar/gky1131
25. Lohman T. Advances in Body Composition Assessment: Current Issues in Exercise Science Series (Monograph 3). Champaign, IL: Human Kinetics Publishers (1992).
26. Centers for Disease Control and Prevention. Manage Blood Sugar. (2021). Available online at: https://www.cdc.gov/diabetes/managing/manage-blood-sugar.html (accessed August 10, 2021).
27. Centers for Disease Control and Prevention. Getting Your Cholesterol Checked. (2020). Available online at: https://www.cdc.gov/cholesterol/cholesterol_screening.htm (accessed August 10, 2021).
29. National Institutes of Health. Zinc: Fact Sheet for Health Professionals. (2021). Available online at: https://ods.od.nih.gov/factsheets/Zinc-HealthProfessional/ (accessed August 10, 2021).
30. Xiao L, Zan G, Feng X, Bao Y, Huang S, Luo X, et al. The associations of multiple metals mixture with accelerated DNA methylation aging. Environ Pollut. (2021) 269:116230. doi: 10.1016/j.envpol.2020.116230
31. Long JZ, Svensson KJ, Bateman LA, Lin H, Kamenecka T, Lokurkar IA, et al. The secreted enzyme PM20D1 regulates lipidated amino acid uncouplers of mitochondria. Cell. (2016) 166:424–35. doi: 10.1016/j.cell.2016.05.071
32. Payahoo L, Ostadrahimi A, Mobasseri M, Khaje Bishak Y, Farrin N, Asghari Jafarabadi M, et al. Effects of zinc supplementation on the anthropometric measurements, lipid profiles and fasting blood glucose in the healthy obese adults. Adv Pharm Bull. (2013) 3:161–5. doi: 10.5681/apb.2013.027
33. Fan Y, Zhang C, Bu J. Relationship between selected serum metallic elements and obesity in children and adolescent in the U.S. Nutrients. (2017) 9:104. doi: 10.3390/nu9020104
34. Knez M, Pantovic A, Zekovic M, Pavlovic Z, Glibetic M, Zec M. Is there a link between zinc intake and status with plasma fatty acid profile and desaturase activities in dyslipidemic subjects? Nutrients. (2019) 12:93. doi: 10.3390/nu12010093
35. Lönnerdal B. Dietary factors influencing zinc absorption. J Nutr. (2000) 130:1378S−83. doi: 10.1093/jn/130.5.1378S
36. Brito S, Lee MG, Bin BH, Lee JS. Zinc and its transporters in epigenetics. Mol Cells. (2020) 43:323–30. doi: 10.14348/molcells.2020.0026
37. Benson KK, Hu W, Weller AH, Bennett AH, Chen ER, Khetarpal SA, et al. Natural human genetic variation determines basal and inducible expression of PM20D1, an obesity-associated gene. Proc Natl Acad Sci U S A. (2019) 116:23232–42. doi: 10.1073/pnas.1913199116
38. Stienstra R, Duval C, Müller M, Kersten S. PPARs, obesity, and inflammation. PPAR Res. (2007) 2007:95974. doi: 10.1155/2007/95974
39. Aryaeian N, Shahram F, Mahmoudi M, Tavakoli H, Yousefi B, Arablou T, et al. The effect of ginger supplementation on some immunity and inflammation intermediate genes expression in patients with active Rheumatoid Arthritis. Gene. (2019) 698:179–85. doi: 10.1016/j.gene.2019.01.048
40. Bell CG. The epigenomic analysis of human obesity. Obesity. (2017) 25:1471–81. doi: 10.1002/oby.21909
41. Michos C, Kalfakakou V, Karkabounas S, Kiortsis D, Evangelou A. Changes in copper and zinc plasma concentrations during the normal menstrual cycle in women. Gynecol Endocrinol. (2010) 26:250–5. doi: 10.3109/09513590903247857
Keywords: zinc deficiency, DNA methylation, age acceleration, epigenetic markers, PM20D1
Citation: Noronha NY, Barato M, Sae-Lee C, Pinhel MAdS, Watanabe LM, Pereira VAB, Rodrigues GdS, Morais DA, de Sousa WT Jr, Souza VCdO, Plaça JR, Salgado W Jr, Barbosa F Jr, Plösch T and Nonino CB (2022) Novel Zinc-Related Differentially Methylated Regions in Leukocytes of Women With and Without Obesity. Front. Nutr. 9:785281. doi: 10.3389/fnut.2022.785281
Received: 29 September 2021; Accepted: 02 February 2022;
Published: 07 March 2022.
Edited by:
Emma L. Beckett, The University of Newcastle, AustraliaReviewed by:
Melita Vidakovic, University of Belgrade, SerbiaNicholas R. Harvey, King's College London, United Kingdom
Copyright © 2022 Noronha, Barato, Sae-Lee, Pinhel, Watanabe, Pereira, Rodrigues, Morais, de Sousa, Souza, Plaça, Salgado, Barbosa, Plösch and Nonino. This is an open-access article distributed under the terms of the Creative Commons Attribution License (CC BY). The use, distribution or reproduction in other forums is permitted, provided the original author(s) and the copyright owner(s) are credited and that the original publication in this journal is cited, in accordance with accepted academic practice. No use, distribution or reproduction is permitted which does not comply with these terms.
*Correspondence: Carla Barbosa Nonino, Y2FybGFAZm1ycC51c3AuYnI=
†These authors share first authorship